Unbound Close Stellar Encounters in the Solar Neighborhood
Abstract
We present a catalog of unbound stellar pairs, within 100 pc of the Sun, that are undergoing close, hyperbolic, encounters. The data are drawn from the GAIA EDR3 catalogue, and the limiting factors are errors in the radial distance and unknown velocities along the line of sight. Such stellar pairs have been suggested (Hansen & Zuckerman, 2021) to be possible events associated with the migration of technological civilisations between stars. As such, this sample may represent a finite set of targets for a SETI search based on this hypothesis.
Our catalog contains a total of 132 close passage events, featuring stars from across the entire main sequence, with 16 pairs featuring at least one main sequence star of spectral type between K1 and F3. Many of these stars are also in binaries, so that we isolate eight single stars as the most likely candidates to search for an ongoing migration event – HD 87978, HD 92577, HD 50669, HD 44006, HD 80790, LSPM J2126+5338, LSPM J0646+1829 and HD 192486. Amongst host stars of known planets, the stars GJ 433 and HR 858 are the best candidates.
1 Introduction
The accelerating pace of discovery of planets around other stars, including now the discovery of potentially habitable planets, has brought into clear focus the question of how frequently intelligent, technologically advanced, civilizations occur in the Galaxy. Searches for signatures of extraterrestrial technology have a long history (Tarter, 2001), but suffer from an enormous needle-in-the-haystack problem, in that our capacity to search stars at a deep enough level is limited to a very small subset of the available stars (Tarter et al., 2010; Wright et al., 2018a).
Recently, we (Hansen & Zuckerman, 2021) – hereafter HZ21 – discussed the possibility that interstellar migration could be most efficiently pursued during those brief episodes when unbound stars pass close to one another. The energy costs of interstellar migration are prohibitive most of the time, but can be substantially reduced during such encounters. Such considerations may become particularly important for civilizations whose host stars are beginning to leave the main sequence. Close encounters typically occur at intervals of a few tens of million years (depending on exactly how close one wishes to get) and remain optimal for a few thousand years. If a civilization were to avail itself of such an opportunity, then the presence of two unbound stars in close proximity might serve as a signpost for a substantial enhancement in technological activity. A search for SETI signatures might then have greater chance of success if directed towards such a sample.
The traditional approach of searching for extraterrestrial technology is to search in the radio, optical or infrared bands for evidence of narrow-band signals characteristic of technological sophistication. A fundamental issue in searches of this kind is the one of target selection, as the parameter space of potential sources is enormous (Wright et al., 2018b). Most searches are either broad in terms of source selection, such as Howard et al. (2004); Isaacson et al. (2017); Enriquez et al. (2017); Tellis & Marcy (2017); Maire et al. (2019); Price et al. (2020), or focussed on systems known to host exoplanets (Siemion et al., 2013; Margot et al., 2018; Harp et al., 2016). The proposal in HZ21 is based on a specific hypothesis and thus defines a much smaller, focussed, sample than other studies. A search for technosignatures in these systems may also require some differences in search strategy, as traditional SETI searches assume a source located on a planet, orbiting a star. In the case of a large-scale migration, and with sufficient angular resolution, sources may also be found to be localised between the stars in question, and not solely in orbit around one star or the other.
Stellar interactions may also produce signals of astronomical interest even in the absence of technological effects. The idea that close stellar passages sculpt the Oort cloud was an integral part of the original model of this population (Oort, 1950; Hills, 1981). Although the tidal field of the galaxy is now held to be of greater importance in determining the properties of the Oort cloud (Heisler & Tremaine, 1986), close stellar interactions are believed to be responsible for temporary enhancements in the rate of influx of comets into the Solar system, so-called ‘comet showers’ (Hut et al., 1987; Fernandez & Ip, 1987; Weissman, 1996; Dybczyński, 2002).
In this paper we therefore seek to identify pairs of stars that meet the criterion of being in close physical proximity, but which are gravitationally unbound. These may serve as a possible target list for a SETI search – one with the particular motivating hypothesis laid out in HZ21. To do this, we draw on the results of the GAIA satellite, which has provided a detailed map of parallaxes and proper motions for nearby stars. We search for pairs of stars that have a finite probability of passing within AU of one another – either in the recent past or near future. This threshold is chosen to be such that these events are sufficiently uncommon (only G stars will be involved in such an encounter at any one time) to justify the hypothesis in HZ21 that migration is limited to rare events. In section 2 we describe the selection of a sample of stellar pairs that satisfy the above criterion, and which lie within 100 pc of the Sun. The accuracy of our stellar matches decreases with distances and we choose the threshold of 100 pc to be large enough to yield a sample of reasonable size while mitigating the uncertainties. In section 3 we discuss possible technological and astrophysical signatures associated with these events.
2 Close but unbound pairs
The GAIA Early Data Release 3 – EDR3 –(Gaia Collaboration et al., 2016, 2021a; Lindegren et al., 2020), provides parallaxes and proper motions for several billion stars surrounding the Sun. With distances, relative angular separations, and relative velocities, we may try to project the encounter histories of pairs of stars into the near future and recent past, to estimate how close they have/will come. Several studies have investigated the sample of wide binaries identifiable in the GAIA data (Hartman & Lépine, 2020; Gaia Collaboration et al., 2021c; El-Badry et al., 2021). Our interest is in the systems these analyses reject, in that we wish to identify systems that are in close physical proximity but which are not gravitationally bound to one another.
Our first cut is to select all pairs of stars which have parallaxes whose naive conversion to distance places the radial distances within 0.5 pc of one another, and whose projected separations on the sky lie within AU, where we use the closest of the two parallaxes to convert angular separation into distance. This procedure is dictated by the fact that the uncertainty in the radial distance is greater than the uncertainties in the angular separation. We adopt this relatively loose cut to define a sample that we will refine further below. We will also restrict our sample to those stars within 100 pc of the Sun. This is also dictated by the increase in error in the radial separation as the distance increases. Finally, we use the GAIA astrometric error cut astrometric_sigma5d_max to remove those sources with potentially problematic astrometry. Additional cuts based on photometric precision can produce cleaner stellar samples (e.g. Gaia Collaboration et al. (2018)), but we want our initial selection to err on the side of inclusion, because our final candidate sample will be subject to additional quantitative vetting.
This first cut identifies stars that are currently in close physical proximity. Many of these will be genuine bound binaries. The GAIA catalogue also provides proper motions, which can be converted into velocities. At the separations of interest, the orbital velocity of stellar mass binaries is much less the expected magnitude of relative velocities of unbound disk stars, so we expect that genuinely bound objects should exhibit common proper motions to a level that distinguishes them from unbound pairs. The quantification of proper motion errors has its own uncertainties, but these are small enough that one can identify binary samples of high fidelity (El-Badry et al., 2021).
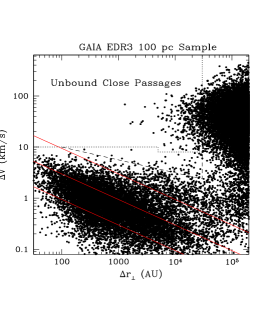
Figure 1 shows the how the relative velocity of stars varies with their relative separation from their nearest neighbours on the sky. We plot relative velocity versus separation on the sky for all pairs whose distances are within 0.5 pc of each other and whose projected sky-plane separations are AU. As noted by prior authors, GAIA proper motions effectively separate binaries (towards the lower left of the diagram) from the unbound pairs (towards the upper right of the diagram). The three solid red lines indicate the escape velocity from the corresponding orbital separation, for binaries of total mass , and , from bottom to top. The projected separation shown here is less than, or equal to, the true separation of the corresponding binary and so systems that lie below these curves have relative velocities consistent with orbital motion of bound pairs. The sample to the upper right represents the pairs of stars that are moving too fast to be gravitationally bound to one another. This group has a small tail to low projected separations, and it is in this group that we are interested.
There is also a substantial population of stars that lie above the uppermost red line. Although these appear to be contiguous to the bound sample, their interpretation would require system masses well in excess of . Although this is technically possible, their frequency is unrealistic within our understanding of stellar demographics and lifetimes. We have thus investigated this population in more detail. In particular, we determine that the bulk of these pairs have relative motions that are contaminated by orbital motions of an unresolved binary in at least one member of the pair. To support this, we downloaded, for each star, the GAIA ruwe (renormalised unit weight error) parameter, which measures the excess astrometric noise remaining after the astrometric fit of the position and motion of the source in question. A value of ruwe is considered to be an indicator of unmodelled astrometric noise and a signature of a partially resolved binary. For the sources that lie between the dashed and dotted lines in Figure 1, we find that 56/67 (84%) of these sources have ruwe. We conclude that the bulk of the points at the upper edge of the bound sample are hierarchical triples (at least), in which the orbital motion of an unresolved binary has resulted in a biased measurement of the relative motion of the wider pair. We therefore adopt a criterion given by the dotted line in Figure 1. Our initial sample includes pairs where AU and km s-1, but with a higher threshold of km s-1 interior to AU. This is to exclude the two extreme systems featuring HD 1917 and HD 214165, both of which have km s-1 but ruwe. Ultimately this leaves us with an initial sample of 446 stellar pairs.

The third, radial, component of the separation is the one with the largest error, even with the unprecedented accuracy of the GAIA parallaxes. Furthermore, the systematic errors in the astrometry can vary depending on how crowded the field is. The angular separations of the pairs considered here can extend to , and so we adopt the corrected distances from Bailer-Jones et al. (2021) to ensure a uniform treatment for our entire sample. Bailer-Jones et al. (2021) provide improved distance estimates to GAIA sources using two methods. The geometric method adopts a prior distribution based on the Galactic distribution of stars in that direction, while the photogeometric estimate includes information from the photometry of the stars in question, and their expected position in the color-magnitude diagram. We therefore calculate the probability distribution of true separations for our stellar pairs using the photogeometric distance distributions from Bailer-Jones et al. Figure 2 shows the difference between the revised distances and the naive, parallax-based distance , where is the parallax in units of milliarcseconds. While the difference is well within the errors for many systems, there is also a notable fraction for which the correction is important.
In order to determine the true distance of closest approach in each encounter, we need to specify the one remaining component – the relative radial velocity. While GAIA does provide radial velocities for a subset of stars, most of the ones in question here are not part of that sample. To determine the radial velocities, we sample the radial velocities contained in the Galactic model used by Bailer-Jones et al. (2021) to determine the distance probabilities. This model is described in Rybizki et al. (2020), and we query the resulting mock catalog for each pair. For each object, we draw all radial velocities for stars with of the position to determine the radial velocity distribution. We also restrict our query to model stars within magnitudes of the object. If two members of a pair have significantly different magnitudes, they may then have slightly different line-of-sight velocity dispersions, but there are no cases with large discrepancies. For each choice of radial velocity, we then project a straight-line trajectory forwards and backwards in time and isolate the distance and time of closest approach. The encounters we consider here are significantly hyperbolic and so deviations from straight trajectories are negligible. For each pair, we evaluate trajectories, sampling the relative distance and relative velocity distributions determined above. Our interest is in those systems which pass the closest, as these will be the ones that would facilitate interstellar migration. To score the relative attractiveness of each system, we use two metrics. In the first, we count the number of trajectories that result in a passage closer than AU and quantify the fraction of all resulting trajectories that pass within this distance. A second metric is to use the average , where is the minimum approach distance for each trajectory, and the average is performed over all trial trajectories. The rationale for this metric is that we want to select those systems that require the least energy expenditure per unit mass for a transfer between the stars. A smaller will require a smaller velocity to cross it in a finite time, so that we anticipate the energy will scale . To favor the minimum energy, we therefore seek to maximize the average of over all our trajectories.
For inclusion in our sample, we require or (where is normalised to AU). We have 115 pairs which satisfy both criteria, 13 which satisfy the first only and 9 which satisfy the latter only. Taking these together, our final sample contains 137 of the original 446 pairs. We also find that 30 of these pairs involve at least one star that has a possible bound companion in the GAIA sample. In some cases we find that both members of the binary are counted independently as having an encounter with the third star. After accounting for these duplications, we find 132 independent encounters, 28 of which involve multiple stars. Of these, four encounters feature pairs in which both members have proper motion companions.
We have also examined the ruwe parameter for the 269 individual stars involved in the systems of our final sample, and find that 38 of them exhibit a value , suggesting that about 14% of our stellar sample contains partially resolved binary stars. This is a representative value for the stellar population as a whole, and reinforces our conclusion – in Figure 2 – that the upper envelope of the bound population is composed primarily of hierarchical triples, because of the much higher fraction with ruwe.
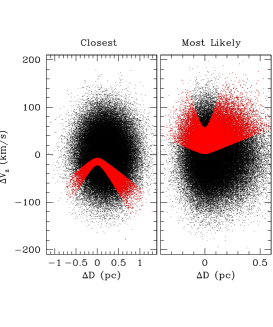
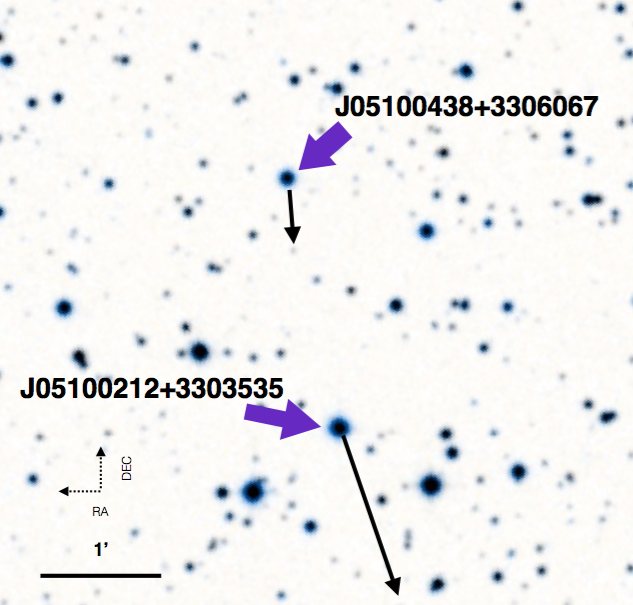
Figure 3 illustrates the process by which we estimate the metrics and . We show two examples. On the left, we show the case of the closest passage found in our sample – between the pair of stars 2MASS J07315294+0633251 and 2MASS J07321651+0628319. The proper motions and astrometric separations are also sampled with their assumed errors, although their uncertainties have a small effect compared to the radial distance uncertainty. The right panel shows the case where we find the largest probability of an encounter within AU, namely the pair 2MASS J05100438+3306067 and 2MASS J05100212+3303535. The reason for the higher probability can be seen from the dimensions of the x-axis – the estimated distances for these two stars are much closer to one another than most of the other stars in the sample (their mean distances are only 0.07 pc discrepant).
2.1 Encounters involving Sun-like Stars
We are particularly interested in close passages featuring Sun-like stars, as the motivation for this sample is to identify cases where Earth-analogue technological civilizations might attempt to migrate to another star. Therefore, Table 1 collects the information for that subset of the full sample of 132 encounters which feature at least one star with , where is the absolute magnitude in the broad GAIA passband G. The spectral classifications (taken from the literature) for the resulting stars range from K1–F3, and so these represent an approximately Sun-like sample. The color represents the color obtained by integrating the GAIA low resolution blue and red prism spectra. Distances are the photogeometric distances from Bailer-Jones et al. (2021). The time of closest approach is relative to today – positive values mean that the closest approach will occur in the future, while negative values indicate it already occurred. Co-ordinates for the brighter member of each pair are given in the finding charts in the Appendix.
| Index | Name (Type) | Index | Name (Type) | Notes | |||||||||||||
|---|---|---|---|---|---|---|---|---|---|---|---|---|---|---|---|---|---|
| (AU) | (yrs) | (pc) | (km s-1) | (pc) | (km s-1) | ||||||||||||
| 1 | 1367 | +1750 | 0.05 | 0.03 | 0.55 | HD 157393 (F8) | 59.43 | 3.74(2) | 0.65 | -21.9(4) | LSPM J1722+1513 | 59.15 | 10.73(1) | 2.70 | (1,4) | ||
| 2 | 1413 | -153 | 0.02 | 0.02 | 0.20 | HD 159902 (G5V) | 49.55 | 4.81(2) | 0.82 | +5.4(4) | CD-45 11747 | 49.11 | 5.95(1) | 1.07 | -32.0(5) | (1,2,4) | |
| 3 | 2032 | -4194 | 0.14 | 0.02 | 1.07 | HD 187154 (G1V) | 44.98 | 4.38(1) | 0.78 | -32.3(2) | HD 187084 (K1V) | 45.27 | 5.64(1) | 1.01 | +9.5(2) | (1) | |
| 4 | 2957 | + 15250 | 0.15 | 0.20 | 0.63 | HD 87978 (G6IV) | 40.84 | 4.92(1) | 0.84 | 28.7(2) | J10090601-1109290 | 40.60 | 13.5(1) | 4.12 | (5) | ||
| 5 | 3193 | +1600 | 0.01 | 0.03 | 0.08 | HD 92577 (F2V) | 3.14(2) | 0.51 | -8.9(6) | J10411261-1418509 | 12.09(4) | 3.06 | |||||
| 6 | 3849 | +3000 | 0.12 | 0.55 | TYC 5786-123-1 | 5.89(1) | 1.14 | +29.0(7) | J21335912-0746358 | 12.59(3) | 3.36 | (4,6) | |||||
| 7 | 6341 | +10152 | 0.10 | 0.14 | 0.28 | HD 143332 (F5V) | 99.07 | 2.88(2) | 0.70 | -29.8(2) | J16000455-0712125 | 99.95 | 11.23(4) | 2.97 | (1) | ||
| 8 | 6374 | +3994 | 0.10 | 0.09 | 0.28 | HD 26770 (G0V) | 64.11 | 3.99(1) | 0.70 | +17.3(6) | J04132532-2830440 | 63.90 | 11.96(1) | 3.12 | (2) | ||
| 9 | 6402 | -151 | 0.06 | 0.07 | 0.19 | HD 50669 (G8IV) | 94.17 | 3.87(1) | 0.86 | +73.0(4) | J06540919-0148118 | 93.86 | 10.94(2) | 2.48 | |||
| 10 | 6739 | +2538 | 0.07 | 0.20 | HD 44006 (G0V) | 3.93(1) | 0.69 | J06191745-0020445 | 8.71(3) | 2.26 | (5) | ||||||
| 11 | 7819 | -357 | 0.06 | 0.05 | 0.33 | HD 210974A/B (K0V) | 85.80 | 5.90(1) | 1.01 | -52.3(3) | UCAC2 18317515 | 85.75 | 7.47(1) | 1.72 | -13.7(4) | (2) | |
| 12 | 8774 | -6456 | 0.10 | 0.16 | 0.29 | HD 80790 (F6V) | 54.68 | 3.25(1) | 0.69 | -19.4(2) | J09191695-5901597 | 54.92 | 11.08(2) | 2.83 | (7) | ||
| 13 | 8832 | +1195 | 0.07 | 0.05 | 0.37 | LSPM J2126+5338 | 53.48 | 5.97(1) | 1.10 | -15.1(46) | J21265700+5343001 | 53.50 | 11.28(1) | 3.01 | (3) | ||
| 14 | 9831 | -649 | 0.006 | 0.14 | LSPM J0646+1829 | 86.05 | 5.83(1) | 1.03 | +75.2(8) | J06464503+1828391 | 86.13 | 11.37(2) | 2.88 | ||||
| 15 | 13033 | +1250 | 0 | 0 | 0.37 | HD 29836 (GV) | 42.22 | 3.84(1) | 0.83 | 13,3(1) | LP 415-358 | 42.04 | 12.32(1) | 3.10 | (2) | ||
| 16 | 26072 | +850 | 0 | 0 | 0.13 | HD 192486 (F2V) | 43.94 | 3.24(1) | 0.53 | -8.9(2) | HD 192527(G5V) | 44.02 | 5.07(1) | 0.86 | -8.8(2) |
Note. — (1) Proper motion anomaly between HIPPARCOS and GAIA DR2 suggests binarity for the brighter member of this pair; (2) The brighter of the two members of this encounter has a proper motion companion; (3) The fainter of the two members of this encounter has a proper motion companion; (4) The brighter of the two members of this encounter shows excess astrometric noise (5) The fainter of the two members of this encounter shows excess astrometric noise (6) Both members of this encounter have proper motion companions; (7) Identified as a binary in the literature;
There are also radial velocities available for many of the brighter stars in this sample, and these are listed in Table 1. Of the 16 pairs in Table 1, 15 have at least one radial velocity available, and four pairs have known radial velocities for both members. The radial velocities are drawn from the GAIA EDR3 data, except for those for HD 92577 and HD 26770, which are drawn from Gontcharov (2006). In no case do we mix velocities from different references, and so we do not have to consider the possibilities of differences in offsets or definition. Using this additional information we have calculated a second probability of encounter for these objects (Prv, as opposed to the probability Pμ, which is based purely on the measured proper motion). In the cases where both radial velocities are known, we do not need to assume any distribution for line-of-sight velocities, but simply repeat our integration of trajectories using the known relative velocity and sampling only within the quoted errors. In cases where the radial velocity is known for only one member, we sample the distribution of radial velocities for the other star, using the mock catalog of Rybizki et al. (2020) as described earlier. In general terms, the inclusion of this extra information lowers the probabilities of close encounter. In fact, after including the radial velocities, 2/16 of our systems drop below the 1 per cent probability threshold. The product indicates that there is a 37 per cent chance that none of these 16 systems have a close passage within AU, or that there is a 63 per cent chance that at least one system does. More detailed examination of the combinatorics indicates that there is a 39 per cent chance of one system passing close enough, an 18 per cent chance that two pass close enough, and a 6 per cent chance that more than 2 of these systems will pass within AU of each other.
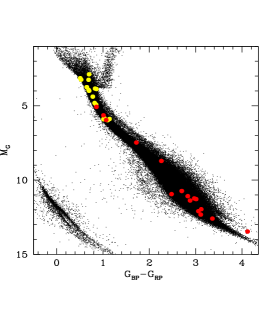
Figure 4 shows the photometry for these 16 pairs in Table 1. The photometry for the brighter (yellow) and fainter (red) members of these pairs are compared to that of the field sample within 100 pc. As expected, the encounters are primarily with lower mass stars, although there are a few pairs featuring similar stars.
Another important element of the HZ21 argument is that close stellar encounters represent the best chance for migration in the case of technological civilizations that orbit single stars. If the planet orbits a star in a multiple system, then the bound companions are much easier targets and more likely to be long-lived, given the stellar demographics. To that end, it is important to constrain the binarity of the bright stars in our sample.
Indeed, four of the systems in Table 1 feature a bright star which has a high probability proper motion companion in the GAIA EDR3 database. In cases where our search independently flagged encounters with different members of binaries, we report only the encounter featuring the brightest star (so that each overall encounter between bound systems is counted only once). Furthermore, four stars also show a proper motion anomaly between the measurements of HIPPARCOS and GAIA DR2 (Kervella et al., 2019), which is taken to be a signature of binarity as well. Finally, one more system is identified as a binary in the literature (Tokovinin, 2014). Six of the stars in this sample also have ruwe , which may also indicate binarity. Overall, 8/16 of the bright stars in this sample show evidence for binarity. Furthermore, this census is likely to undercount companions, as our constraints are primarily for wide binary members and closer companions may still remain undetected.
2.2 The lower mass sample
We have compiled the rest of the likely close encounters (those that feature no stars with ) in Table 2. In this table we calculated only the probability of encounter on the basis of proper motions (Pμ) as radial velocities are not available for most of the stars in the lower mass sample. This leaves us with 116 encounters, to go with the 16 in the bright star sample.
With this sample we can also examine the overall demographics of the stars involved in these close encounters. The mass distribution of the stellar population from Tables 1 and 2 is shown in Figure 5. Stellar masses are based on the position of each star in the GAIA magnitude system, and a comparison with the MESA models (Choi et al., 2016). Seven of the pairs contain a white dwarf member. The result, as expected, is strongly peaked between –0.2, and appears quite consistent with a random sampling of the field stellar mass function.
With the larger number of systems, here, the probability that none will pass with AU is negligibly small (). A perhaps more practical logistics question is to explore how many of these systems need one explore to have a realistic chance of seeing a passage within AU. If we calculate probabilities in Table 2 starting from the first entry, we need only go to the twentieth entry to have a 50% chance of two or more close passages. This is consistent with the order of magnitude estimate that about 1 in 10 of the systems in Tables 1 and 2 are expected to actually pass within AU of each other. How does this compare to our expectations? If we adopt the local stellar encounter rate calculation in the Solar neighbourhood as estimated in HZ21, using a local stellar density and assuming the dispersion in relative velocities is , where is the local average velocity dispersion in the Galactic disk, we estimate the rate of encounter, per star, is
| (1) |
If we estimate time of encounter to be years, then we estimate ongoing encounters within the volume of 100 pc of the Sun. This suggests our sample contains a significant fraction of the close encounters happening in this volume.
Figure 6 shows the distribution of distances from the Sun shown by the cumulative sample in Tables 1 and 2. We see that the bulk of our targets lie at distances farther than the samples (Isaacson et al., 2017) used by the stellar surveys of Project Phoenix (65 pc) and Breakthrough Listen (5 pc –complete, and 50 pc –representative). The distribution of the sample with distance scales approximately with the enclosed volume out to our distance limit of 100 pc. This is consistent with estimates of GAIA EDR3 completeness (Fabricius et al., 2021; Gaia Collaboration et al., 2021b, d) , which suggest that the survey is highly complete between the magnitude limits , albeit with some degredation in crowded regions of the sky. Our use of a Galactic model to refine our distances helps to mitigate the dangers of crowded regions and none of the stars in our sample are bright enough to saturate the GAIA photometry. Furthermore, the separations of interest to us are much larger than the angular scales at which GAIA blends the images of neighbouring stars – see Figure 2.
| Name (Type) | MG | B-R | Name | MG | B-R | Prob | Notes | |||||
|---|---|---|---|---|---|---|---|---|---|---|---|---|
| 2MASS | (pc) | 2MASS | (pc) | (AU) | (yrs) | |||||||
| J07315294+0633251 | 56.46 | 9.58(1) | 2.46 | J07321651+0628319 | 56.28 | 11.74(4) | 3.29 | 22 | +10050 | 0.17 | 13.2 | |
| J22314220+0023112 | 96.06 | 10.24(2) | 2.65 | J22313478+0027179 | 96.55 | 12.97(9) | 3.18 | 118 | -3701 | 0.03 | 2.73 | [/M4V] |
| J01024057+1610560 | 93.38 | 10.03(2) | 2.43 | J01023204+1612129 | 92.92 | 10.76(3) | 2.72 | 171 | -4601 | 0.10 | 6.09 | |
| G1 | 55.29 | 14.87(5) | 1.01 | TYC 1568-917-1 | 54.88 | 7.62(1) | 1.65 | 381 | +2593 | 0.09 | 3.35 | |
| S1 | 45.54 | 14.84(3) | 0.93 | J00352199+2006142 | 45.45 | 11.88(1) | 3.04 | 398 | -2698 | 0.14 | 5.20 | (bin-1) |
| J19200086-2241531 | 94.27 | 10.68(2) | -0.24 | J19195587-2242109 | 92.92 | 11.42(3) | 2.91 | 451 | +950 | 0.09 | 3.11 | (bin-1) |
| J07084492+5544576 | 97.31 | 10.26(4) | 2.48 | J07085805+5545261 | 96.95 | 12.85(7) | 3.41 | 498 | -2950 | 0.04 | 1.22 | |
| GD 84 | 35.45 | 12.41(1) | 0.103 | LP 162-1 | 35.33 | 10.62(1) | 2.85 | 522 | +4034 | 0.20 | 5.76 | (1),[WD/M4] |
| J19545686-6724041 | 57.15 | 9.06(4) | 2.29 | J19544917-6719559 | 56.91 | 8.82(3) | 2.12 | 587 | +1148 | 0.04 | 0.95 | (2),(bin-1) |
| J06433851-6417204 | 10.76(6) | 2.97 | J06434304-6417291 | 9.85(1) | 2.47 | 637 | -845 | 0.04 | 1.00 | |||
| J06363407+0806450 | 40.85 | 13.08(1) | 3.50 | J06364675+0808373 | 40.60 | 11.48(1) | 2.58 | 662 | -1897 | 0.12 | 2.72 | |
| J10520964-0548506 | 91.19 | 11.91(4) | 3.11 | J10515946-0549049 | 90.87 | 10.65(3) | 2.72 | 738 | +898 | 0.02 | 0.17 | |
| J09051507-2342573 | 11.85(2) | 3.13 | J09051785-2341229 | 8.41(6) | 1.97 | 810 | +744 | 0.03 | 0.49 | |||
| J08245980-1745049 | 89.29 | 12.18(3) | 2.52 | J08244862-1741209 | 88.65 | 12.50(4) | 3.15 | 976 | -3892 | 0.04 | 0.60 | (bin-1) |
| J05295170-3006557 | 98.46 | 12.07(3) | 3.24 | J05295196-3003595 | 98.31 | 12.39(3) | 3.35 | 1048 | -2951 | 0.07 | 1.10 | |
| J04590411+3804240 | 77.42 | 13.40(6) | 3.58 | J04592452+3801272 | 76.95 | 11.17(2) | 2.65 | 1074 | +2902 | 0.05 | 0.66 | (bin-2) |
| J08483006-0745120 | 81.70 | 11.64(2) | 3.10 | J08482010-0747371 | 81.65 | 7.51(1) | 1.67 | 1110 | -5652 | 0.20 | 2.23 | |
| J05381466+3056067 | 75.01 | 12.39(4) | 3.50 | J05380946+3055453 | 74.63 | 8.65(1) | 2.02 | 1196 | -1298 | 0.12 | 1.57 | |
| J06300702+7343471 | 98.73 | 13.9(1) | 3.60 | J06302012+7342514 | 97.79 | 9.52(3) | 2.32 | 1215 | -4745 | 0.04 | 0.51 | |
| TYC 5133-940-1 | 94.13 | 6.27(1) | 1.22 | J19134957-0217557 | 94.04 | 11.89(3) | 3.24 | 1272 | +4398 | 0.20 | 0.38 | (bin-1) |
Note. — (1) GD 84 is referenced in papers about low mass companions (2) These sources are in a very confused region in DSS/2MASS. G1=Gaia DR2 4522020089271002496; S1=SDSS J003542.03+200938.4 This table shows the first twenty entries. The full table is available in machine readable format online.


2.3 Notes on Individual Systems
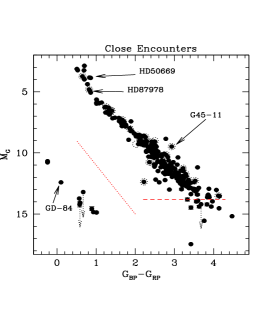
The 132 encounters identified here involve a variety of stellar systems. Figure 7 shows the GAIA bandpass colour-magnitude diagram for the complete set. A few notable systems are
-
•
HD87978 is classified as G6IV and so should be starting to leave the main sequence, and therefore is the perfect archetype of the rationale in HZ21 for a system in which a civilisation might be motivated to make an attempt at interstellar migration. It is also the system in Table 1 with the highest probability of an encounter within AU. One potentially complicating factor is that the star with which it is having an encounter appears to show evidence for astrometric noise and so may be a partially resolved binary. How this influences its suitability as a migration destination will depend on the actual parameters of the system.
-
•
The star HD50669 is classified as G8IV and does indeed lie slightly to the red of the upper main sequence. This star is also starting to leave the main sequence. This system also shows no sign of binarity. Unfortunately, given the uncertainties in distances, it has only a 3 per cent chance of actually passing within AU.
-
•
A comparison of the sample in Table 1 with the NASA Exoplanet Archive (Akeson et al., 2013) shows no known exoplanets around these stars. One star – HD143332 – is included in the Lick-Carnegie Radial velocity sample (Butler et al., 2017), but has no reported planet. It does show a non-zero acceleration term, however. None of the sample is recorded in the archives of the HARPS survey (Trifonov et al., 2020) or the California Legacy Survey (Rosenthal et al., 2021). This paucity is not entirely surprising, as the radial velocity searches are strongly weighted towards nearby stars, and most of the stars in this sample are too distant to be well represented.
-
•
On the lower main sequence, the star G45-11 lies above the main sequence, but is also a known spectroscopic binary and certainly lies in the correct location for a binary unresolved by the GAIA photometry. As the lower mass member of an encounter featuring a K4V star (HIP 53175) this may still be a viable candidate for a migration event, if a planetary system formed around the higher mass star. Four stars lie above the lower main sequence in Figure 7 – three are suspected binaries. The fourth (2MASS J13344645-5959405) lies in a region of the sky where source confusion is a significant concern.
-
•
The stars to the left of the diagonal dotted line in Figure 7 are likely to be white dwarfs. These are less likely to be viable candidates for a migration because they do not offer a long-term stable habitable environment. However, none of the white dwarfs identified here are in encounters with G stars in Table 1. They are all undergoing encounters with M stars, so could potentially be the starting points for migration from civilisations that have survived the ravages of stellar evolution.
-
•
One white dwarf system of note is that of GD-84, identified as a candidate wide binary system by Farihi et al. (2005) but only tentatively, because the proper motion measurement was compromised by confusion with a background star. The GAIA proper motion is now able to rule this out as a bound companion. However, the original candidate companion is not the other star in this candidate encounter. We show a finding chart for this field in the Appendix.
-
•
The horizontal dashed line in Figure 7 indicates the approximate location of the base of the Hydrogen burning sequence (this shows the for a solar metallicity star of age 4 Gyr). Objects fainter than this are candidate brown dwarfs and also not the optimal targets for migration because of their slowly decreasing luminosities. None of the encounters with Sun-like stars (Table 1) feature brown dwarf candidates. Some of these candidates (and a couple of white dwarf candidates) have uncertain because the photogeometric distance estimates of Bailer-Jones et al. (2021) have significant tails to large values for these objects.
-
•
The closest system to the Sun in this sample is the encounter between two M dwarfs, HD331161B and G125-30, which are at pc. The star HD331161B is part of a binary.
-
•
The encounter with the closest minimum distance is between another pair of M dwarfs, 2MASS J07315294+0633251 and 2MASS J07321651+062839, which has a minimum encounter distance of 22 AU. This is also the system with the highest score in the metric .
-
•
The encounter with the highest probability of passage within AU is the pair 2MASS J05100438+3306067 and 2MASS J05100212+3303535, which has a probability of 37 per cent. The high probability here is driven by the very close agreement in the distances to these stars.
2.4 Planet Hosting Stars
Our close encounter sample defined above does not contain any stars known to host planets. Indeed, it contains very few stars that have even been searched for evidence of planets. Therefore, let us examine the sample of stars that are known to host planets, and estimate how close of an encounter is likely to occur amongst this subsample.
To address this, we have repeated the GAIA search described above, but used, as the source population for the comparison, the stars within 100 pc of the Sun that are known to host planets. We draw this sample from the NASA Exoplanet Database (Akeson et al., 2013), as of July 9, 2021. Figure 8 shows the relative motions on the sky of all pairs whose parallaxes are consistent, and with projected separations . The lower limit is chosen to exclude matches between the same star, since the NASA database uses GAIA DR2 positions and we are using GAIA EDR3 positions, which sometimes give small offsets. This leaves us with 129 pairs.

Figure 8 once again shows the division into bound and unbound pairs, as in Figure 1. There are quite a few planetary hosts in binary systems, as is well known. The vertical dotted line indicates the cut we used for further consideration in our original sample. The two unbound pairs from this sample that satisfy this criterion feature the stars GJ 433 and HR 858. These are the only two planet hosts that make it into our initial sample of 446 encounters.
-
•
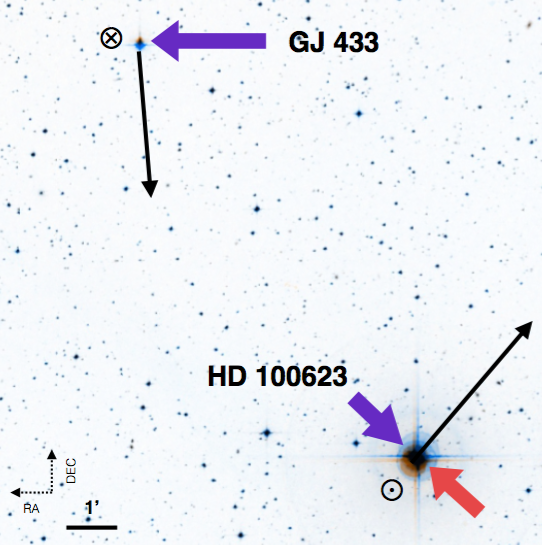
The star GJ 433 is an M2 dwarf () hosting three planets, whose periods are 7.37, 36.06 and 5094 days (Bonfils et al., 2013; Tuomi et al., 2014; Feng et al., 2020). About 2000 years ago, it may have come to within AU of the K0V dwarf HD 100623, which is actually a binary containing a white dwarf companion. Both of these stars have measured radial velocities as well, so this is a reasonably well determined measurement (the biggest uncertainty being the respective radial distances). This star does not make it into our sample because, without the radial velocity information, the chance of the close encounter coming within AU is less than 1 per cent, and . However, when we include the known radial velocities, increases to 0.16, although is still .
-
•
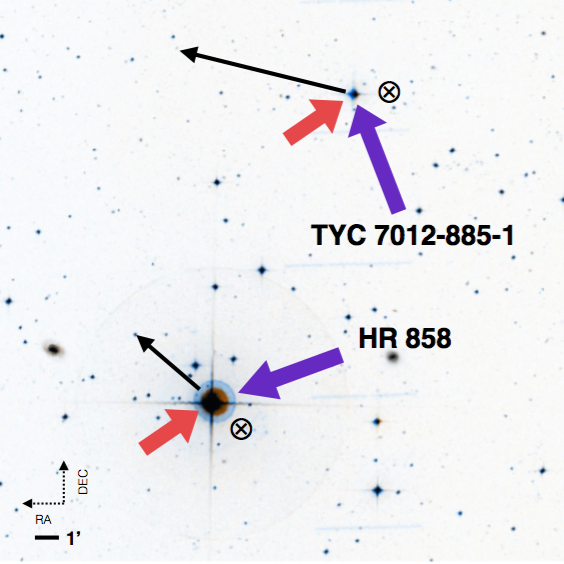
The star HR 858/HD 17926 is a 1.2 F star at a distance of 32 pc, also with three planets – periods 3.59, 5.97 and 11.23 days (Vanderburg et al., 2019). This star also has a low mass binary companion. In years, it will also come within AU of another binary pair, dominated by the star TYC 7012-885-1. Once again, this encounter is well characterised because both members have measured radial velocities. As in the case of GJ 433, this pair also has a less than 1 per cent chance of coming within AU, and in this case, even with radial velocities included.
There is one other pair in Figure 8 that doesn’t match well with the bound pairs – that containing the planet hosting star GJ 685 (Pinamonti et al., 2019). This falls within the intermediate range we identified in § 2 as likely contaminated by hierarchical triples. Indeed, this star is projected to undergo an encounter with the spectroscopic binary HD 160269. The fact that both stars share the same radial velocity suggests that this is truly a bound pair, and the larger-than-expected differential proper motion may be affected by the orbital motion of the binary. There are several planet-hosting stars, designated with dotted circles in Figure 8, which are listed as single in the Exoplanet database but seem to have wide companions, based on their positions in this diagram. These possible binaries are GJ 685, HD 238090, HD 10647, HIP 38594, HD 39855, HD 8326, HD 221420, HD 23472, HD 24085, HD 31253 and WASP-29. Also circled in Figure 8 are the systems HD 124330 and AU Mic, which appear to lie between the elliptic and hyperbolic populations. In the case of AU Mic, this may be a consequence of its youth and membership in the Pictoris moving group.
3 Signatures of Interaction
We have identified a set of stars undergoing close, but unbound, stellar encounters. HZ21 noted that the energy burden of transfer between stars is considerably eased during such encounters and postulated that most interstellar migration will occur during such episodes. If such migrations are accompanied by an increase in construction of spaceships and communication within a migrating population, then they might prove to be fruitful targets for observations. To that end, we review here the possibility of infrared excesses in this sample. We also present, in the Appendix, finding charts for the 16 systems in Table 1.
3.1 Infrared Excess
One possible source of observable signals is the large-scale construction of spaceships to transport material and individuals from one star to the next. The most energy efficient way of doing this would be to utilise a population of asteroids, and so we might search for an infra-red excess resulting from dust released during the construction process.
In order to search for infrared excesses we cross-correlated the positions of the stars in Table 1 with point sources detected in the 2MASS (Skrutskie et al., 2006) and ALLWISE (Wright et al., 2010) catalogs. Figure 9 shows the resulting set of J-W2 versus W1-W3 colors for sources detected at 12m and shorter wavelengths. There is no evidence of any sort of infrared excess around any of the stars – either the putative origin systems or the destinations.
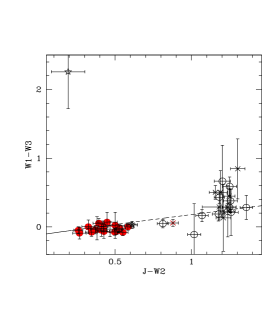
In Figure 9 we also show the colours for the pairs featuring white dwarfs. Most white dwarfs derive from stars originally in the same mass range as those in Figure 1, and so may provide another source for migration if civilisations survived the evolution of their host stars. Most of the white dwarfs are so faint in the infra-red that they are not detected in WISE, but most of the other members of the encounter pair are detected. The only source with potentially interesting colours is GD 84, which has a large W1-W3 colour. However, the source is still faint at WISE wavelengths and the uncertainty in the W3 magnitude may be underestimated because of the uncertainty in the background level in this image.
We have also examined the 2MASS and WISE magnitudes for the sample of lower mass stars in Table 2. These stars are mostly much fainter and, although there are a handful that show anomalous WISE colours, all excesses can be explained by either source confusion or uncertainties in the background levels at W3 and W4 wavelengths.
To assess what sort of limit these observations place on the presence of dust, Figure 10 shows the spectral energy distributions for two stars – GD 84 (the one star with a marginal detection of an excess) and HD 87978 (our best case target in the sense that it is a slightly evolved G star and so best corresponds to the scenario outlined in HZ21). In each case, we have taken the WISE and 2MASS data, combined it with optical photometry from the literature, and fit with a black body of appropriate temperature. We have then added, to the GD 84 data, a black body at temperature 300 K. This is based on the assumption that any technological activity would occur at approximately habitable temperatures.

The measured flux can tell us the surface area that a population of optically thin dust is required to match. For a white dwarf of temperature K and radius cm, surrounded by a population of m radius dust particles, we require particles to intercept enough light to reradiate the observed flux in the infrared. Assuming a dust density of 3g.cm-3, this means a mass of g, which is very small – comparable to an average Solar system asteroid. A similar calculation yields a mass in dust g to match the observed flux of HD 87978 at 24m. This represents an upper limit as there is no evidence of excess in the HD 87978 flux.
Infrared excesses are a common feature of young planetary systems, as the dust from the late, collisional, stage of planetary assembly. Some fragments must survive to late stages, because there is evidence for surviving rocky material in orbit around a significant fraction of white dwarfs (Zuckerman et al., 2010). Thus, we anticipate the rocky material from a surviving asteroid belt may be available for the construction of interstellar transport vehicles. Any estimate of the required mass is wildly speculative given our current lack of knowledge, but we can set a baseline by considering what might be required for transportation of humans in such an episode. Given the expense and danger involved, we can imagine that construction would opt for extremes of efficiency. If the spaceships were constructed by hollowing out asteroids (less expensive than boosting material from a planetary surface to space) we anticipate the smallest volume per capita that is feasible. A contender for the highest population density long-term settlement is the Kowloon Walled City slum of Hong Kong (Nosowitz, 2013), with a population density of 1 million people per square km. The walled city was also 15 storeys high, or about 60m, so that the volume associated with 1 million people is , or a volume of about 60 per person. The excavation of such a volume of rock implies a mass g per capita. If this were all converted to dust, it would still allow for the construction of habitats for people. This does not allow for volumes for storage, or engines or many other necessary items, but it illustrates that an alien construction need not produce an enormous infrared signature. The only substantive conclusion we can draw is that we have no significant evidence for anything unusual observed in the infra-red output of this sample of stars.
3.2 Astrophysical Effects
We have also noted the possibility that close stellar encounters might induce comet showers. The extent of the Solar Oort cloud is believed to extend well beyond the AU threshold we have adopted, so it is natural to expect the stellar encounters identified here to affect any equivalent Oort clouds around these stars, should they exist. However, the observable signals to be expected from such a comet shower require that gas or dust be released from the comet to yield infrared excesses or transient spectral features in absorption, and this requires the comets to get close enough to the star to begin to sublimate, which essentially requires getting within 5 AU (Whipple, 1950), in the case of a Sun-like star. Such a requirement imposes a delay between the actual encounter and the peak of any expected signal (Hut et al., 1987; Dybczyński, 2002) – corresponding roughly to the orbital timescale at the original location of the scattered comets. Thus, it is likely far too early to expect much of a signal in the case of the sample of stars shown here.
Nevertheless, we can still estimate the size of the effect. Starting with a Sun-like Oort cloud, we take a total of comets distributed uniformly within AU of the host star. Several authors have made more detailed models of the actual Solar Oort cloud, but this simple model captures the basic population demographics (e.g. Weissman (1996)). In such a model, the local density of comets is . If we ask how close to the perturbing star, of mass , does a comet need to get to be strongly scattered, we can determine this by calculating the due to a scattering encounter (e.g. from Binney & Tremaine (1987)) and set it to be comparable to the orbital velocity of the comet, at a distance from the host star of mass . This yields an impact parameter (relative to the scatterer) of
| (2) |
In passing through the cloud, the interloper perturbs a fraction of the comets, assuming , which is comparable to more detailed estimates (e.g. Dybczyński (2002)). This is not likely to be observable amongst the sample identified here – because of the delay between perturbation and post-perturbation perihelion – but it suggests that the space density of stars experiencing comet showers should be similar to the density of stellar perturbations identified here.
One hope for an immediate signal is for the perturber itself to cause sublimation in comets that pass close to it during its passage through the Oort cloud. This has not been estimated in the above papers, so let us estimate the size of the effect within the context of our simple comet cloud model outlined above. If we adopt the Whipple threshold of AU for the sublimation of water in Solar system comets, this amounts to an equivalent temperature of K on the sunward facing side of the comet. This implies the perturber must pass within
| (3) |
to generate gas and dust by sublimation. Consideration of gravitational focussing increases this estimate by only 10 per cent. Therefore, for M dwarf perturbers, there is rarely a comet within a sufficiently large volume to generate any mass loss. In the case of a G-star perturber, the volume gets larger, and there is comet within the sublimation radius at any given time. However, the odds of this object passing across the line of sight of the observer is small. Over the course of a month, the line of sight intersecting a solar mass star will sweep out a volume (travelling at 50 km.s-1), which is small compared to the volume per comet.
Therefore, we conclude that the odds are negligible of seeing a transient absorption in one of these systems due to the perturber directly sublimating a comet in the Oort cloud.
4 Conclusions
HZ21 argue that the difficulties involved in migration between stars is minimized during close stellar encounters, and that the possibility of observing the operation of extraterrestrial technologies may be enhanced during such episodes. As a result, in this paper we have searched the GAIA database of stars within 100 pc in order to identify those unbound stellar pairs that are likely to have close encounter in the recent past or near future. . We identify a total of 132 pairs with either a better than 1 per cent chance of passing within AU of one another, or with a mean value . Of these, 16 pairs feature a star of spectral type between K1–F3. These approximately Sun-like stars are the ones that correspond most directly to our original hypothesis. Many of these pairs have measured radial velocities, and we have used this information, where available, to improve our estimates of the interaction metrics.
The motivation to undertake interstellar migration may also be reduced if the star has a bound companion, as such a body would be much easier to reach. Examination of our preferred sample for indications of binary companions leaves only 8/16 of the primaries in the most constrained sample as having no evidence for binarity. As a result, our preferred candidate systems for observing signs of interstellar migration are HD 87978, HD 92577, HD 50669, HD 44006, HD 80790, LSPM J2126+5338, LSPM J0646+1829 and HD 192486. The highest probability candidates amongst known planet hosts are the stars GJ 433 and HR 858. We suggest that searches for extraterrestrial technology include these stars in their search, as they provide a rationale for a hypothesis-driven search instead of the traditional blind search and thus may motivate deeper observations. Indeed, the full sample of 16 systems in Table 1 are worthy of studying in this regard. In appendix A we provide finding charts for each of these pairs, as well as for a few additional systems of potential interest (such as the most extreme members of the lower mass sample in Table 2).
As an example of such a search, we have searched the 2MASS and WISE databases for the stars in Table 1 to look for the possibility of infrared excesses due to large-scale astroconstruction in these systems. We find no evidence for an infrared excess in any of the G star systems. We also examined the encounters in the expanded sample (Table 2) that involved white dwarfs – since most of these stars are evolved from G or F main sequence stars. We find one marginal detection of a W3 excess around GD 84, but this must be regarded as tentative given the uncertainties in the background level at these wavelengths. From these non-detections we can constrain the mass in 10m dust around these stars to be g.
Our study bears obvious resemblance to studies searching for the stars that will make close encounters with the Sun (Bailer-Jones et al., 2018; Bobylev & Bajkova, 2021). Those studies focus on stars close to the Sun, whose parallaxes are often more accurate than those used here, and for which a much larger fraction have radial velocities available. In our case, we are limited primarily by the accuracy of the parallax and the unknown line-of-sight velocity, which renders our sample statistical in nature. It is likely that only one or two of the candidates in Table 1 will actually experience an encounter within AU, but the benefits of having a well-defined, manageable sample compensate for this.
Appendix A Finding Charts
Here we present the finding charts for the 16 systems in Table 1, along with a handful of additional, potentially interesting, systems. We show the relative proper motions of each of the members of the close encounter pair, to illustrate the nature of each encounter. Note that the magnitudes of the vectors are proportional to the relative amplitude of the proper motions in each chart, but not between charts (i.e. there is no uniform scaling in proper motion that has been applied across all charts). In the cases where radial velocities are measured for these stars, their direction is indicated as moving towards () or away from () the observer. All images are taken from the ALADIN archive (Bonnarel et al., 2000) of DSS2 images, except where specifically indicated.
A.1 Encounters featuring Sun-like Stars
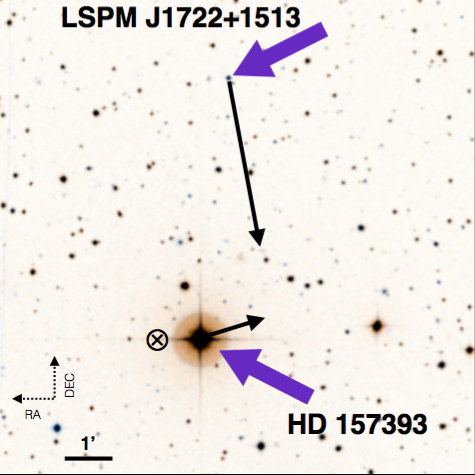
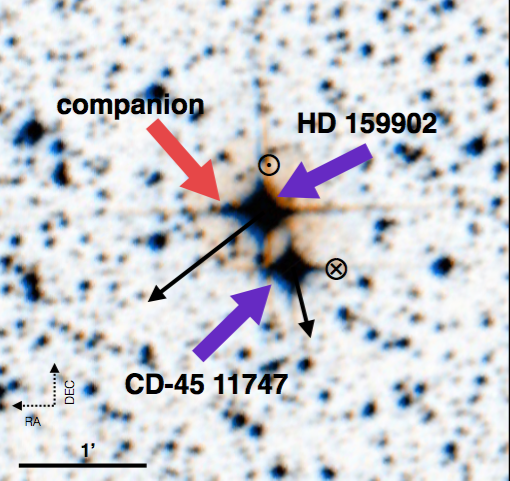
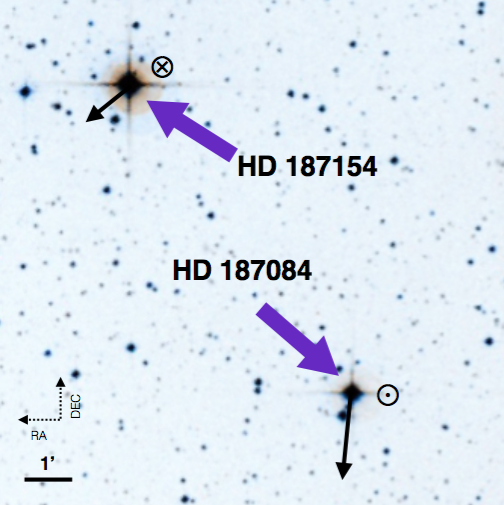
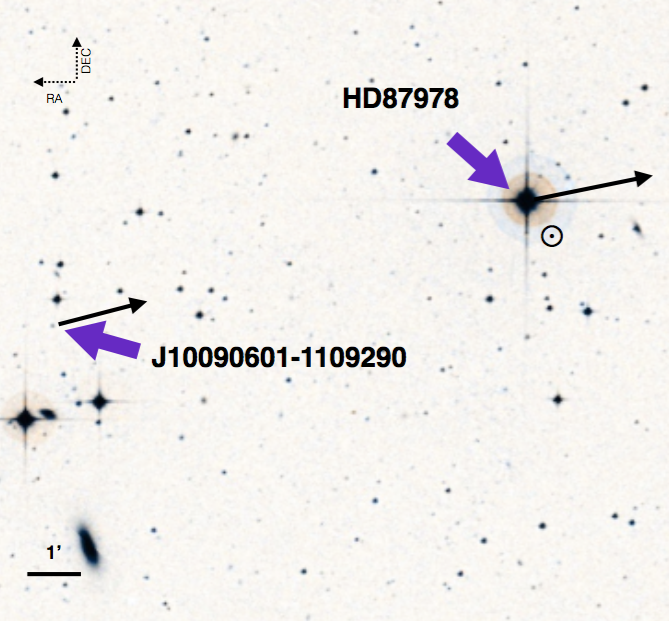
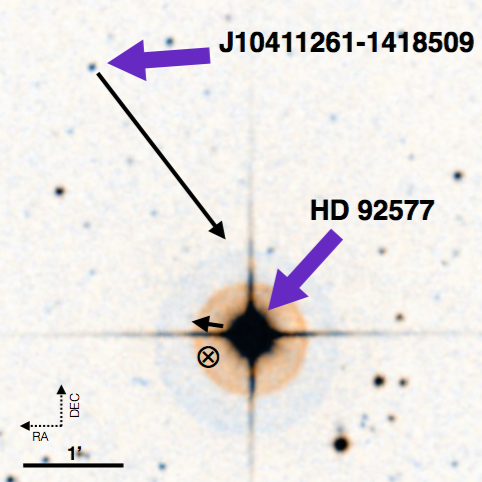
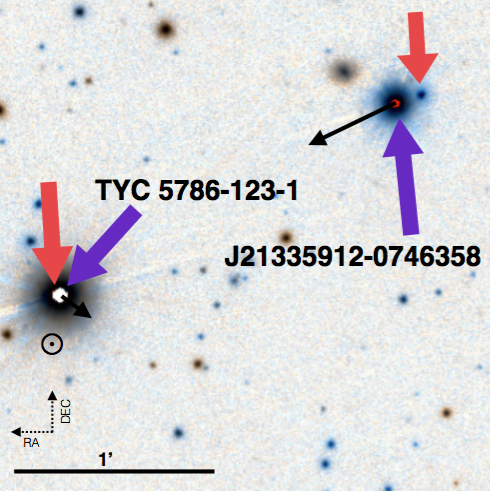
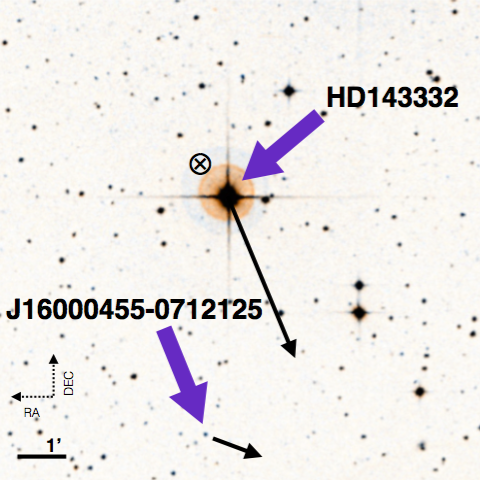
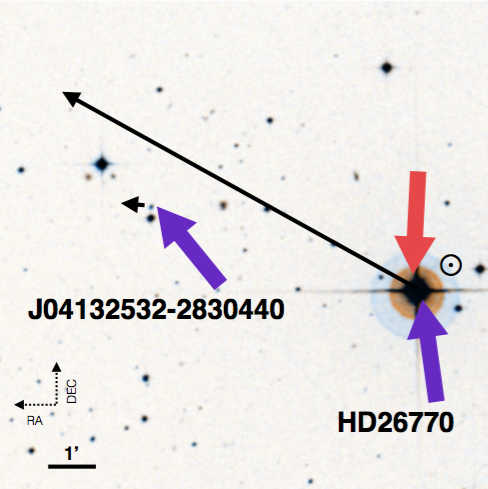
Figure 11 shows the finding charts for the first two entries in Table 1. The left hand panel shows the encounter involving the F8 star HD 157393. In this case, the closest approach is estimated to lie in the future, and the proper motion vectors appear to be converging. In the right hand panel, we see the encounter involving the G5 star HD 159902. The pair, in this case, is much closer and the closest approach is estimated to have occurred in the recent past. Thus, the proper motions now appear to be diverging. The star HD 159902 also appears to have a wide ( AU) proper motion companion in the GAIA data.
Figure 12 shows two more finding charts, for the star HD 187154 (left panel) and HD 87978 (right panel). The former case now shows diverging proper motions and the closest approach is estimated to have occurred in the past. The latter case is currently showing converging proper motions and is estimated to undergo close approach in the future. HD 87978 is also one of the stars in Table 1 for which there is, as yet, no evidence of a bound companion.
The left panel of Figure 13 shows the finding chart for the encounter featuring the F2V star HD 92577. The right panel of Figure 13 shows the finding chart for a binary-binary encounter. In this case, the minimum encounter distance is expected to be much wider than either of the binary separations ( AU for TYC-5786-123-1 and AU for the M dwarf pair).
The left hand panel of Figure 14 shows the encounter of HD 143332 with another M dwarf. This is projected to reach closest approach years in the future, consistent with the evidently converging proper motions. HD 143332 is also suspected to be a binary (Kervella et al., 2019). The right hand panel shows the encounter of the G0V star HD 26770 with an M dwarf. The HD 26770 system is actually a wide binary containing two G stars.
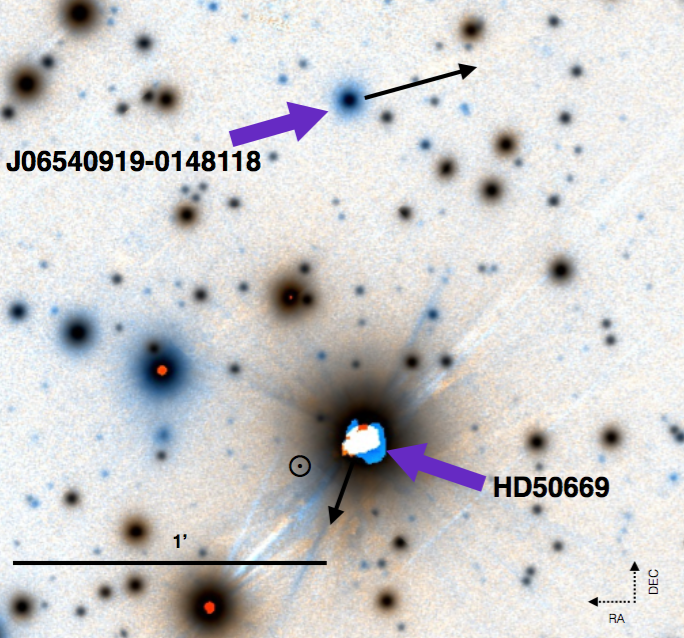
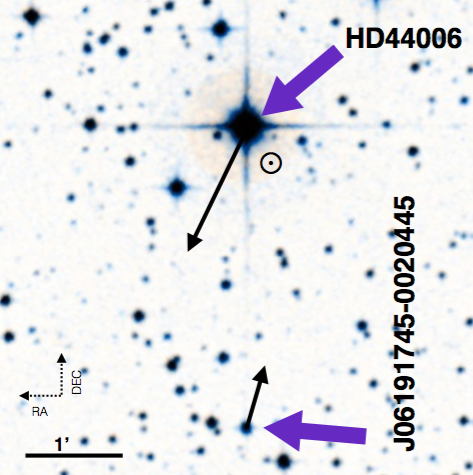
The left hand panel of Figure 15 shows the interaction of the G8IV star HD 50669 with an M star. This is an apparently single star approaching the end of its main sequence lifetime and thus another prime candidate for an interstellar migration event such as those postulated in HZ21. The right hand panel of Figure 15 shows the finding chart for the star HD 44006, another isolated G star undergoing an encounter with an M dwarf.
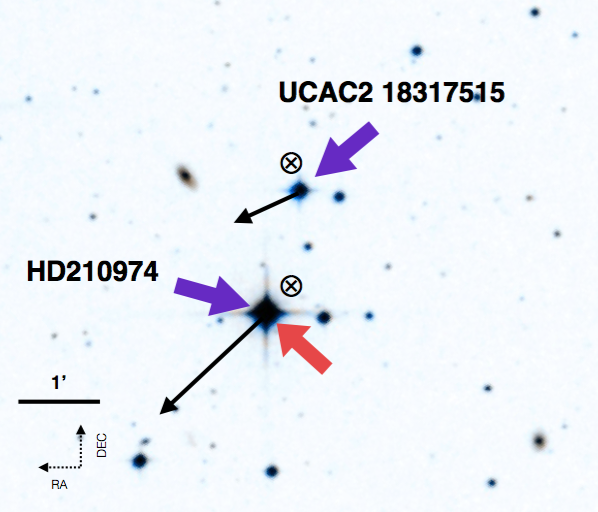
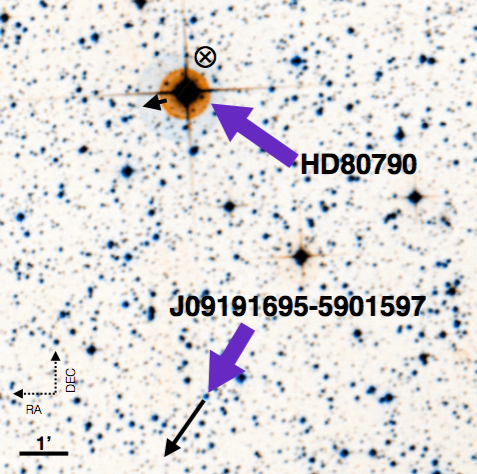
The left hand panel of Figure 16 shows an encounter between another binary featuring G8 and K0V stars, with a fainter star UCAC2 18317515. This system likely went through its closest approach fairly recently. The right hand panel shows the field around the HD 80790. This star underwent a close passage with the M star J09191695-5901597 a few thousand years ago and is now diverging. The star HD 80790 is identified as a binary in the literature.
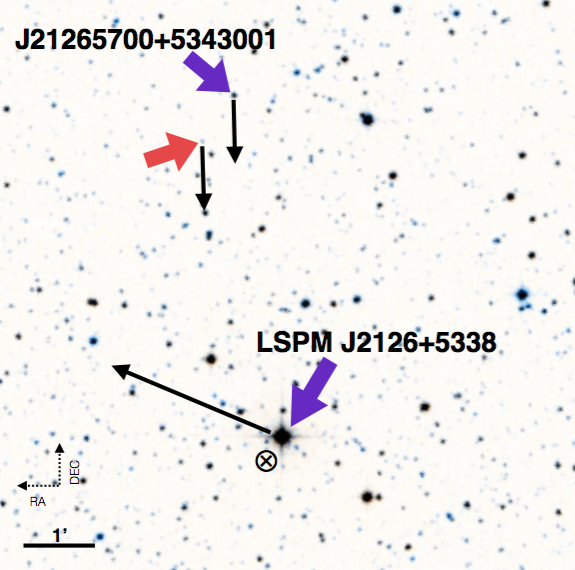
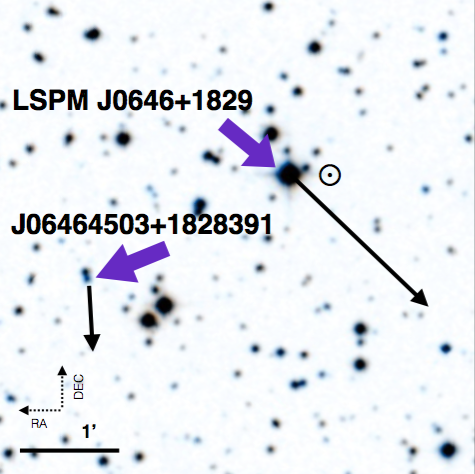
The left hand panel of Figure 17 shows the field of the encounter featuring the star LSPM J2126+5338 with an M dwarf binary. This is actually the highest probability encounter in Table 1. Finally, the right hand panel shows the encounter featuring the star LSPM J0646+1829. This is another of the single Sun-like stars undergoing a close encounter.
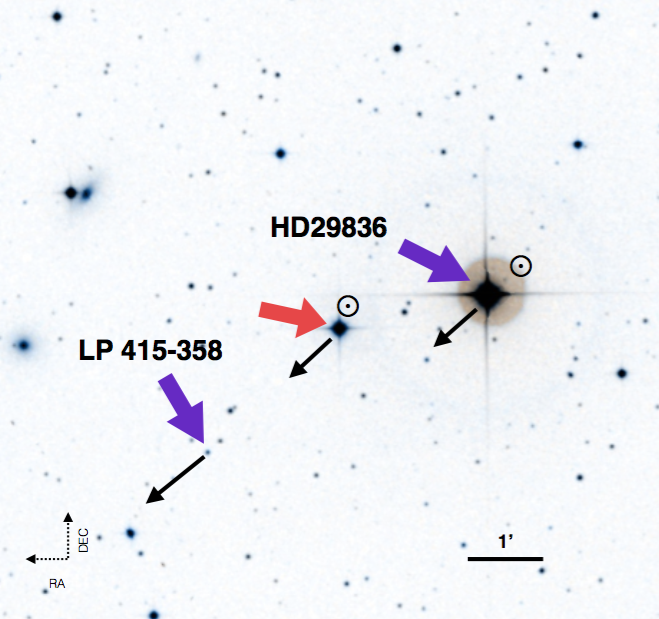
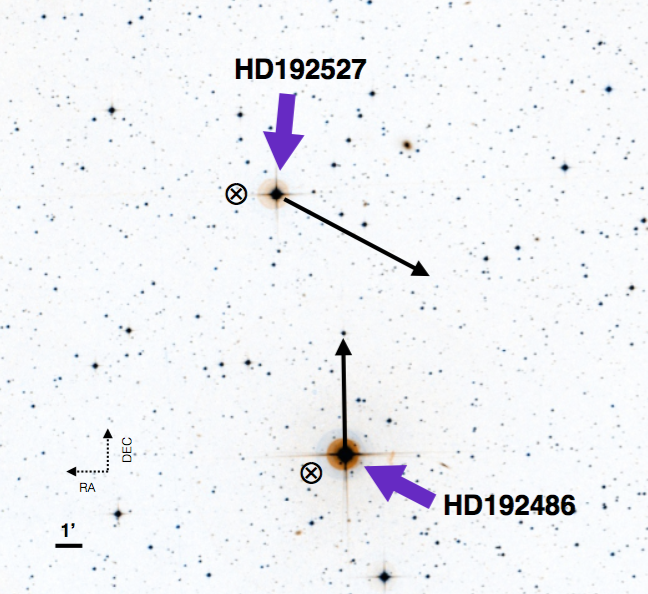
The final figure in this section contains the final two entries in Table 1. Neither of these encounters has a minimum likely passage within AU, but both have above the threshold value of 0.1. The left hand panel shows the encounter of a GV star HD 29836, with an M dwarf LP 415-358. HD 29836 has a wide K7 proper motion companion, HD 285970. Despite the low values of and , this encounter has the equal fifth highest value of in Table 1. The right hand panel shows the encounter of an F2V star HD 192486 and a G5V star HD 192527. The two stars share a common radial velocity, but clearly discrepant proper motions. This pair lies close to the lower limit of our cutoff, but there is no indication of excess astrometric noise that would suggest one of the sources is a partially resolved binary whose motion may have distorted the relative proper motions.
A.2 Other Systems of Interest
The encounter involving the white dwarf GD 84 features a marginal detection of an infra-red excess. Figure 19 shows this encounter and also indicates the star tentatively identified by Farihi et al. (2005) as a companion – see Figure 4.4 of Farihi (2004) for the original finding chart. The identification was tentative because the stellar proper motion measurement was compromised by confusion with the nearby background star. GAIA measurements now reveal that this is not at the same distance nor does it share the proper motion of GD 84.
The right hand panel of Figure 19 shows the identification of the two stars taking part in the encounter that is closest to the Sun – that of HD 331161B and G125-30. This pair is so close to the Sun (14 pc away) that a full finding chart that spans the region between the pair includes so many stars as to be essentially unreadable. Thus, in this chart we provide two zooms in on the stars in question, separated by on the sky.
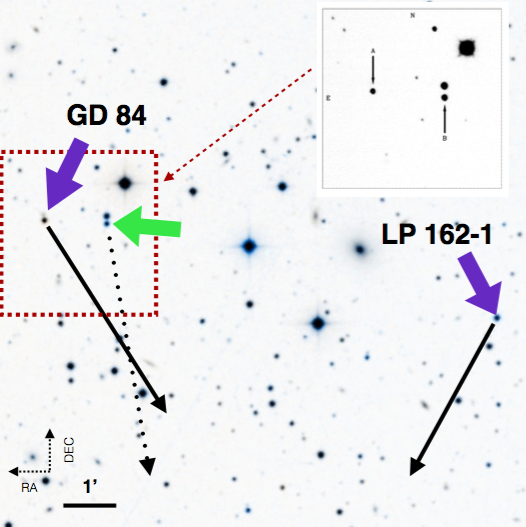
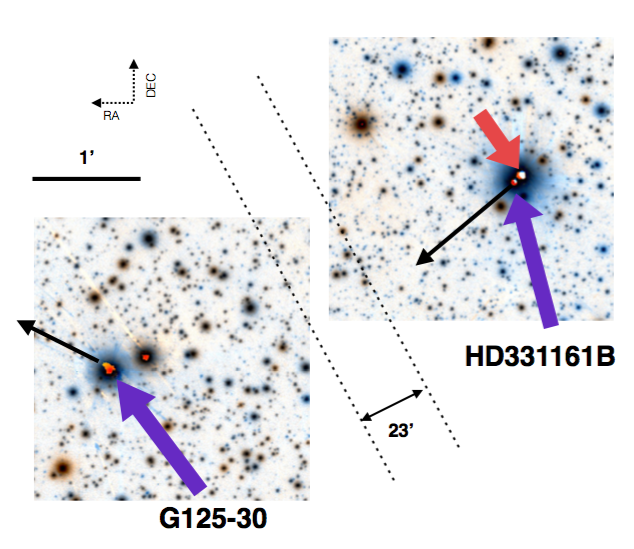
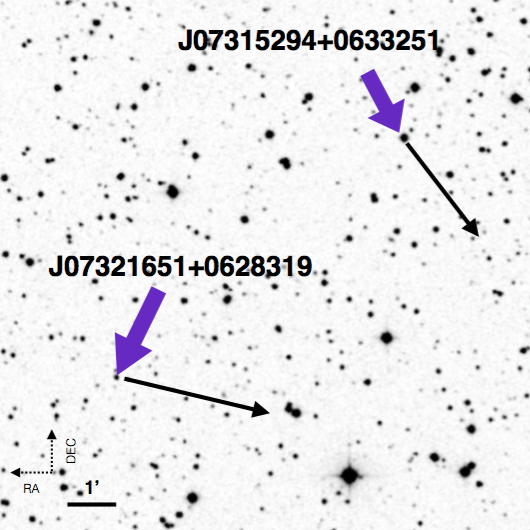
Figure 20 shows the encounters with the most extreme parameters. In the left panel, we see the interaction of the two M-dwarfs J07315294+0633251 and J07321651+0628319, whose minimum likely close passage distance is estimated to be AU. The converging nature of the proper motions indicates that, with the right radial velocities, this can have a very close passage in years. The right hand panel shows the pair with the highest estimated probability of a close interaction. In this case, the high probability is not driven by the proper motions necessarily, but rather by the close correspondence in the distances to the two stars.
Our final finding charts , in Figure 21, show the two exoplanet host systems that have the closest encounters within the context of our analysis. The left hand panel shows the star GJ 433, which hosts three planets, and its trajectory relative to a binary containing a K0V star and a white dwarf. The closest approach here likely happened a few thousand years ago and the pair is now diverging. On the right hand side of Figure 21, we show the encounter featuring HR 858. This system is likely converging towards its closest approach in the future. This encounter is once again an encounter between two binaries.
References
- Akeson et al. (2013) Akeson, R. L., Chen, X., Ciardi, D., et al. 2013, PASP, 125, 989
- Bailer-Jones et al. (2018) Bailer-Jones, C. A. L., Rybizki, J., Andrae, R., & Fouesneau, M. 2018, A&A, 616, A37
- Bailer-Jones et al. (2021) Bailer-Jones, C. A. L., Rybizki, J., Fouesneau, M., Demleitner, M., & Andrae, R. 2021, AJ, 161, 147
- Binney & Tremaine (1987) Binney, J., & Tremaine, S. 1987, Galactic dynamics (Princeton University Press)
- Bobylev & Bajkova (2021) Bobylev, V. V., & Bajkova, A. T. 2021, Astronomy Letters, 47, 180
- Bonfils et al. (2013) Bonfils, X., Delfosse, X., Udry, S., et al. 2013, A&A, 549, A109
- Bonnarel et al. (2000) Bonnarel, F., Fernique, P., Bienaymé, O., et al. 2000, A&AS, 143, 33
- Butler et al. (2017) Butler, R. P., Vogt, S. S., Laughlin, G., et al. 2017, AJ, 153, 208
- Choi et al. (2016) Choi, J., Dotter, A., Conroy, C., et al. 2016, ApJ, 823, 102
- Dybczyński (2002) Dybczyński, P. A. 2002, A&A, 396, 283
- El-Badry et al. (2021) El-Badry, K., Rix, H.-W., & Heintz, T. M. 2021, MNRAS, arXiv:2101.05282
- Enriquez et al. (2017) Enriquez, J. E., Siemion, A., Foster, G., et al. 2017, ApJ, 849, 104
- Fabricius et al. (2021) Fabricius, C., Luri, X., Arenou, F., et al. 2021, A&A, 649, A5
- Farihi (2004) Farihi, J. 2004, PhD thesis, University of California, s Angeles, California, USA
- Farihi et al. (2005) Farihi, J., Becklin, E. E., & Zuckerman, B. 2005, ApJS, 161, 394
- Feng et al. (2020) Feng, F., Butler, R. P., Shectman, S. A., et al. 2020, ApJS, 246, 11
- Fernandez & Ip (1987) Fernandez, J. A., & Ip, W. H. 1987, Icarus, 71, 46
- Gaia Collaboration et al. (2016) Gaia Collaboration, Prusti, T., de Bruijne, J. H. J., et al. 2016, A&A, 595, A1
- Gaia Collaboration et al. (2018) Gaia Collaboration, Babusiaux, C., van Leeuwen, F., et al. 2018, A&A, 616, A10
- Gaia Collaboration et al. (2021a) Gaia Collaboration, Brown, A. G. A., Vallenari, A., et al. 2021a, A&A, 649, A1
- Gaia Collaboration et al. (2021b) —. 2021b, A&A, 649, A1
- Gaia Collaboration et al. (2021c) Gaia Collaboration, Smart, R. L., Sarro, L. M., et al. 2021c, A&A, 649, A6
- Gaia Collaboration et al. (2021d) —. 2021d, A&A, 649, A6
- Gontcharov (2006) Gontcharov, G. A. 2006, Astronomy Letters, 32, 759
- Hansen & Zuckerman (2021) Hansen, B. M. S., & Zuckerman, B. 2021, AJ, 161, 145
- Harp et al. (2016) Harp, G. R., Richards, J., Tarter, J. C., et al. 2016, AJ, 152, 181
- Hartman & Lépine (2020) Hartman, Z. D., & Lépine, S. 2020, ApJS, 247, 66
- Heisler & Tremaine (1986) Heisler, J., & Tremaine, S. 1986, Icarus, 65, 13
- Hills (1981) Hills, J. G. 1981, AJ, 86, 1730
- Howard et al. (2004) Howard, A. W., Horowitz, P., Wilkinson, D. T., et al. 2004, ApJ, 613, 1270
- Hut et al. (1987) Hut, P., Alvarez, W., Elder, W. P., et al. 1987, Nature, 329, 118
- Isaacson et al. (2017) Isaacson, H., Siemion, A. P. V., Marcy, G. W., et al. 2017, PASP, 129, 054501
- Kervella et al. (2019) Kervella, P., Arenou, F., Mignard, F., & Thévenin, F. 2019, A&A, 623, A72
- Lindegren et al. (2020) Lindegren, L., Klioner, S. A., Hernández, J., et al. 2020, arXiv e-prints, arXiv:2012.03380
- Maire et al. (2019) Maire, J., Wright, S. A., Barrett, C. T., et al. 2019, AJ, 158, 203
- Margot et al. (2018) Margot, J.-L., Greenberg, A. H., Pinchuk, P., et al. 2018, AJ, 155, 209
- Nosowitz (2013) Nosowitz, D. 2013, Popular Science, April
- Oort (1950) Oort, J. H. 1950, Bull. Astron. Inst. Netherlands, 11, 91
- Pinamonti et al. (2019) Pinamonti, M., Sozzetti, A., Giacobbe, P., et al. 2019, A&A, 625, A126
- Price et al. (2020) Price, D. C., Enriquez, J. E., Brzycki, B., et al. 2020, AJ, 159, 86
- Rosenthal et al. (2021) Rosenthal, L. J., Fulton, B. J., Hirsch, L. A., et al. 2021, ApJS, 255, 8
- Rybizki et al. (2020) Rybizki, J., Demleitner, M., Bailer-Jones, C., et al. 2020, PASP, 132, 074501
- Siemion et al. (2013) Siemion, A. P. V., Demorest, P., Korpela, E., et al. 2013, ApJ, 767, 94
- Skrutskie et al. (2006) Skrutskie, M. F., Cutri, R. M., Stiening, R., et al. 2006, AJ, 131, 1163
- Tarter (2001) Tarter, J. 2001, ARA&A, 39, 511
- Tarter et al. (2010) Tarter, J. C., Agrawal, A., Ackermann, R., et al. 2010, in Society of Photo-Optical Instrumentation Engineers (SPIE) Conference Series, Vol. 7819, Instruments, Methods, and Missions for Astrobiology XIII, ed. R. B. Hoover, G. V. Levin, A. Y. Rozanov, & P. C. W. Davies, 781902
- Tellis & Marcy (2017) Tellis, N. K., & Marcy, G. W. 2017, AJ, 153, 251
- Tokovinin (2014) Tokovinin, A. 2014, AJ, 147, 87
- Trifonov et al. (2020) Trifonov, T., Tal-Or, L., Zechmeister, M., et al. 2020, A&A, 636, A74
- Tuomi et al. (2014) Tuomi, M., Jones, H. R. A., Barnes, J. R., Anglada-Escudé, G., & Jenkins, J. S. 2014, MNRAS, 441, 1545
- Vanderburg et al. (2019) Vanderburg, A., Huang, C. X., Rodriguez, J. E., et al. 2019, ApJ, 881, L19
- Weissman (1996) Weissman, P. R. 1996, in Astronomical Society of the Pacific Conference Series, Vol. 107, Completing the Inventory of the Solar System, ed. T. Rettig & J. M. Hahn, 265–288
- Whipple (1950) Whipple, F. L. 1950, ApJ, 111, 375
- Wright et al. (2010) Wright, E. L., Eisenhardt, P. R. M., Mainzer, A. K., et al. 2010, AJ, 140, 1868
- Wright et al. (2018a) Wright, J. T., Kanodia, S., & Lubar, E. 2018a, AJ, 156, 260
- Wright et al. (2018b) —. 2018b, AJ, 156, 260
- Zuckerman et al. (2010) Zuckerman, B., Melis, C., Klein, B., Koester, D., & Jura, M. 2010, ApJ, 722, 725