The performance of a new Kuraray wavelength shifting fiber YS-2
Abstract
Wavelength shifting fibers are widely used for light collection from scintillation counters, which allow connection of various scintillation planes to relatively small photocathodes of photodetectors and especially tiny photocathodes of silicon photo-multipliers. In October 2020 Kuraray announced production of a new branch of faster fibers. We performed a comparison of the new fiber YS-2 to a mature Y-11. The fiber YS-2 demonstrated decay time nearly two times shorter than that of Y-11: 4.0 ns versus 7.4 ns. At the same time its light yield and attenuation length are as good as of Y-11, which makes YS-2 a good choice for timing scintillation detectors.
1 Introduction
One of the typical applications of wavelength shifting (WLS) fibers is a light collection from scintillation detectors. In usual design a WLS fiber is surrounded by a scintillator by placing the fiber in a groove or a hole in the scintillator medium or attached to the edge of the scintillator plane. In most cases this technique is not good for timing measurements. The first problem is in geometry, producing large variations of light trajectories. But the other problem is in the time distribution of photon emission by the WLS fiber. Nevertheless there are many cases when even some moderate time resolution is important. Examples are scintillation counters of CHOD hodoscope of the NA62 experiment [1], where, in the presence of a very intense beam, the time resolution is important to suppress overlapping events, a new CMD-3 Time-of-Flight system [2], or new scintillation detectors for the DANSS experiment upgrade [3], where the time difference between signals from both ends of the scintillation strip allows reconstructing the coordinate. Kuraray announcement of the new line of WLS fibers with shorter decay time looks very promising [4]. We report here the results of the comparison of 1 mm Kuraray fibers: YS-2MJ Multi (YS-2) and Y-11(200)M Multi (Y-11).
2 Decay time measurement
A single photo-electron mode was used to measure the decay time. After an instant excitation of the WLS fiber at the probability to emit a photon at some time will follow an exponential law:
where is the initial emission intensity and is the decay time. In case of some time measurement uncertainty, which follows Gaussian distribution, the probability will be given by a convolution of an exponential decay and this Gaussian function. The resulting distribution is given by an equation:
| (2.1) |
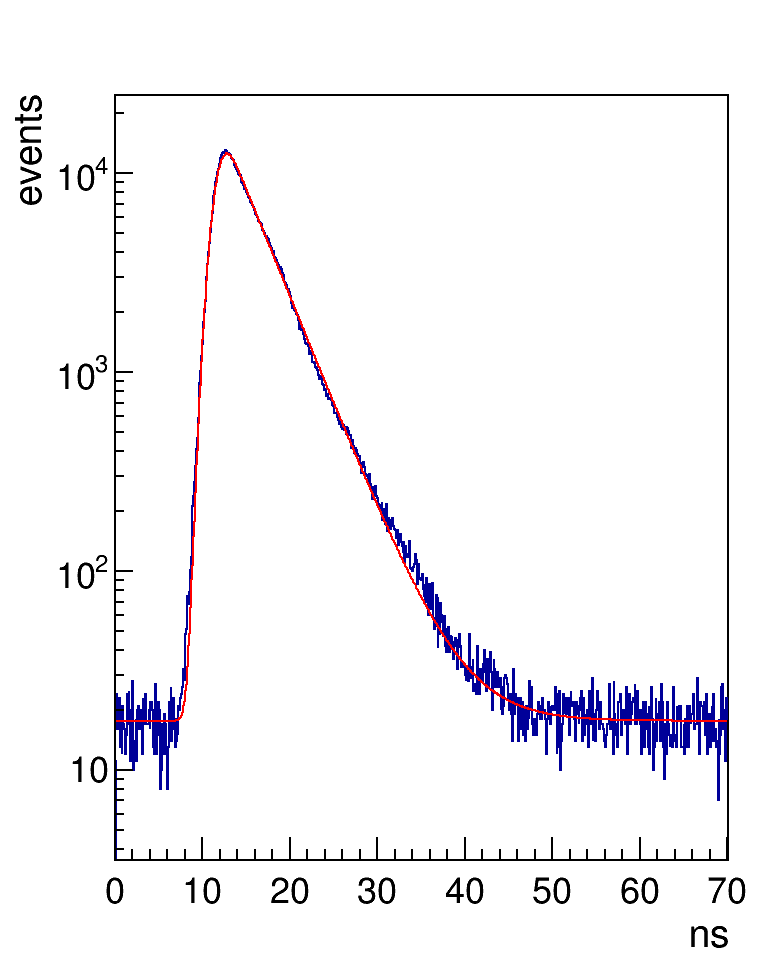
where is the normalization coefficient, is the start time, including light in the fiber propagation delay, is the system time resolution, is the decay time and is the Gauss error function [5]. We use short laser pulses (less than 85 ps FWHM) and select events with only a single photon observed. To extract the decay time the time distribution of these events was fit by a sum of formula (2.1) and time-independent SiPM noise.
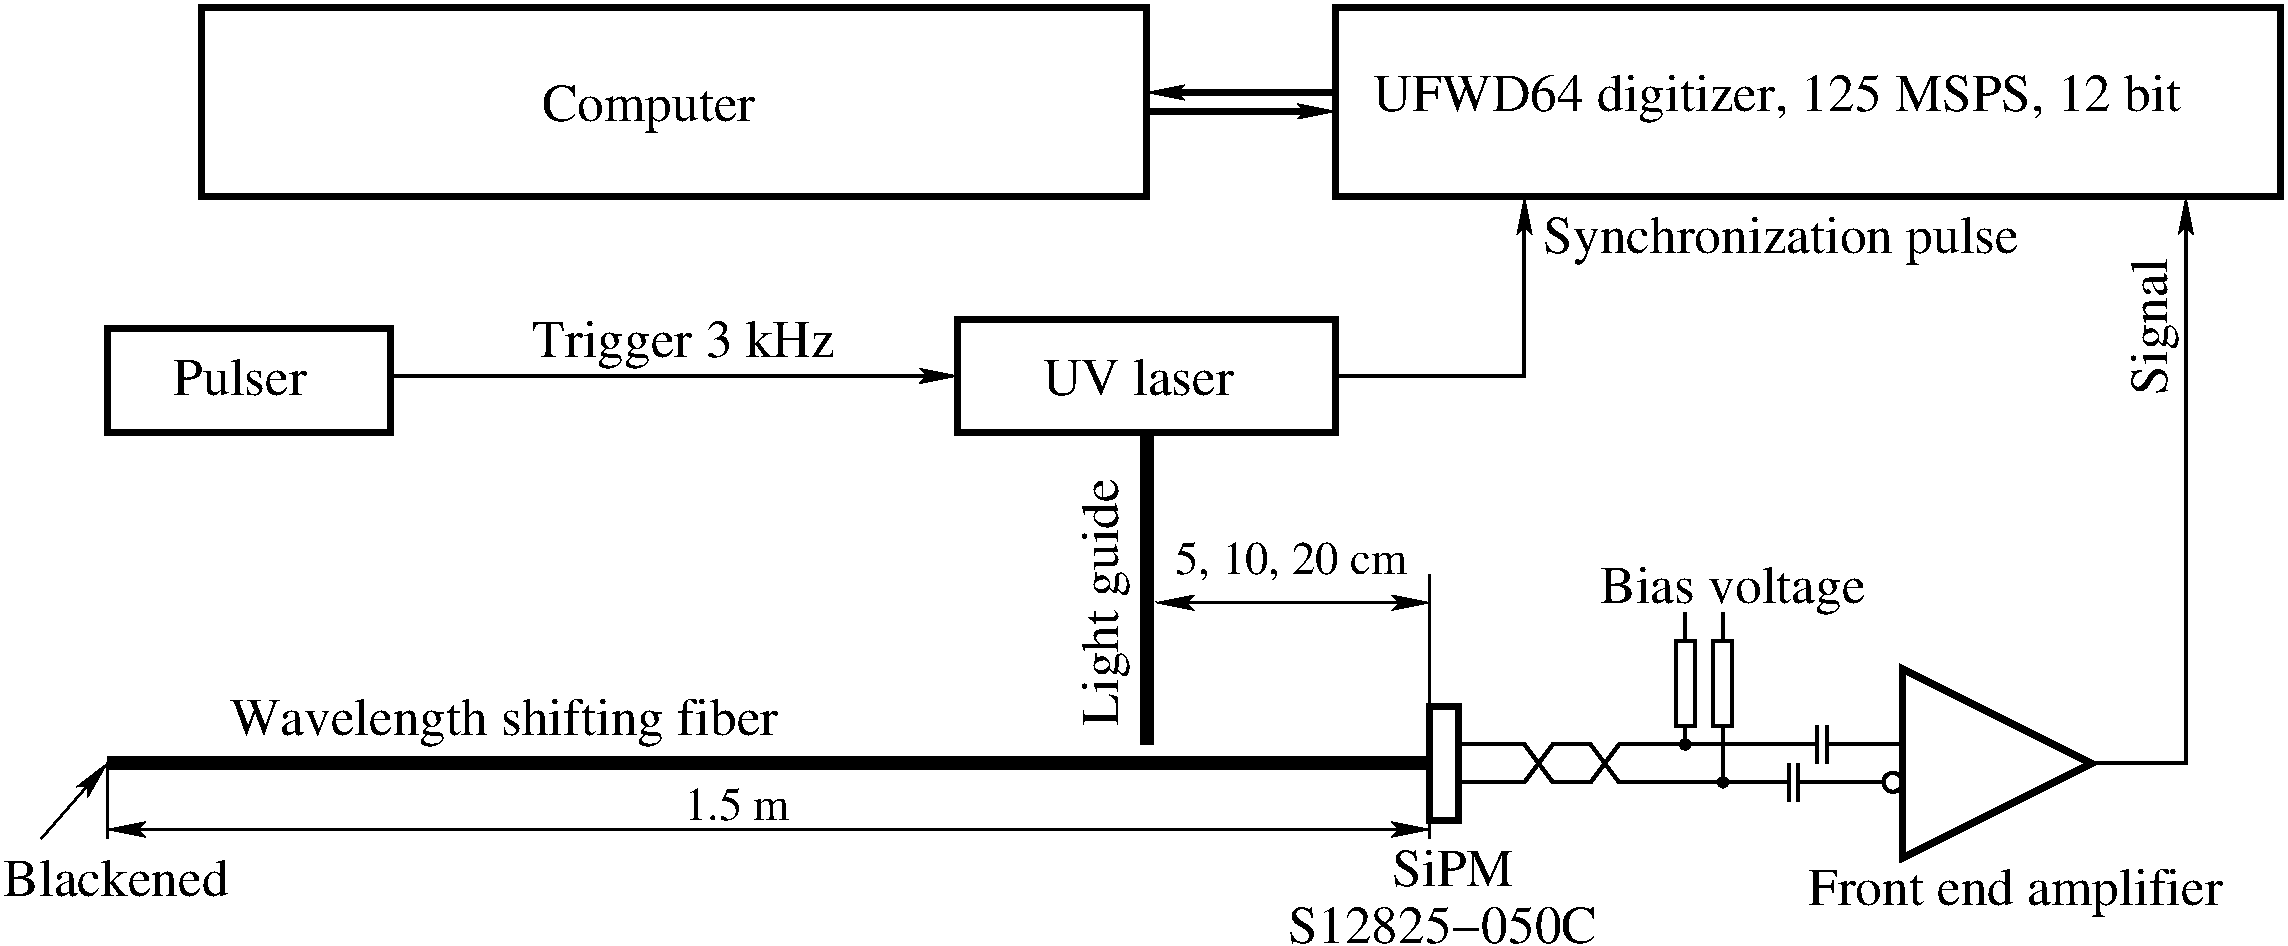
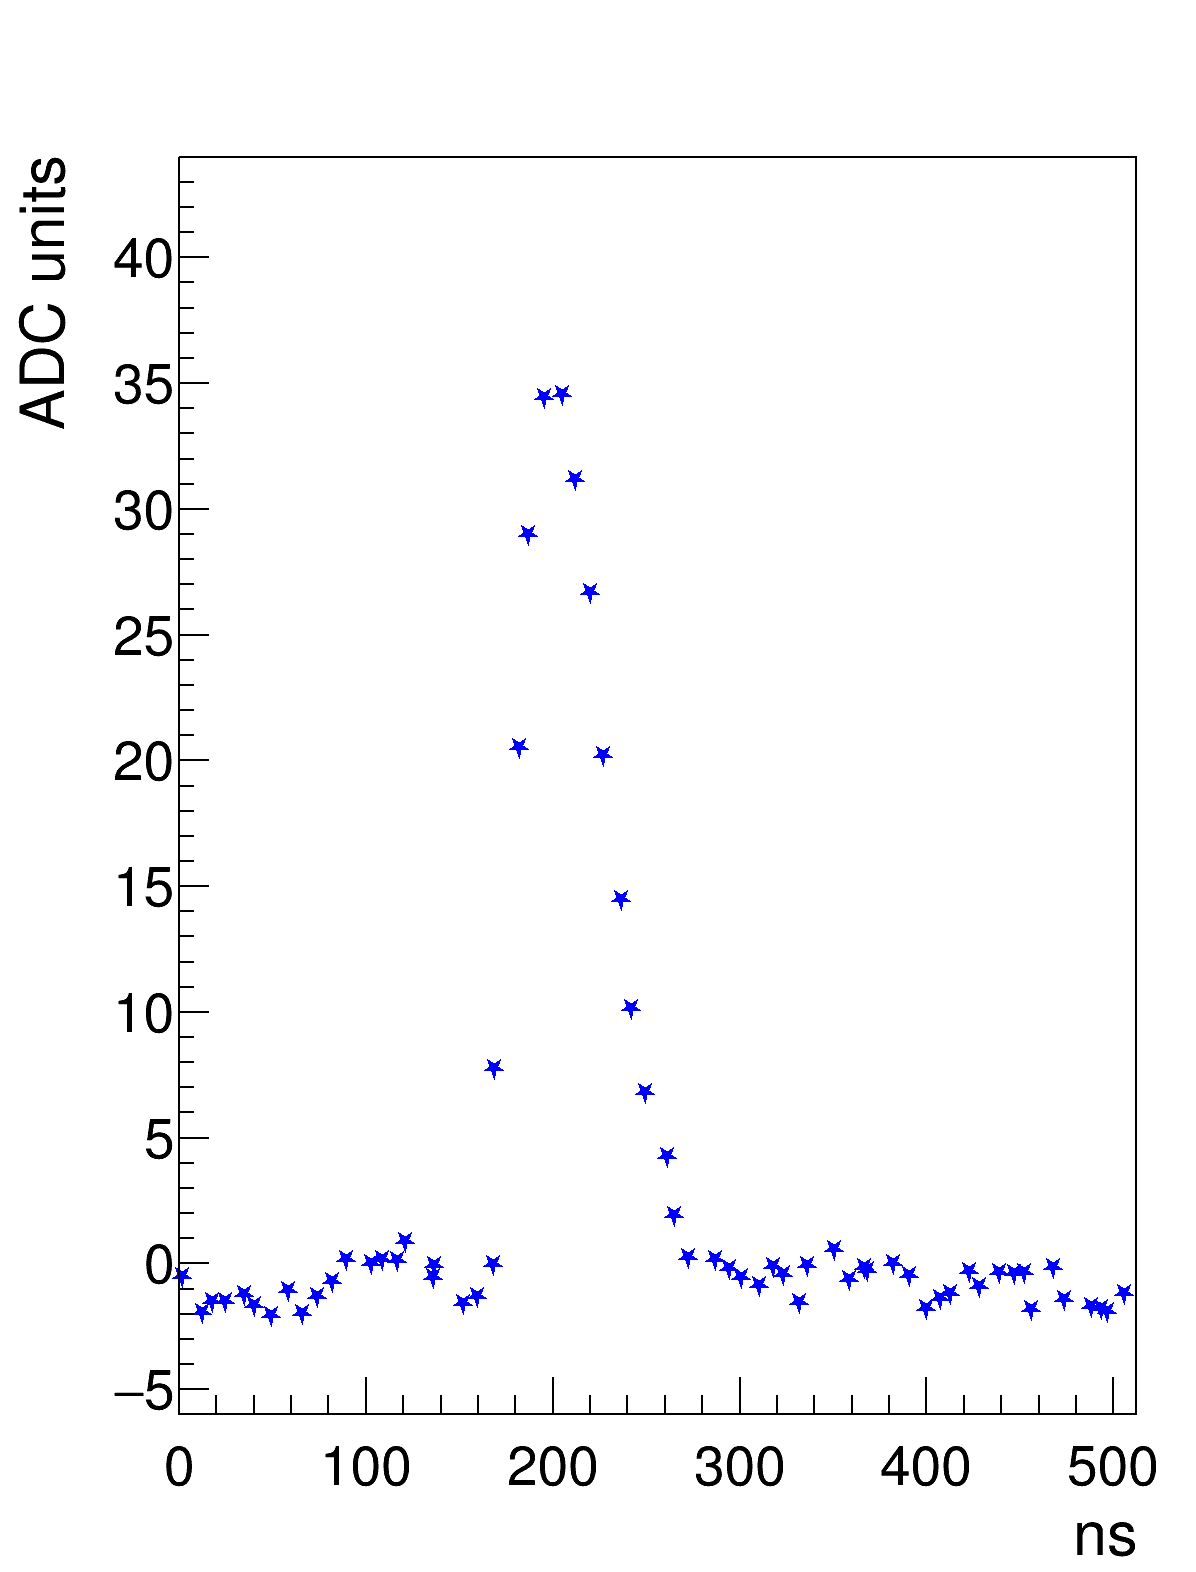
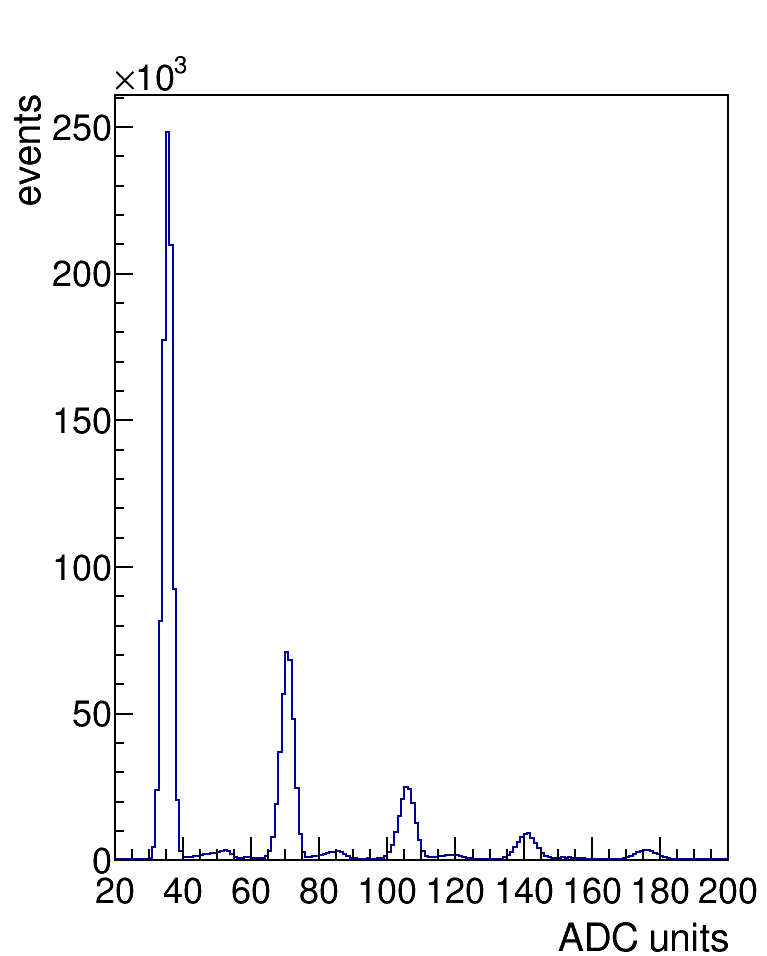
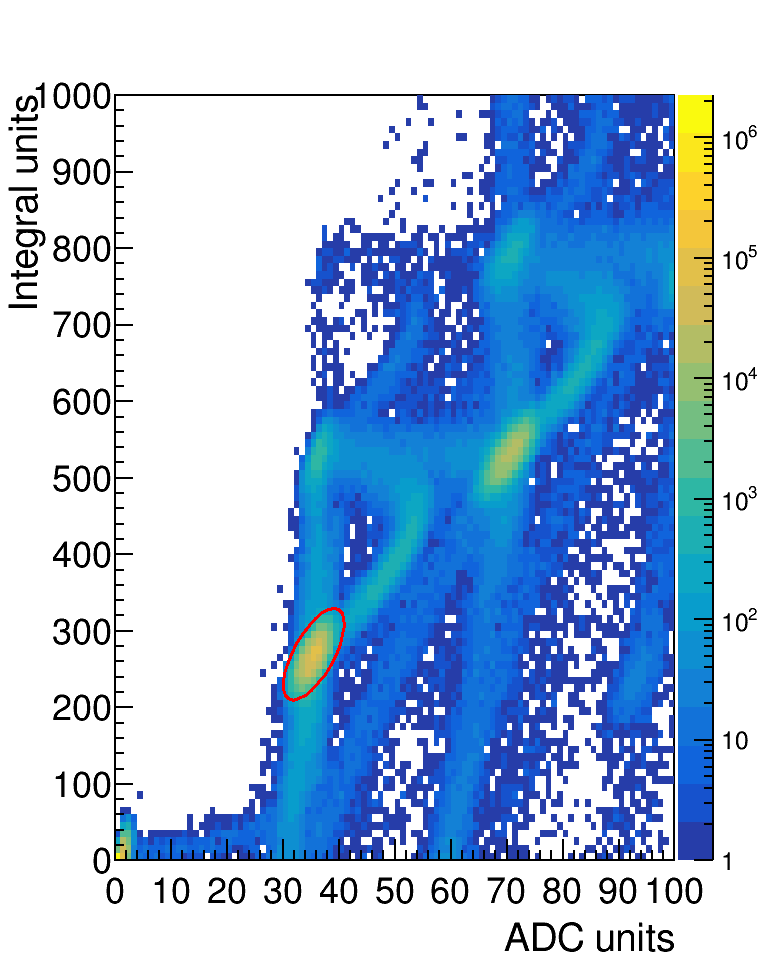
A schematic layout of the decay time measurement is shown in figure 1. A 1.5 m length piece of tested fiber was polished on one end and connected to HAMAMATSU S12825-050C silicon photo-multiplier (SiPM). The other end of the fiber was painted black to avoid reflection. An open end of a fiber-optic light guide was placed a few millimeters from the tested fiber at three different distances 5, 10, and 20 cm from its SiPM end. The light guide delivers very short pulses from UV picosecond laser VisUV-266-355-532 by PicoQuant GmbH. An output with a 355 nm wavelength was used. The laser was triggered by a pulser with a 3 kHz repetition rate. The signal from SiPM was amplified and connected to one input of UVFD64 waveform digitizer module [6]. Another input of the module was used for laser output synchronization pulse, providing the trigger for DAQ and the time reference. UWFD64 uses 12 bit 125 MSPS flash ADC to digitize each of its 64 inputs, two of which were used in this work. An example of a digitized single pixel pulse is shown in figure 3. The laser power was adjusted so that only one or no photo-electron was produced in most of the events. The distribution of events over pulse amplitude is shown in figure 3. Peaks corresponding up to five pixels fired are seen. Zero pixel peak is not shown. For the cleanest selection of single pixel events, an elliptical cut over two-dimensional distribution charge (integral) versus amplitude is used (figure 5). This allows rejecting events with more than one single pixel pulses, corresponding to several photo-electrons in one event separated by some time.
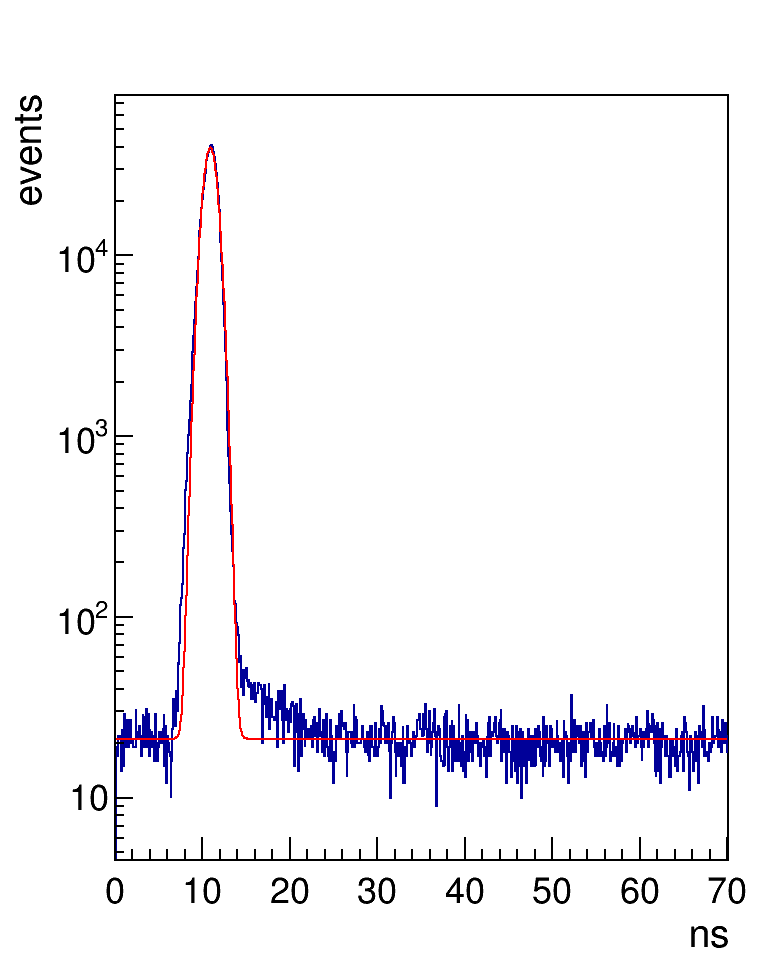
The system time resolution was measured in a dedicated experiment, where a laser light guide was directed to the SiPM without a WLS fiber. The time distribution of single pixel events was fitted by a sum of Gaussian and uniform background (see figure 5). The measured ns was fixed for further fits of the fiber measurements. The decay time of both YS-2 and Y-11 WLS fibers was measured at 3 distances from the laser beam spot to the SiPM. No dependence on the distance was observed. Time distributions for 10 cm distance are shown in figure 6. The results of the measurements are summarized in table 1.

| Fiber | 5 cm | 10 cm | 20 cm | Average RMS | Kuraray datasheet |
|---|---|---|---|---|---|
| YS-2 | 3.2 | ||||
| Y-11 | 6.9 |
We collected about 2 million events for each configuration out of which 0.8-0.9 million satisfy single pixel criteria, so the statistics in each point are very high and statistical errors are small. Values of the decay time are stable to the fit range and Gaussian width variation. An estimation of the systematic error could be estimated from the result variation at different distances. RMS of the values at 3 distances was calculated and indicated as an error in the last but one column of the table 1.
3 Light output measurement with cosmic rays
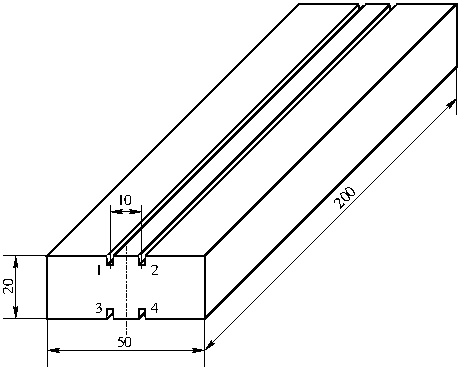
An important question for WLS fiber is the light output in the real detector geometry. For the comparison of YS-2 and Y-11 a sample scintillation counter with 4 grooves was manufactured from polystyrene (see figure 7). Fibers were cut at 23 cm and polished on both ends. One end of a fiber was connected to SiPM and the other end was left open. Four fibers of one type were put into the grooves without any glue and exposed to cosmic rays. Then fibers were exchanged keeping SiPM and grooves correspondence and another exposition taken. The results are presented in table 2. Individual values have a statistical error of about 2% not shown in the table. All 4 fibers are in the same conditions, so their variation is used for error estimation, which is shown in the last column together with average values. This simple test demonstrated that the light yield of YS-2 is at least as good as of Y-11.
| Groove | 1 | 2 | 3 | 4 | Average RMS |
|---|---|---|---|---|---|
| YS-2, ph.e. | 30.7 | 24.6 | 28.2 | 25.5 | |
| Y-11, ph.e. | 24.8 | 25.5 | 28.6 | 22.7 |
4 Longitudinal attenuation measurement
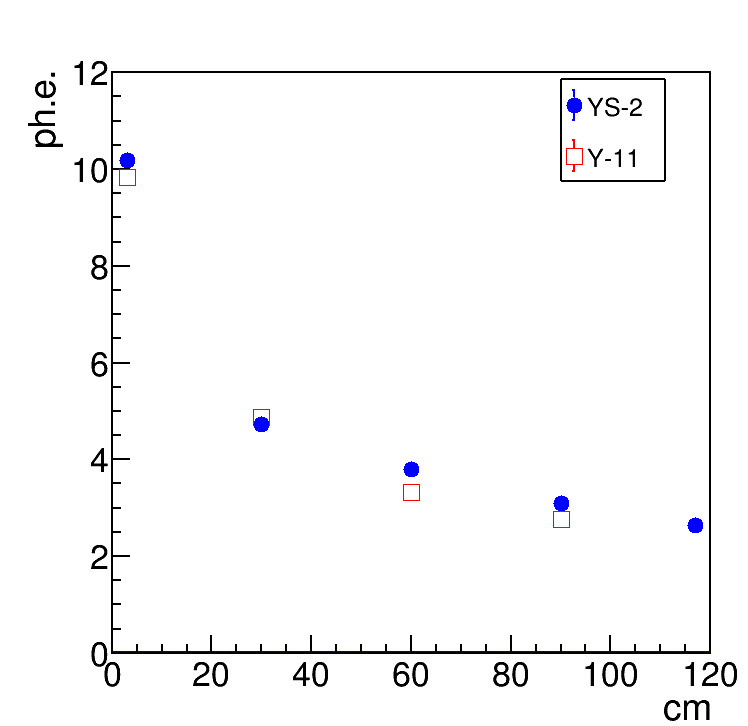
Measurement of light attenuation was performed with the help of 90Sr beta source placed above a rectangular piece of the scintillator ( mm3) with a hole drilled along its 30 mm side. A scintillation counter was placed below the scintillator with the hole and allowed to trig on the electrons passing through it. The set of the source and scintillators may slide along the tested fiber for measurements at various distances. 1.2 m length pieces were used, polished on both ends with SiPM attached to one end. Median light output in photo-electrons is shown in figure 8 as a function of the distance from the readout end. Longitudinal attenuation of YS-2 looks to be as small as of Y-11. Our YS-2 samples were relatively short, so we cannot compare our attenuation length value for YS-2 ( m), calculated using the data between 0.3 and 1.2 m, with manufacture’s value of 3.5 m, corresponding to distances m [7].
5 Conclusions
Timing response of scintillation counters with WLS fibers is already studied relatively well [8, 9, 10] and many more. The decay time measured for Y-11 fiber is in an agreement with the previous measurement [9]. In that work a fit of large (many photons) signal shape was performed and the result was ns for Y-11(M200) and ns for Y-11(MS250). This time is essentially larger than that of BCF-92 by Saint-Gobain [11] ( ns [9]). But BCF-92 demonstrates significantly lower light yield – the average ratio for various scintillation materials and the same detector geometry between Y-11 and BCF-92 is [10]. For the new Kuraray WLS YS-2 the light output and attenuation length are as good as of Y-11. The decay time of YS-2 is nearly two times shorter. This makes YS-2 a good choice for timing measurements, leaving well behind Y-11 with its comparatively large decay time and BCF-92 with its comparatively low light yield.
Acknowledgments
This work is supported by the Ministry of Science and Higher Education of the Russian Federation under Contract No. 075-15-2020-778.
References
- [1] V. Duk et al., JINST 11 (2016) P06001
- [2] A. Amirkhanov et al., Nucl. Instrum. Meth. in Physics Research A 936 (2019) 598
- [3] Svirida D J. Phys. Conf. Ser. 1690 (1) (2020) 012179
- [4] Short Decay time Wavelength Shifter (YS-series). http://kuraraypsf.jp/pdf/YSSeries_201007.pdf
- [5] M. Abramowitz and I. Stegun, eds., Handbook of Mathematical Functions, Dover, New York, 1972
- [6] I.G. Alekseev et al., Instruments and Experimental Techniques 61 (3) (2018) 349
- [7] Plastic Scintillating Fibers. https://www.kuraray.com/uploads/5a717515df6f5/PR0150_psf01.pdf
- [8] R. Wojcik et al., Nuclear Instruments and Methods in Physics Research A 342 (1994) 416
- [9] V. Brekhovskih et al., The WLS Fiber Time Properties Study, Preprint CERN-LHCb-2000-039
- [10] G.I. Britvich et al., Instruments and Experimental Techniques 58 (2) (2015) 211
- [11] Organic Scintillation Materials and Assemblies. https://www.crystals.saint-gobain.com/sites/imdf.crystals.com/files/documents/organics-plastic-scintillators.pdf