Site-Resolved Imaging of Bosonic Mott Insulator of 7Li atoms
Abstract
We demonstrate a single-site and single-atom-resolved fluorescence imaging of a bosonic Mott insulator of 7Li atoms in an optical lattice. The fluorescence images are obtained by implementing Raman sideband cooling on a deep two-dimensional square lattice, where we collect scattered photons with a high numerical aperture objective lens. The square lattice is created by a folded retro-reflected beam configuration that can reach 2.5 mK lattice depth from a single laser source. The lattice beam is elliptically focused to have a large area with deep potential. On average 4,000 photons are collected per atom during 1 s of the Raman sideband cooling, and the imaging fidelity is over 95 in the central 8080 lattice sites. As a first step to study correlated quantum phases, we present the site-resolved imaging of a Mott insulator. Tuning the magnetic field near the Feshbach resonance, the scattering length can be increased to 680, and we are able to produce a large-sized unity filling Mott insulator with 2,000 atoms at low temperature. Our work provides a stepping stone to further in-depth investigations of intriguing quantum many-body phases in optical lattices.
I Introduction
Ultracold atoms in optical lattices have been an outstanding platform for quantum simulations to study complex many-body quantum problems in a wide range of research [1, 2]. With the advent of the high-resolution imaging systems, the so-called quantum gas microscopes, the individual atoms that constitute the “synthetic” quantum materials can be imaged with near unity fidelity [3, 4]. This microscope system not only reveals intriguing features of many-body quantum states by directly measuring correlations between particles [5], but also control the atomic quantum state in a minimal physical unit [6], and thereby deepens our understandings of complex quantum phenomena. The site-resolved imaging technique been demonstrated for bosonic, 87Rb [3, 4] and 174Yb [7, 8], and fermionic,6Li [9, 10] and 40K [11, 12, 13], atoms in a two-dimensional square lattice. Recently the quantum gas microscope has been realized in a triangular lattice for bosonic 87Rb [14] and fermionic 6Li [15] atoms, facilitating the quantum simulation of frustrated systems [16, 17].
Among various microscope systems, however, only the Fermi gas microscopes (6Li and 40K) have used magnetic Feshbach resonance, which can change the -wave scattering length and the interactions in the system [18]. Taking advantages of the atomic properties, the Fermi gas microscopes have investigated a repulsive [19, 20, 21, 22] and an attractive [23] side of the Fermi-Hubbard model, observing a long-range anti-ferromagnetic spin orders at half filling [24] and evidence of a pseudo gap [25]. Like the Fermi gases, the bosonic 7Li isotopes display a broad Feshbach resonance near 738 G [26, 27] with a wide interaction tunability [28]. Additionally, the light atom mass provides the advantages of large recoil energy, so that its tunneling time can be faster than the other bosonic species with a broad resonance, i.e., 39K(133Cs) by a factor of 5.6(19). Because of the advantageous atomic property, growing interest has recently focused on 7Li atoms in optical lattices [29, 30, 31, 32, 33, 34]. Position-space Bloch oscillations have been directly observed in a tilted optical lattices [29], and the long-range transport of Bose condensates can be realized with additional periodic modulation of the lattice amplitude [30]. The system also provides interaction tunability between two atoms in a different sub-hyperfine levels [31], introducing a versatile experimental platform to study spin-1/2 Heisenberg XXZ spin models [32]. The spin interaction anisotropy dramatically changes the spin transport dynamics [32, 33], and a long-lived helix state is recently observed under a specific interaction anisotropy [34].
In this work, we report the quantum gas microscopy of 7Li atoms in a two-dimensional (2D) square optical lattice (Fig. 1). We have achieved single-site resolved fluorescence imaging by employing a Raman sideband cooling in a deep two-dimensional lattice. A single high-power laser at 1,064 nm wavelength is used to create the square optical lattice, where we exploit a folded retro-reflected beam configuration [35, 22]. At its maximal beam power, the lattice depth is 2.5 mK and the sideband frequency is 1.5 MHz, which satisfy the Lamb-Dicke condition. Additionally, a tightly focused light sheet potential confines the atoms in the image plane of the objective lens during the imaging. About 4,000 photons are collected per atom during the 1 s of imaging time, and we have achieved high imaging fidelity () over a large area of sites. To enter into a strongly interacting regime, we add a vertical accordion optical lattice that can dynamically change its lattice spacing from m to m. We select a single plane of the vertical lattices using the light sheet and observe a Mott insulating phase after ramping up the square lattice. Using the Feshbach resonance, we increase the -wave scattering length to 680 and produced a large sized unity filling Mott insulator with 2,000 atoms and low entropy per particle, .
This paper is organized as follows. In Sec.II, we present the experimental setup of the quantum gas microscope including lattices, Raman sideband cooling, and high-resolution imaging system. The experimental sequences to prepare a single layer of 2D degenerate quantum gases in three dimensions are also introduced. In Sec.III, fluorescence images and site occupation analysis algorithm are described. In Sec.IV, we report the single-site resolved imaging of the Mott insulator with tunable interaction by using the Feshbach resonance, and conclude with an outlook in Sec.V.
II Experimental Setup
II.1 Optical Transport
The experiment begins by transporting pre-cooled 7Li gases captured in a vacuum chamber (main chamber) to an adjacent vacuum chamber (science chamber), where a high-resolution imaging system is installed. The central displacement between the two vacuum chambers is 460 mm, and we transport the cold thermal gases in the main chamber to the science chamber by moving the focal position of an optical potential (transport trap) [36, 37]. The transport trap is made of a 1,064 nm laser beam and has a pancake-shaped geometry with a vertical (lateral) beam waist of m at the main chamber. By mounting a cylindrical lens on an air-bearing stage (ABL1000, AeroTech), we are able to translate the focal position upto 1 m. The vertical beam waist at the science chamber is increased to 58m because of beam clipping at the entrance of the viewport. To maintain a similar trap depth during transport, we weakly focused the lateral beam waist to 300m at the target distance.
In the experiment, the cold gases are prepared after an evaporation cooling in a magnetic trap [38]. Ramping up the transport beam to 3.3 W in 200 ms at the end of the cooling process, we are able to load of thermal gases at K. To reduce heating and atom loss, we flip the spin state from an upper hyperfine state () to a lower hyperfine state () in the optical potential. Then, we increase the beam power to 12.3 W and move its focal point to follow a sigmoidal curve that accelerates with a maximum of 2.1 to the midpoint and symmetrically decelerates afterwards. The acceleration can reduce the trap depth along the optical axis, and the minimal trap depth during the transport is K. After 1.3 s of transport time, cold atoms can be prepared in the science chamber.
II.2 Quantum gases in a single layer of the optical lattice
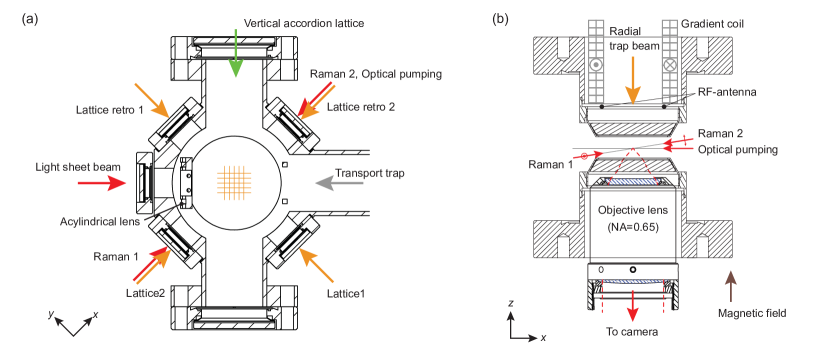
To prepare 2D degenerate Bose gases, we transfer the thermal clouds in the transport trap into a tightly focused light sheet beam. Inserting an acylindrical lens (Asphericon) inside the vacuum chamber [Fig. 2(a)], a 1,064 nm laser beam is focused to have beam waists with m in the vertical (lateral) direction. An evaporation process is carried out at a constant scattering length , where is the Bohr radius. A field gradient of 37 G/cm is applied along the vertical axis to reduce the potential depth without losing its harmonic confinement [Fig. 2(b)], and thereby produce efficient evaporation cooling in the optical trap [39]. After 300 ms evaporation, pure condensates containing 10,000 atoms can be produced.
Then, we load the atoms into a single layer of the vertical lattice. The vertical lattice is made by a 532 nm laser beam, and we employ an accordion lattice setup to ensure a stable loading process [40, 41]. The light source is obtained by a single-pass frequency doubling of 1,064 nm light with a nonlinear crystal (PP-Mg:SLT, Oxide). About 1 W of green beam is delivered to the science chamber using a high power air gap optical fiber (QPMJ-A3AHPM, OZ optics). Splitting the output beam into two parallel propagating beams and focusing them with an aspheric lens (AL50100-A, Thorlabs), we create the vertical lattice at the crossing position. To make a large Mott insulator, the two beams are elliptically focused with a beam waist of 34(300) m along the vertical(lateral) direction. The lattice spacing can be tuned from 12 m to 2 m by changing the relative distance between the two beams (XMS50-S, Newport) [41]. Starting from a large lattice spacing, we are able to load the quantum gases into a single node of the vertical lattice, and then adiabatically compress the atoms. The vertical frequency after compression is 23(2) kHz. During the loading process, we gradually turned off the light sheet potential and confined the atoms in the two dimensional plane using an additional radial trap beam [Fig. 2(b)]. The final number and temperature of the atoms can be controlled by reducing the trap depth of the radial trap beam.
II.3 Two-dimensional square optical lattice
Fluorescence imaging of atoms in optical lattices requires a high power laser system to preserve the positional information of the atoms during the light scattering process. Moreover, light atoms like 6Li and 7Li are vulnerable to laser noise because of its high on-site frequency [42, 43], and thus a high-power and low-noise laser system has to be implemented for the quantum gas microscope [44]. We obtain the high power 1,064 nm lattice beam from a Yb-doped fiber amplifier system (ALS-IR-1064-50-CC, Azurlight), seeded by a narrow linewidth laser (Mephisto2000 NE, Coherent). The maximal beam power is 45 W after an internal isolator (30 dB), and a 30 dB high power isolator (Pavos-Ultra, EOT) is added to prevent any feedback from a reflected light.
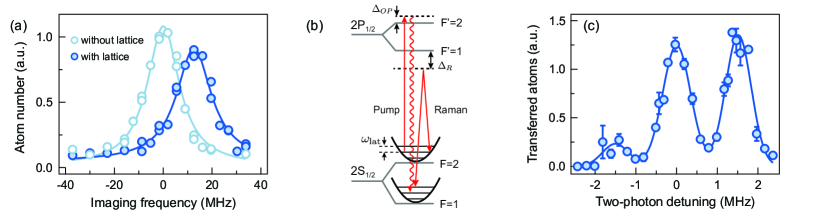
The optical lattice is created by a folded retro-reflected standing wave configuration, where four vertically polarized beams are interfered to make a square lattice with its spacing . This provides an economical solution to realize deep optical lattices with limited optical power [35], which was first implemented in the 6Li quantum gas microscope [22] and recently extended to a triangular lattice geometry [15]. In our setup, we use an elliptically focused () lattice beam to increase the beam size in the - plane with sufficient potential depth for the fluorescence imaging. The folding angle between the two lattice arms is nearly 90∘, and we optimize the lattice overlap between the incoming and retro-reflecting beam by studying the Kapitza-Dirac diffraction of a Bose-Einstein condensate. At a given lattice power, the number of atoms in the zero-th order is minimized after a short pulse of 2s. The lattice depth at its full power (30 W) is calibrated by measuring the light shift from the lattice beam. Studying a resonant transition line (), we observe a 12.6 MHz of blue-shift under the lattice beam [Fig. 3(a)]. Considering the ac polarizabilities of the and states at 1,064 nm [45], it corresponds to the for the ground state, and the on-site frequency of the lattice is MHz.
While most of the tunneling dynamics occurs at shallow lattice depth (tens of ), the atoms have to be fully pinned in each site at thousands of lattice depth for fluorescence imaging. Here, the kHz is the recoil energy of the lattice, and is Planck’s constant. To control the lattice depth over such a wide dynamic range, we employ a two-stage power control system: (1) regulating the rf power input to the acousto-optical modulator (AOM-3080-199, Gooch and Housego). (2) variable power attenuation from its full power by rotating a -waveplate (DDR25, Thorlabs). Combining two stages, we have over 30dB dynamic range. Operating the system at low power (100 mW), the light intensity is stablized by an analog PID controller (SIM960, SRS), and the relative intensity-noise of the lattice beam is below dBc/Hz in the kHz frequency range. Before taking the fluorescence imaging, the lattice depth is first increased to in s, and then we rotate the waveplate to have potential depth in 100 ms.
II.4 Raman sideband cooling
To maintain the atomic position in each lattice site during the fluorescence imaging, we apply Raman sideband cooling in the deep optical lattice. The scheme is based on a two-photon Raman sideband transition between two lowest hyperfine ground states while lowering the vibrational state in each lattice potential. The cooling cycle is completed by optically pumping the atomic hyperfine state to its initial state without changing the motional state. After many cycles, most of the atoms can be populated in the motional ground state, which is the dark state to the Raman laser light. Heating can occur when the vibrational state changes during the repumping process so that it requires the Lamb-Dicke regime and a tight confinement of the lattice ( MHz for Lithium atoms).
The experimental scheme for the Raman sideband cooling of 7Li atoms in shown in Fig. 3(b). The atoms in the lowest hyperfine state are transferred to the upper hyperfine state via the two-photon transition. In the experiment, we apply a linearly polarized laser light, which is 7 GHz red tuned to the transition line, and is focused with a beam waist of m at the lattice center. The incoming beam is retro-reflected [Fig. 2(a)] after passing through an acousto-optic modulator (MT350-B120, AA Opto Electronics) to control Raman detuning. The polarization of the retro-beam is also linear, but is orthogonal to the incoming beam. The optical pumping beam is circularly polarized and is applied through the diagonal axis of the lattice. It is 3 MHz blue-detuned to the transition in a free space. The magnetic field is compensated to below 50 mG, and we set its direction to point along the axis.
From the sideband spectroscopy, the level spacing of the deep lattice is determined to MHz [Fig. 3(c)], and the Lamb-Dicke parameter for the Raman transition is , where is the Raman wave vector projected along the lattice axis. The Lamb-Dicke parameter for the pumping beam is . The Raman cooling in the vertical axis is inefficient, as the maximal confinement of the sheet potential is kHz. Still, this configuration has provided sufficient imaging fidelity [22, 15]. This is because the vibrational state along the axis can be coupled to the motional state in the square lattice by the small tilting angle of the Raman beam, having effective cooling in the vertical axis.
II.5 High-resolution Imaging system
A high numerical aperture (NA=0.65) objective lens (54-26-20@532-1,064, Navitar), which collects scattered photons during the optical pumping process, is placed below a bucket-shaped window [Fig. 2(b)]. The objective lens is designed to compensate wavefront distortion from the vacuum glass (fused silica, 5 mm thickness) when the lens axis is normal to the surface of our vacuum window and to have diffraction limited performance at 671-1,064 nm with field of view 150150m2. The working distance of the objective is 13 mm, and its effective focal length is 20 mm. The high-resolution imaging system is completed by placing an achromatic doublet (AC508-750-B, Thorlabs) with a focal length of 750 mm, and the photon number is counted by a low-noise CMOS camera (Zyla 4.2 PLUS, Andor) with a magnification factor of 37.5. To adjust the objective plane, we use a high precision objective piezo scanner (P-725.1CA, Physik Instrumente) and mount them on a multi-axis tilt platform (M-37, Newport). We note that the flat surface of the objective lens helps the initial alignment procedure [Fig. 2(b)] with the aid of wavefront interferometry. An incoming laser light towards the objective can be reflected on the flat lens surface, interfering with the reflected beam on the bottom window. Making co-centric interference ring patterns and reducing its fringe number, we are able to align the axis of the objective lens normal to the vacuum window within 1 mrad uncertainty.
III Single site-resolved Imaging
III.1 Imaging resolution
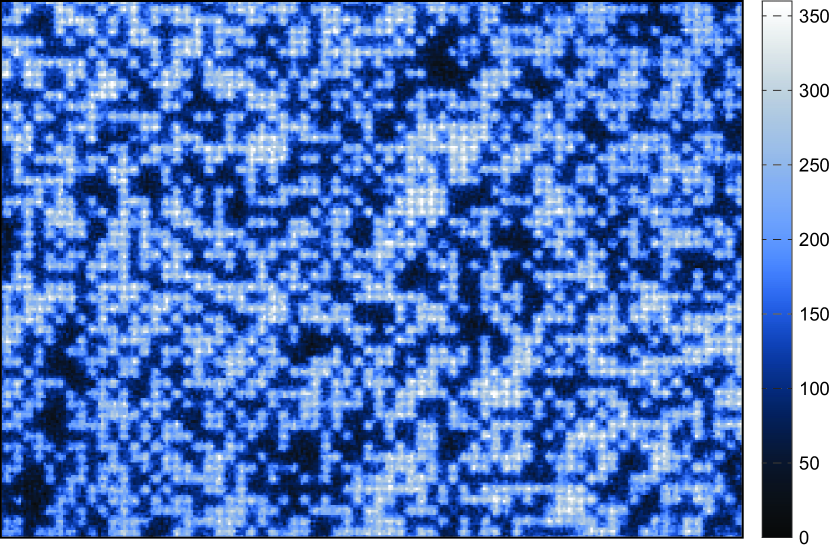
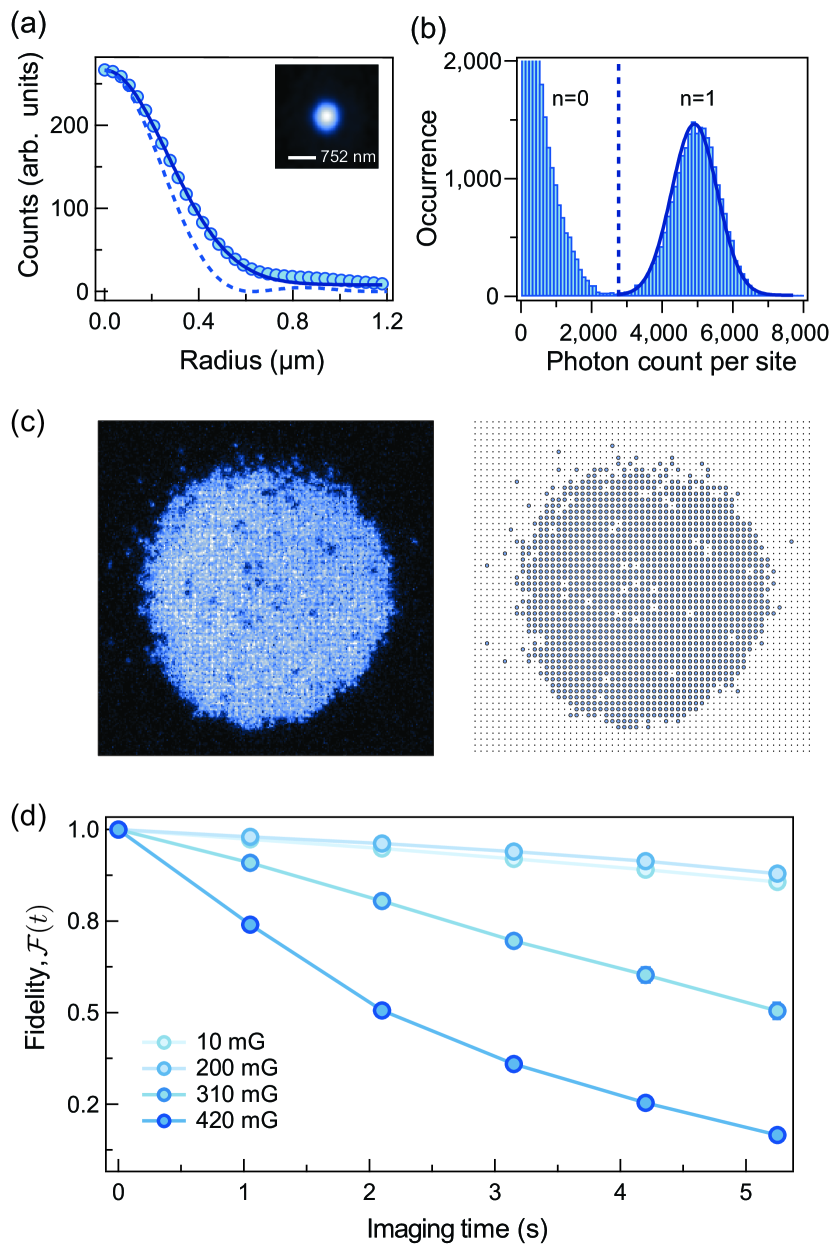
Figure 1 displays the fluorescence imaging obtained by continuously operating the Raman sideband cooling in the deep lattice. During the imaging process, we freeze the atoms in the image plane of the objective lens by increasing the depth of the sheet potential to 0.83 mK. Even without post image processing, we are able to identify the square lattice structure. To characterize and to optimize the detection fidelity, we have measured the point spread function (PSF) of our imaging system. Preparing sparsely filled cold atoms in the two-dimensional lattice, isolated images of single atoms can be obtained [Fig. 4(a)]. The PSF is well approximated by a 2D Gaussian function and its full width half maximum (FWHM) is 630 nm. This corresponds to 19% larger than the diffraction limit, but still smaller than the lattice spacing ( nm), so that we have achieved single-site resolution.
III.2 Imaging fidelity analysis
To convert the fluorescence images to a 2D array of atom occupation, we apply the following reconstruction algorithm. Taking Fast Fourier Transform (FFT) of the raw images, we first find the lattice vectors and relative phases between them. The angle between the lattice vectors is , close to an ideal square lattice. The phase information of the lattice is extracted by fitting a projected image along one of the principal axes to a sinusoidal function with a Gaussian envelope [14, 15]. After constructing the lattice structure, we partition the raw images site by site and deconvolute the images using the measured PSF. Summing up the photon counts in each lattice site , we plot its histogram [e.g., Fig. 4(b)]. It shows two peaks near and , representing an empty and occupied site, respectively. Setting the threshold count for number occupation by the intersection point between the peaks, we accurately extract the site occupation of the fluorescence images [Fig. 4(c)]. From the analysis, we conclude that on average 4,000 photons per atom are collected during the 1 s of exposure time. It corresponds to a fluorescence scattering rate is 50 kHz given that the collection efficiency of our imaging system is .
The imaging fidelity is investigated by studying the hopping and loss rate of the atoms during the imaging process. After preparing a uniform array of atoms or unity filling Mott insulator, we take 6 successive images with 1 s of exposure time and 50 ms of interval time. The imaging fidelity is defined as
| (1) |
where is the atom occupation number at lattice position at time .
With the image analysis protocol we optimize the parameters for the Raman sideband cooling process in a way that maximizes the imaging fidelity with sufficient fluorescent count to detect the site occupation. We observe that the fluorescent photon count increases with stronger Raman beam intensities and smaller detuning, but it also promotes off-resonant photon scattering processes, and reduces the imaging fidelity. At the optimal conditions, the Raman beams have 1 mW and 0.6 mW of beam power with 50 kHz of two-photon Rabi frequency. Moreover, we apply a sinusoidal modulation of the sideband frequency so that the two-photon detuning of the Raman beam follows, . Here, MHz is the hyperfine splitting energy of the ground state, kHz and kHz are the amplitude and frequency of the modulation, respectively. The frequency modulation can counteract the reduction in sideband frequency caused by the Gaussian beam profiles of the lattice beam, and thus provides a large imaging area. Under these conditions, we have an imaging fidelity of 96.1(3)% with a loss rate of 3.2(4)% and hopping rate of 0.7(4)% [Fig. 4(d)].
IV Site-resolved imaging of Mott Insulator
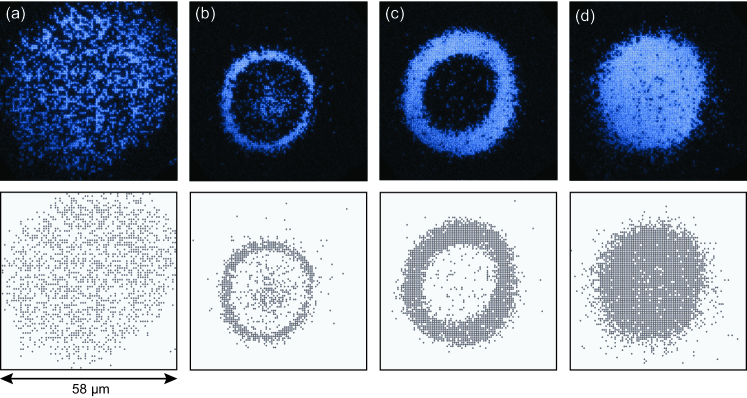
Equipped with the site-resolved imaging system, we are able to directly observe the superfluid and Mott insulator phases in the two-dimensional square optical lattice (Fig. 5). Preparing a few thousands atoms in the single plane, we ramp up the 2D lattice potential in 50 ms. At low lattice depth (1), the particle occupation fluctuates from each independent experimental run, and the variance of the parity-projected atom number is saturated at the trap center. These are the characteristic features of a BEC in a lattice, where the mean occupation number follows after the parity projection [3, 4]. In contrast, at higher lattice depth (), we observe plateaus of constant integer site occupations with almost vanishing fluctuations, directly observing the Mott insulator.
To demonstrate the scattering length tunability of 7Li atoms using the Feshbach resonance, we create the Mott insulator under various magnetic fields. Even with the same atom number, we observe the central filling of the Mott insulator varies from to [Fig. 5(b)-(d)] as the magnetic field increases. In particular, with a large scattering length , we can generate a large size unity filling Mott insulator having 2,500 atoms [Fig. 5(d)] with a diameter of 60 sites. Such a large system size can reduce finite size effects and could be essential for measuring critical exponents near phase transitions. Increasing the magnetic field further to have , we observe significant atom loss and heating so that a cold Mott insulator cannot be created. In this regime, the lifetime of the atoms strongly depends on the scattering length and the harmonic curvature, indicating that we are limited by the three-body atom loss [46].
We determine the parameters in the Hubbard Hamiltonian, (nearest neighbor tunneling energy) and (onsite interaction energy) by performing lattice modulation spectroscopy [47]. The tunneling strength can be estimated by measuring the band gap at different lattice depths, where we observe three peaks in the second excited bands. Making almost the same intensities of the two incoming lattice beams [lattice1 and lattice2 beam in Fig. 2(a)] and maximizing the beam overlaps of the retro-reflected lattice beams, we achieve nearly isotropic tunneling energy in the square lattice (anisotropy is less than 10). Similarly, we determine the on-site interaction energy by directly observing doublon formation when the lattice modulation frequency becomes .
In the best condition, the temperature is estimated to , which is comparable to the spin exchange energy in a 1D system [32] assuming that the is fixed at different lattice depths. We expect that the temperature of the atoms can be reduced by improving the preparation sequence of the Mott insulating phase. For example, the condensate size before the lattice ramp up is larger than the size of the Mott insulator (Fig. 5) so that the slow thermalization time in the insulating phase might lead to holes [48]. Another direction for reducing temperature is potential engineering that redistributes the entropy of the system [49], which is reported in Fermi gases of 6Li atoms [24, 50].
V Conclusions and outlook
In conclusion, we have achieved a single-site and single-atom resolved imaging of a strongly interacting bosonic Mott insulator of 7Li atoms. Employing Raman sideband cooling in a deep square lattice, we collect on average 4,000 photons per atom in a second and have imaging fidelity of 95% in a large area of 8080 sites. Tuning the interaction near the Feshbach resonance, we are able to produce a cold unity filling Mott insulator with 2,000 atoms at temperature of . The large-sized system might allow us to study a finite size scaling, playing a central role in the studies phase transitions. Our imaging system enables measurement of the density and spin correlations at arbitrary distances and can be utilized to address individual atoms in each lattice site.
With this new platform, we could study various phases in a multi-component Bose-Hubbard Hamiltonian [51, 52, 53, 54], such as exotic superfluid phases [51, 54] and magnetic ordered states [52, 53], and the dynamics of spin correlation in the XXZ spin-1/2 Heisenberg Hamiltonian [55, 56, 57, 58]. Furthermore, tuning the magnetic field to have an attractive interaction, we could observe stable discrete solitons in higher dimensional optical lattices [59, 60, 61] and a macroscopic entangled state over different lattice sites [62, 63]. Lastly, strong three-body atom loss, which is often avoided, could be utilized to engineer effective hard-core three-body interactions, and intriguing superfluid phases could be observed in the attractive side of the Feshbach resonance [64, 65, 66].
Acknowledgements.
We acknowledge discussion with I. Bloch, C. Gross, J. Koepsell, A. Omran, G. Salomon, P. Schauß, and Y. Takahashi. We are funded by Samsung Science and Technology Foundation BA1702-06, National Research Foundation of Korea Grant No.2019M3E4A1080401 and 2020R1C1C1010863. K. Kim is supported by KAIST up program.References
- Gross and Bloch [2017] C. Gross and I. Bloch, Quantum simulations with ultracold atoms in optical lattices, Science 357, 995 (2017).
- Schäfer et al. [2020] F. Schäfer, T. Fukuhara, S. Sugawa, Y. Takasu, and Y. Takahashi, Tools for quantum simulation with ultracold atoms in optical lattices, Nat. Rev. Phys. 2, 411 (2020).
- Bakr et al. [2009] W. S. Bakr, J. I. Gillen, A. Peng, S. Fölling, and M. Greiner, A quantum gas microscope for detecting single atoms in a Hubbard-regime optical lattice, Nature (London) 462, 74 (2009).
- Sherson et al. [2010] J. F. Sherson, C. Weitenberg, M. Endres, M. Cheneau, I. Bloch, and S. Kuhr, Single-atom-resolved fluorescence imaging of an atomic Mott insulator, Nature (London) 467, 68 (2010).
- Endres et al. [2011] M. Endres, M. Cheneau, T. Fukuhara, C. Weitenberg, P. Schauß, C. Gross, L. Mazza, M. C. Bañuls, L. Pollet, I. Bloch, and S. Kuhr, Observation of Correlated Particle-Hole Pairs and String Order in Low-Dimensional Mott Insulators, Science 334, 200 (2011).
- Weitenberg et al. [2011] C. Weitenberg, M. Endres, J. F. Sherson, M. Cheneau, P. Schauß, T. Fukuhara, I. Bloch, and S. Kuhr, Single-spin addressing in an atomic Mott insulator., Nature (London) 471, 319 (2011).
- Miranda et al. [2015] M. Miranda, R. Inoue, Y. Okuyama, A. Nakamoto, and M. Kozuma, Site-resolved imaging of ytterbium atoms in a two-dimensional optical lattice, Phys. Rev. A 91, 063414 (2015).
- Yamamoto et al. [2016] R. Yamamoto, J. Kobayashi, T. Kuno, K. Kato, and Y. Takahashi, An ytterbium quantum gas microscope with narrow-line laser cooling, New J. Phys. 18, 023016 (2016).
- Parsons et al. [2015] M. F. Parsons, F. Huber, A. Mazurenko, C. S. Chiu, W. Setiawan, K. Wooley-Brown, S. Blatt, and M. Greiner, Site-Resolved Imaging of Fermionic in an Optical Lattice, Phys. Rev. Lett. 114, 213002 (2015).
- Omran et al. [2015] A. Omran, M. Boll, T. A. Hilker, K. Kleinlein, G. Salomon, I. Bloch, and C. Gross, Microscopic Observation of Pauli Blocking in Degenerate Fermionic Lattice Gases, Phys. Rev. Lett. 115, 263001 (2015).
- Cheuk et al. [2015] L. W. Cheuk, M. A. Nichols, M. Okan, T. Gersdorf, V. V. Ramasesh, W. S. Bakr, T. Lompe, and M. W. Zwierlein, Quantum-Gas Microscope for Fermionic Atoms, Phys. Rev. Lett. 114, 193001 (2015).
- Haller et al. [2015] E. Haller, J. Hudson, A. Kelly, D. A. Cotta, B. Peaudecerf, G. D. Bruce, and S. Kuhr, Single-atom imaging of fermions in a quantum-gas microscope, Nat. Phys. 11, 738 (2015).
- Edge et al. [2015] G. J. A. Edge, R. Anderson, D. Jervis, D. C. McKay, R. Day, S. Trotzky, and J. H. Thywissen, Imaging and addressing of individual fermionic atoms in an optical lattice, Phys. Rev. A 92, 063406 (2015).
- Yamamoto et al. [2020] R. Yamamoto, H. Ozawa, D. C. Nak, I. Nakamura, and T. Fukuhara, Single-site-resolved imaging of ultracold atoms in a triangular optical lattice, New J. Phys. 22, 123028 (2020).
- Yang et al. [2021] J. Yang, L. Liu, J. Mongkolkiattichai, and P. Schauss, Site-Resolved Imaging of Ultracold Fermions in a Triangular-Lattice Quantum Gas Microscope, PRX Quantum 2, 020344 (2021).
- Wannier [1950] G. H. Wannier, Antiferromagnetism. the triangular ising net, Phys. Rev. 79, 357 (1950).
- Anderson [1987] P. W. Anderson, The Resonating Valence Bond State in La2CuO4 and Superconductivity, Science 235, 1196 (1987).
- Chin et al. [2010] C. Chin, R. Grimm, P. Julienne, and E. Tiesinga, Feshbach resonances in ultracold gases, Rev. Mod. Phys. 82, 1225 (2010).
- Parsons et al. [2016] M. F. Parsons, A. Mazurenko, C. S. Chiu, G. Ji, D. Greif, and M. Greiner, Site-resolved measurement of the spin-correlation function in the Fermi-Hubbard model, Science 353, 1253 (2016).
- Boll et al. [2016] M. Boll, T. A. Hilker, G. Salomon, A. Omran, J. Nespolo, L. Pollet, I. Bloch, and C. Gross, Spin- and density-resolved microscopy of antiferromagnetic correlations in Fermi-Hubbard chains, Science 353, 1257 (2016).
- Cheuk et al. [2016] L. W. Cheuk, M. A. Nichols, K. R. Lawrence, M. Okan, H. Zhang, E. Khatami, N. Trivedi, T. Paiva, M. Rigol, and M. W. Zwierlein, Observation of spatial charge and spin correlations in the 2D Fermi-Hubbard model, Science 353, 1260 (2016).
- Brown et al. [2017] P. T. Brown, D. Mitra, E. Guardado-Sanchez, P. Schauß, S. S. Kondov, E. Khatami, T. Paiva, N. Trivedi, D. A. Huse, and W. S. Bakr, Spin-imbalance in a 2D Fermi-Hubbard system, Science 357, 1385 (2017).
- Mitra et al. [2018] D. Mitra, P. T. Brown, E. Guardado-Sanchez, S. S. Kondov, T. Devakul, D. A. Huse, P. Schauß, and W. S. Bakr, Quantum gas microscopy of an attractive Fermi–Hubbard system, Nat. Phys. 14, 173 (2018).
- Mazurenko et al. [2017] A. Mazurenko, C. S. Chiu, G. Ji, M. F. Parsons, M. Kanász-Nagy, R. Schmidt, F. Grusdt, E. Demler, D. Greif, and M. Greiner, A cold-atom Fermi–Hubbard antiferromagnet, Nature (London) 545, 462 (2017).
- Brown et al. [2020] P. T. Brown, E. Guardado-Sanchez, B. M. Spar, E. W. Huang, T. P. Devereaux, and W. S. Bakr, Angle-resolved photoemission spectroscopy of a Fermi–Hubbard system, Nat. Phys. 16, 26 (2020).
- Gross et al. [2010] N. Gross, Z. Shotan, S. Kokkelmans, and L. Khaykovich, Nuclear-Spin-Independent Short-Range Three-Body Physics in Ultracold Atoms, Phys. Rev. Lett. 105, 103203 (2010).
- Dyke et al. [2013] P. Dyke, S. E. Pollack, and R. G. Hulet, Finite-range corrections near a Feshbach resonance and their role in the Efimov effect, Phys. Rev. A 88, 023625 (2013).
- Pollack et al. [2009a] S. E. Pollack, D. Dries, M. Junker, Y. P. Chen, T. A. Corcovilos, and R. G. Hulet, Extreme Tunability of Interactions in a Bose-Einstein Condensate, Phys. Rev. Lett. 102, 090402 (2009a).
- Geiger et al. [2018] Z. A. Geiger, K. M. Fujiwara, K. Singh, R. Senaratne, S. V. Rajagopal, M. Lipatov, T. Shimasaki, R. Driben, V. V. Konotop, T. Meier, and D. M. Weld, Observation and Uses of Position-Space Bloch Oscillations in an Ultracold Gas, Phys. Rev. Lett. 120, 213201 (2018).
- Fujiwara et al. [2019] C. J. Fujiwara, K. Singh, Z. A. Geiger, R. Senaratne, S. V. Rajagopal, M. Lipatov, and D. M. Weld, Transport in Floquet-Bloch Bands, Phys. Rev. Lett. 122, 010402 (2019).
- Amato-Grill et al. [2019] J. Amato-Grill, N. Jepsen, I. Dimitrova, W. Lunden, and W. Ketterle, Interaction spectroscopy of a two-component Mott insulator, Phys. Rev. A 99, 033612 (2019).
- Jepsen et al. [2020] P. N. Jepsen, J. Amato-Grill, I. Dimitrova, W. W. Ho, E. Demler, and W. Ketterle, Spin transport in a tunable Heisenberg model realized with ultracold atoms, Nature (London) 588, 403 (2020).
- Jepsen et al. [2021a] P. N. Jepsen, W. W. Ho, J. Amato-Grill, I. Dimitrova, E. Demler, and W. Ketterle, Transverse spin dynamics in the anisotropic Heisenberg model realized with ultracold atoms, arXiv:2103.07866 (2021a).
- Jepsen et al. [2021b] P. N. Jepsen, Y. K. Lee, H. Lin, I. Dimitrova, Y. Margalit, W. W. Ho, and W. Ketterle, Catching Bethe phantoms and quantum many-body scars: Long-lived spin-helix states in Heisenberg magnets, arXiv:2110.12043 (2021b).
- Sebby-Strabley et al. [2006] J. Sebby-Strabley, M. Anderlini, P. S. Jessen, and J. V. Porto, Lattice of double wells for manipulating pairs of cold atoms, Phys. Rev. A 73, 033605 (2006).
- Gustavson et al. [2001] T. L. Gustavson, A. P. Chikkatur, A. E. Leanhardt, A. Görlitz, S. Gupta, D. E. Pritchard, and W. Ketterle, Transport of Bose-Einstein Condensates with Optical Tweezers, Phys. Rev. Lett. 88, 020401 (2001).
- Gross et al. [2016] C. Gross, H. C. J. Gan, and K. Dieckmann, All-optical production and transport of a large quantum gas in a crossed optical dipole trap, Phys. Rev. A 93, 053424 (2016).
- Kim et al. [2019] K. Kim, S. Huh, K. Kwon, and J.-y. Choi, Rapid production of large bose-einstein condensates using gray molasses, Phys. Rev. A 99, 053604 (2019).
- Hung et al. [2008] C.-L. Hung, X. Zhang, N. Gemelke, and C. Chin, Accelerating evaporative cooling of atoms into bose-einstein condensation in optical traps, Phys. Rev. A 78, 011604(R) (2008).
- Mitra et al. [2016] D. Mitra, P. T. Brown, P. Schauß, S. S. Kondov, and W. S. Bakr, Phase separation and pair condensation in a spin-imbalanced 2d fermi gas, Phys. Rev. Lett. 117, 093601 (2016).
- Ville et al. [2017] J. L. Ville, T. Bienaimé, R. Saint-Jalm, L. Corman, M. Aidelsburger, L. Chomaz, K. Kleinlein, D. Perconte, S. Nascimbène, J. Dalibard, and J. Beugnon, Loading and compression of a single two-dimensional bose gas in an optical accordion, Phys. Rev. A 95, 013632 (2017).
- Savard et al. [1997] T. A. Savard, K. M. O’Hara, and J. E. Thomas, Laser-noise-induced heating in far-off resonance optical traps, Phys. Rev. A 56, R1095 (1997).
- Gehm et al. [1998] M. E. Gehm, K. M. O’Hara, T. A. Savard, and J. E. Thomas, Dynamics of noise-induced heating in atom traps, Phys. Rev. A 58, 3914 (1998).
- Blatt et al. [2015] S. Blatt, A. Mazurenko, M. F. Parsons, C. S. Chiu, F. Huber, and M. Greiner, Low-noise optical lattices for ultracold , Phys. Rev. A 92, 021402(R) (2015).
- Safronova et al. [2012] M. S. Safronova, U. I. Safronova, and C. W. Clark, Magic wavelengths for optical cooling and trapping of lithium, Phys. Rev. A 86, 042505 (2012).
- Pollack et al. [2009b] S. E. Pollack, D. Dries, and R. G. Hulet, Universality in Three- and Four-Body Bound States of Ultracold Atoms, Science 326, 1683 (2009b).
- Stöferle et al. [2004] T. Stöferle, H. Moritz, C. Schori, M. Köhl, and T. Esslinger, Transition from a Strongly Interacting 1D Superfluid to a Mott Insulator, Phys. Rev. Lett. 92, 130403 (2004).
- Hung et al. [2010] C.-L. Hung, X. Zhang, N. Gemelke, and C. Chin, Slow Mass Transport and Statistical Evolution of an Atomic Gas across the Superfluid–Mott-Insulator Transition, Phys. Rev. Lett. 104, 160403 (2010).
- Bernier et al. [2009] J.-S. Bernier, C. Kollath, A. Georges, L. De Leo, F. Gerbier, C. Salomon, and M. Köhl, Cooling fermionic atoms in optical lattices by shaping the confinement, Phys. Rev. A 79, 061601(R) (2009).
- Chiu et al. [2018] C. S. Chiu, G. Ji, A. Mazurenko, D. Greif, and M. Greiner, Quantum State Engineering of a Hubbard System with Ultracold Fermions, Phys. Rev. Lett. 120, 243201 (2018).
- Kuklov and Svistunov [2003] A. B. Kuklov and B. V. Svistunov, Counterflow Superfluidity of Two-Species Ultracold Atoms in a Commensurate Optical Lattice, Phys. Rev. Lett. 90, 100401 (2003).
- Duan et al. [2003] L.-M. Duan, E. Demler, and M. D. Lukin, Controlling Spin Exchange Interactions of Ultracold Atoms in Optical Lattices, Phys. Rev. Lett. 91, 090402 (2003).
- Altman et al. [2003] E. Altman, W. Hofstetter, E. Demler, and M. D. Lukin, Phase diagram of two-component bosons on an optical lattice, New J. Phys. 5, 113 (2003).
- Kuklov et al. [2004] A. Kuklov, N. Prokof’ev, and B. Svistunov, Commensurate two-component bosons in an optical lattice: Ground state phase diagram, Phys. Rev. Lett. 92, 050402 (2004).
- Mathy et al. [2012] C. Mathy, M. Zvonarev, and E. Demler, Quantum flutter of supersonic particles in one-dimensional quantum liquids, Nat. Phys. 8, 881 (2012).
- Fukuhara et al. [2013] T. Fukuhara, P. Schauß, M. Endres, S. Hild, M. Cheneau, I. Bloch, and C. Gross, Microscopic observation of magnon bound states and their dynamics, Nature (London) 502, 76 (2013).
- Ljubotina et al. [2019] M. Ljubotina, M. Žnidarič, and T. Prosen, Spin diffusion from an inhomogeneous quench in an integrable system, Nat. Commun. 8, 16117 (2019).
- Gopalakrishnan and Vasseur [2019] S. Gopalakrishnan and R. Vasseur, Kinetic Theory of Spin Diffusion and Superdiffusion in Spin Chains, Phys. Rev. Lett. 122, 127202 (2019).
- Efremidis et al. [2003] N. K. Efremidis, J. Hudock, D. N. Christodoulides, J. W. Fleischer, O. Cohen, and M. Segev, Two-Dimensional Optical Lattice Solitons, Phys. Rev. Lett. 91, 213906 (2003).
- Ahufinger et al. [2004] V. Ahufinger, A. Sanpera, P. Pedri, L. Santos, and M. Lewenstein, Creation and mobility of discrete solitons in Bose-Einstein condensates, Phys. Rev. A 69, 053604 (2004).
- Baizakov et al. [2004] B. B. Baizakov, B. A. Malomed, and M. Salerno, Multidimensional solitons in a low-dimensional periodic potential, Phys. Rev. A 70, 053613 (2004).
- Jack and Yamashita [2005] M. W. Jack and M. Yamashita, Bose-Hubbard model with attractive interactions, Phys. Rev. A 71, 023610 (2005).
- Buonsante et al. [2005] P. Buonsante, V. Penna, and A. Vezzani, Attractive ultracold bosons in a necklace optical lattice, Phys. Rev. A 72, 043620 (2005).
- Daley et al. [2009] A. J. Daley, J. M. Taylor, S. Diehl, M. Baranov, and P. Zoller, Atomic Three-Body Loss as a Dynamical Three-Body Interaction, Phys. Rev. Lett. 102, 040402 (2009).
- Diehl et al. [2010] S. Diehl, M. Baranov, A. J. Daley, and P. Zoller, Observability of Quantum Criticality and a Continuous Supersolid in Atomic Gases, Phys. Rev. Lett. 104, 165301 (2010).
- Bonnes and Wessel [2011] L. Bonnes and S. Wessel, Pair Superfluidity of Three-Body Constrained Bosons in Two Dimensions, Phys. Rev. Lett. 106, 185302 (2011).