NGC5846-UDG1: A galaxy formed mostly by star formation in massive, extremely dense clumps of gas
Abstract
It has been shown that ultra-diffuse galaxies (UDGs) have higher specific frequencies of globular clusters on average than other dwarf galaxies with similar luminosities. The UDG NGC5846-UDG1 is among the most extreme examples of globular cluster-rich galaxies found so far. Here we present new Hubble Space Telescope (HST) observations and analysis of this galaxy and its globular cluster system. We find that NGC5846-UDG1 hosts globular clusters, three to four times more than any previously known galaxy with a similar luminosity, and higher than reported in previous studies. With a galaxy luminosity of () and a total globular cluster luminosity of , we find that the clusters currently comprise of the total light. Taking into account the effects of mass loss from clusters during their formation and throughout their lifetime, we infer that most of the stars in the galaxy likely formed in globular clusters, and very little to no “normal” low-density star formation occurred. This result implies that the most extreme conditions during early galaxy formation promoted star formation in massive and dense clumps, in contrast to the dispersed star formation observed in galaxies today.
The Astrophysical Journal Letters
1 Introduction
Star formation in the Milky Way typically proceeds in molecular clouds with sizes of pc, leading to loose conglomerations of stars that slowly disperse within the Galaxy (Kennicutt & Evans, 2012). Star formation can also produce compact, gravitationally bound systems (Krumholz et al., 2019), the most massive of which become long-lived globular clusters (Kruijssen, 2014). This mode of star formation is rare because it requires extreme gas pressures, (Elmegreen & Efremov, 1997; Kruijssen, 2015), causing globular clusters to contain less than 0.5 % of the stars in most present-day galaxies (Forbes et al., 2018).
Nonetheless, the specific frequency (), the total number of clusters per unit galaxy luminosity, can differ by a factor of between individual galaxies, with the largest specific frequencies observed at the very lowest or very highest luminosities (Miller & Lotz, 2007; Harris et al., 2013). Alongside their extended sizes and low surface brightnesses, some ultra-diffuse galaxies (UDGs; van Dokkum et al. 2015) stand out by their elevated globular cluster abundances and the high specific frequencies compared to other galaxies with the same luminosities (Peng & Lim 2016; van Dokkum et al. 2017; Lim et al. 2020 and references therein). One proposed explanation is that UDGs formed at earlier times than typical dwarf galaxies, in higher surface density environments typical of these epochs, giving rise to a larger fraction of their stellar mass formed in gravitationally bound clusters, (e.g., Trujillo-Gomez et al. 2021b; Carleton et al. 2021).
In particular, one such extremely globular cluster-rich UDG is NGC5846-UDG1. It was first cataloged in a photometric survey targeting the area surrounding the NGC5846 group with the Canada–France–Hawaii Telescope (Mahdavi et al., 2005) and was recently re-identified in the VEGAS survey (Forbes et al., 2019), showing a collection of globular clusters at its center. Follow-up spectroscopic observations with the VLT multi-unit spectroscopic explorer (MUSE) confirmed that at least 11 of the globular clusters are associated with NGC5846-UDG1 based on their radial velocities (Müller et al., 2020). The ground-based images lack the resolution to resolve the compact sources and therefore reliably determine the actual size of NGC5846-UDG1’s globular cluster population. Müller et al. (2021)111Müller et al. (2021) refers to NGC5846-UDG1 as MATLAS-2019. used a single orbit HST/ACS observations and identified globular clusters associated with NGC5846-UDG1.
In this Letter we present an analysis of NGC5846-UDG1 and its globular cluster system using new, deeper observations with HST/WFC3. We find a larger number of globular clusters than previous studies, and that cluster stars make up a remarkably high fraction of the total number of stars in the galaxy. We model NGC5846-UDG1’s initial cluster mass function as a function of the birth galactic environment and discuss the implications of our results for different modes of star formation in the early Universe.
2 Observations and Analysis
2.1 HST Imaging
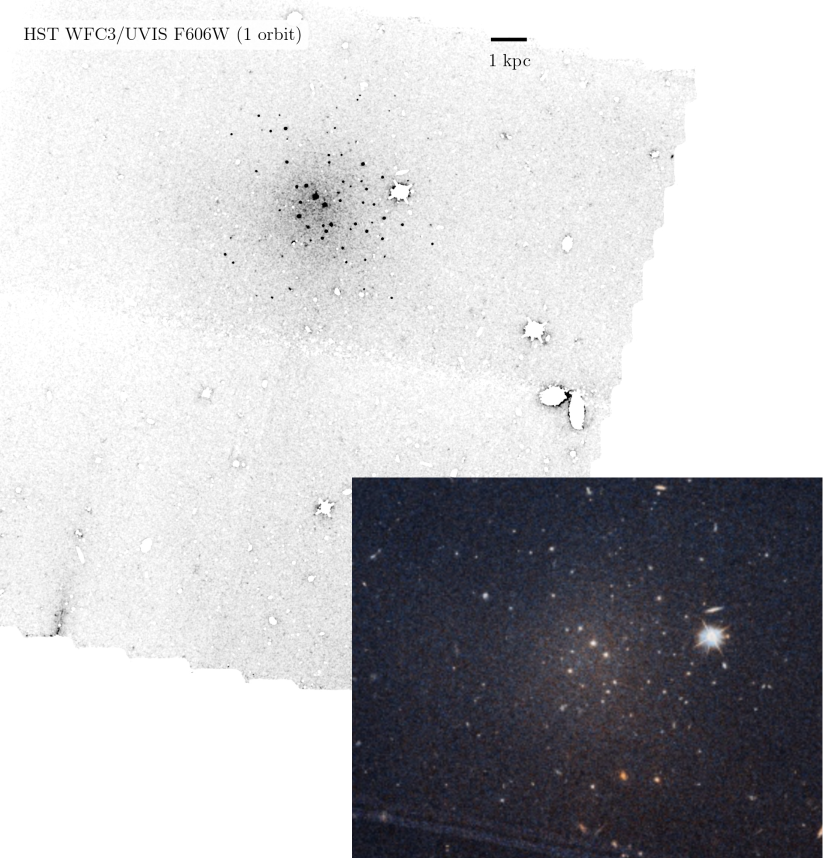
NGC5846-UDG1 was observed with WFC3/UVIS on 2020 December 27, in Cycle 28 (program GO-16284, PI: Danieli). The program focused on characterizing the numerous compact sources in the vicinity of NGC5846-UDG1 by obtaining deep images of the galaxy in two filters. Two orbits were obtained with a total exposure time of and in F475W and F606W, respectively. As the aim was to resolve individual globular clusters potentially associated with NGC5846-UDG1, the WFC3 camera was selected to exploit its improved resolution (004/pixel) over the ACS camera. The drizzled drc images produced by the STScI standard pipeline were used in the analysis. The HST images were primarily used for the identification and characterization of the globular clusters in NGC5846-UDG1. The data were also used for isolating the low surface brightness component of the galaxy in the Dark Energy Camera Legacy Survey (DECaLS; Dey et al. 2019) for deriving NGC5846-UDG1’s structural parameters (see below).
A color image generated from the HST F606W and F475W images is shown in the bottom panel of Figure 1. An abundant population of bright globular clusters is resolved with the HST/WFC3 camera’s high resolution and can be seen clustered close to the center of the galaxy. A diffuse distribution of field stars is also detected. No other known galaxy has such a striking, dominant globular cluster population.
2.2 Identification of Globular Clusters
Identification of the globular clusters in NGC5846-UDG1 is based on their appearance in the 2-orbit WFC3/UVIS images. We also utilize the information of the 11 spectroscopically-confirmed globular clusters as detailed below.
First, SExtractor (Bertin & Arnouts, 1996) is run on the F606W and F475W drizzled images in dual image mode where detection is done on the F606W images, with a detection threshold and a minimum area of above the threshold. The photometry is corrected for Galactic extinction (Schlafly & Finkbeiner, 2011). Total magnitudes were determined using the “AUTO” fluxes from SExtractor, corrected to an infinite aperture using the up-to-date UVIS2 encircled energy (EE) corrections222https://www.stsci.edu/hst/instrumentation/wfc3/data-analysis/photometric-calibration/uvis-encircled-energy. All magnitudes are given in the AB system. The F475WF606W color correction is negligible and therefore no correction was required for the wavelength dependence of the PSF. ‘ Similar to past studies (van Dokkum et al., 2018; Shen et al., 2021), globular cluster selection is done from the HST photometry using a set of size and color criteria. The selection is informed by the color and size distributions of the 11 spectroscopically-confirmed globular clusters with , and . We apply varying color and size criteria for different magnitude-selected sources to account for the variation in the photometric uncertainties with magnitude.
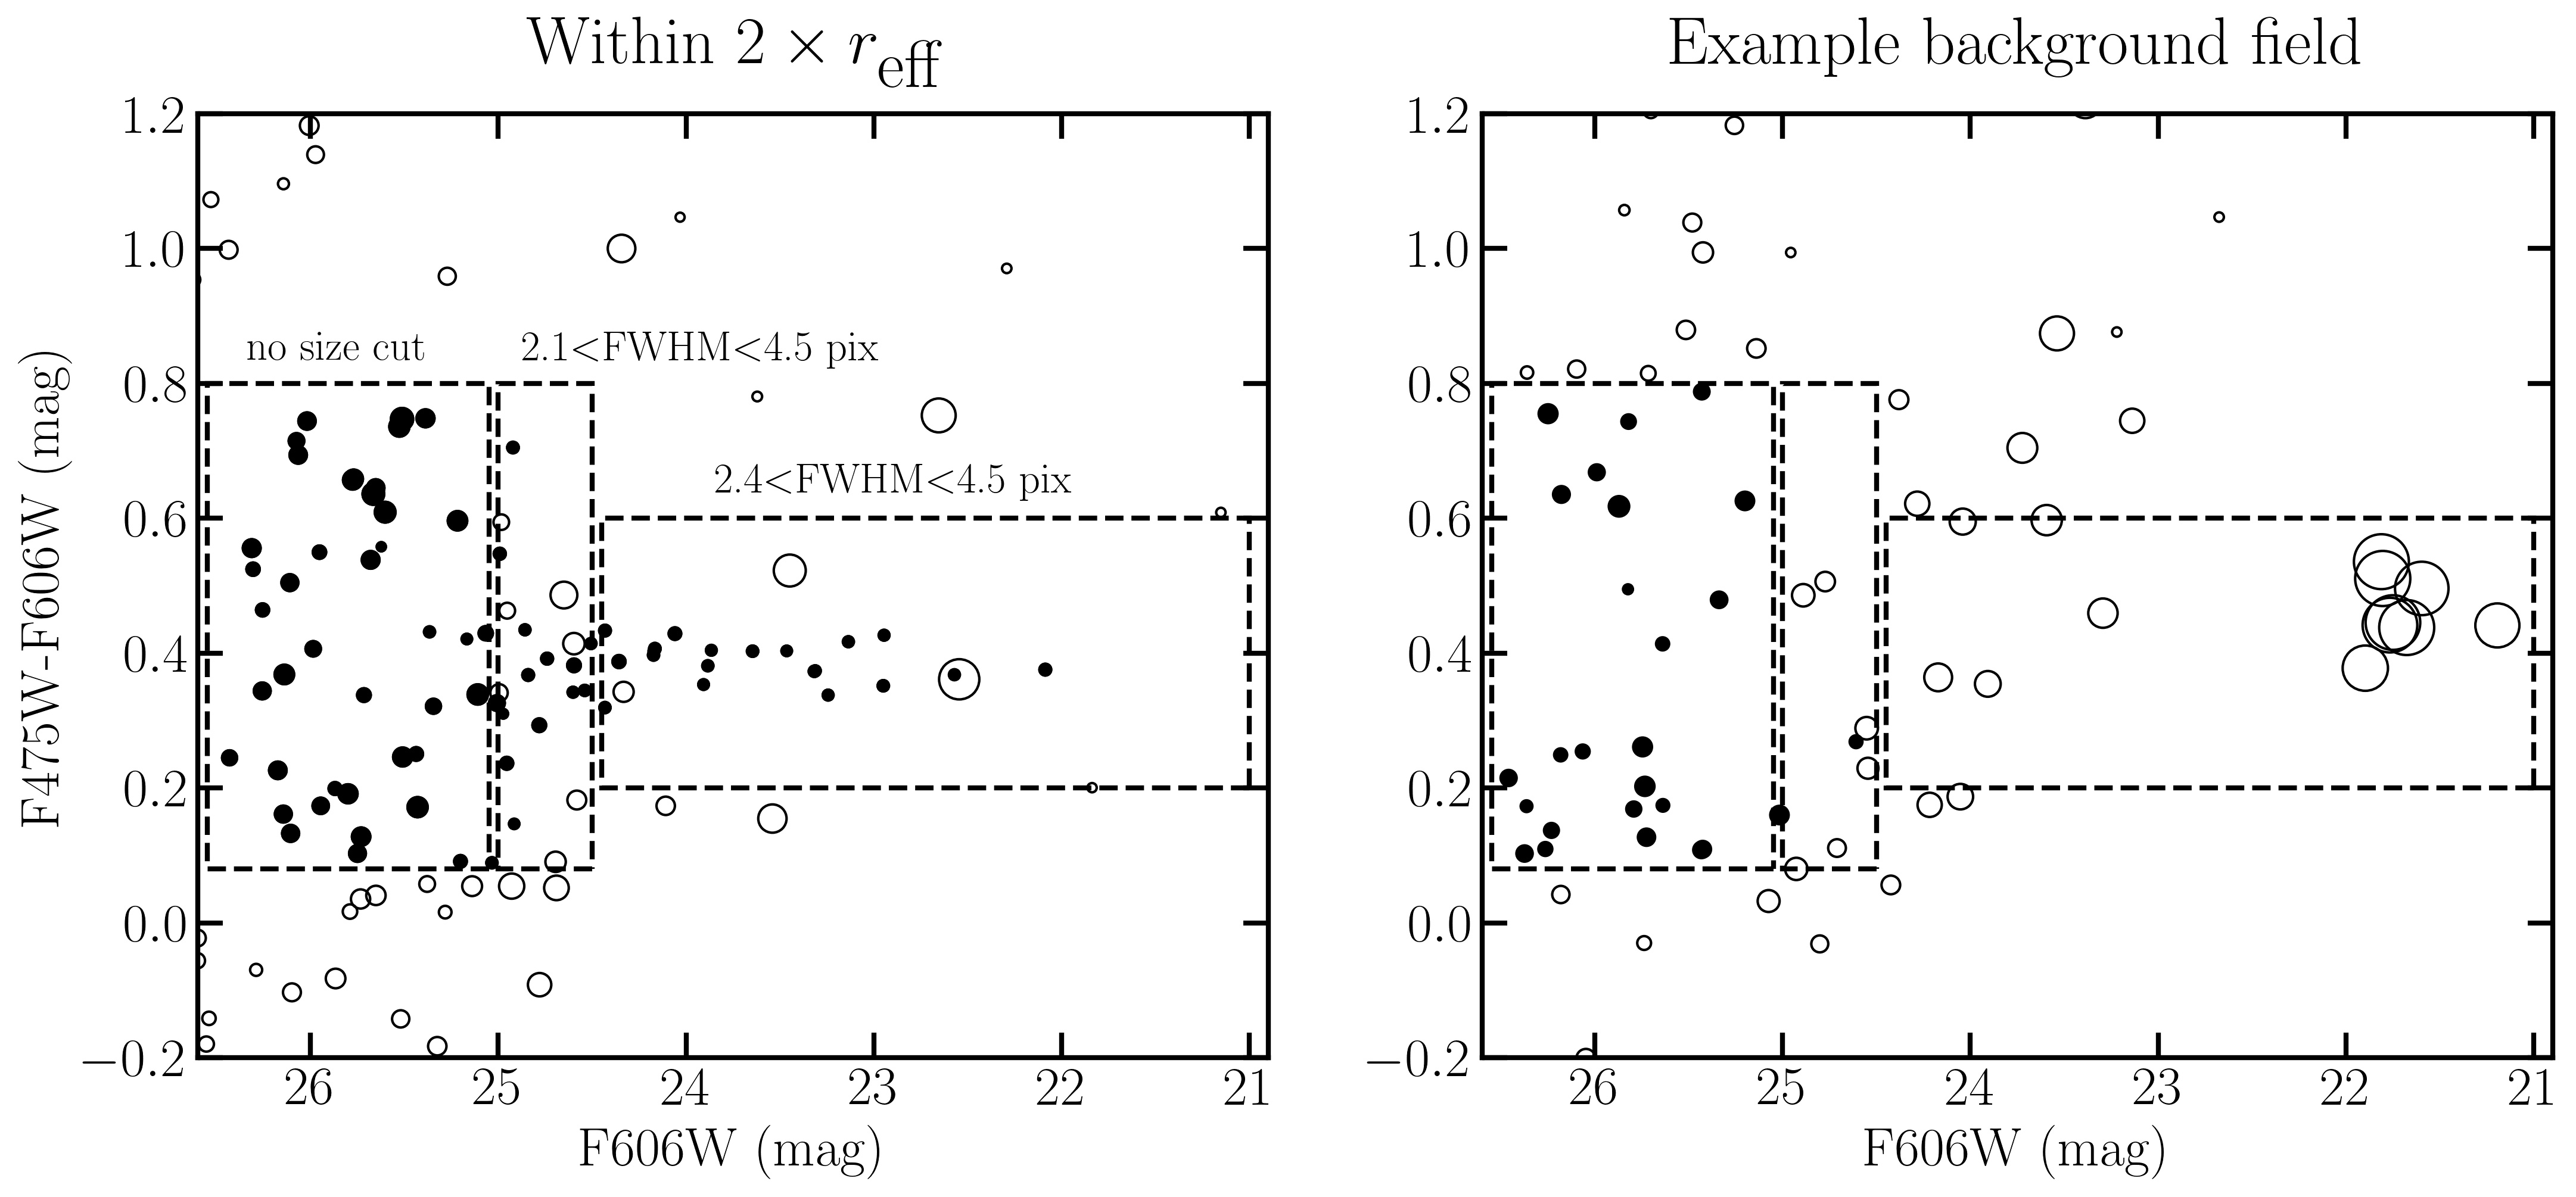
Similar to van Dokkum et al. (2018) and Shen et al. (2021), we create three size and color-selected source catalogs as demonstrated in Figure 2. We measure the half-light radius of the galaxy (, see Section 3) and use the same selection criteria when generating source catalogs for the galaxy (within ) and for a background field (outside ). The background field is used for correcting for contaminating background and foreground sources. The first catalog includes sources brighter than and within a narrow color and size range of , and , respectively (dashed purple box). The same selection is made on sources that are outside for background subtraction. Using these criteria we find sources within and two sources outside . Accounting for the relative area differences (), this first catalog has a background contamination of sources within . We repeat the same procedure for fainter sources using two more selection criteria. For sources with we allow a wider color range criterion of and (dashed green box). We identity sources within and background contaminants. Finally, for sources with , we apply the same color cut of and no size cut (dashed orange box). The final selection adds a total of sources inside and background contaminants. The left panel of Figure 2 shows all sources within from the center of the galaxy, color-coded and with circle sizes proportional to their FWHM sizes measured with SExtractor. Open circles represent sources that were not selected and filled circles are those sources that meet both the color and size criteria, for their F606W magnitude. The right panel shows the same selection applied to an example background field. The contamination for the bright sources catalog is very low, with essentially no contaminating sources below .
In total, we find a background-corrected number of 50.4 globular clusters within . Assuming a Sérsic distribution of the globular clusters with the same Sérsic index for the smooth light component (, see Section 3) and half-light radius, we estimate that three more globular clusters should reside outside . We also correct for sources fainter than , assuming a Gaussian distribution, adopting the best-fit mean and scatter of and (see Section 4). Together, we obtain globular clusters associated with NGC5846-UDG1. The uncertainty in the total globular cluster count is dominated by the number of background sources at the faint end of the luminosity function and reflects Poisson errors in the observed counts (galaxybackground).
A lower globular cluster count in NGC5846-UDG1 has been previously determined using ground-based data (, no error bars provided; Forbes et al. 2021) and also using slightly shallower, single-orbit HST ACS data (Müller et al., 2021). These authors report globular clusters, compared to found here. With the information provided in Müller et al. (2021) we were not able to perform a direct comparison with our analysis. We suspect that the difference in depth (two versus one orbit) and sampling (004/pixel with WFC3 compared to 005/pixel with ACS) between the datasets may be indirectly responsible for the difference. Owing to the brighter photometric limits Müller et al. (2021) used quite restrictive criteria, such that the smallest and faintest sources are likely excluded from their analysis.
3 Structural and Physical Parameters
NGC5846-UDG1 is located in the NGC5846 galaxy group, at a projected distance of from NGC5846 itself. It has a radial velocity of (Forbes et al., 2021), consistent with it being a member of the group, which has a mean velocity of and a velocity dispersion of (Müller et al., 2020). We use the -band image from the Hyper Suprime-Cam Subaru Strategic Program PDR2 (HSC-SSP; Aihara et al. 2019) to measure the surface brightness fluctuations (SBF) distance to NGC5846-UDG1. The SBF signal is measured using techniques developed for dwarf galaxies, with a calibration of based on the color of NGC5846-UDG1, as described in Carlsten et al. (2019) Greco et al. (2021). We measure SBF magnitude of , which places NGC5846-UDG1 at Mpc. This is consistent with the distance to the NGC5846 group of , reported in Kourkchi & Tully (2017), based on the weighted averaged distance of any members available in the Cosmicflows-3 distance catalog (Tully et al., 2016). We adopt as the distance to NGC5846-UDG1 due to the low signal-to-noise achieved using the SBF technique, which places it at a projected distance of from NGC5846. We note that the main result of the paper, namely the globular cluster-to-field stars fraction, as shown below, is very insensitive to the exact distance to NGC5846-UDG1.
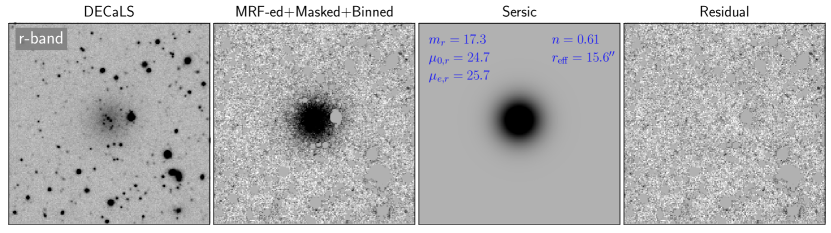
Using HST and DECaLS data in tandem, we characterize the galaxy’s physical and structural properties. The size, luminosity, surface brightness, and stellar mass of NGC5846-UDG1 were derived using the DECaLS images. Attempts were made to use the HST images for this purpose but the galaxy’s surface brightness is too low for reliably fitting it with a model image. Instead, we utilized the HST images in a different way. We used the multi-resolution filtering (MRF) software (van Dokkum et al., 2020) to remove all compact sources from the DECaLS images and isolated the diffuse component of NGC5846-UDG1. Briefly, SExtractor is run on the high resolution HST images, and the resulting segmentation map was converted to a mask and multiplied by the image to create a flux model of all detected sources. Low surface brightness objects and saturated stars were removed from this model. The model was then convolved with a kernel to match the DECaLS point spread function and subtracted. The original -band DECaLS and final residual image binned , conserving only the low surface brightness component, are shown in the left two panels of Figure 3.
Next, we parameterized the galaxy’s structure by fitting a two-dimensional Sérsic model to the smooth light component in the DECaLS and -band images. We used the pymfit333https://github.com/johnnygreco/pymfit code, a python wrapper of imfit (Erwin, 2015), on the MRFed, masked, and binned () DECaLS images. First, imfit was run on the -band MRFed image to determine the structural parameters of the galaxy and its brightness. Then the -band MRFed image was fitted while allowing only the amplitude to change. To estimate the galaxy fit uncertainties, we injected the best-fit imfit model into different areas in the MRFed and binned and images, and then fitted the injected models in the same way we fitted the galaxy. We adopt the RMS variation in the fitted parameters as the uncertainty for each parameter. The final model and residual -band image are shown in the two right panels of Figure 3.
The best-fit model has a Sérsic index of , axis ratio , and a central surface brightness of . It has a half-light radius of , corresponding to at . We transform the and -band measured quantities into -band magnitude and luminosity444http://www.sdss3.org/dr8/algorithms/sdssUBVRITransform.php#Lupton2005. Its total -band absolute magnitude is and its luminosity is . With a mass-to-light ratio , based on and from Müller et al. (2020), we obtain a stellar mass of .
4 Fraction of Stars in Globular Clusters
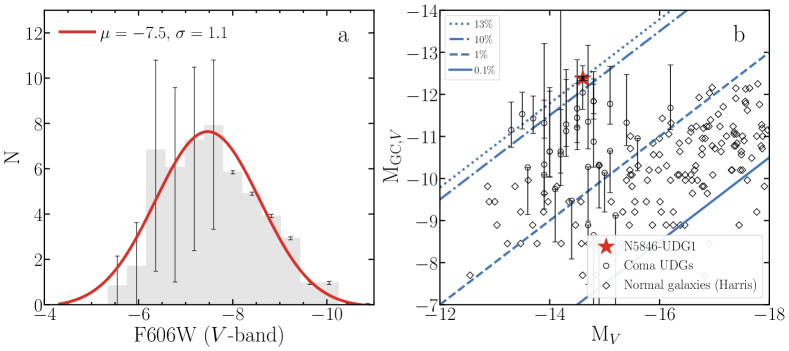
In the left panel of Figure 4 we show the globular cluster luminosity function and a best-fit Gaussian function. Assuming a distance of , it peaks at with a width of , consistent with canonical values for globular cluster systems in most other galaxies (Rejkuba, 2012).
We calculate the fraction of light in globular clusters relative to the total light of the galaxy. The total flux in globular clusters was obtained by integrating the F606W and F475W histograms (scaled to account for the background subtraction). We calculate the and uncertainties of the integrated globular cluster magnitude by generating 100,000 realizations of the histograms and calculating the () and () intervals of the total magnitude distribution. Each histogram is created by perturbing the measured histogram values according to the error bars in each bin, for magnitude bins fainter than . The total light in the identified globular clusters is dominated by the most massive clusters and is therefore insensitive to the completeness limits.
We find that the fraction of light in globular clusters is unusually high, given the galaxy total absolute magnitude, with . This implies that of the stars (measured in -band) currently reside in the globular clusters, a fraction that is about greater than for the Milky Way (Harris et al., 2013).
5 Discussion
5.1 Modeling of the Cluster-to-Field Stars Mass Ratio
NGC5846-UDG1 is the first known galaxy with a present-day globular cluster-to-field stars mass ratio that is with % confidence. Fractions that are this high have important implications for formation models of the galaxy, while providing new constraints on globular cluster mass loss. On long enough time scales, clusters across all masses evolve dynamically, including the complete dissolution of low-mass clusters. These processes include tidal shocks through interactions with the substructure of the dense interstellar medium and evaporation as a result of two-body relaxation (Krause et al., 2020). Taking into account complete destruction of low mass coeval proto-globular clusters as well as mass loss from the surviving clusters, it is thought that initially the cluster population contained up to a factor of a few more stars than are observed after Gyr. That is, globular cluster systems could lose up to of their stars over their lifetime (Larsen et al., 2012; Kruijssen, 2015; Reina-Campos et al., 2018). With a measured fraction of , NGC5846-UDG1 could have started with a globular cluster-to-field stars mass fraction approaching . Below we quantify this result using the specific properties of NGC5846-UDG1.
We apply an analytical physical model for the globular cluster mass function (GCMF) to infer the environmental conditions within the progenitor galaxy at the time of formation of the globular clusters (Reina-Campos & Kruijssen, 2017; Trujillo-Gomez et al., 2019). The model relates the properties of the host galaxy disk at the time of formation (its gas surface density, rotational angular velocity, and Toomre stability parameter) to the minimum and maximum cluster masses (Reina-Campos & Kruijssen, 2017; Trujillo-Gomez et al., 2019), as well as the cluster formation efficiency (CFE; the fraction of star formation occurring in gravitationally bound clusters; Kruijssen 2012). Together with the assumption of a power-law slope of between the minimum and maximum exponential truncation masses, these quantities completely determine the double-Schechter initial cluster mass function (ICMF) (Trujillo-Gomez et al., 2019; Adamo et al., 2020). We assume , and correct for the fractional mass loss due to stellar evolution of for the field stars and for the globular clusters, to also account for mass segregation (Lamers et al., 2010). This model accurately reproduces the demographics of young and old cluster populations in the local Universe (Pfeffer et al., 2019; Trujillo-Gomez et al., 2019).
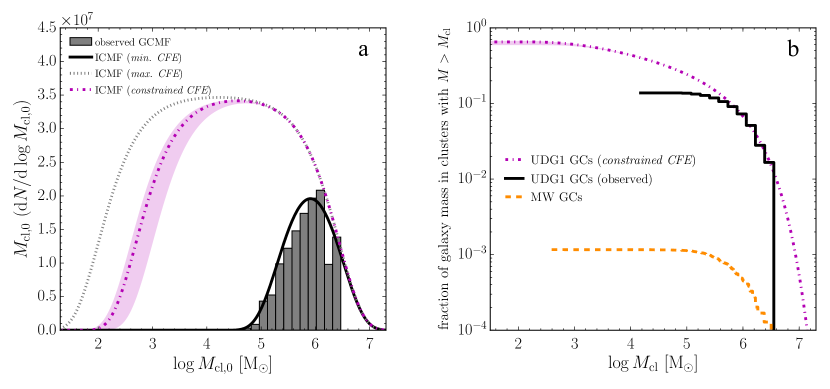
Since we do not know a priori if stars that are currently not in globular clusters were formed as part of lower-mass proto-globular clusters or as field stars, we model the ICMF making three distinct assumptions that bracket the range of possibilities. The left panel of Figure 5 shows the ICMF for the three models which account for the inferred fraction of the total stars formed in bound clusters. We first consider the two extreme cases. The black curve shows the minimum CFE model where only the stars currently observed in clusters were born in gravitationally bound clusters, and the ICMF is simply the present-day GCMF corrected for mass loss due to stellar evolution (i.e., with no dynamical mass loss). Second, the gray dashed curve shows the maximum CFE model where all the stars in the galaxy were born in bound clusters, and assuming that the integrated ICMF mass cannot exceed the total stellar mass of the galaxy. Lastly, using the purple band we show the fiducial ’constrained CFE’ model, which uses the additional requirement that the predicted set of environmental properties simultaneously reproduces the observed minimum and maximum masses, and the predicted fraction of star formation in bound clusters. The fiducial model is shown for a disk stability range of .
In the model that is preferred for describing a rapidly cluster-forming galaxy (with , which reflects the typical values observed in high-redshift galaxies; Genzel et al. 2014), we obtain a minimum cluster mass of and a bound fraction of . This implies that to satisfy the interstellar medium (ISM) conditions required to produce the observed GCMF (gas surface density of and shear ), a very large fraction of the total mass of NGC5846-UDG1 had to form in bound clusters. We therefore infer that it is likely that most of the star formation in NGC5846-UDG1 happened in extremely dense cluster-forming gas clumps (in order to produce clusters that remain bound after losing their gas), with unusually little low-density (i.e. unbound) star formation occurring 555The model assumes that the majority of field stars and clusters formed during the same star formation episode..
The right panel of Figure 5 shows the cumulative fraction of galaxy mass in clusters, at formation, for NGC5846-UDG1 in comparison to the Milky Way (orange dashed curve), assuming no cluster mass loss or disruption for the Milky Way (i.e. the minimum CFE model): is assumed for the Milky Way globular clusters Harris (1996) and a stellar mass of (Bland-Hawthorn & Gerhard, 2016). The black solid curve is the minimum CFE model for NGC5846-UDG1 while the purple dot-dashed curve shows the fiducial model. There is a 2–3 orders of magnitude difference between NGC5846-UDG1 and the Milky Way, further demonstrating the extraordinary conditions that led to the formation of NGC5846-UDG1. While formation in massive, gravitationally bound clusters made only minor contributions to the total Milky Way mass, star formation in dense clumps is the dominant formation channel in NGC5846-UDG1.
5.2 Tests of the Model
How can this scenario be further tested observationally? If indeed a large fraction of the field stars came from dissolved clusters, then the expectation is that both the stellar populations (particularly the ages) and the spatial distribution of the field stars and the globular clusters are similar. In other galaxies, this is typically not the case, with globular clusters on average being more metal-poor and older than field stars, and their spatial distribution more extended with (Kartha et al., 2014; van Dokkum et al., 2017; Lim et al., 2018). Recent spectroscopic data have shown that the globular clusters and the field stars of NGC5846-UDG1 have consistent ages (with ) and metallicities ( for the field stars) (Müller et al., 2020). We measure the half-number radius of the globular clusters by selecting all sources from the entire HST image that have -band magnitudes brighter than (fainter than the expected canonical peak at ), that are relatively compact (), and have colors between and mag. We identify 34 globular clusters in the sample, of which 31 are located very close to the galaxy. With this low-contamination sample ( clusters), we find , consistent with the field star half-light radius of . The similar (and possibly more concentrated) distribution of globular clusters compared to the smooth stellar distribution, as well as the similar ages and chemical compositions, support a common origin of the stars in globular clusters and the field stars. Future studies may be able to refine the age estimates of the clusters and the diffuse light.
5.3 NGC5846-UDG1 in Context
NGC5846-UDG1 is likely not alone. Globular cluster-rich UDGs have been identified and studied in various cosmic environments (van Dokkum et al., 2017; Beasley & Trujillo, 2016; Forbes et al., 2020; Somalwar et al., 2020). In fact, the large populations of globular clusters in such low-luminosity and diffuse systems has been one of the properties that make the formation of UDGs stand out as perplexing in the context of modern physical models of galaxy formation. We put NGC5846-UDG1 in context with other globular cluster-rich galaxies with absolute magnitudes ranging between and . In the right panel of Figure 4, we show the total -band absolute magnitude of galaxies as a function of the total absolute magnitude of globular clusters in these galaxies. NGC5846-UDG1 has a larger confirmed fraction of luminosity in its globular cluster system than any of the other galaxies. Interestingly, some UDGs in the Coma cluster might possess similar extreme fractions of stars in their present-day globular cluster systems. However, the Coma Cluster is located times farther than NGC5846-UDG1 and correspondingly the uncertainties on estimates of potentially associated globular clusters are much larger. These uncertainties are dominated by the high contamination from background and foreground objects at fainter magnitudes and the fact that their globular clusters are unresolved with HST at . Nevertheless, these Coma galaxies suggest that clump-only star formation in galaxies may be quite common.
What conditions and processes might have promoted star formation, predominating in dense gas clumps, leading to the formation of a galaxy such as NGC5846-UDG1? The ICMF model applied to NGC5846-UDG1 predicts high gas surface densities () at the time of formation. A recent model that connects the evolution of galaxies with their dark matter halos and globular cluster populations predicts that high globular cluster mass fractions arise naturally in early-collapsing dark matter halos due to their elevated gas surface densities at high redshift (Trujillo-Gomez et al., 2021a). Such conditions give rise to massive cluster formation with a high CFE, resulting in an elevated number of globular clusters relative to the galaxy stellar mass. The model then predicts that the high clustering of the supernova feedback sources within the clusters could significantly increase the mass loading of gas outflows, which would lead to significant expansion of the stars and dark matter compared to galaxies with typical halo collapse times and globular cluster populations. For NGC5846-UDG1, such a short-lived and efficient burst of star formation at high redshift may have also expelled the remaining gas, limiting star formation to this single event. The early-collapse UDG formation model predicts a correlation between offset from the mean stellar mass-halo mass relation and number of formed GCs. Precise constraints on the dark matter halo mass of NGC5846-UDG1 could therefore be used to test this scenario. NGC5846-UDG1 may be a case where star formation began like in many other galaxies, but then failed to form stars in a low-density mode at later epochs.
References
- Adamo et al. (2020) Adamo, A., Hollyhead, K., Messa, M., et al. 2020, MNRAS, 499, 3267
- Aihara et al. (2019) Aihara, H., AlSayyad, Y., Ando, M., et al. 2019, PASJ, 71, 114
- Beasley & Trujillo (2016) Beasley, M. A., & Trujillo, I. 2016, ApJ, 830, 23
- Bertin & Arnouts (1996) Bertin, E., & Arnouts, S. 1996, A&AS, 117, 393
- Bland-Hawthorn & Gerhard (2016) Bland-Hawthorn, J., & Gerhard, O. 2016, ARA&A, 54, 529
- Carleton et al. (2021) Carleton, T., Guo, Y., Munshi, F., Tremmel, M., & Wright, A. 2021, MNRAS, 502, 398
- Carlsten et al. (2019) Carlsten, S. G., Beaton, R. L., Greco, J. P., & Greene, J. E. 2019, ApJ, 879, 13
- Dey et al. (2019) Dey, A., Schlegel, D. J., Lang, D., et al. 2019, AJ, 157, 168
- Elmegreen & Efremov (1997) Elmegreen, B. G., & Efremov, Y. N. 1997, ApJ, 480, 235
- Erwin (2015) Erwin, P. 2015, ApJ, 799, 226
- Forbes et al. (2020) Forbes, D. A., Alabi, A., Romanowsky, A. J., Brodie, J. P., & Arimoto, N. 2020, MNRAS, 492, 4874
- Forbes et al. (2019) Forbes, D. A., Gannon, J., Couch, W. J., et al. 2019, A&A, 626, A66
- Forbes et al. (2021) Forbes, D. A., Gannon, J. S., Romanowsky, A. J., et al. 2021, MNRAS, 500, 1279
- Forbes et al. (2018) Forbes, D. A., Bastian, N., Gieles, M., et al. 2018, Proceedings of the Royal Society of London Series A, 474, 20170616
- Genzel et al. (2014) Genzel, R., Förster Schreiber, N. M., Rosario, D., et al. 2014, ApJ, 796, 7
- Greco et al. (2021) Greco, J. P., van Dokkum, P., Danieli, S., Carlsten, S. G., & Conroy, C. 2021, ApJ, 908, 24
- Harris (1996) Harris, W. E. 1996, AJ, 112, 1487
- Harris et al. (2013) Harris, W. E., Harris, G. L. H., & Alessi, M. 2013, ApJ, 772, 82
- Kartha et al. (2014) Kartha, S. S., Forbes, D. A., Spitler, L. R., et al. 2014, MNRAS, 437, 273
- Kennicutt & Evans (2012) Kennicutt, R. C., & Evans, N. J. 2012, ARA&A, 50, 531
- Kourkchi & Tully (2017) Kourkchi, E., & Tully, R. B. 2017, ApJ, 843, 16
- Krause et al. (2020) Krause, M. G. H., Offner, S. S. R., Charbonnel, C., et al. 2020, Space Sci. Rev., 216, 64
- Kruijssen (2012) Kruijssen, J. M. D. 2012, MNRAS, 426, 3008
- Kruijssen (2014) Kruijssen, J. M. D. 2014, Classical and Quantum Gravity, 31, 244006
- Kruijssen (2015) Kruijssen, J. M. D. 2015, MNRAS, 454, 1658
- Krumholz et al. (2019) Krumholz, M. R., McKee, C. F., & Bland-Hawthorn, J. 2019, ARA&A, 57, 227
- Lamers et al. (2010) Lamers, H. J. G. L. M., Baumgardt, H., & Gieles, M. 2010, MNRAS, 409, 305
- Larsen et al. (2012) Larsen, S. S., Strader, J., & Brodie, J. P. 2012, A&A, 544, L14
- Lim et al. (2018) Lim, S., Peng, E. W., Côté, P., et al. 2018, ApJ, 862, 82
- Lim et al. (2020) Lim, S., Côté, P., Peng, E. W., et al. 2020, ApJ, 899, 69
- Mahdavi et al. (2005) Mahdavi, A., Trentham, N., & Tully, R. B. 2005, AJ, 130, 1502
- Miller & Lotz (2007) Miller, B. W., & Lotz, J. M. 2007, ApJ, 670, 1074
- Müller et al. (2020) Müller, O., Marleau, F. R., Duc, P.-A., et al. 2020, A&A, 640, A106
- Müller et al. (2021) Müller, O., Durrell, P. R., Marleau, F. R., et al. 2021, arXiv e-prints, arXiv:2101.10659
- Peng & Lim (2016) Peng, E. W., & Lim, S. 2016, ApJ, 822, L31
- Pfeffer et al. (2019) Pfeffer, J., Bastian, N., Kruijssen, J. M. D., et al. 2019, MNRAS, 490, 1714
- Reina-Campos & Kruijssen (2017) Reina-Campos, M., & Kruijssen, J. M. D. 2017, MNRAS, 469, 1282
- Reina-Campos et al. (2018) Reina-Campos, M., Kruijssen, J. M. D., Pfeffer, J., Bastian, N., & Crain, R. A. 2018, MNRAS, 481, 2851
- Rejkuba (2012) Rejkuba, M. 2012, Ap&SS, 341, 195
- Schlafly & Finkbeiner (2011) Schlafly, E. F., & Finkbeiner, D. P. 2011, ApJ, 737, 103
- Shen et al. (2021) Shen, Z., van Dokkum, P., & Danieli, S. 2021, ApJ, 909, 179
- Somalwar et al. (2020) Somalwar, J. J., Greene, J. E., Greco, J. P., et al. 2020, ApJ, 902, 45
- Trujillo-Gomez et al. (2021a) Trujillo-Gomez, S., Kruijssen, J. M. D., Keller, B. W., & Reina-Campos, M. 2021a, MNRAS, 506, 4841
- Trujillo-Gomez et al. (2021b) Trujillo-Gomez, S., Kruijssen, J. M. D., & Reina-Campos, M. 2021b, arXiv e-prints, arXiv:2103.08610
- Trujillo-Gomez et al. (2019) Trujillo-Gomez, S., Reina-Campos, M., & Kruijssen, J. M. D. 2019, MNRAS, 488, 3972
- Tully et al. (2016) Tully, R. B., Courtois, H. M., & Sorce, J. G. 2016, AJ, 152, 50
- van Dokkum et al. (2017) van Dokkum, P., Abraham, R., Romanowsky, A. J., et al. 2017, ApJ, 844, L11
- van Dokkum et al. (2018) van Dokkum, P., Cohen, Y., Danieli, S., et al. 2018, ApJ, 856, L30
- van Dokkum et al. (2020) van Dokkum, P., Lokhorst, D., Danieli, S., et al. 2020, PASP, 132, 074503
- van Dokkum et al. (2015) van Dokkum, P. G., Abraham, R., Merritt, A., et al. 2015, ApJ, 798, L45