e-mail: melina.poulain45@gmail.com, Melina.Poulain@student.uibk.ac.at 22institutetext: Observatoire Astronomique, Université de Strasbourg, CNRS, 11, rue de l’Université. F-67000 Strasbourg, France 33institutetext: UK Astronomy Technology Centre, Royal Observatory Edinburgh, Blackford Hill, Edinburgh EH9 3HJ, UK 44institutetext: Dept. of Physics, Astronomy, Geology, and Environmental Sciences, Youngstown State University, Youngstown, OH 44555 USA 55institutetext: Department of Astronomy and Center for Galaxy Evolution Research, Yonsei University, Seoul 03722 66institutetext: Department of Astronomy, Yonsei University, 50 Yonsei-ro Seodaemun-gu, Seoul, 03722, Republic of Korea 77institutetext: Nicolaus Copernicus Astronomical Center, Polish Academy of Sciences, Bartycka 18, 00-716 Warsaw, Poland 88institutetext: Univ. Lyon, ENS de Lyon, Univ. Lyon 1, CNRS, Centre de Recherche Astrophysique de Lyon, UMR5574, 69007 Lyon, France
HI observations of the MATLAS dwarf and ultra-diffuse galaxies††thanks: Table 1 is only available in electronic form at the CDS via anonymous ftp to cdsarc.u-strasbg.fr (130.79.128.5) or via http://cdsweb.u-strasbg.fr/cgi-bin/qcat?J/A+A/.
The presence of HI gas in galaxies is inextricably linked to their morphology and evolution. This paper aims to understand the HI content of the already identified 2210 dwarfs located in the low-to-moderate density environments of the MATLAS deep imaging survey. We combine the HI observations from the ATLAS3D survey, with the extragalactic HI sources from the ALFALFA survey, to extract the HI line width, velocity and mass of the MATLAS dwarfs. From the 1773 dwarfs in our sample with available HI observations, 8% (145) have an HI line detection. The majority of the dwarfs show irregular morphology, while 29% (42) are ellipticals, the largest sample of HI-bearing dwarf ellipticals (dEs) to date. Of the HI dwarf sample, 2% (3) are ultra-diffuse galaxies (UDGs), 12% have a transition-type morphology, 5% are tidal dwarf candidates, and 10% appear to be disrupted objects. In our optically selected sample, 9.5% of the dEs, 7% of the UDGs and 10% of the classical dwarfs are HI-bearing. The HI-bearing dwarfs have on average bluer colors than the dwarfs without detected HI. We find relations between the stellar and HI masses, gas fraction, color and absolute magnitude consistent with previous studies of dwarfs probing similar masses and environments. For 79% of the dwarfs identified as satellites of massive early-type galaxies, we find that the HI mass increases with the projected distance to the host. Using the HI line width, we estimate dynamical masses and find that 5% (7) of the dwarfs are dark matter deficient.
Key Words.:
Galaxies: dwarf – Radio lines: galaxies – Galaxies: structure1 Introduction
In recent years, our understanding of the processes that govern galaxy growth and evolution have expanded to include both internal and external drivers, the so-called ”nature” versus ”nurture” problem. One piece of evidence supporting the role of the environment on galaxy morphology is the morphology-density relation (Dressler 1980), where the early-type galaxies (ETGs), the red passive ellipticals and lenticulars, are more likely found in high density cluster environments, while the late-type galaxies (LTGs), comprising the blue star-forming spirals and irregulars, inhabit less crowded environments. Tidal features, such as tails, shells and streams, caused by galaxy interactions (e.g., Malin & Carter 1980; Schweizer 1982; Tal et al. 2009; Janowiecki et al. 2010; Hood et al. 2018; Müller et al. 2019) offer additional evidence for environmental processes acting on galaxies. Studies of the quenching of the star-forming galaxies have shown that the star-forming activity can be regulated by both environmental (e.g., tidal and ram-pressure stripping, harassment, mergers) and internal processes (e.g., AGN and supernovae feedback, gravitational quenching). The formation of the central region, or bulge, of galaxies also depends on both external and internal effects, where the classical bulges are the outcome of mergers (Aguerri et al. 2001) and the pseudo-bulges are produced by the gas internally driven by bars (Kormendy & Kennicutt 2004).
While the ”nature” versus ”nurture” problem has long been studied in massive galaxies (stellar mass MM⊙), the full impact of the environment has not been explored for the less massive galaxies, also known as dwarf galaxies. Until recently, most studies of dwarfs focused on nearby clusters, groups in the Local Volume (LV) and the Local Group (LG), leading to a lack of observations in low density environments. We know that the local environment can be linked to the morphological type of the dwarfs which can be divided into two main groups: the dwarf irregulars (dIs), with irregular isophotes, high gas fraction and ongoing star formation, and the dwarf ellipticals/spheroidals (dEs/dSphs) characterized by a lack of gas and star formation and their elliptical isophotes. Similar to more massive galaxies, we observe a morphology-density relation for dwarf galaxies, where dIs are located, on average, in less dense local environments than dEs (Ferguson & Sandage 1989; McConnachie 2012; Skillman et al. 2003; Côté et al. 2009; Habas et al. 2020). Studies of the morphology of dwarfs located in low-to-moderate density environments also suggest that the morphological type of galaxy satellites is linked to that of their massive host (either an ETG or LTG) and to the projected distance to this host, with dEs being more numerous around ETGs and located closer to their host than star-forming satellites (Geha et al. 2012; Ann 2017; Habas et al. 2020). Moreover, a number of dwarfs also show signs of galaxy interactions, and a catalog of dwarf galaxies exhibiting tidal features in the Local Universe is presented in Paudel et al. (2018). These interacting dwarfs appear to favor low density environments. On the other hand, simulations of isolated dwarfs have demonstrated the role of internal processes in shaping dwarf morphologies. These hydrodynamical simulations, based on supernova feedback and ultraviolet radiation, produce dEs whose morphological properties are similar to those of LG dwarfs (Valcke et al. 2008; Revaz et al. 2009; Revaz & Jablonka 2018).
Studies of the neutral gas (HI) content of massive galaxies provide clues about the effects of the external and internal processes on galaxy morphology. The impact of the environment can be observed from the fact that galaxies of similar stellar masses have less HI in clusters and groups than in the field (Davies & Lewis 1973; Giovanelli & Haynes 1985; Verdes-Montenegro et al. 2001; Hess & Wilcots 2013; Dénes et al. 2014). On the other hand, the relation between the gas fraction and the stellar mass is an example of the impact of internal processes in galaxies, where the HI-to-stellar mass ratio decreases towards galaxies of higher stellar masses (Catinella et al. 2018).
In HI studies of dwarfs, we also observe the effects of both internal and external processes. The relation between the HI-to-stellar mass ratio and the stellar mass extends to low mass galaxies (Huang et al. 2012). In the LG, the HI mass of M31 and the Milky Way satellites increases with the distance to the host and correlates with the morphological type of the dwarfs, the dEs having less HI gas and being located closer to the host as compared to the dIs (Grebel et al. 2003; Grcevich & Putman 2009). Several studies of HI-bearing dwarfs (e.g., Dellenbusch et al. 2008; Koleva et al. 2013) also revealed the existence of an intermediate morphology, the transition-type dwarfs (TTDs), typically showing a low HI mass-to-light ratio, an elliptical shape with internal star-forming regions and an external area containing an old stellar population.
In the last few years, the role of nature versus nurture in shaping the so-called ultra diffuse galaxies (UDGs; defined as galaxies with very low central surface brightnesses mag/arcsec2 and large effective radii 1.5 kpc, van Dokkum et al. 2015), has been of particular interest. Some groups have argued that internal processes are dominant, e.g., AGN, supernova or stellar feedback (Di Cintio et al. 2017; Papastergis et al. 2017). While others suggest that they are the result of an environmental effect such as tidal disruption (Mihos et al. 2015; Merritt et al. 2016; Bennet et al. 2018) or collisions (Baushev 2018). Studies of globular clusters and morphology of UDGs indicate multiple origins of UDGs even in one cluster (Toloba et al. 2018; Lim et al. 2018, 2020), and simulations support the idea of the existence of several populations of UDGs (Sales et al. 2020). The absence of environmental preferences for HI-bearing UDGs observed by Janowiecki et al. (2019) favors a formation of UDGs based on internal processes. Coupled to the study of HI-bearing UDGs in low density environments of Leisman et al. (2017), their results suggest that gas-rich UDGs could undergo gas-stripping and evolve into the observed quiescent cluster UDGs during their infall.
The work by Habas et al. (2020) on the deep optical images of the Mass Assembly of early-Type GaLAxies with their fine Structures (MATLAS) survey unveiled a sample of 2210 dwarf galaxies in low-to-moderate density environments with a large majority of dEs (73%). Therefore, an advantage of an HI study of such sample is that we are not biased by the morphological type of the HI-bearing dwarfs, unlike some works that favor the observations of a dI population or target some peculiar dEs. Furthermore, since this sample is not HI selected, we are able to quantify the number of dwarfs of different types and UDGs with HI detection along with their HI-derived properties. Photometric and structural properties were extracted for 1589 dwarfs with the use of Sérsic modelling (Poulain et al. 2021), and a subsample of 59 UDGs was then defined based on these properties (Marleau et al. 2021). Recent work on the MATLAS dwarfs found evidence, for example, for a morphology-density relation (Habas et al. 2020), no statistically significant differences between the structural properties of dwarfs in different environments (Poulain et al. 2021), and similarities between the properties of UDGs and classical dwarfs, suggesting a similar formation path for both populations (Marleau et al. 2021). In this paper, we investigate the HI content of the MATLAS dwarfs, in addition to their optical study. We compare the morphology, local environment and scaling relation of the MATLAS HI-bearing dwarfs to existing HI dwarf samples.
This paper is organized as follows. In Section 2, we present the MATLAS dwarfs and UDGs samples. In Section 3, we describe the HI observations and the resulting catalogue of MATLAS HI dwarfs and UDGs. The HI fluxes and estimated masses as well as the optical properties of the HI sample are presented in Section 4. We discuss the results in Section 5 and our conclusions in Section 6.
2 The MATLAS dwarf and UDG samples
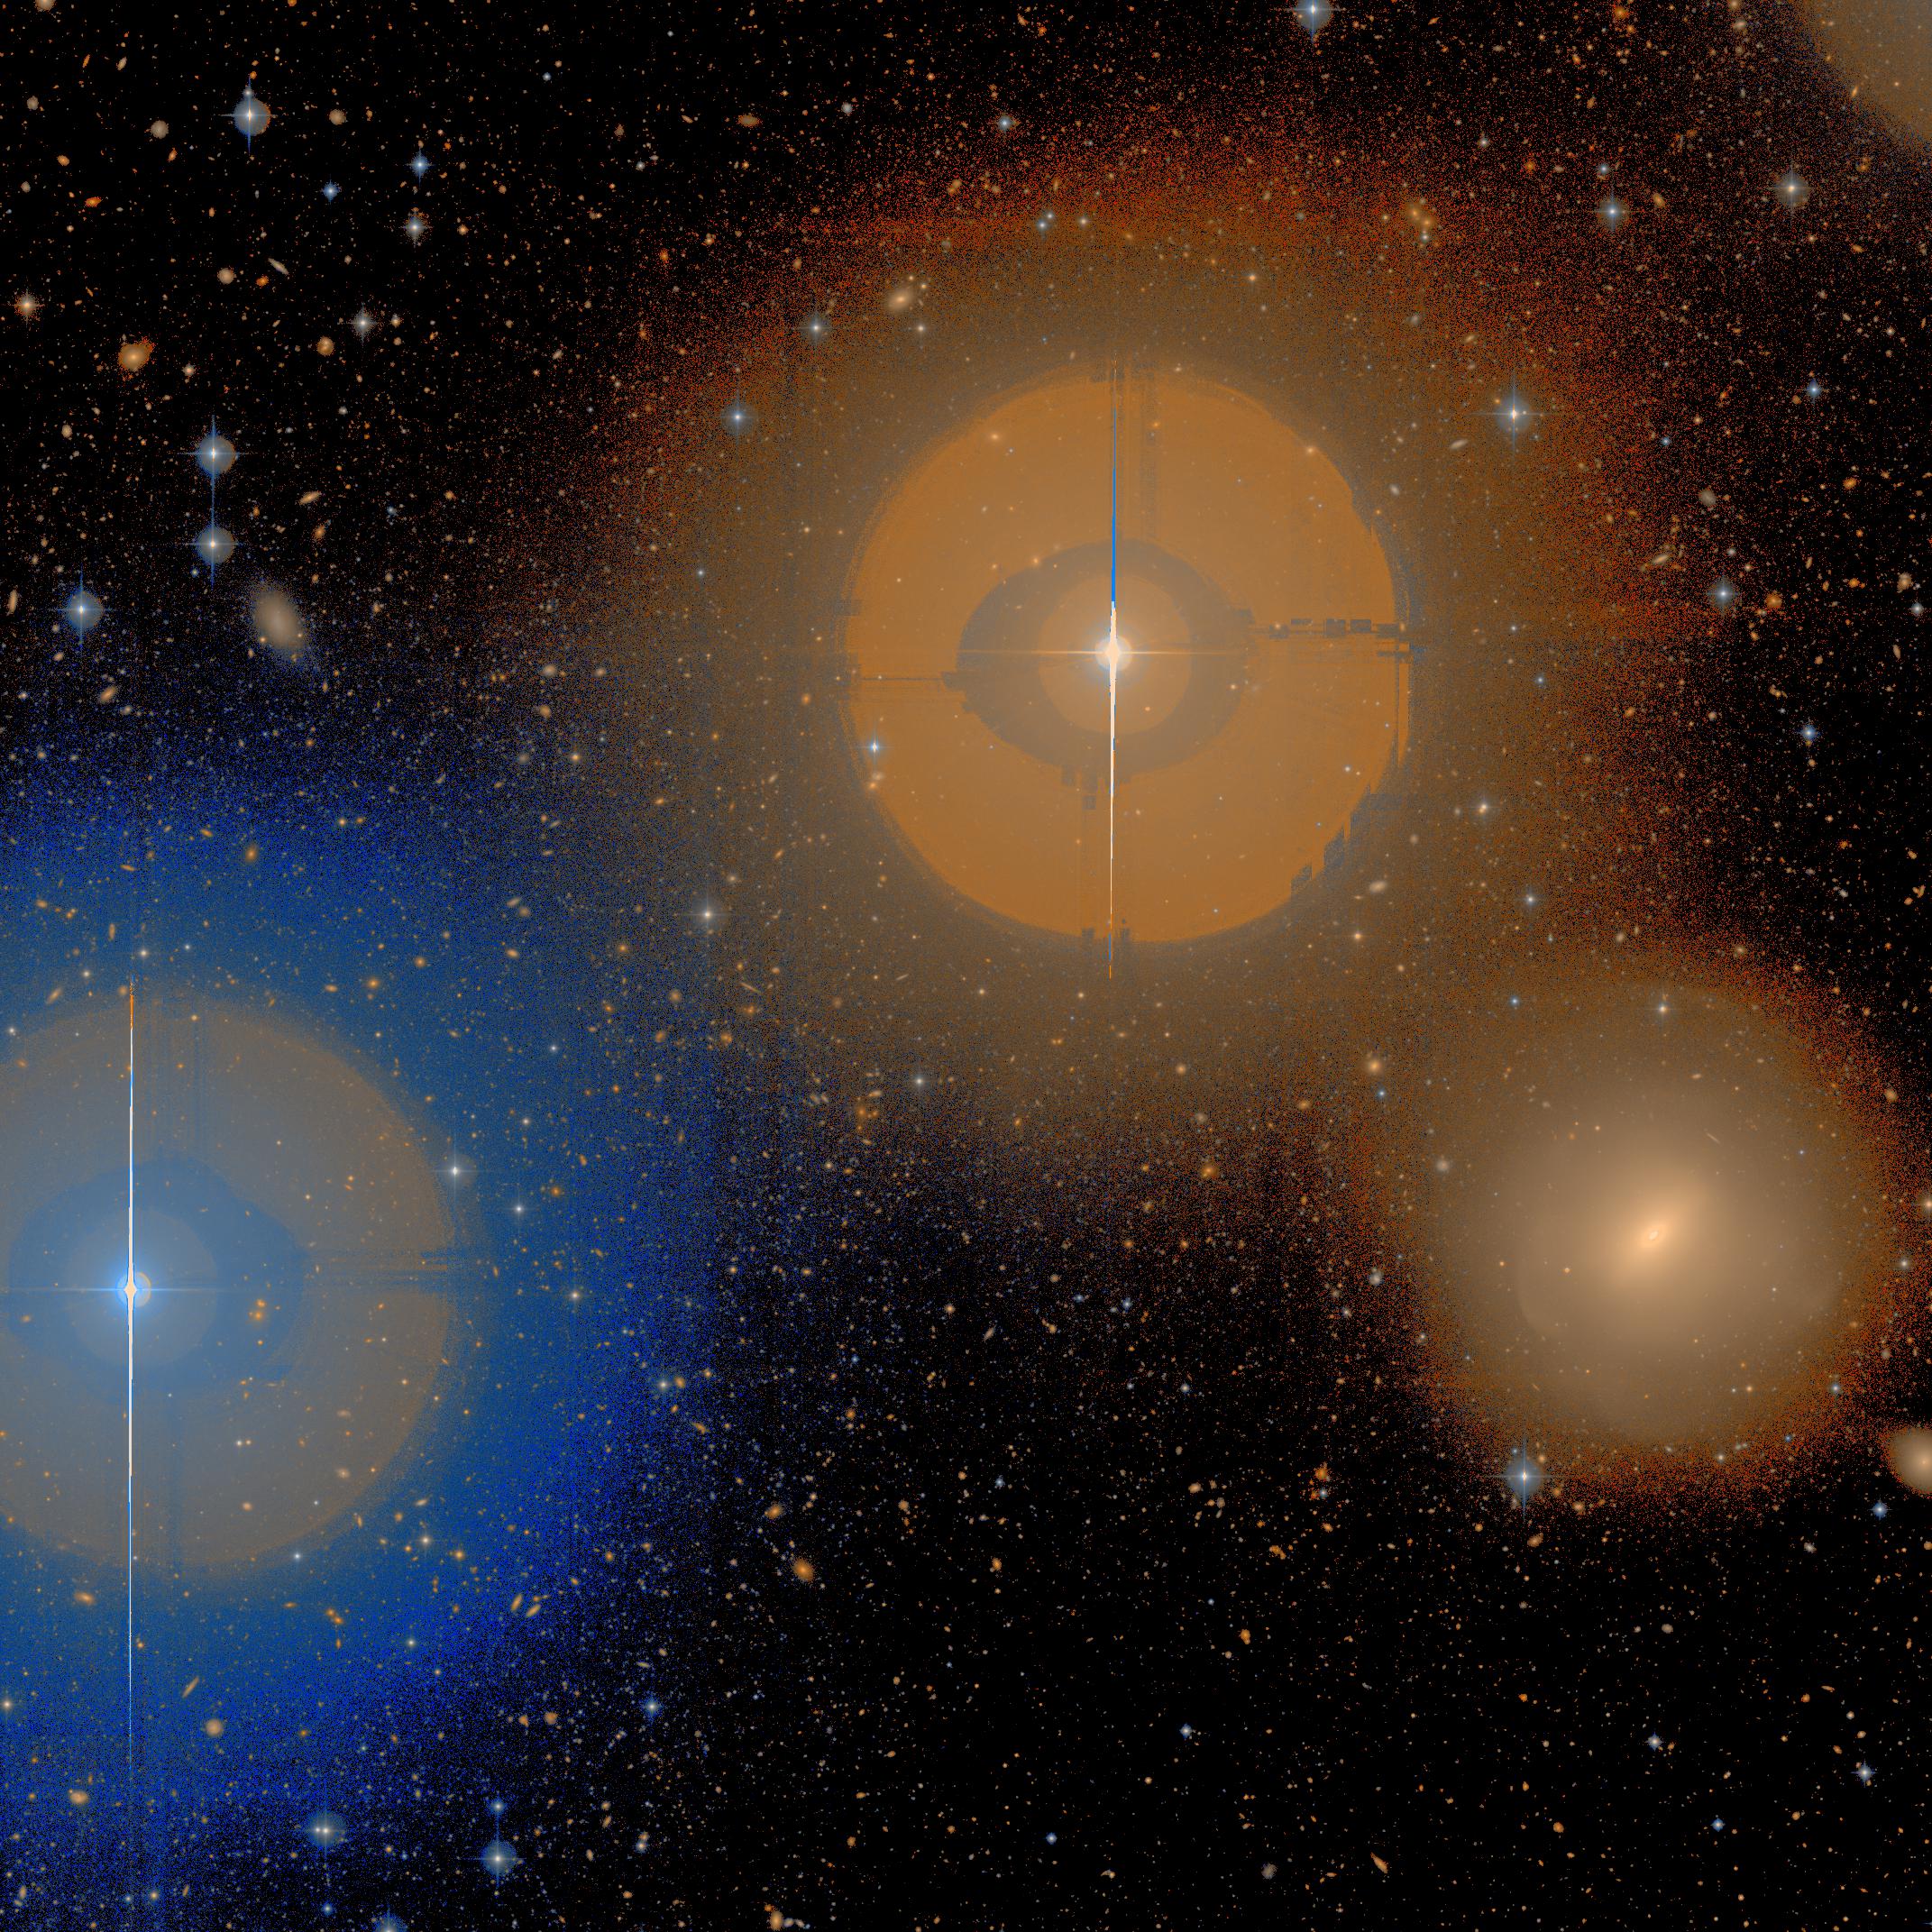
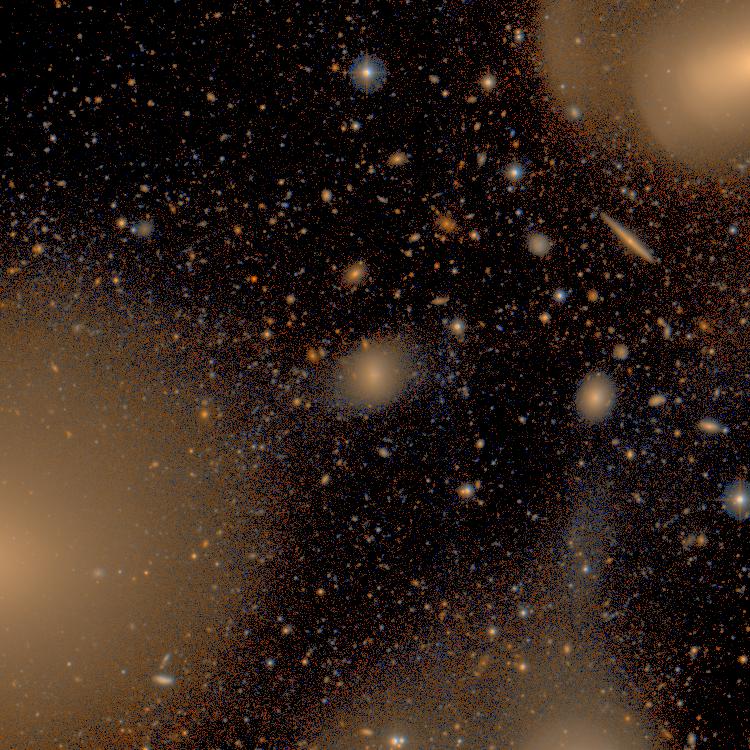
The dwarf and UDG samples were created based on the optical images of the MATLAS survey (Duc et al. 2015). This survey is a facet of the ATLAS3D project (Cappellari et al. 2011a), which aims to characterize the morphology and the kinematics of ETGs in the context of galaxy formation and evolution, and whose observational part is composed of multi-wavelength observations (in radio, millimeter and optical) of a complete sample of 260 ETGs with distances 45 Mpc, declinations , galactic latitudes , and K-band absolute magnitudes . The optical component of ATLAS3D was undertaken by the MATLAS survey and the NGVS (Next Generation Virgo Survey, Ferrarese et al. 2012) with MegaCam on the 3.6 meter Canada-France-Hawaii Telescope (CFHT). The 58 ETGs located in the Virgo cluster were observed for NGVS between 2009 and 2014, while 150 fields containing 180 ETGs and 59 LTGs located outside Virgo, in low to moderate density environments, were targeted for MATLAS between 2012 and 2015. The MATLAS survey data were observed in the g,r,i bands for 150, 148 and 78 fields respectively as well as in the u band for the 12 fields with a distance below 20 Mpc.
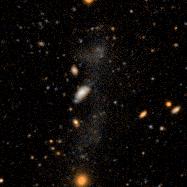
With surface brightnesses ranging down to mag/arcsec2 in the g-band, and an average image quality of 0.96″, 0.84″, 0.65″and 1.03″ in the g, r, i and u bands respectively, the MATLAS images are suitable for the search and identification of dwarf galaxies. Combining a visual inspection of the 150 g-band field images and semi-automated catalogs based on Source Extractor (Bertin & Arnouts 1996) output parameters, Habas et al. (2020) defined a preliminary catalog of 25522 dwarf galaxy candidates. These candidates were then reviewed in a two-step process. First, each candidate was visually inspected by at least three team members and likely dwarfs were flagged and morphologically classified. The resulting 3311 flagged galaxies were subsequently inspected a second time by a five member team in order to remove any remaining potential background galaxies and to confirm the assigned morphological classifications. After removing any remaining duplicates, this lead to a clean sample of 2210 dwarf galaxies. Based on their absolute magnitude, knowing that the brightest dwarfs have M (Kormendy 1985), the dwarf nature was confirmed for 99% of the galaxies with an available distance measurement (13.5% of the sample, including some of the HI distances presented here) and the one-sky positions and relative velocities suggest that 90% of this subsample are satellites of the nearest massive galaxy (ETG or LTG) in the ATLAS3D parent sample. In a similar test, 80% of the subsample of dwarfs with known distances were shown to be satellites of the targeted ETG in the images. Based on these statistics, the rest of the dwarfs in the sample without known distances were assumed to be associated with the central ETG in the field and the distance of the ETG was therefore assigned to the dwarfs. Although the sample appears robust, it is likely incomplete. Galaxies with diffuse haloes but extended light concentrations in the nuclear region, irregular galaxies, small objects, as well as galaxies at the bright end of our initial sample were difficult to classify and hence some dwarfs were potentially rejected. It is particularly important to note for this work that some dIs, potentially HI-bearing, may have been missed due to their possible confusion with background galaxies. The MATLAS dwarf sample completeness is described in Habas et al. (2020). A discussion specifically related to the HI dwarfs is presented in Section 4.1.
An analysis of the structural and photometric properties of the MATLAS dwarfs was performed using the software galfit (Peng et al. 2010). The galaxies were fit by a Sérsic profile (Sérsic 1963) and the structural and photometric properties, such as the Sérsic index, effective radius, the apparent magnitude and the and colors, were derived for 1589 MATLAS dwarf galaxies, including 1437 dEs and 152 dIs (Poulain et al. 2021). The surface brightness of the modeled dwarfs was computed based on the equations of Graham & Driver (2005), using the total magnitude and effective radius. We note that the properties were derived for 87% of the dEs and 27% of the dIs; we could not get a reliable model for a large majority of the dIs due to their irregular shape and internal structures, and for some dEs due to a very bright center.
A subsample of the 1589 modeled dwarfs, 59 in total, have effective radii 1.5 kpc and a central surface brightness 24 mag/arcsec2 (Marleau et al. 2021). We will adopt these galaxies as our UDG subsample for the remainder of the paper.
3 HI observations
3.1 ATLAS3D HI survey
The ATLAS3D HI survey (Serra et al. 2012) consists of the radio observations of 166 nearby ETGs from the ATLAS3D project with a declination ¿ 10° by the Westerbork Synthesis Radio Telescope (WSRT). We focus our study on the subsample of 110 ETGs situated outside the Virgo cluster, in common with the MATLAS survey. Of these 110, 14 were part of previous surveys (Morganti et al. 2006, Oosterloo et al. 2010) that studied the kinematics of SAURON ETGs with HI line observations with the WSRT (de Zeeuw et al. 2002). In both the ATLAS3D and SAURON surveys, the galaxies have been observed for 12h over a bandwidth of 20 MHz (4000 km s-1) sampled with 1024 channels with a field of view of about one square degree111Except for the field of view of NGC4150 which is about 2 square degrees.. The telescope has a detection limit of M M⊙ for a galaxy as far as the Virgo cluster ( 16 Mpc) and a beam size of 1′. To obtain the HI cubes222Available at http://www-astro.physics.ox.ac.uk/atlas3d/., the data were reduced with a pipeline based on the miriad package (Sault et al. 1995), and the resulting HI cubes were constructed using a robust null weighting (Briggs 1995) and a velocity resolution of 16 km s-1 after Hanning smoothing.
3.2 ALFALFA survey
The ALFALFA survey data was used to complement the the ATLAS3D data. It is a second generation blind survey specialized in extragalactic HI sources detection with a better sensitivity and resolution than previous blind surveys such as the HI Parkes All Sky Survey (HIPASS, Staveley-Smith et al. 1996) and the HI Jodrell All-Sky Survey (HIJASS, Lang et al. 2003). The observations were performed with the Arecibo telescope over an area of 7000 deg2 split in two regions with a declination 0° ¡ ¡ 36° and two right ascension ranges 07h30m ¡ RA ¡ 16h30m and 22h ¡ RA ¡ 03h, with a beam size 4′. As it was designed to study the low mass end of the HI mass function (Giovanelli et al. 2005), it can detect galaxies with an HI mass down to M⊙. This survey has a velocity resolution of 10 km s-1 after Hanning smoothing. For our work, we use the final release of the extragalactic HI sources catalog (Haynes et al. 2018) which contains approximately 31,500 sources, most with a SNR ¿ 6.5. HI sources with a lower SNR were kept if they were successfully matched with a galaxy of known redshift.
3.3 HI dwarf and UDG samples
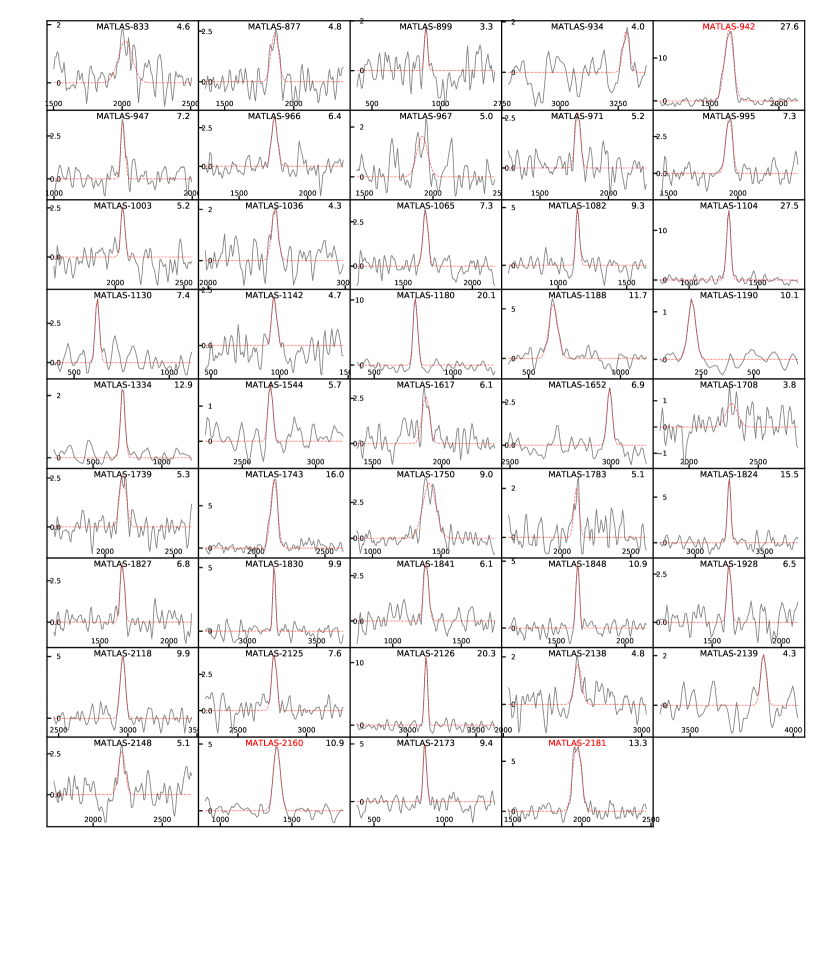
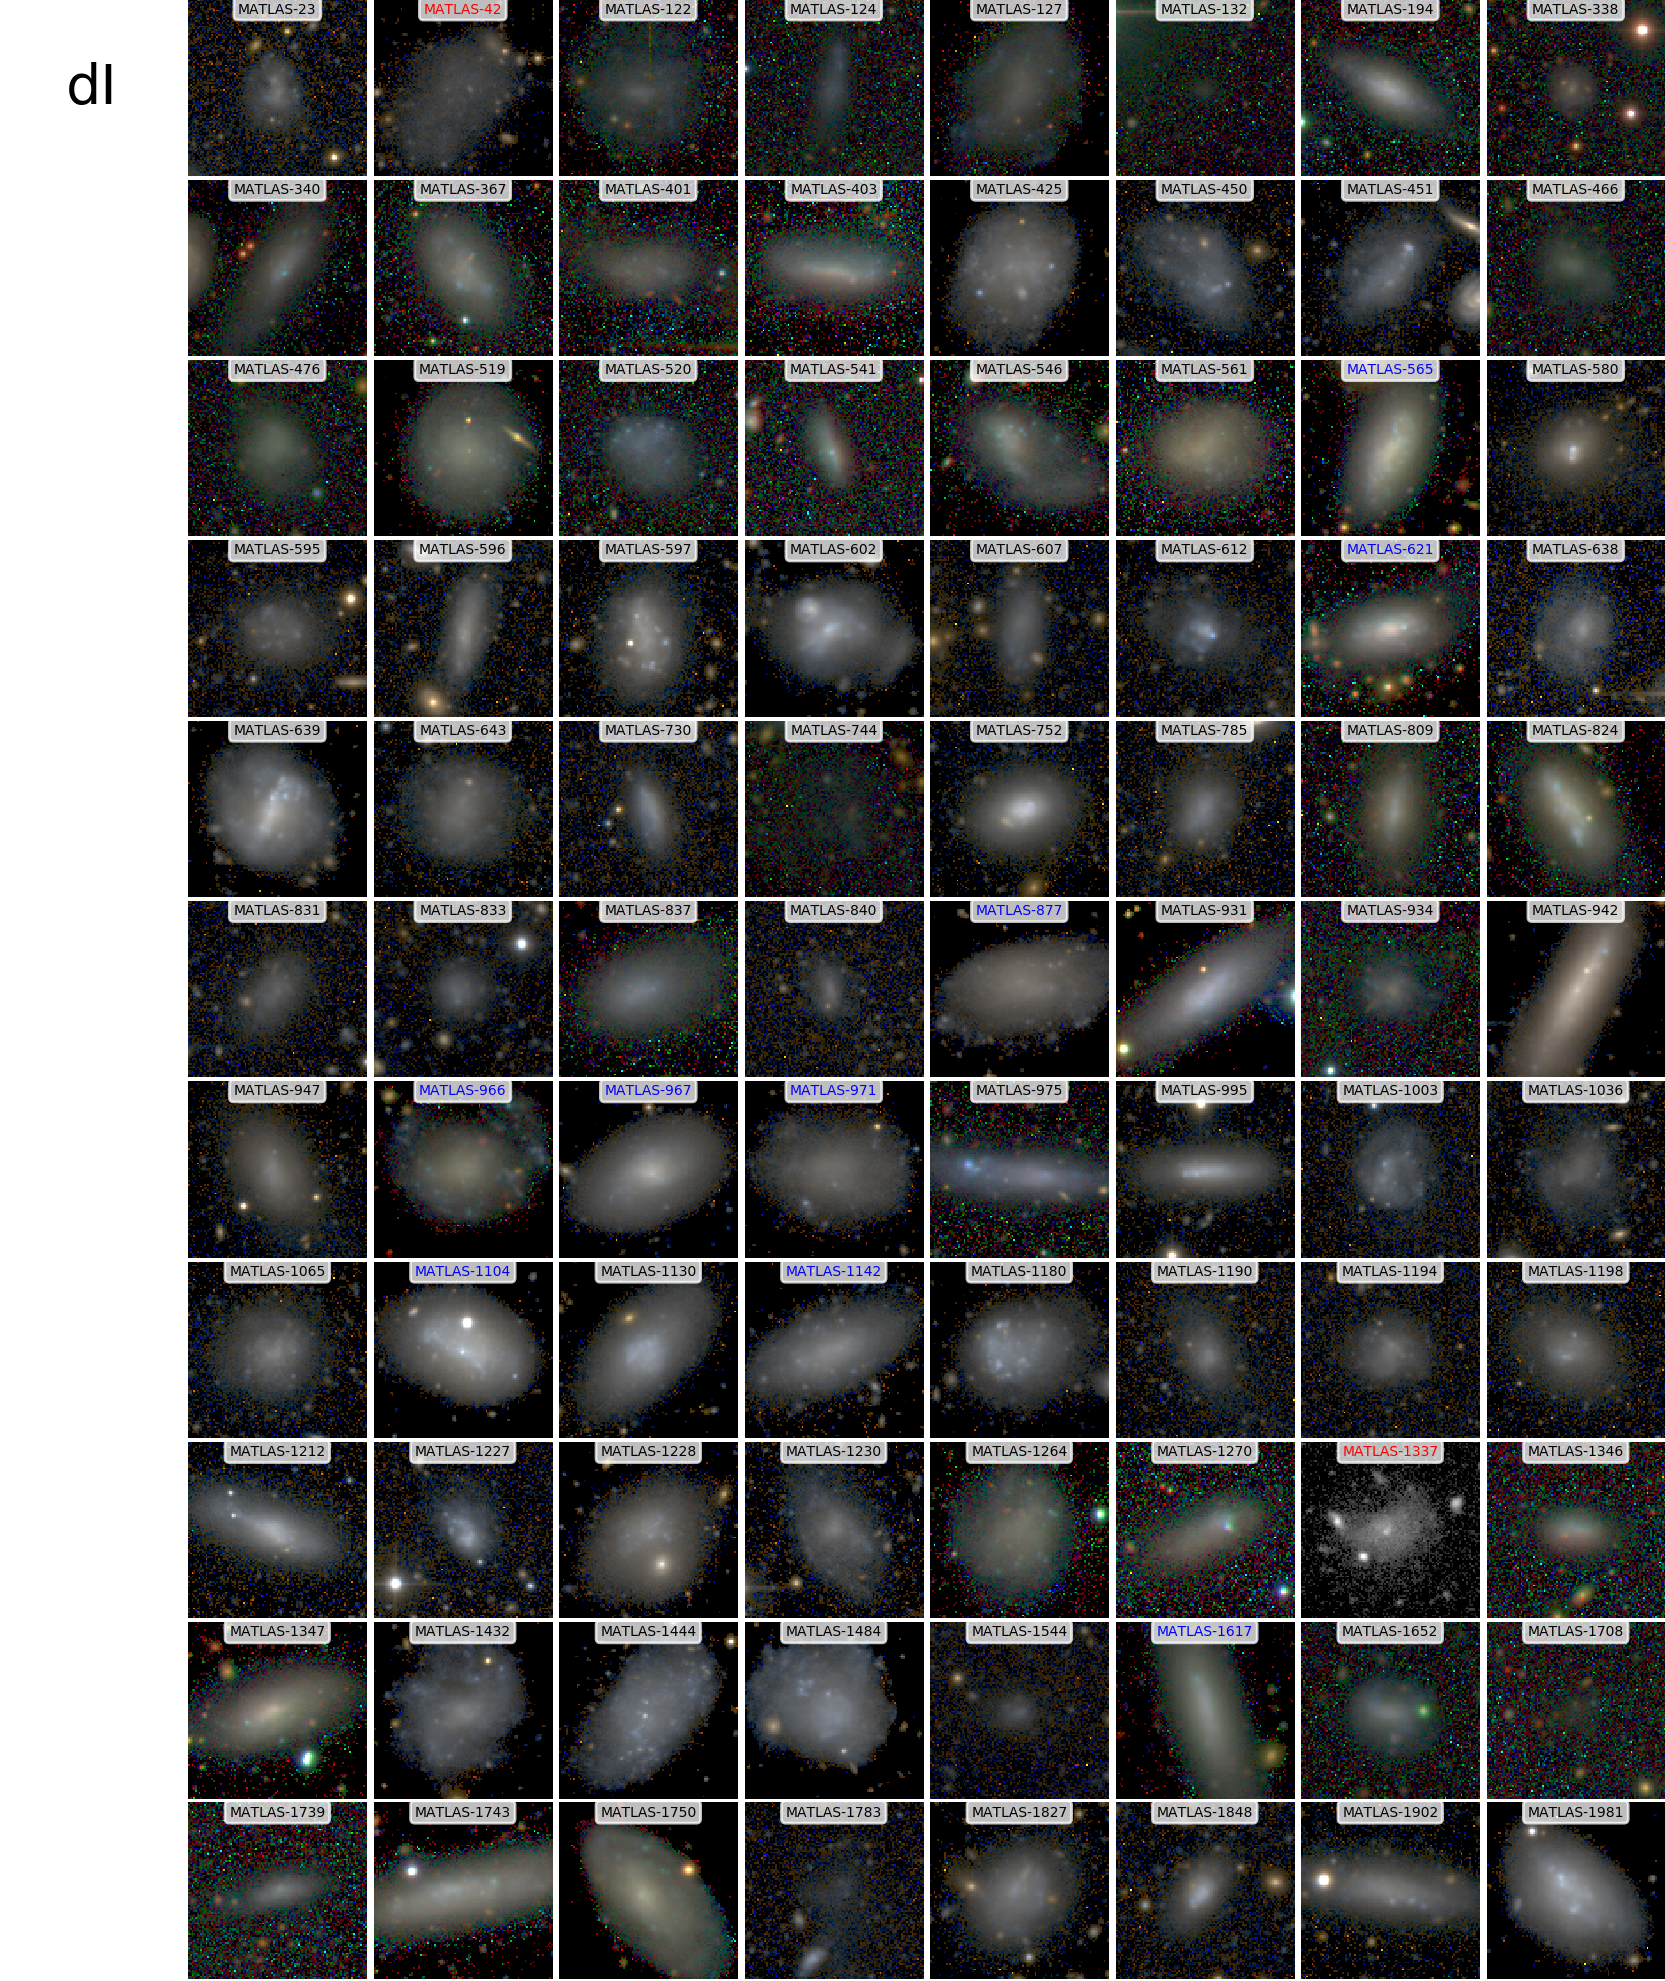
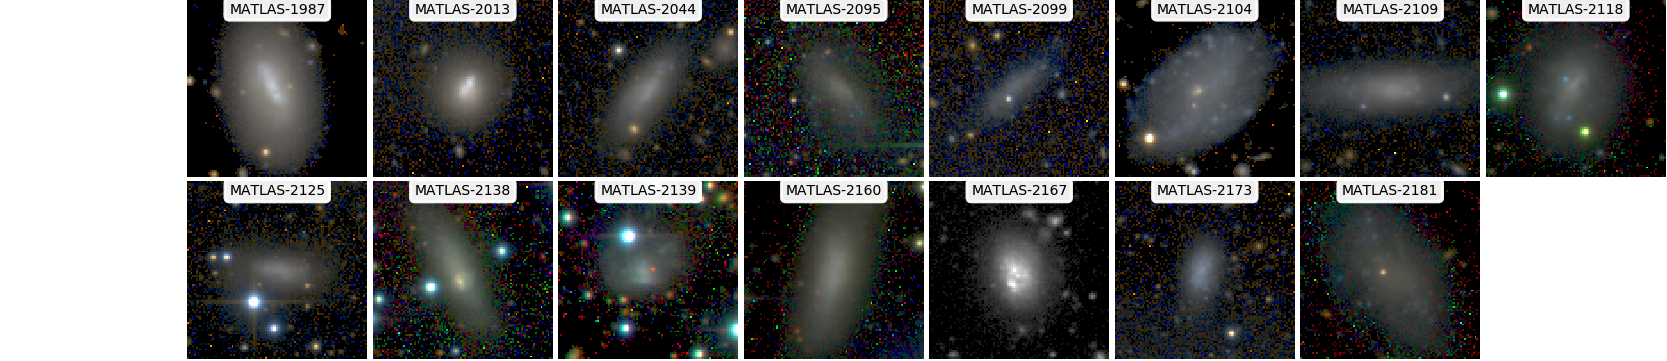
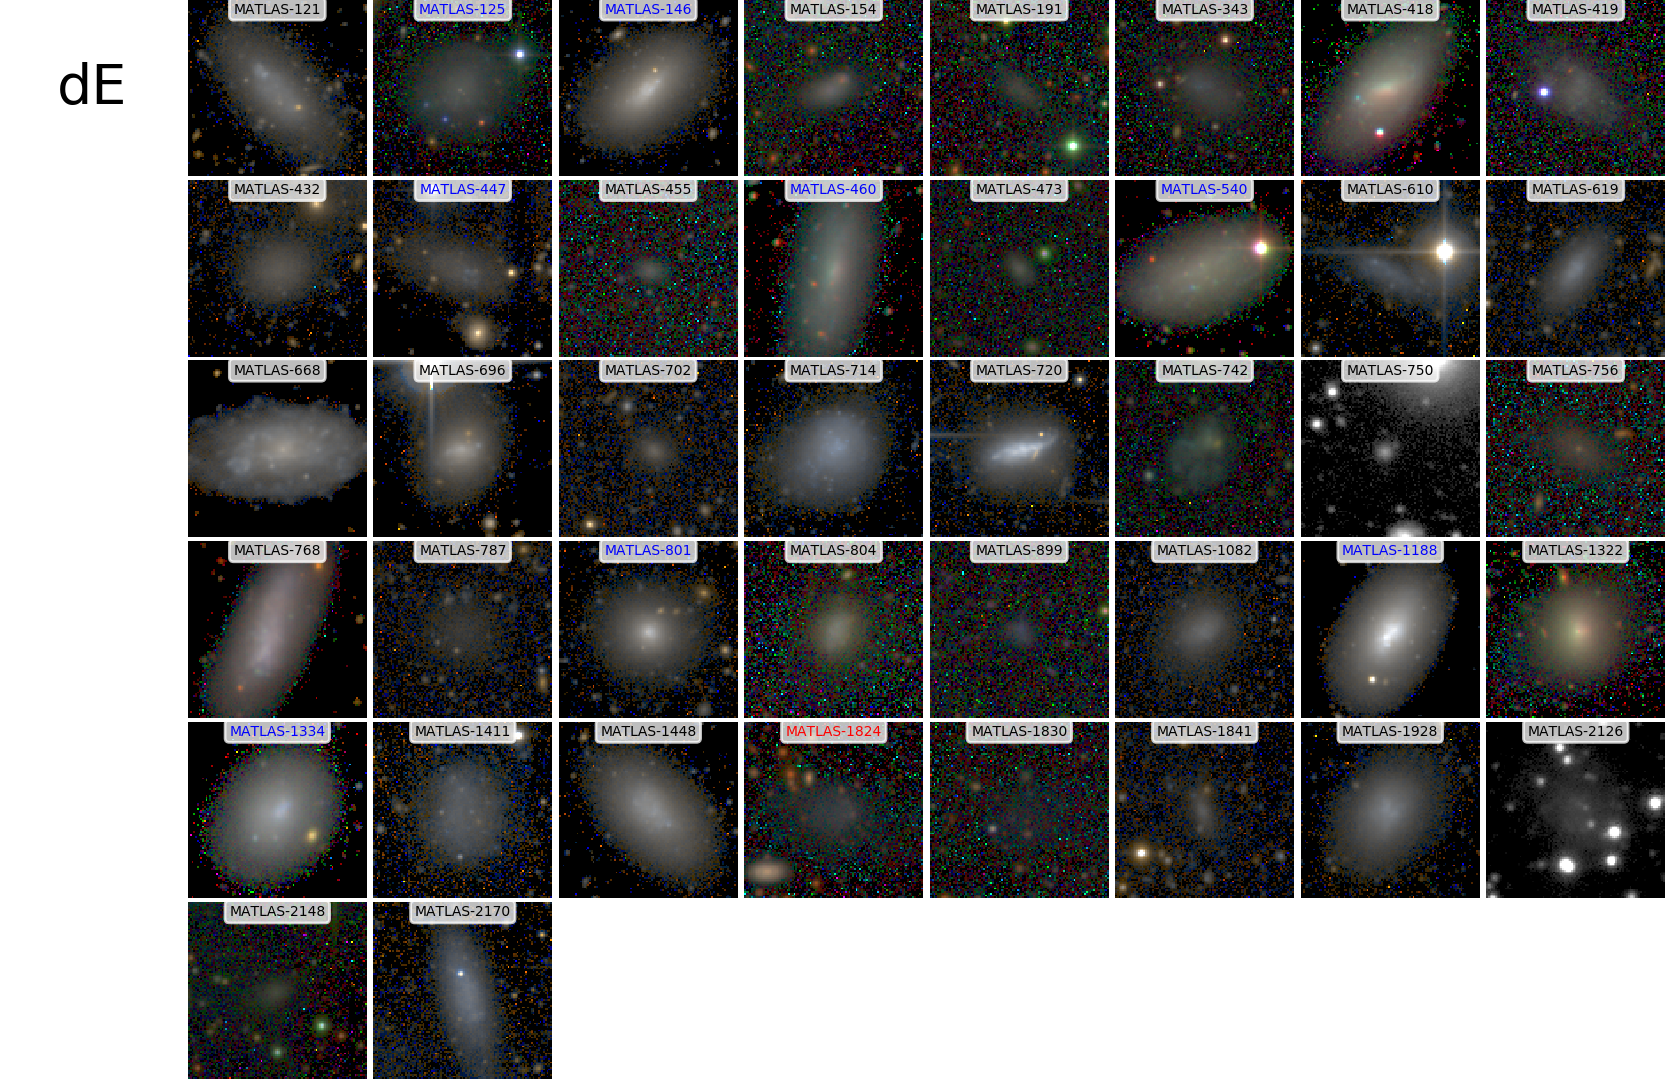
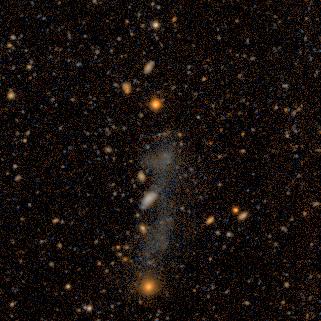
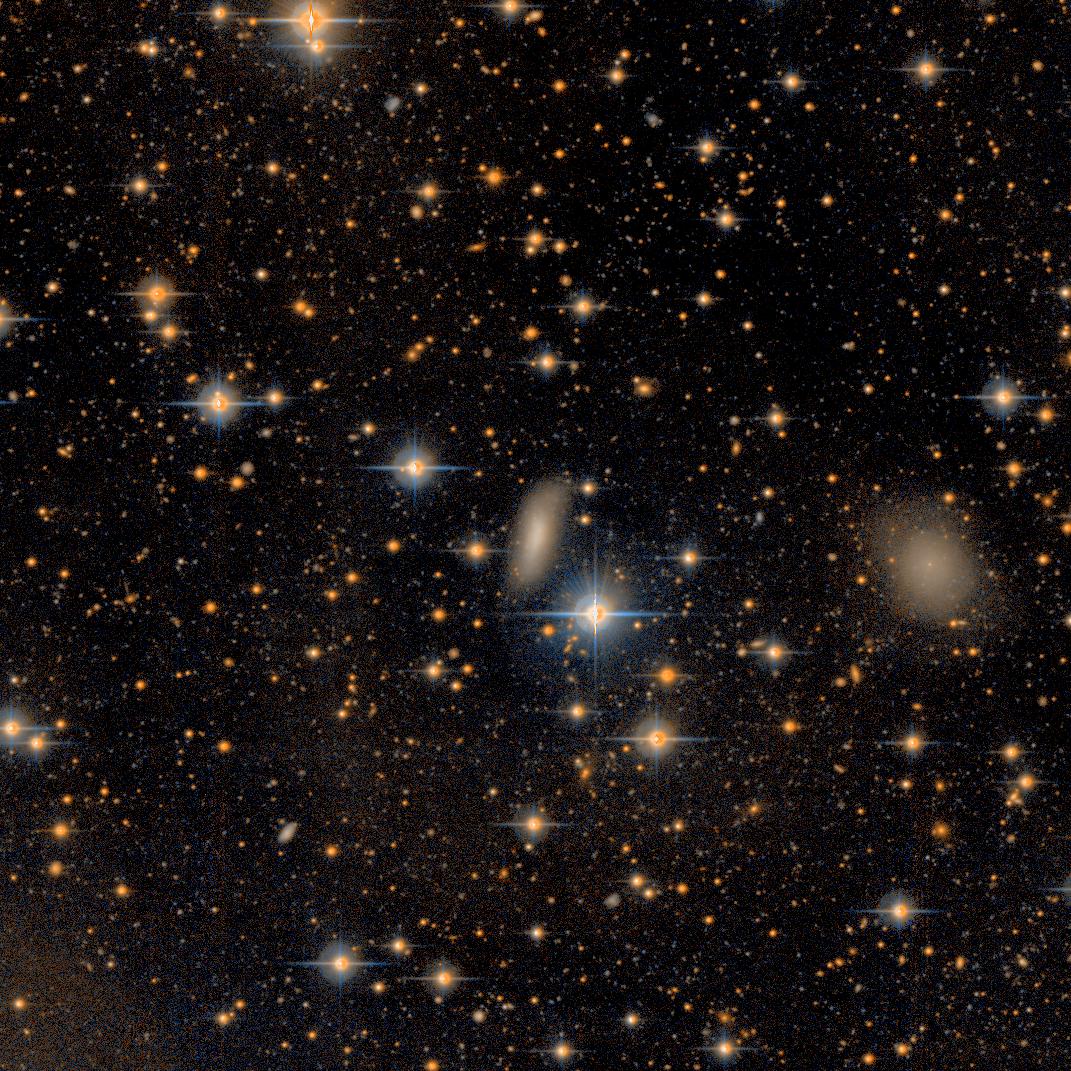
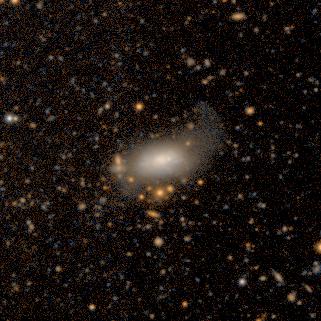
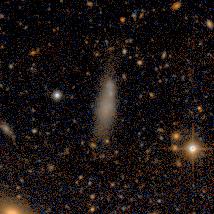
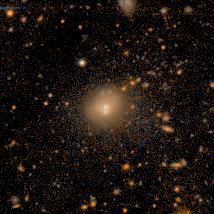
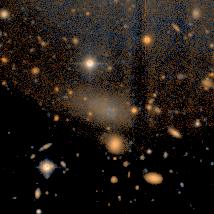
Of the 2210 dwarf galaxies in the MATLAS survey, 1773 dwarfs fall within the footprints of either the ATLAS3D HI survey (1141) or the ALFALFA survey (1139). It should be noted, however, that we do not expect a detection for each of these dwarfs as the dEs (77%) are expected to be gas poor. Additionally, given the assumed distances of the dwarfs and the mass detection limits of the telescopes, it is unlikely that we will detect HI masses below M⊙, M⊙ from Arecibo, WSRT, respectively. Nevertheless, we searched for HI-counterparts for all 1773 dwarfs within the footprints of the two surveys, using the cubes and contours of the ATLAS3D survey as well as the ALFALFA extragalactic HI source catalog. First, we searched for HI detections with separations smaller than the beam size of the telescope from the optical detections. Then, we visually inspected the matched sources using g-band images and, in the case of the ATLAS3D HI survey, the HI images to ensure that the dwarf is the HI source and that the HI is not centered on a nearby galaxy. We detected HI in 145 dwarfs, with 94 and 64 detections in ATLAS3D and ALFALFA, respectively, and a total of 13 galaxies detected in both surveys. We note that this sample includes 42 dEs, and that 18% are classified as nucleated. Of the HI sample, three dwarfs are classified as UDGs based on their structural properties. The HI line profiles of the 94 detections in ATLAS3D, and 145 color cutouts of the galaxies are displayed in Figure 12 and 15 of Appendix A, respectively. We highlighted the dwarfs detected in both surveys with a red name in the HI spectra.
4 HI and optical properties of the MATLAS dwarfs
4.1 HI properties
We present here the HI properties of the 145 HI-bearing dwarfs as well as the methods used to extract them from the HI spectra. The HI properties are available in Table 1.
W50. Defined as the line width measured at 50% of the maximum intensity. We measure W50 in the range 19186 km/s. One dwarf, MATLAS-447, has a W50 value of 16 km/s, which is roughly the same as the velocity resolution of the ATLAS3D HI survey; we have kept the galaxy in the sample, but will not include it in any discussion of W50 going forward.
Velocity. The velocity corresponds to the median point of the 21 cm line profile measured at 50% of maximum intensity. The MATLAS HI dwarfs show a large range of velocities, from 200 to 7000 km/s. We estimate errors on the velocities in the range km/s.
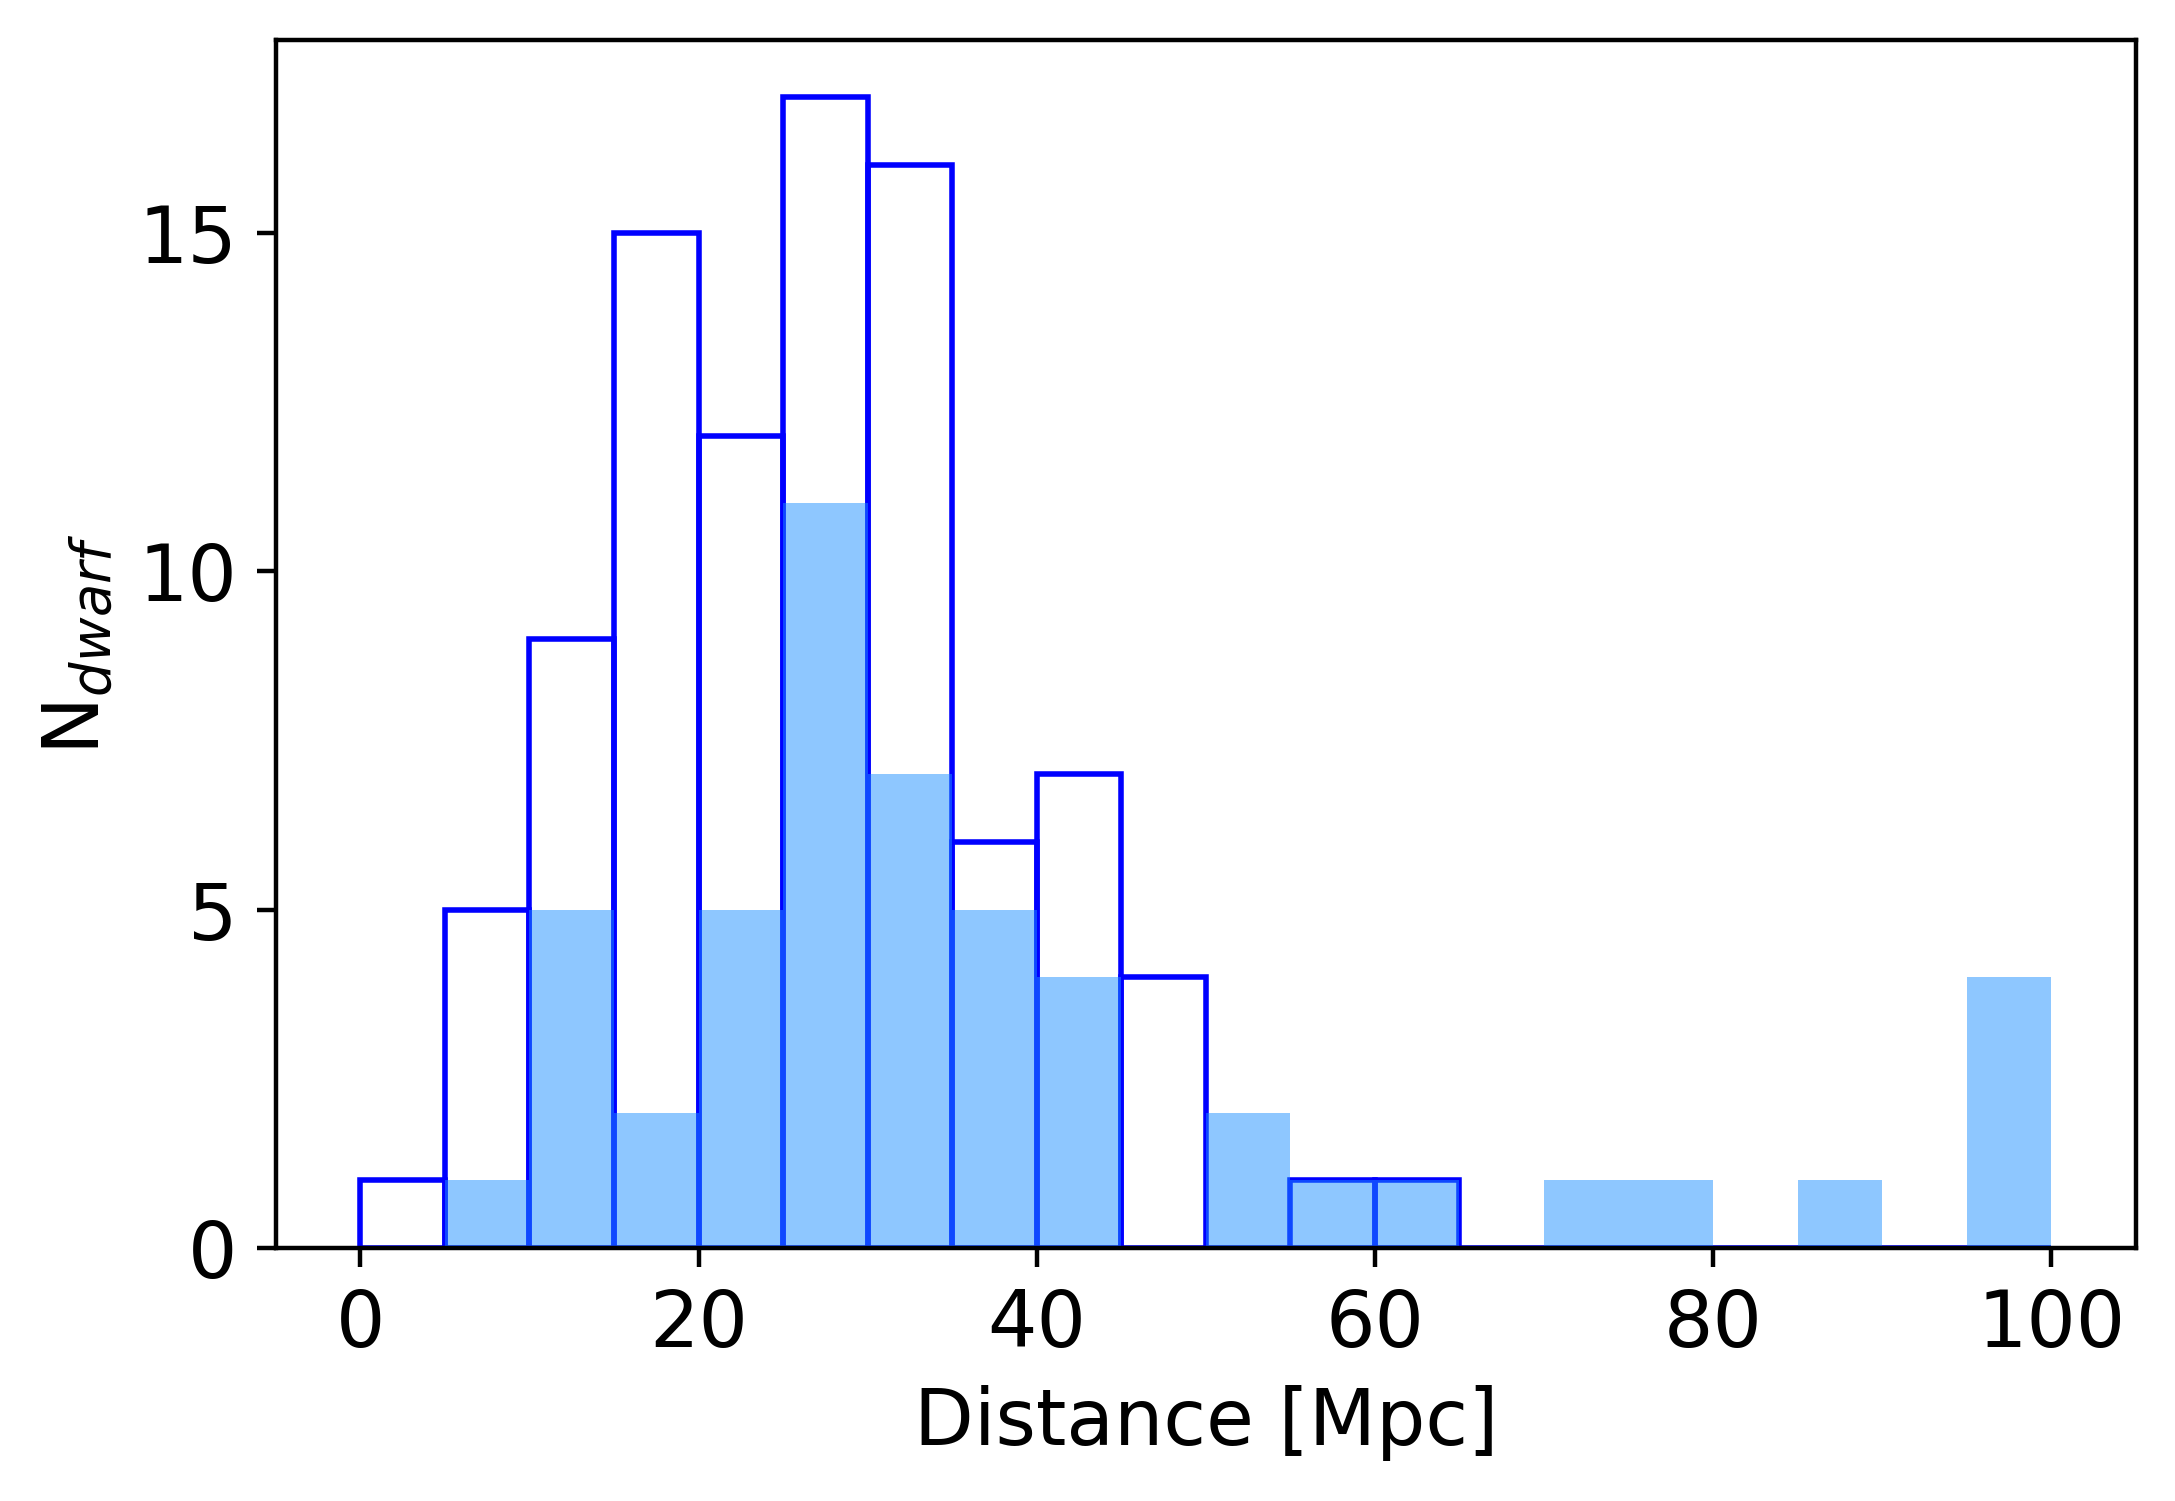
Distance. We corrected all obtained heliocentric velocities for the infall to the Virgo cluster and to the Local Group following the method from Mould et al. (2000). From these corrected velocities, we computed the distance of the galaxy using the formula with = 70 km s-1 Mpc-1 and estimated its uncertainty. To be consistent, we computed the distances using the same method for both ATLAS3D and ALFALFA extracted velocities, as the distance to the galaxies with a velocity below 6000 km/s were obtained using a different method in the ALFALFA catalog. The distances we compute are between 2 and 99 Mpc. These HI distances are used to calculate all the distance-dependent HI and optical properties of this paper.
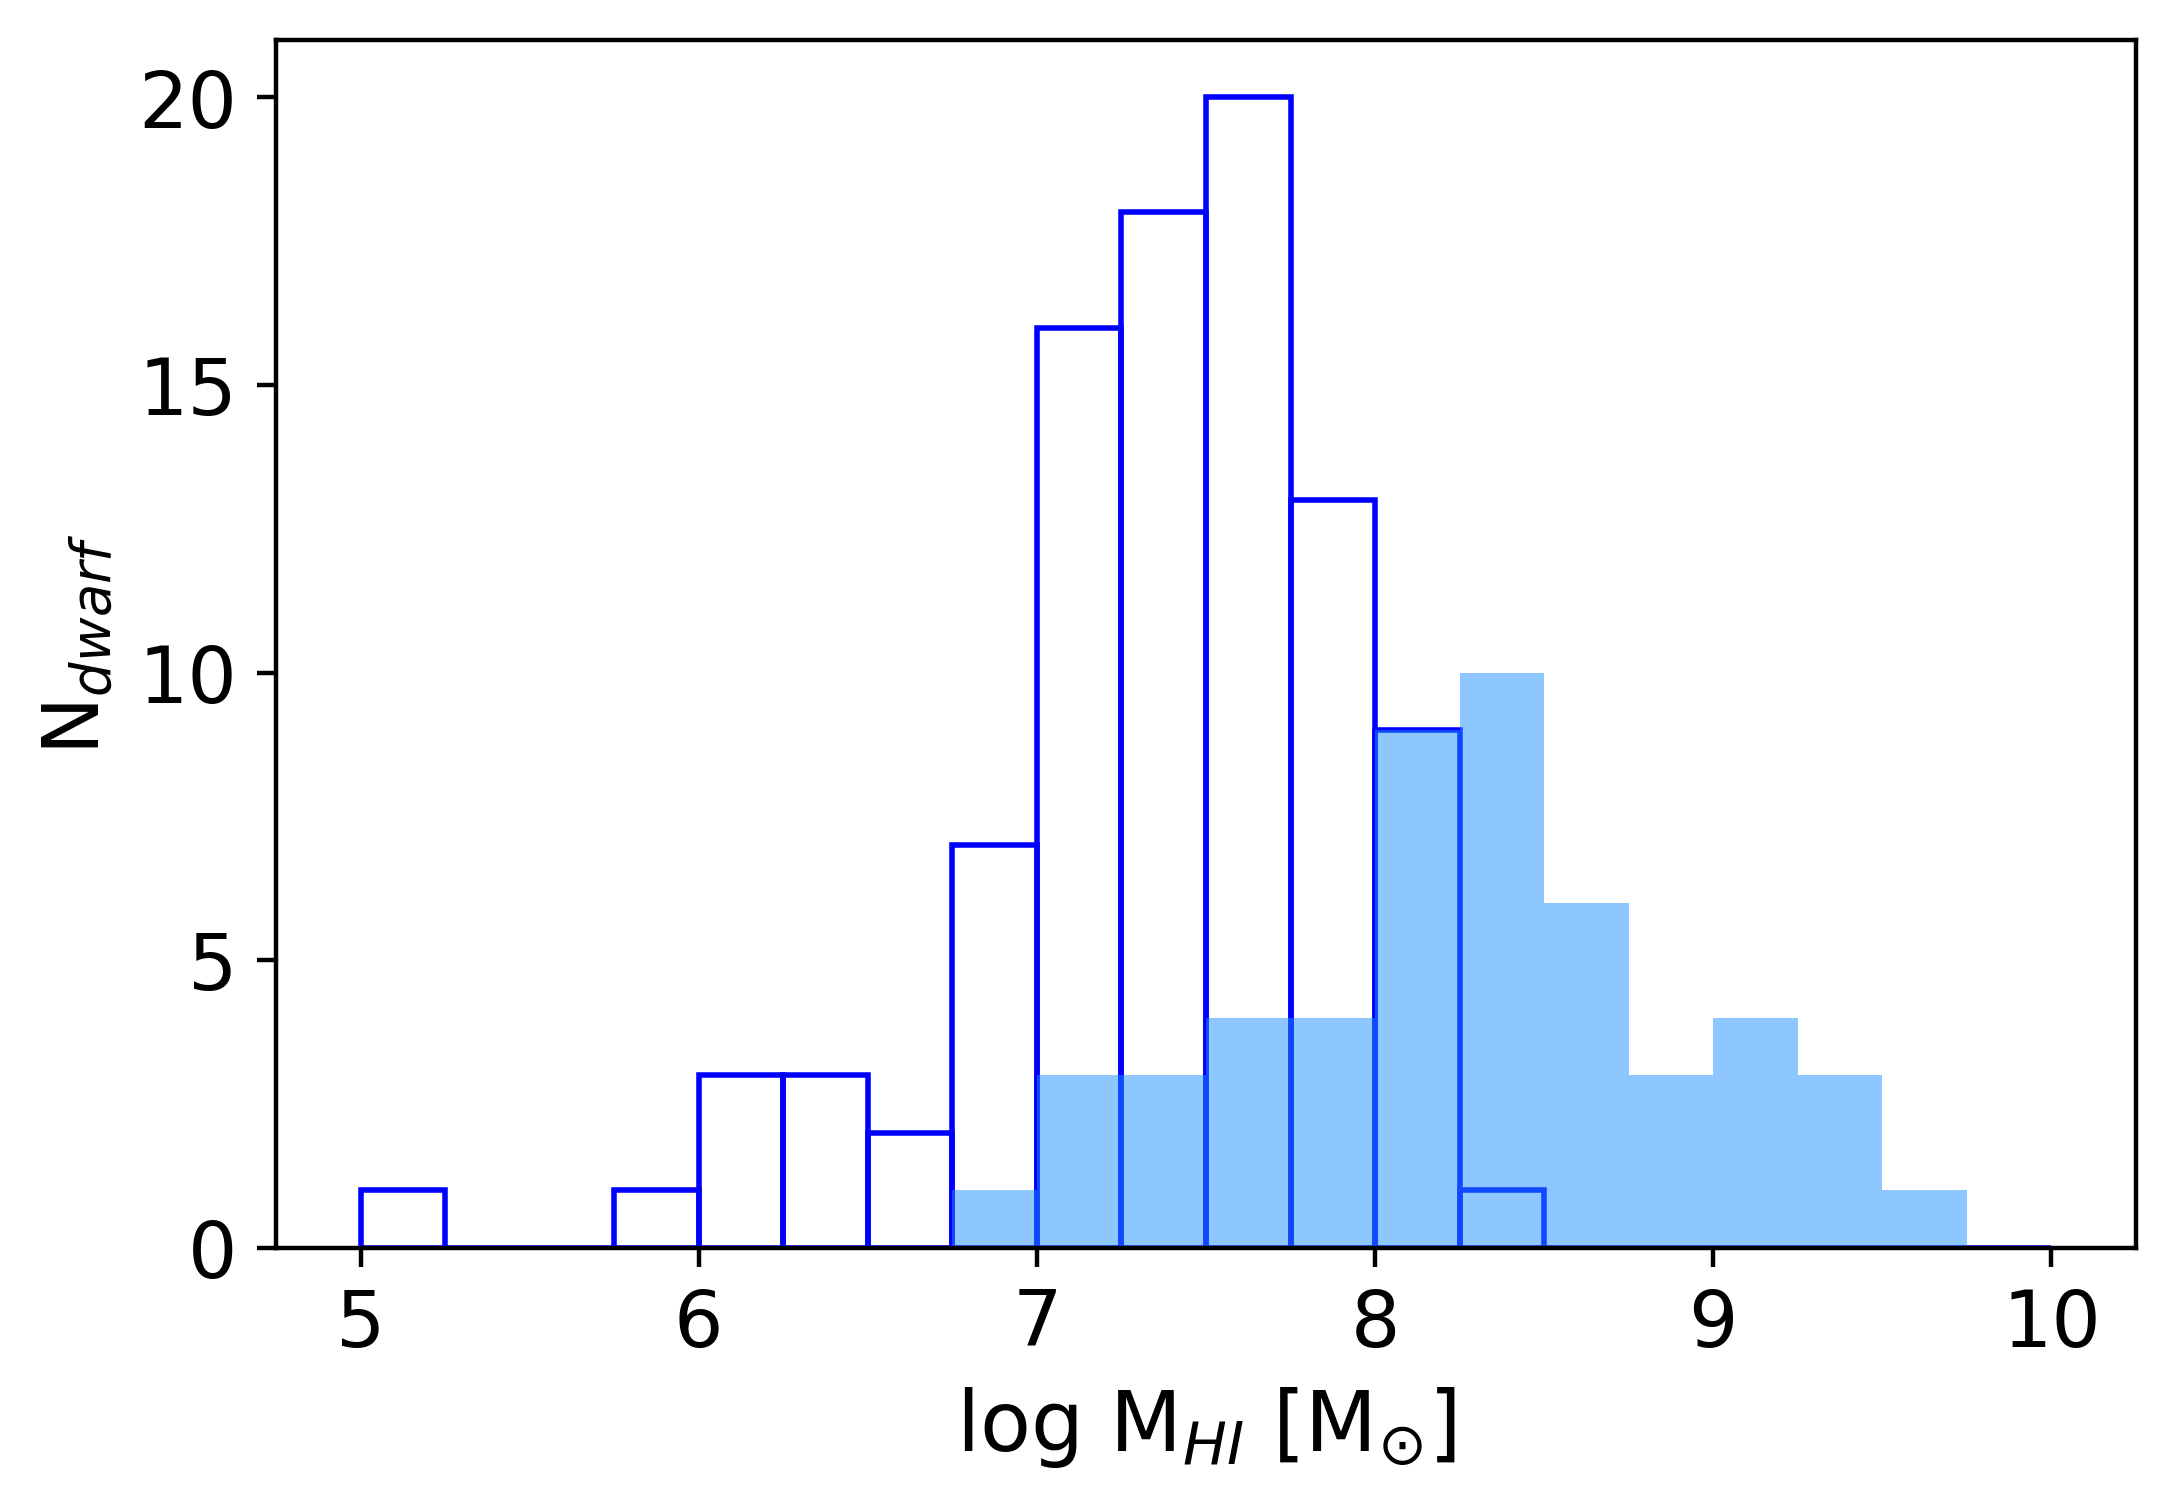
HI mass and flux. We derived the HI mass from the standard formula log(MHI/M⊙)= (Roberts 1962), with the derived distance in Mpc and the integrated HI flux in Jy km.s-1. The HI spectrum of each dwarf has been fit by a Gaussian and then integrated to get the flux value . The MATLAS dwarfs with HI detections have HI masses log(MHI/M. Similar to the method from (Haynes et al. 2018), we compute the error on the HI mass based on the error on the HI flux, derived from the uncertainties of the Gaussian fit, and the error on the distance.
SNR. We defined the signal-to-noise ratio as the ratio between the amplitude of the detection peak and the rms noise of the spectrum. The detected dwarfs have SNR between 3.3 and 45.2. No cut in SNR was applied to the HI sample.
We note that, for the dwarfs observed by Arecibo only, we used the W50, velocity, HI flux values, and their respective uncertainties, from the ALFALFA catalog. Moreover, considering the 13 dwarfs detected in both surveys, we find that we measure comparable velocities and W50 line widths using the ATLAS3D data as compared to ALFALFA, with an estimated median difference of 1% and 14%, respectively. Note that we do not often display the errors on the different properties in the figures, as the error bars would appear smaller than the markers.
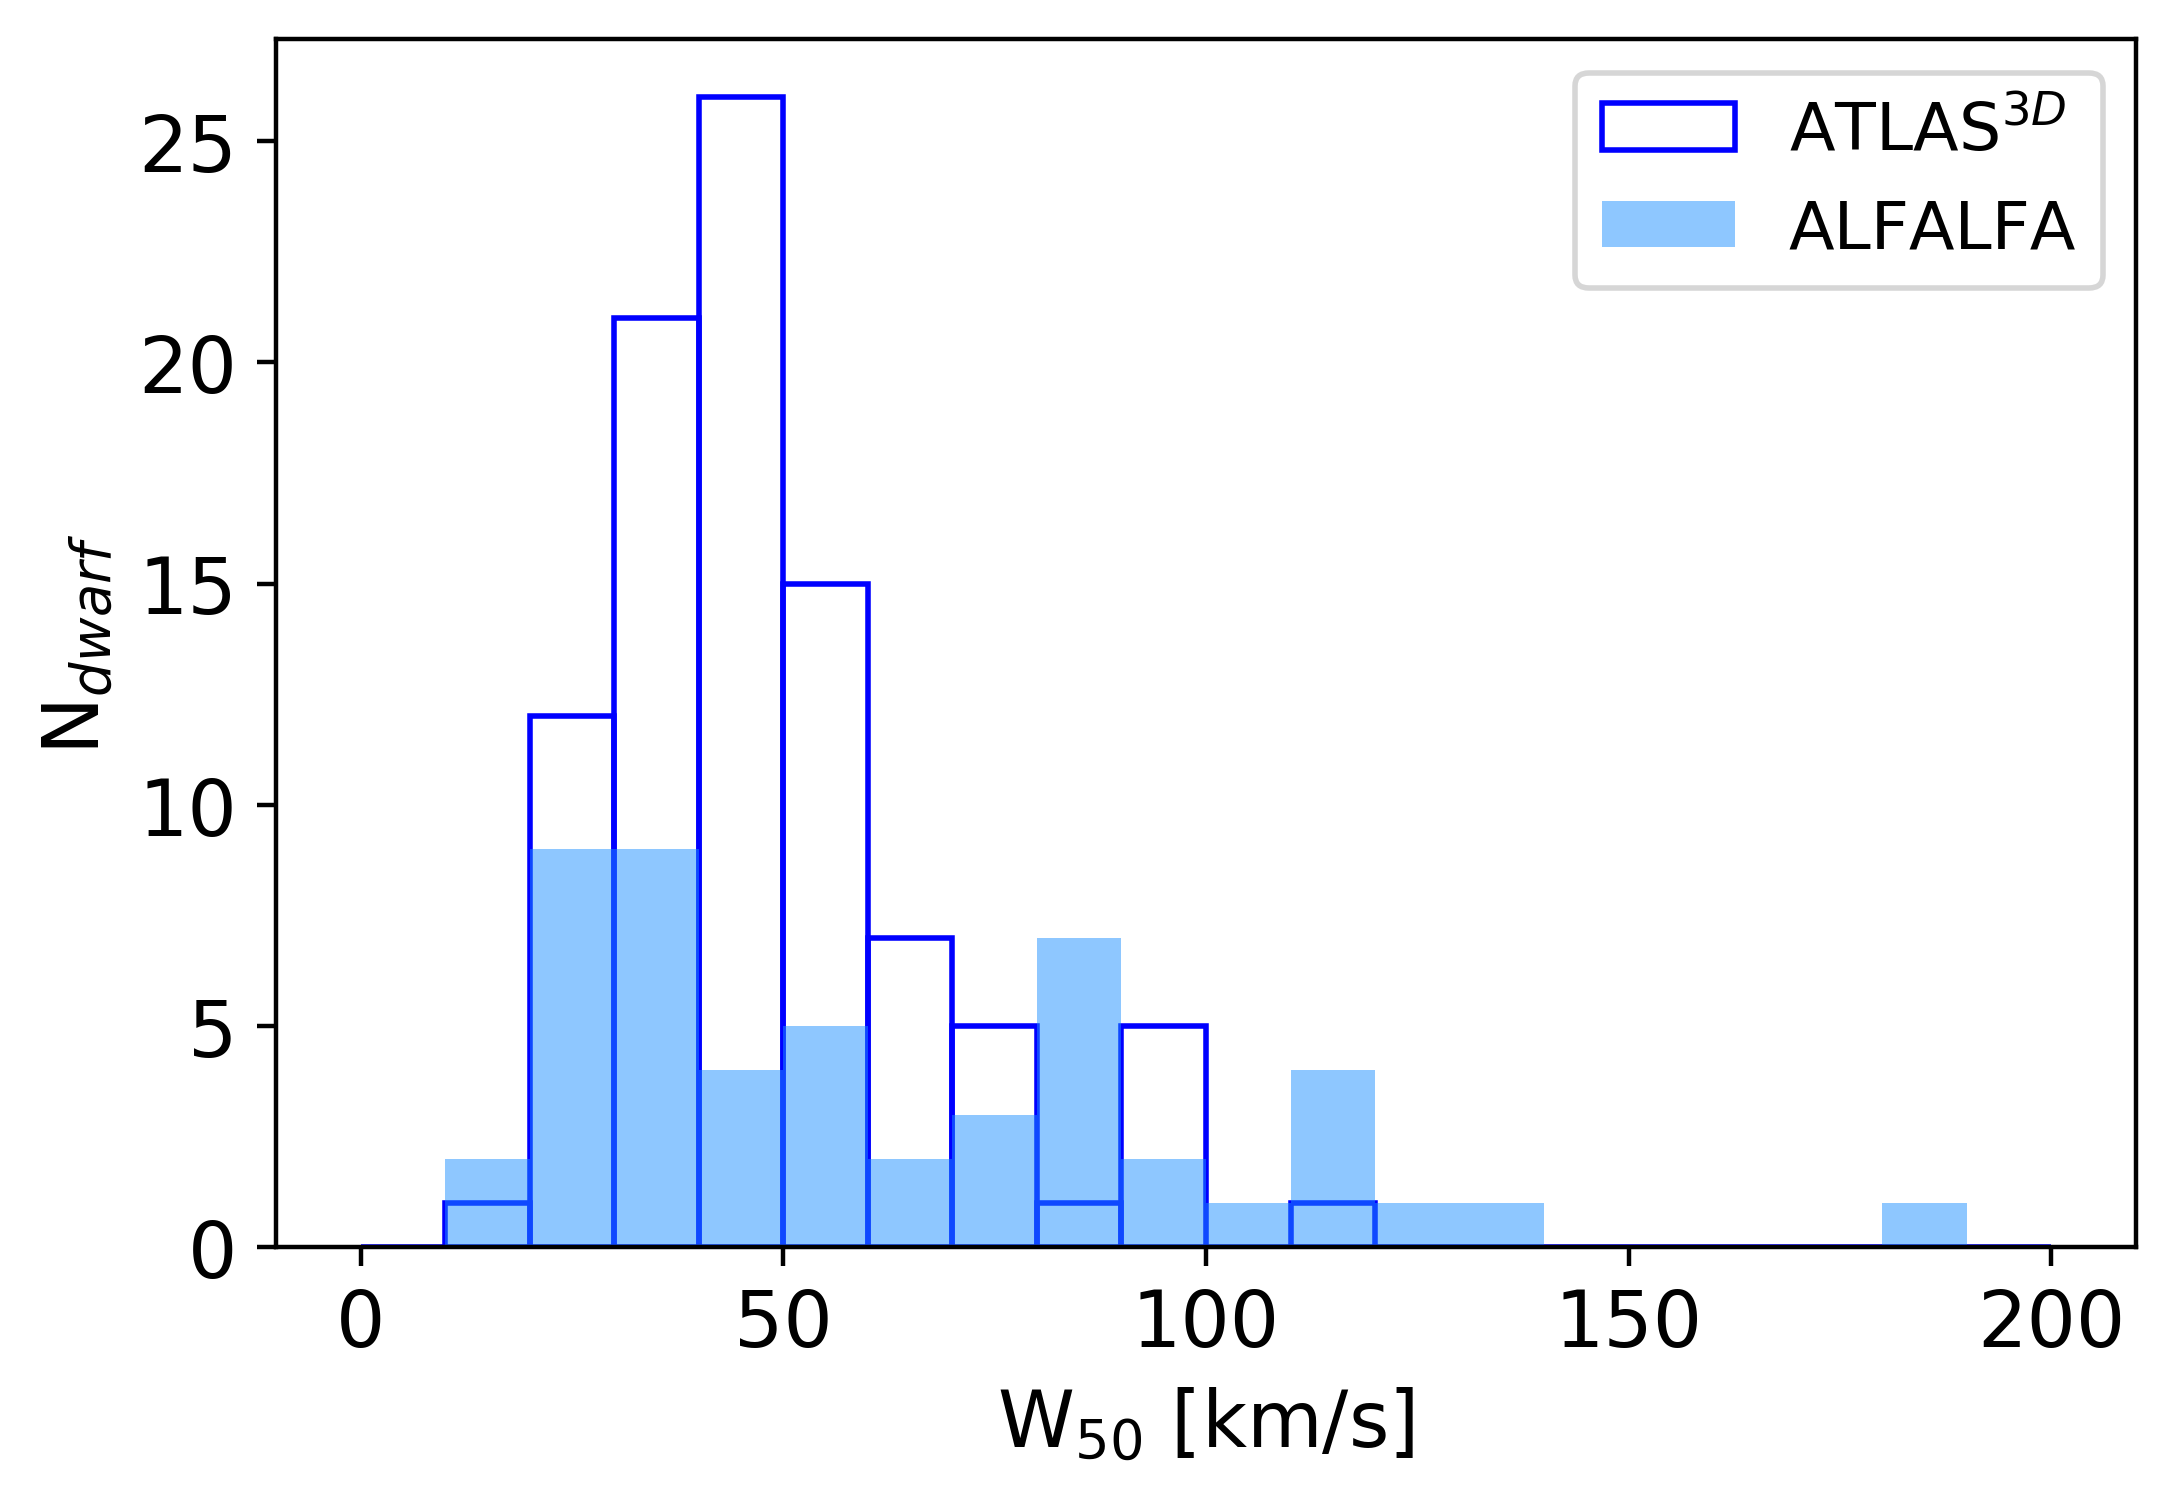
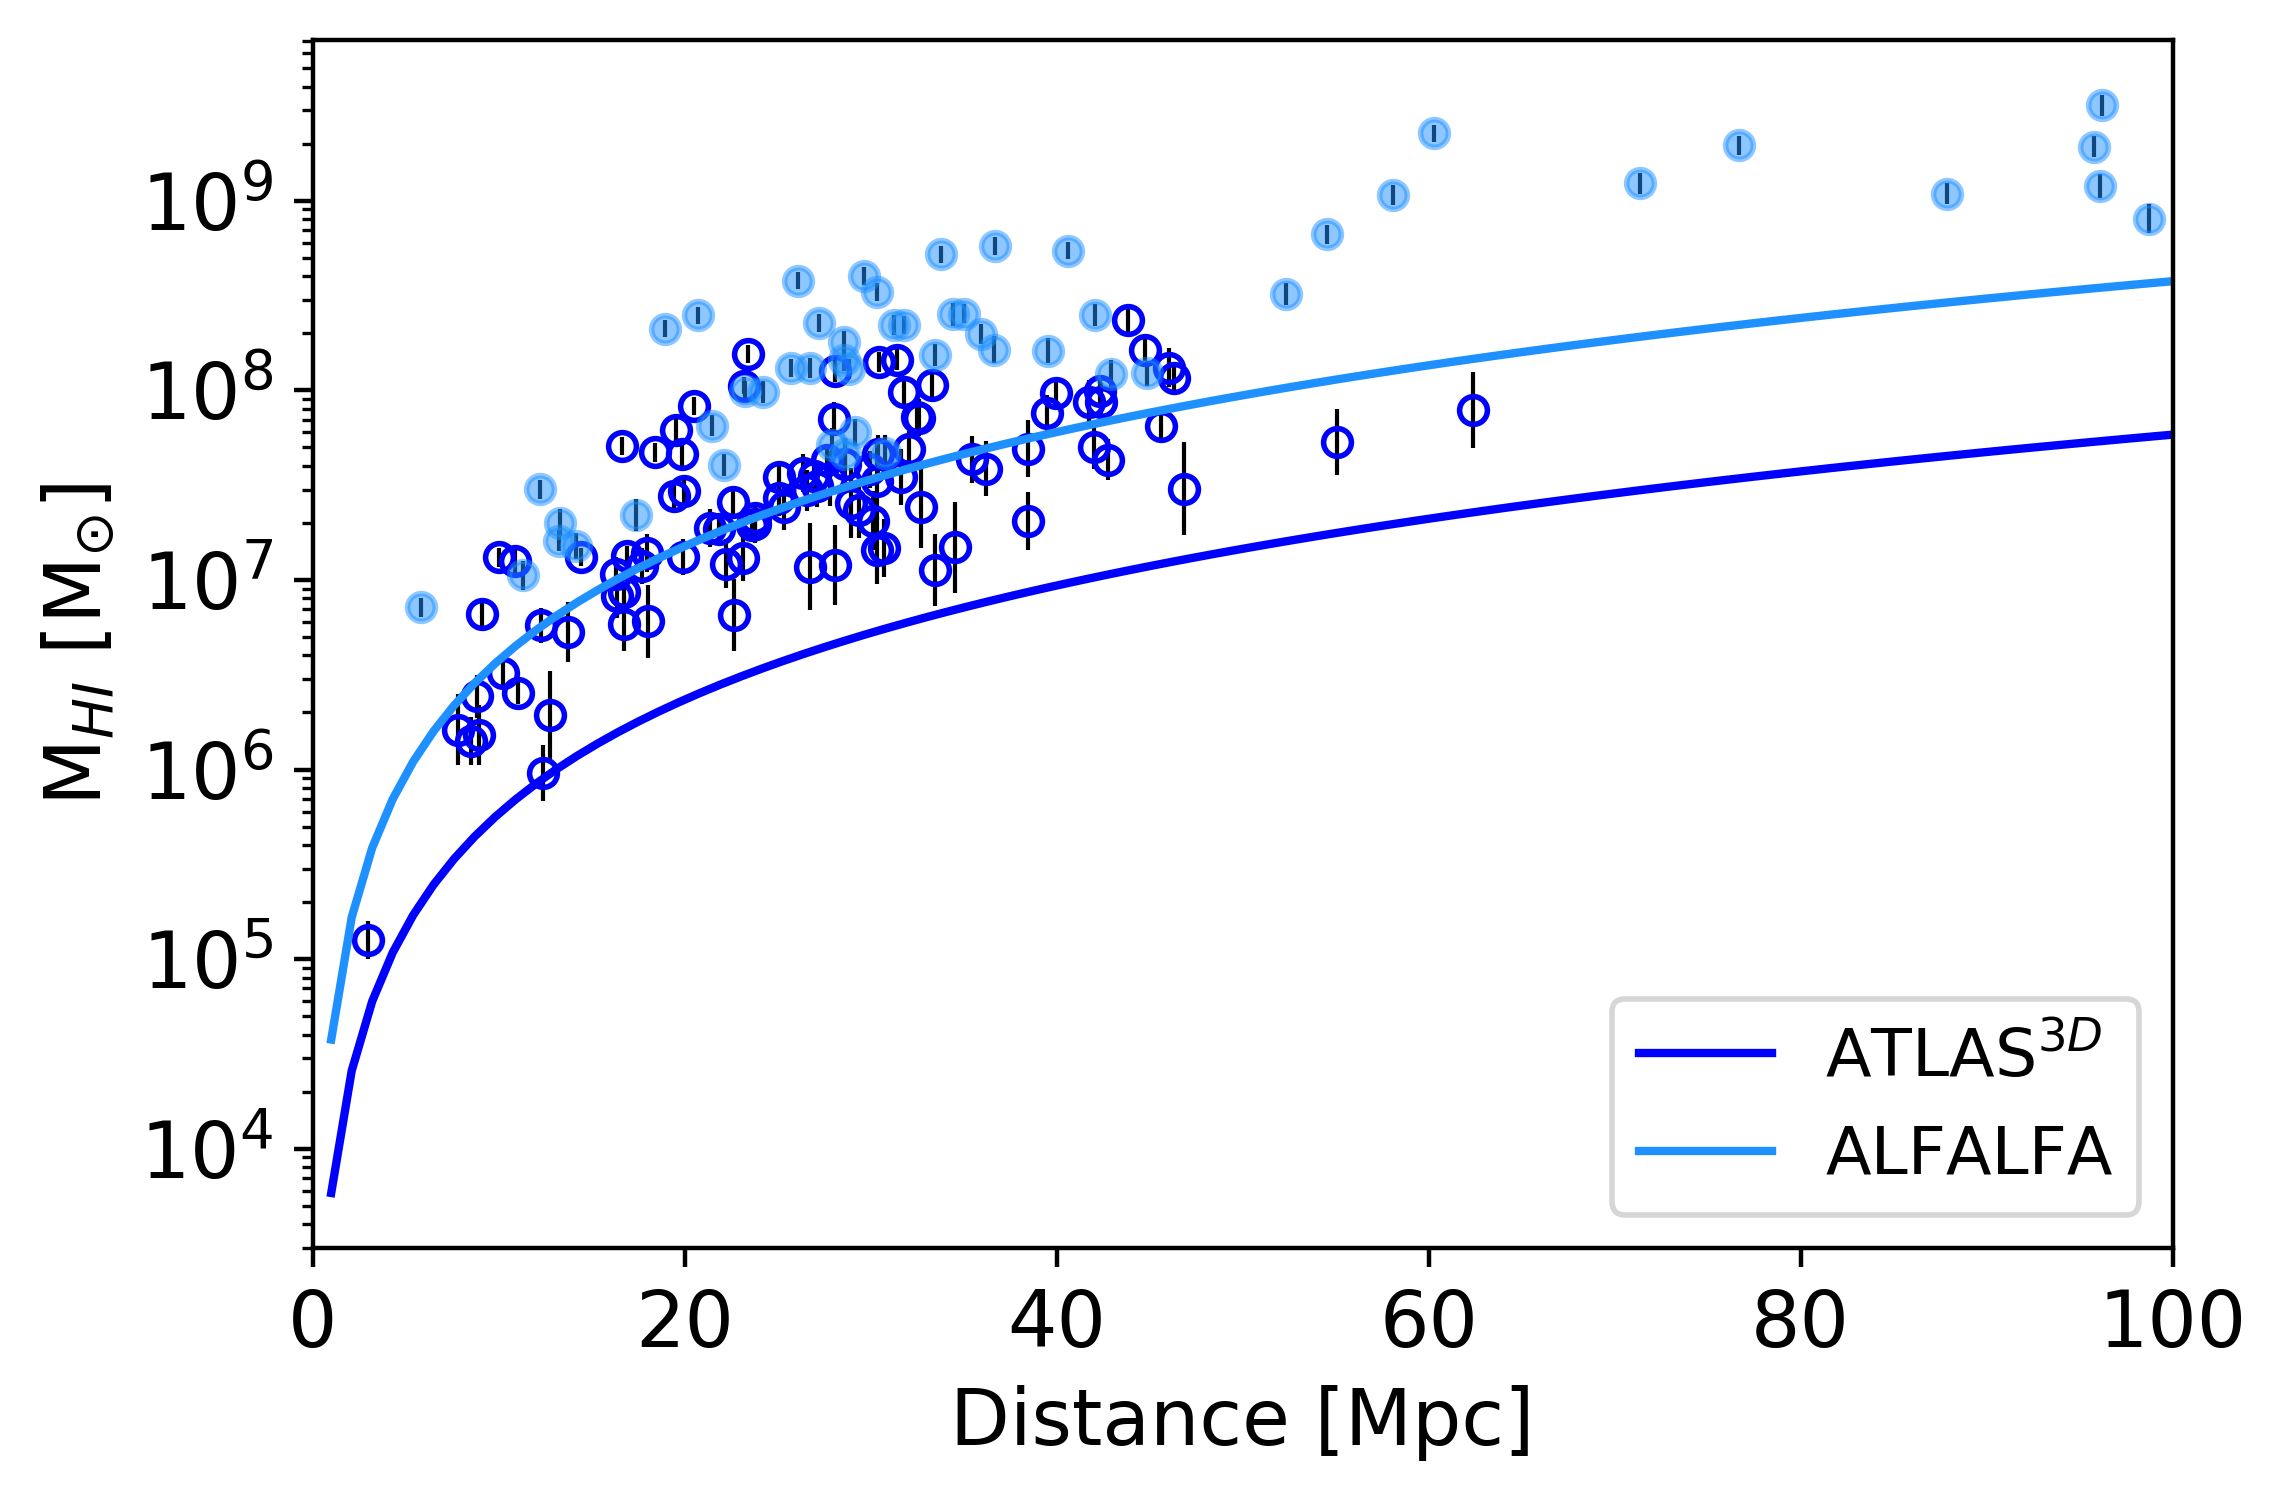
The distribution of selected HI properties is plotted in Figure 1. It is readily apparent that the ATLAS3D and ALFALFA HI surveys span different distance and HI mass ranges. The difference in the range of distances probed is due to the fact that the ATLAS3D ETGs all have distances 45 Mpc, so a maximum velocity corresponding to 76 Mpc was imposed to the dataset, while ALFALFA can observed galaxies up to 250 Mpc. The difference in the HI mass distributions is due to the sensitivity of the radio telescopes. In Figure 2 we show the HI mass calculated for the dwarfs in each survey, as well as the detection limit in HI mass as a function of distance. We estimate the limit of detection using the formula from Gavazzi et al. (2008):
| (1) |
with, for each survey, the minimum SNR and W50 of our HI-bearing dwarfs as and , respectively, the median noise rms of the survey as , and the HI distance in Mpc as . We can see that for similar distances, the ALFALFA survey has an HI mass limit about 10 times larger than the ATLAS3D HI survey. Thus, the ATLAS3D HI survey allows us to obtain observations of low HI mass galaxies while the ALFALFA survey extends our detection limit to dwarfs located beyond ATLAS3D distance limit with higher HI masses.
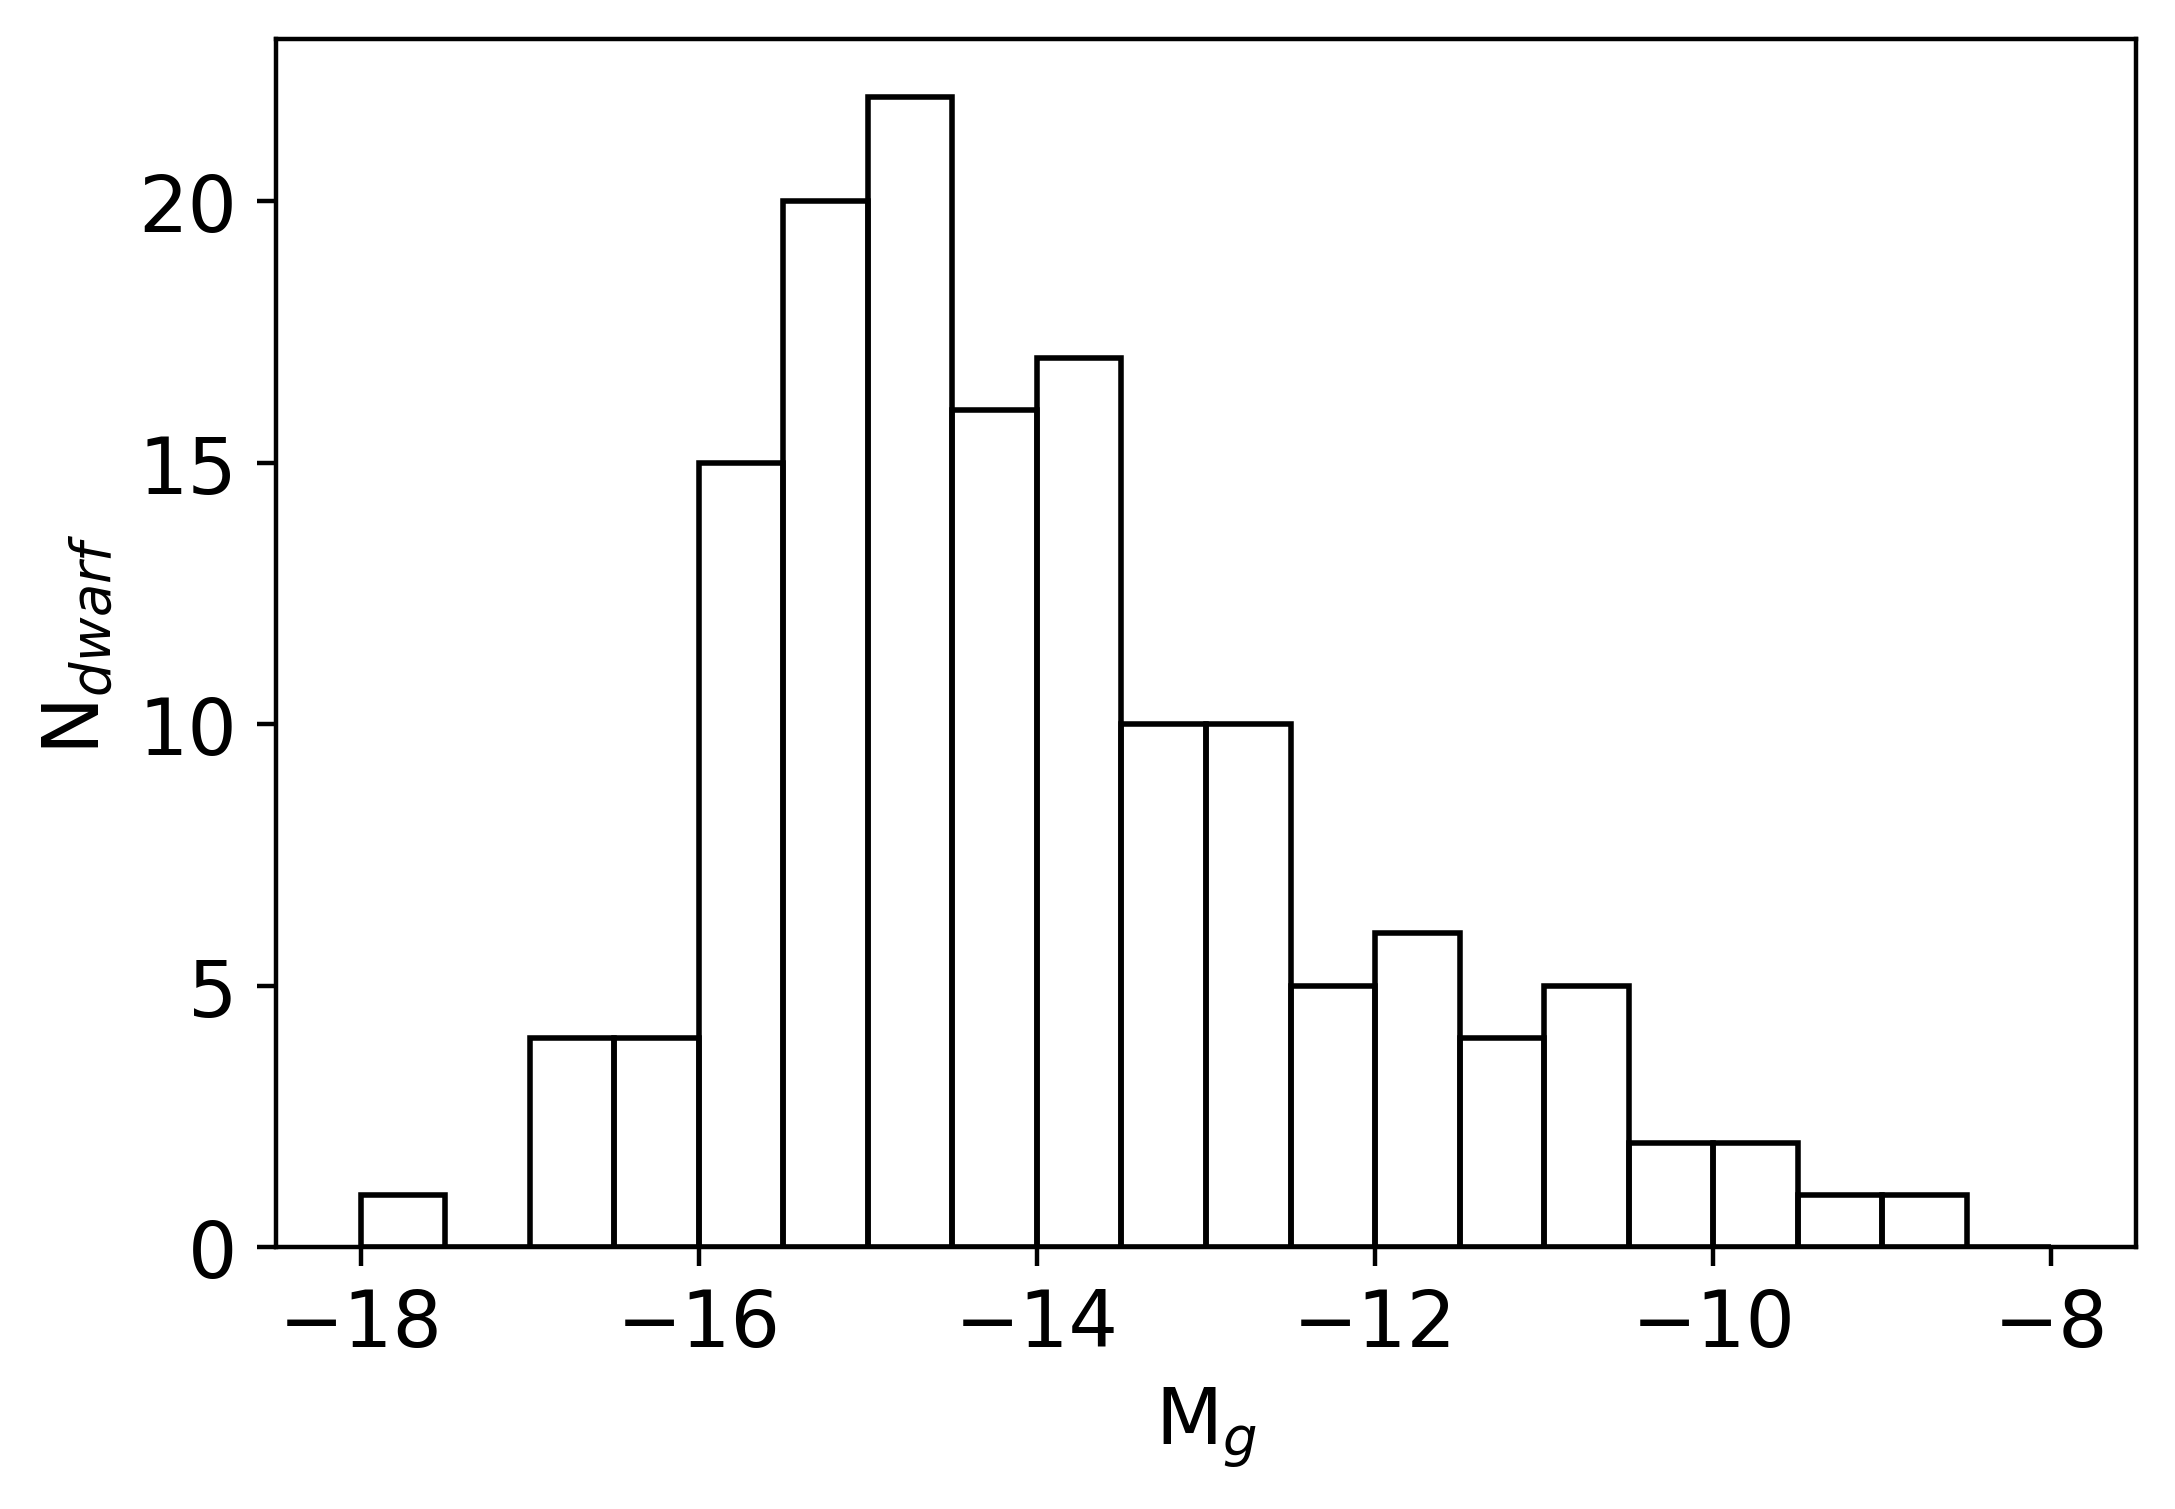
Similar to the work from Habas et al. (2020), where the dwarf and satellite nature of the dwarf sample is probed using available distance measurements (see Section 2), we investigate the dwarf and satellite nature of the HI detected MATLAS dwarfs based on their measured heliocentric velocities and derived distances. In Figure 3 we present the distribution of absolute magnitudes Mg computed using the derived distances. The methods used to obtain the dwarfs photometric properties are explained in Section 4.2. All the HI-bearing galaxies have M. As the B-band magnitudes are systematically fainter than g-band magnitudes in our sample, this confirms their dwarf nature.
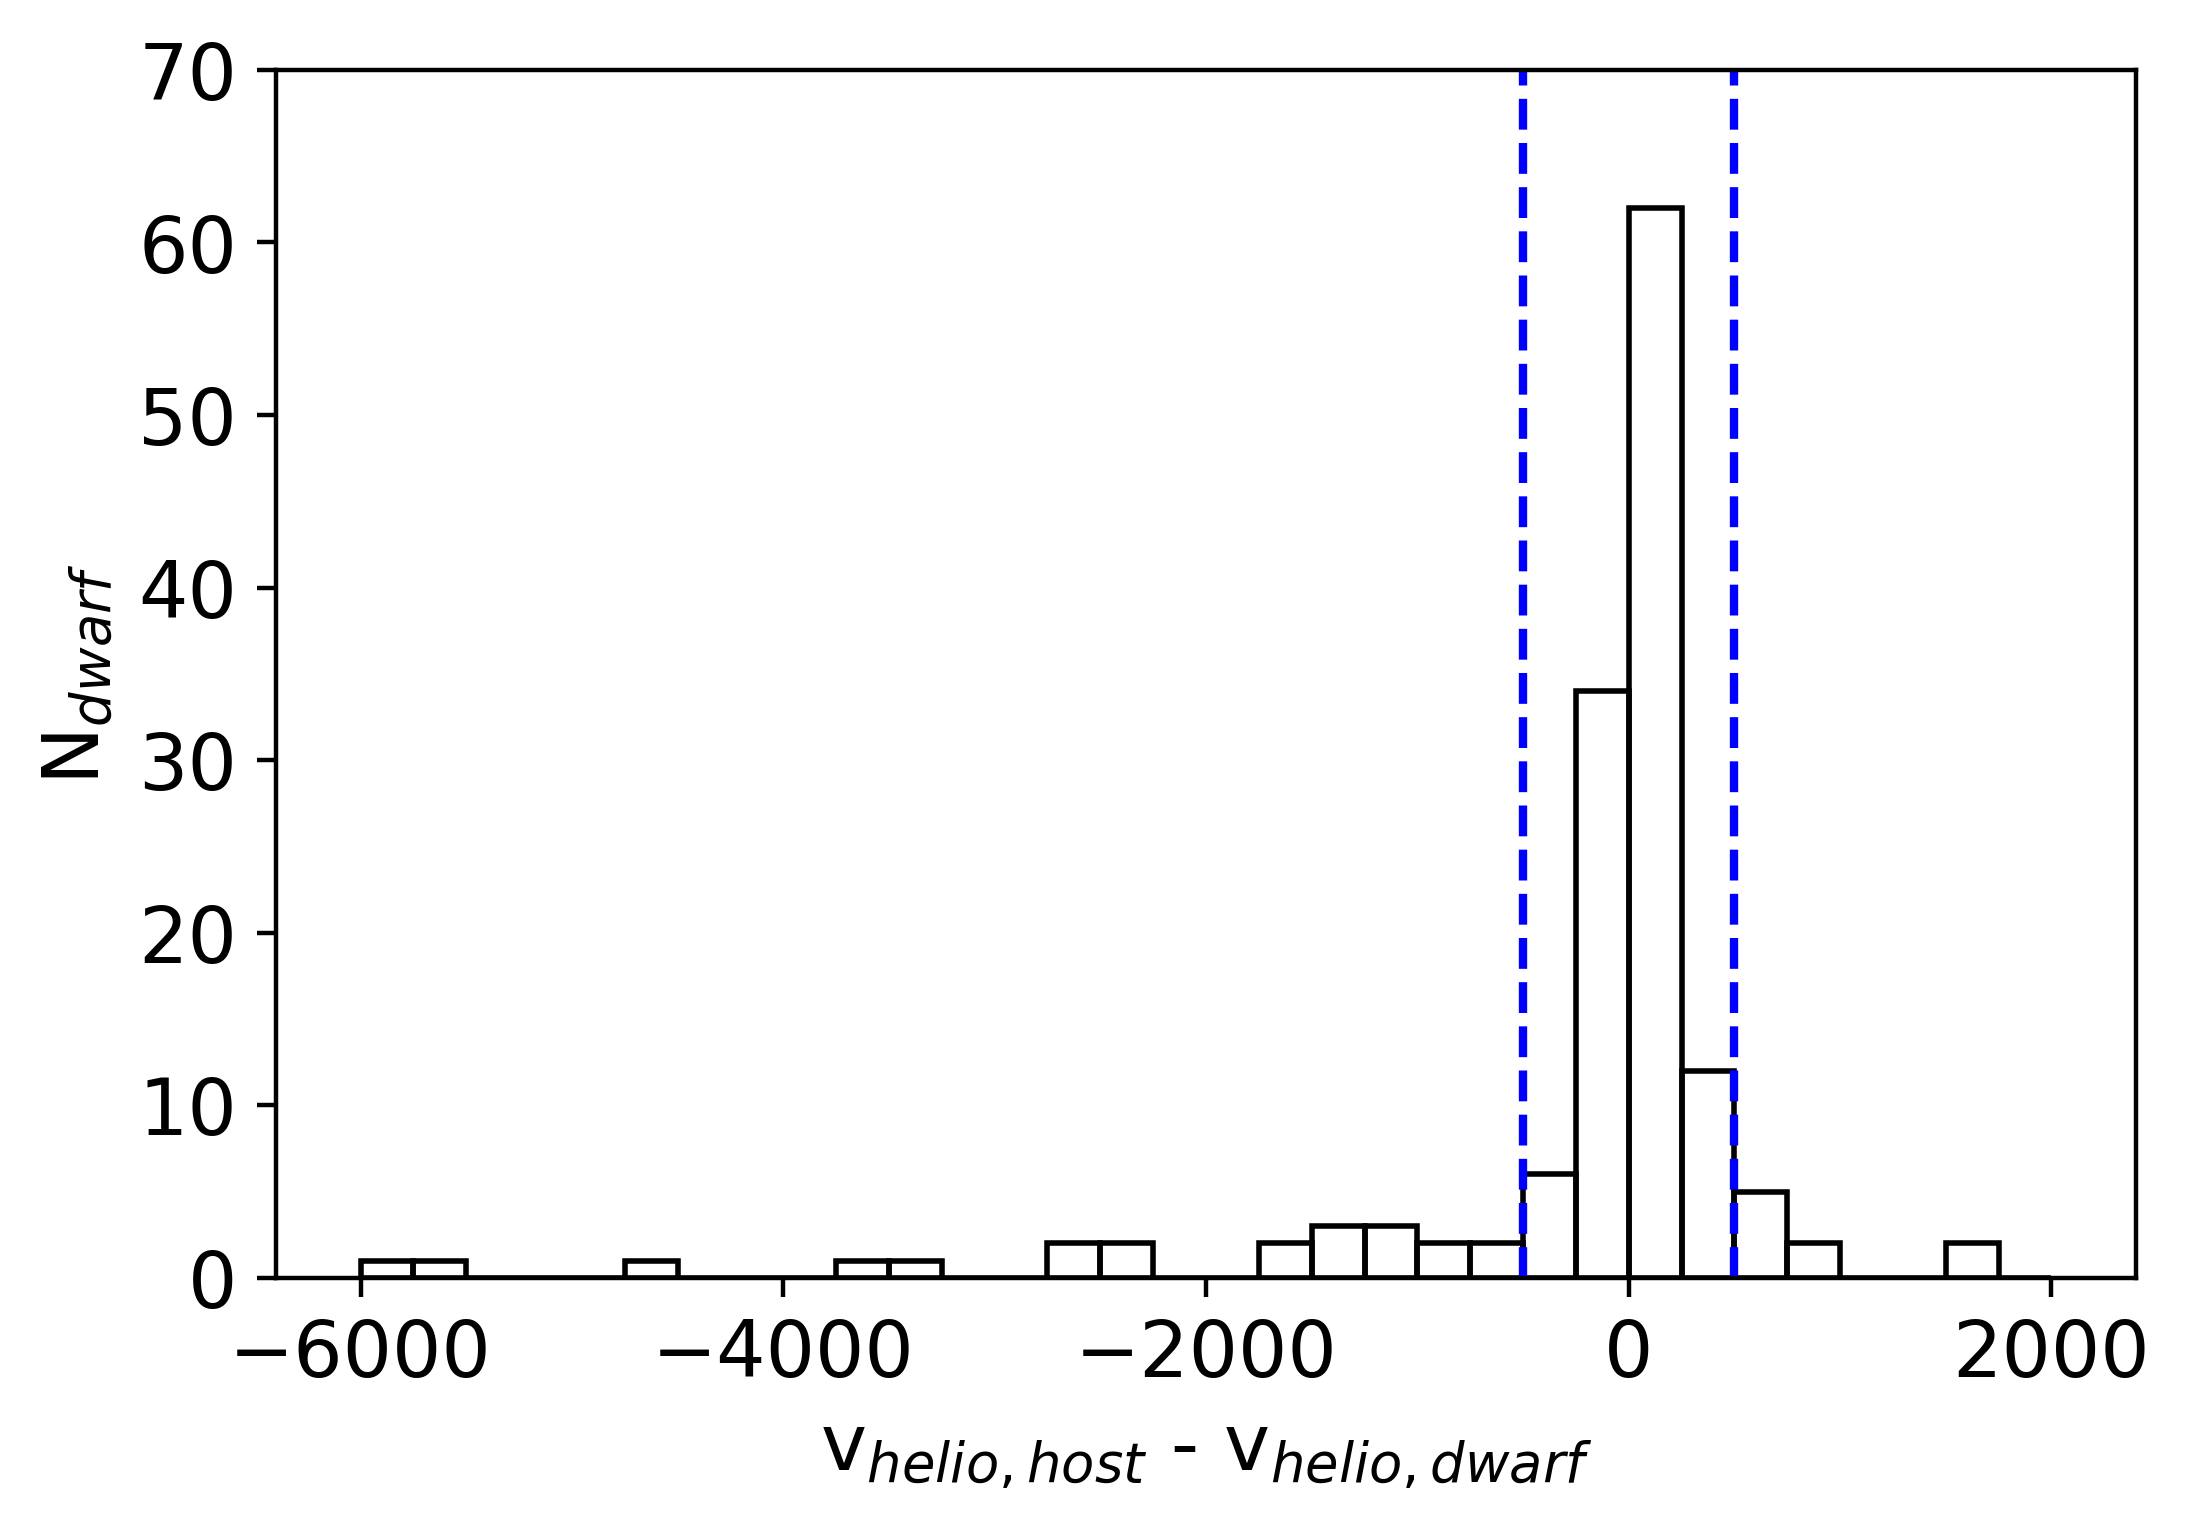
Habas et al. (2020) tested the satellite nature of dwarfs considering several assumptions for the hosts. They used the difference of heliocentric velocity between the assumed host and the dwarf, and assumed that the dwarf is a satellite when ¡ 500 km/s. This criteria is larger than the typical velocity dispersion observed in Hickson compact groups (Hickson 1997) to include groups with possible larger velocity dispersion and the errors on the extracted velocities. We adopt the same criteria and verify the assumption that the HI dwarfs are indeed satellites of their assumed host ETG. This confirmation is necessary to study the spatial distribution of the HI dwarfs around their host (see Section 5.5). We find that 79% of the HI dwarfs are satellites of their assumed host, and this fraction increases to 81% if we consider only dwarfs located in fields with a single ETG.
As discussed in Section 2, we may have rejected valid dI galaxies in the original classification process (see Habas et al. 2020 for more details). We can estimate the number of gas rich dwarfs rejected during the last round of classification by looking at their HI content. For this test we consider all the galaxies not classified as elliptical that were rejected during the last round of classification (280 objects). From this list, 194 are located in the targeted regions of the sky of at least one of the HI surveys. We find an HI detection for 17 and 21 dIs candidates in the ATLAS3D HI survey and ALFALFA survey, respectively. With 3 objects being detected in both surveys, this leads to a sample of 35 HI sources. Based on a visual check of these objects, we rejected 7 HI sources that were actually gas ejected from interacting massive galaxies. To investigate the dwarf nature of the remaining HI sources, we derived their HI distances and computed their g-band absolute magnitude Mg using source extractor. Of these, 21 have Mg¿-18 and thus would be classified as dwarfs, and all have consistent HI masses with a range 6.4 log(MHI/M. We note that the sources not detected in HI can either be background galaxies or galaxies with an HI content too small to be detected by the telescopes. From this result, we can estimate that about 11% (21/194) of the rejected galaxies are dIs. Thus, we probably missed a few tens of galaxies in our final sample of MATLAS dwarfs.
4.2 Optical properties
We measured the photometric properties of the MATLAS HI dwarfs through the use of two methods: 2D surface brightness modeling and source extractor aperture photometry. Of the 145 HI-bearing dwarfs, 31 have a successful 2D surface brightness model in the g-band (Poulain et al. 2021) and we performed aperture photometry on the remaining 114 HI-bearing dwarfs using an aperture size of 3Re of the dwarf333Re estimate, based on the returned source extractor spheroid component effective radius SPHEROID_REFF_IMAGE, that we corrected from a deviation observed from the Re derived with galfit 2D surface brightness modeling for the successfully modeled MATLAS dwarfs. , 3Re being the aperture size returning the closest magnitude value to galfit results. As the HI mass-to-light ratio is often based on the luminosity in the B-band (e.g., Conselice et al. 2003; Begum et al. 2008b; Dénes et al. 2014), we converted our g-band to B-band magnitude with the formula (Lupton 2005444http://www.sdss3.org/dr10/algorithms/sdssUBVRITransform.php.). We calculate the stellar mass based on the stellar mass-to-light ratios from Bell et al. (2003), using the derived color, as a larger number of the dwarfs were observed in the r-band than in the i-band. The uncertainty on is estimated using the statistical error on the magnitude and color from either galfit or source extractor, and the error on the distance. The optical properties are available in Table 1.
It should be noted that the underlying choice of initial mass function (IMF) assumed in the calculation of the stellar mass will have an impact on the derived stellar masses, especially in the case of low mass galaxies (e.g., Huang et al. 2012; Boselli et al. 2014; Durbala et al. 2020). In particular, Bell et al. (2003) make use of a diet Salpeter IMF while Taylor et al. (2011) and Zibetti et al. (2009), which present two other common mass estimates, both opt for a Chabrier (2003) IMF. This variation results in 0.35, 0.37 dex difference for the stellar masses based on Taylor et al. (2011) using color (Habas et al. 2020), and Zibetti et al. (2009) using color, respectively, with the Bell et al. (2003) masses systematically larger. In the remainder of the paper, we take into account this difference when comparing our sample to those using another IMF by correcting the stellar masses of the MATLAS HI-bearing dwarfs according to the IMF favored by the other samples.
4.2.1 Dwarfs colors
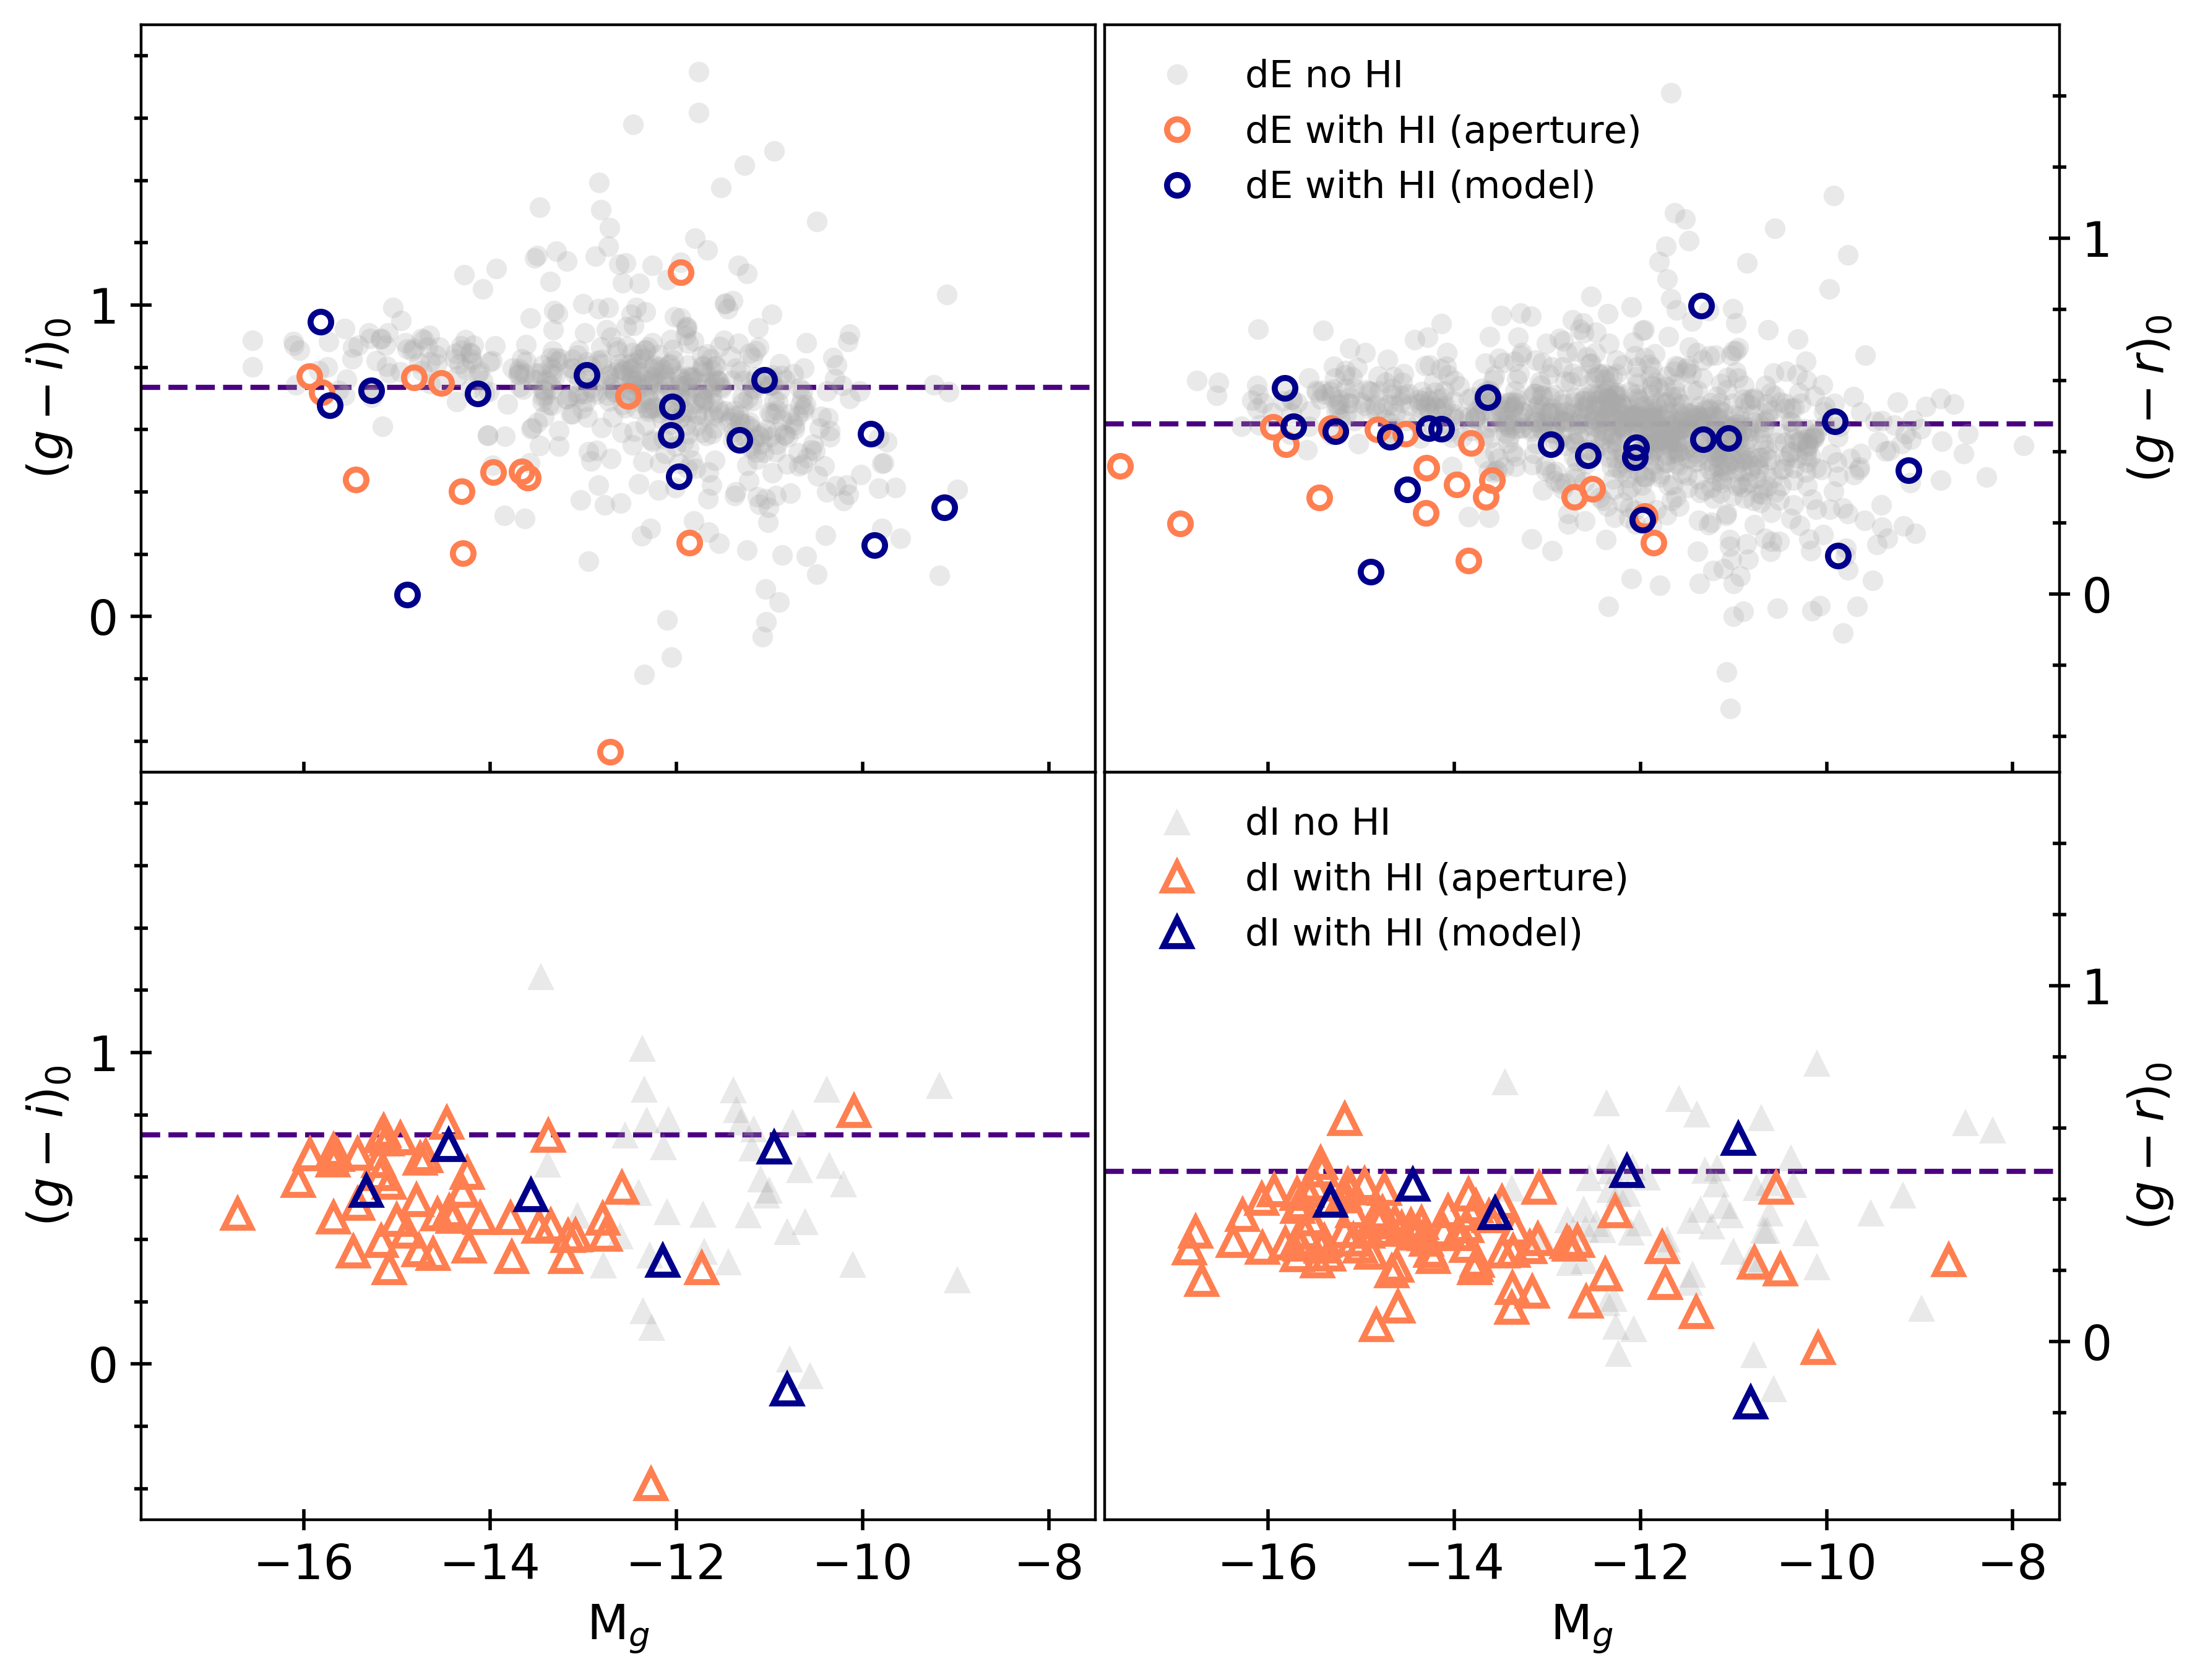
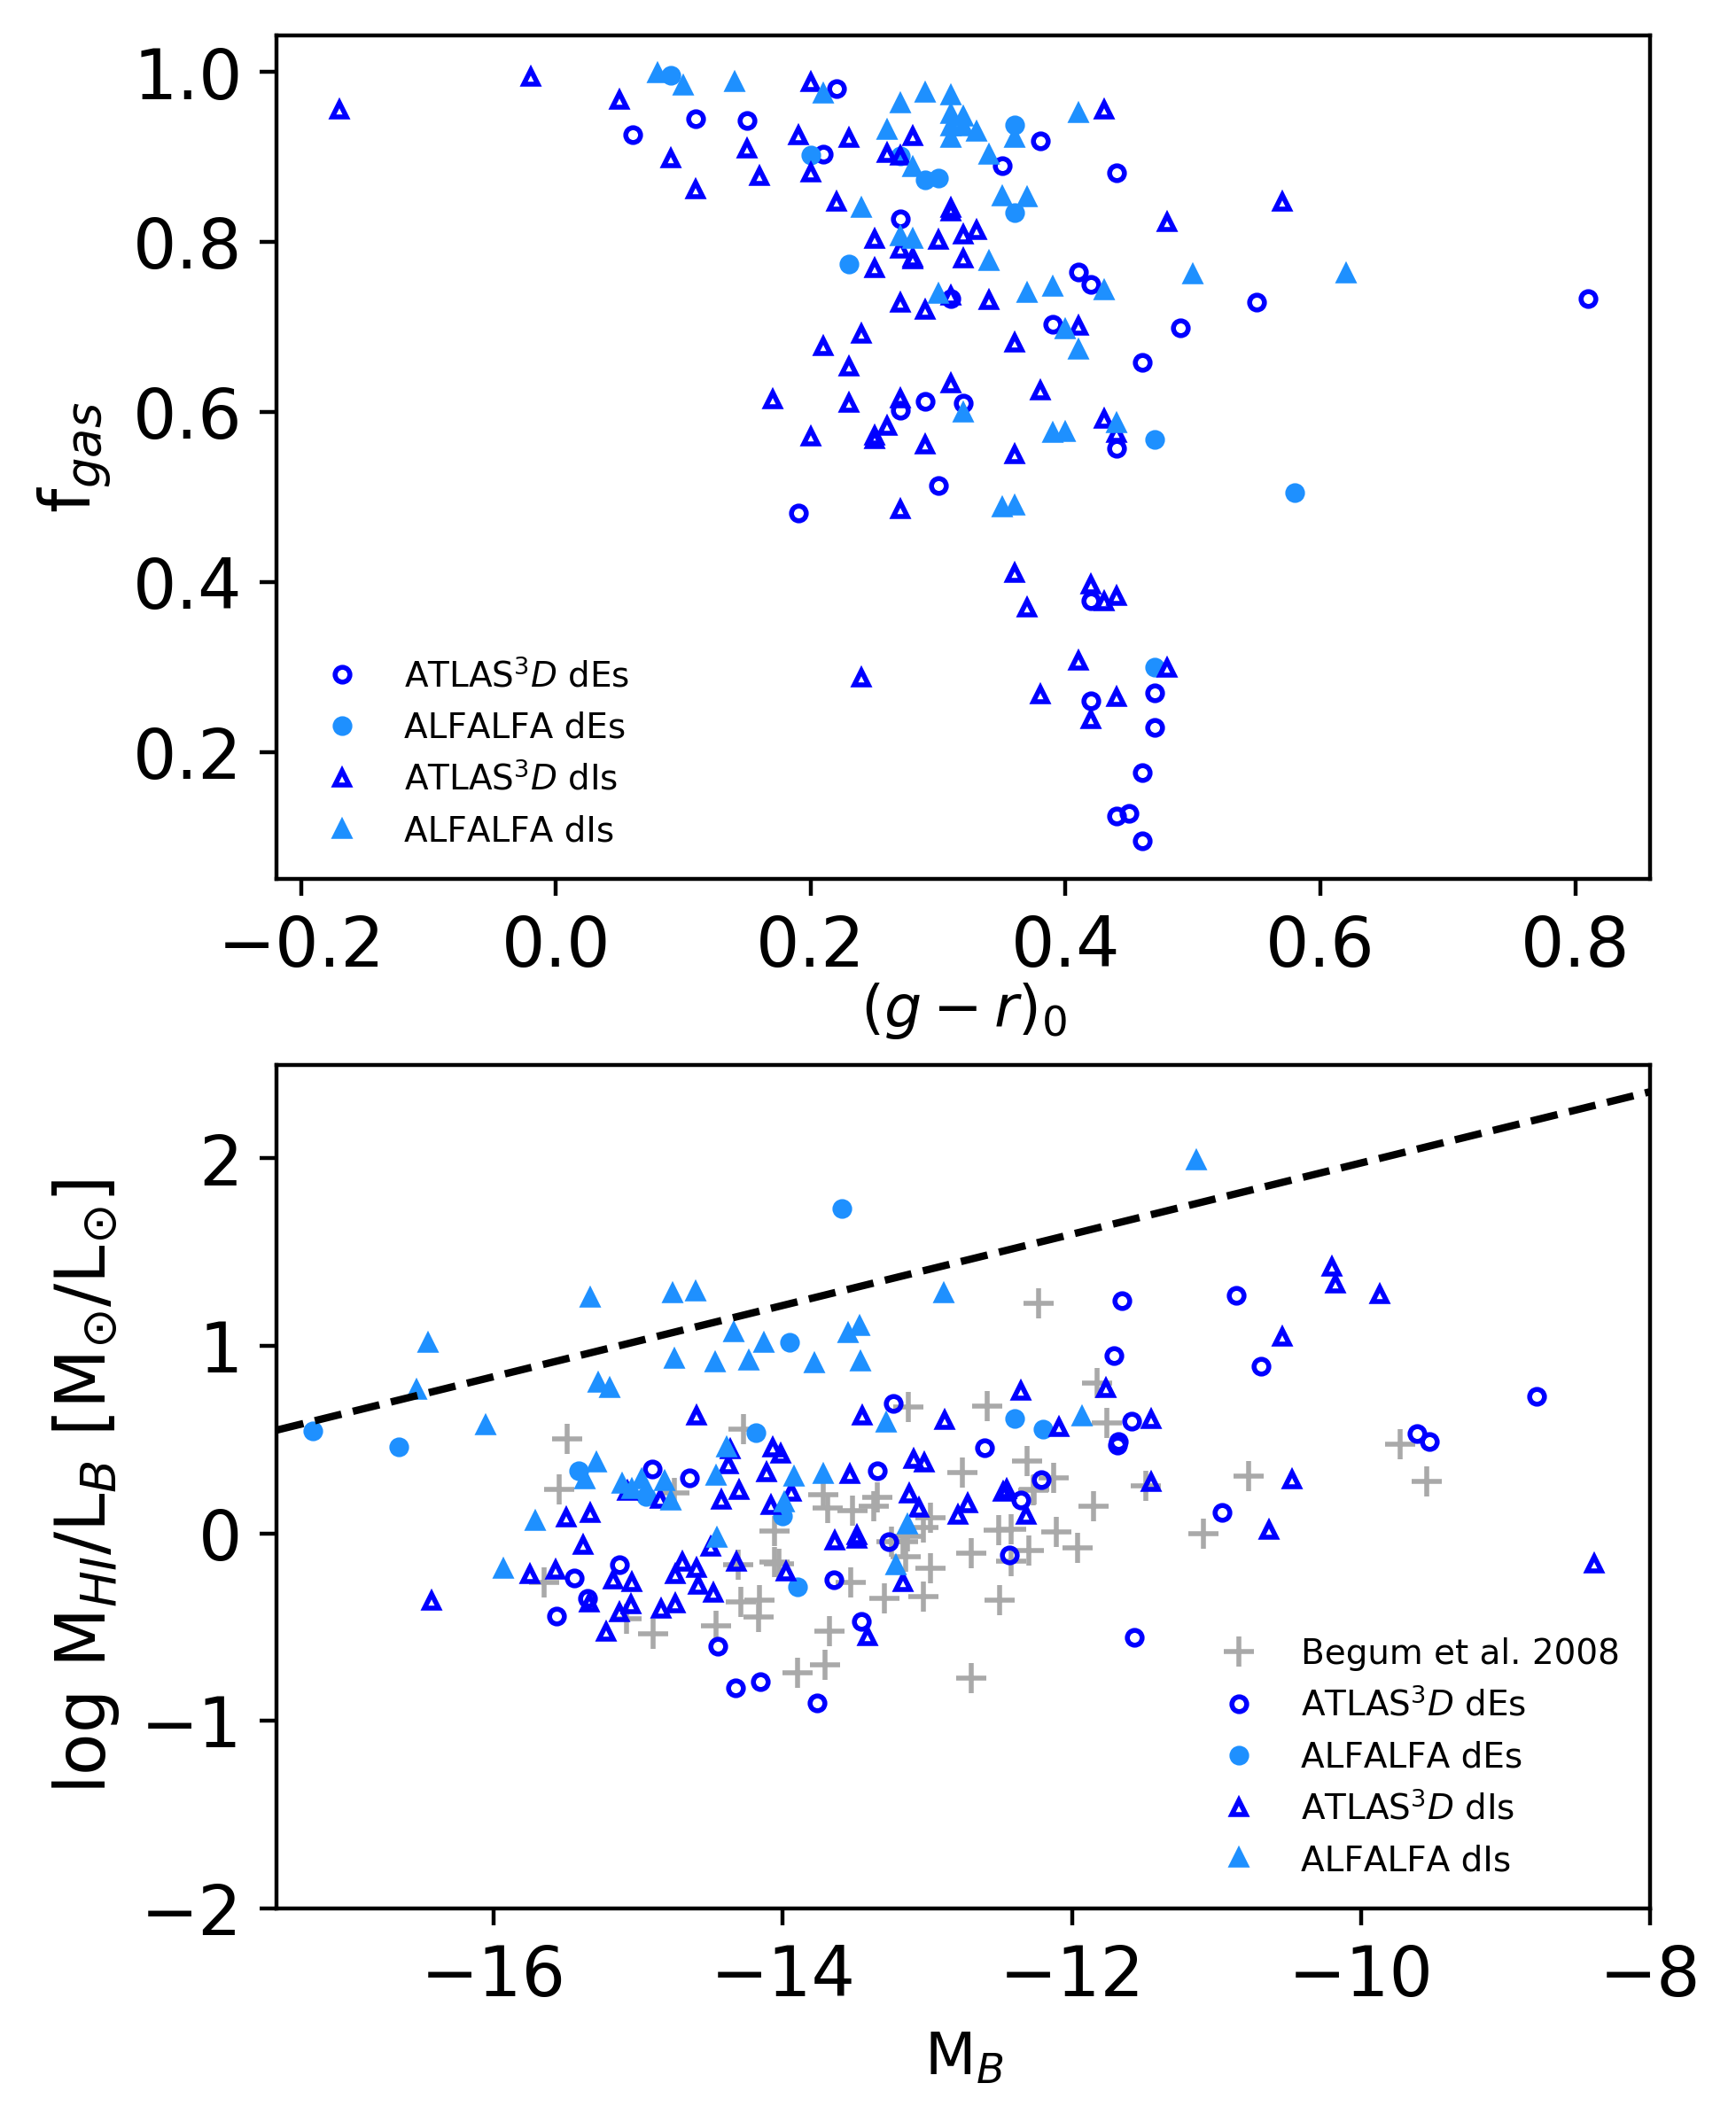
Most of the optical studies of HI-bearing dwarf galaxies report blue colors caused by recent star formation activity (Grossi et al. 2009; Cannon et al. 2011; Huang et al. 2012; Honey et al. 2018). However, some studies have detected HI in red dEs located in the Virgo cluster (Conselice et al. 2003; Hallenbeck et al. 2017). In Figure 4, we show the color-magnitude relation for the Galactic extinction555We used the reddening values from Schlafly & Finkbeiner (2011). corrected and colors of the MATLAS dwarfs present in the regions of the sky observed by either ALFALFA and ATLAS3D HI survey. If distance measurements are available in the literature, we set those distances to the dwarfs not detected in either HI surveys, otherwise we assume the dwarfs to be located at the distance of the host ETG. The galaxies are grouped by HI content: those with HI measurements are highlighted with colored open markers while those without an HI detection are in grey. Considering both dE and dI morphologies, the HI dwarfs are bluer than the median colors , of the dwarfs with no HI detection, with the HI-bearing dIs being bluer (mean and ) than the HI-bearing dEs (mean and ).
4.2.2 Relations between optical and HI properties
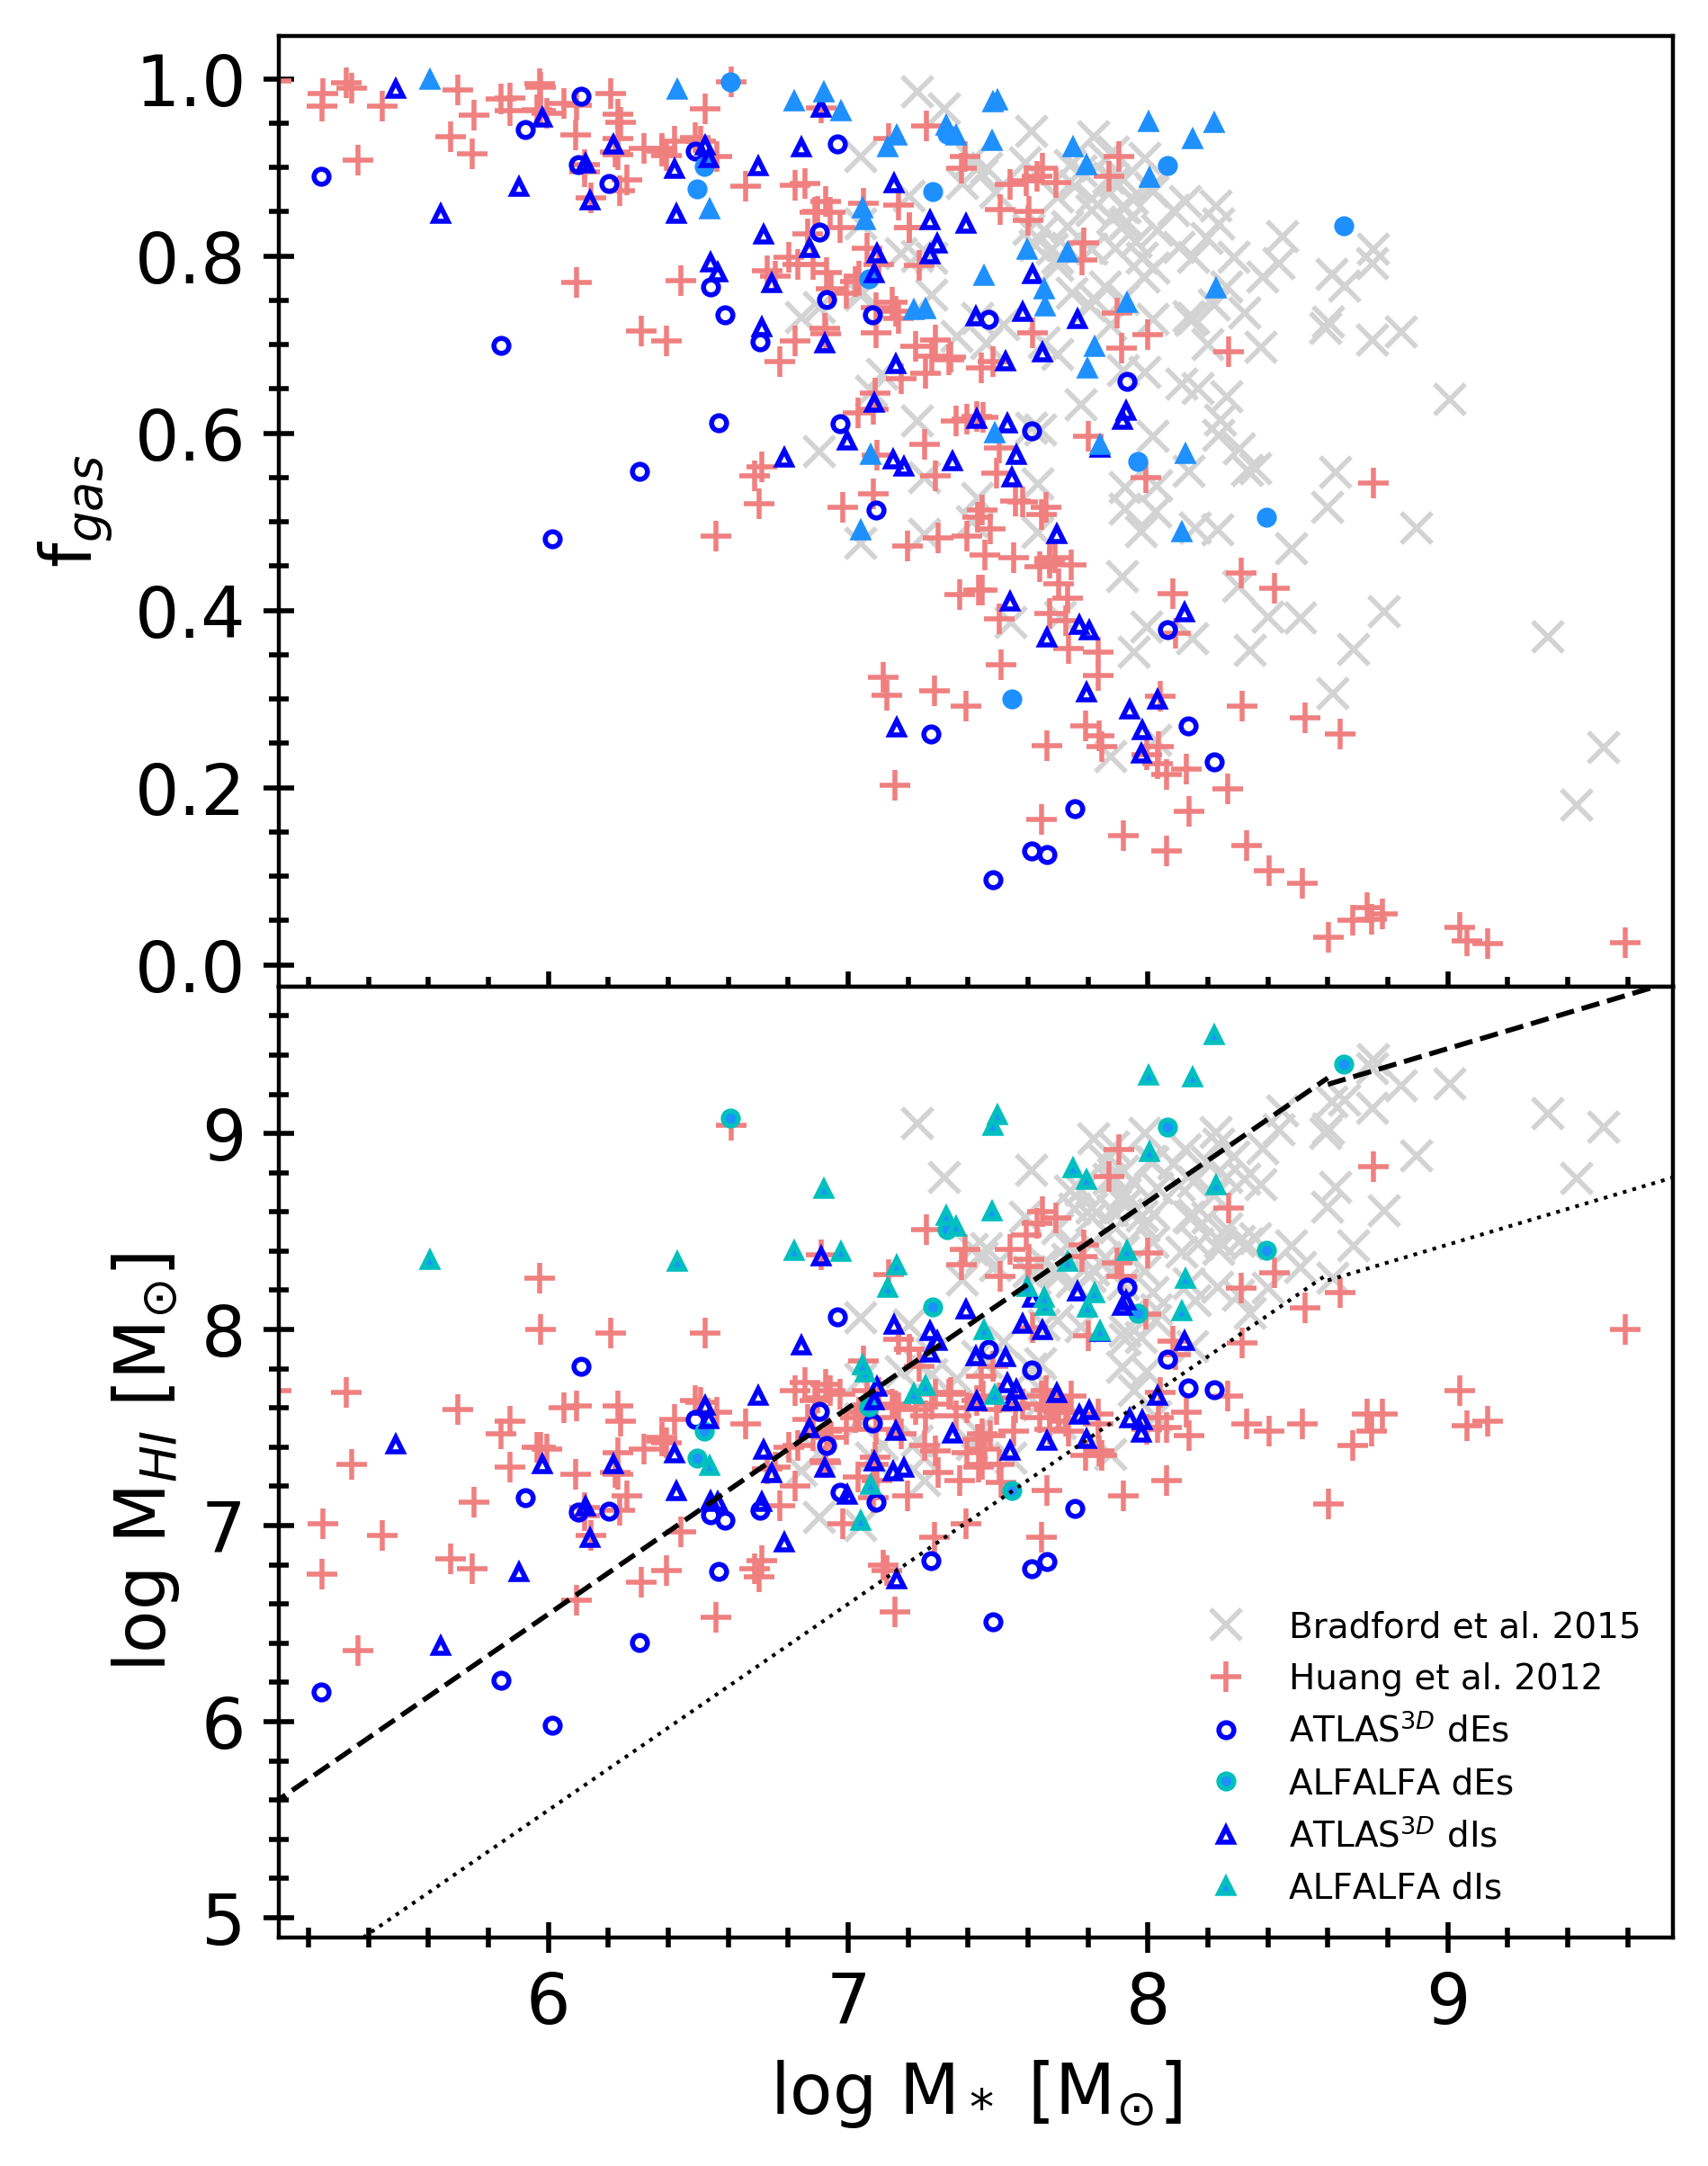
In Figure 5 we show various relations between the derived HI and optical properties of the MATLAS dwarfs, to test if our HI-bearing dwarfs follow the same relations as other dwarfs of similar masses, and if effects due to the environment can be identified. For this purpose, we selected three samples of dwarfs from the literature based on their size, their provided properties, the range of HI masses studied, and the environments of the dwarfs. The first is the sample of isolated low-mass galaxies from Bradford et al. (2015), based on the NASA Sloan Atlas catalog (Blanton et al. 2011) and observed with the Arecibo and Green Bank telescopes (Geha et al. 2006). The second is the dwarfs sample from Huang et al. (2012) selected from the 40% ALFALFA catalog (Haynes et al. 2011). The third is the sample of dIs observed by the Giant Metrewave Radio Telescope (GMRT) for the FIGGS (Faint Irregular Galaxies GMRT Survey, Begum et al. 2008b). The combination of these three samples probe a large range of environments from low to high local densities, as well as HI masses down to . The first sample contains only isolated dwarfs, i.e., galaxies with a projected separation from a massive host above 1.5 Mpc. The second sample is composed of a majority of dwarfs located in the field and group environments, and a few tens of galaxies members of the Virgo cluster. In the third sample, the authors selected dwarfs from similar environments to the MATLAS dwarfs, that is, located in the field as well as in groups.
In the left panel, we present the relations between the stellar mass and both the HI mass and the gas fraction, defined as MHI/(MHI+M∗) (Bradford et al. 2015). We compare the MATLAS dwarfs to the samples of Bradford et al. (2015) and Huang et al. (2012). Note that we computed the stellar masses of the latter sample, as well as for the MATLAS HI sample, using the mass-to-light ratios from Zibetti et al. (2009) and the (available for a larger number of dwarfs than the provided stellar masses based on SED fitting), colors, respectively, to be consistent with the former which provides stellar masses based on a Chabrier (2003) IMF. We see that the gas fraction increases in galaxies with lower stellar masses and that the HI mass increases with the stellar mass in agreement with Huang et al. (2012) and Catinella et al. (2018). A break in the HI-stellar mass relation between low and high mass galaxies is visible in Huang et al. (2012) and was identified at MM⊙ in the study of Bradford et al. (2015) by fitting power-law functions (broken dashed line in Figure 5). Bradford et al. (2015) suggest that this break is due to a less efficient star formation activity in dwarfs than in more massive galaxies. This assumption would also apply to the MATLAS HI dwarfs, as they follow the fitted relation for the low-mass galaxies.
Regarding the environment in terms of the dwarfs, Bradford et al. (2015) found a difference between the HI-stellar mass relation and gas fraction of isolated and non-isolated dwarfs, where only non-isolated galaxies show a deviation from the fitted relation lower than dex, and gas fractions below 0.3 for log(M∗/M. Focusing on the dwarfs in the samples of MATLAS and of Huang et al. (2012) that fall below the threshold, we remark that they all have f. Of the MATLAS sample, 12 show an offset lower than dex and all but one are transition-type dwarfs, which appear to be non-isolated galaxies (see Section 5). Moreover, we identify a majority of the deviating dwarfs from Huang et al. (2012) to be members of either the Virgo cluster or nearby groups. From these observations, we can conclude that moderate to high density environments tend to influence the gas content of dwarfs, making them deviate from the HI-stellar mass scaling relation. This could be caused by galaxy harassment or ram-pressure stripping, as suggested by the studies of HI deficient galaxies in groups and clusters (e.g., Hess & Wilcots 2013; Dénes et al. 2016).
In the top right panel of Figure 5 we investigate the fraction of gas as function of the color of the MATLAS dwarfs. As reported in Huang et al. (2012), the gas fraction correlates with the color the dwarfs such that the bluer galaxies have the largest gas fraction. In the bottom right panel we show the HI mass-to-light ratio as a function of the absolute magnitude in the B-band. The dashed line represents the upper envelope for the HI mass-to-light ratio, i.e., the minimum fraction of the total baryonic mass to be converted into stars so the galaxy remains gravothermally stable (Warren et al. 2007). As in Begum et al. (2008b), we find that most of the MATLAS HI dwarfs have HI mass-to-light ratios much smaller than the envelop, meaning that they converted a larger quantity of baryons than the one needed for their stability. Moreover, like the Begum et al. (2008b), Huang et al. (2012) and Bradford et al. (2015) dwarfs samples, the majority of the MATLAS HI-bearing dwarfs have a gas fraction larger than 0.5 and thus have a baryonic mass dominated by their HI gas.
The ALFALFA dwarfs with the largest HI-masses seem to behave differently than the rest of the MATLAS dwarfs, showing large fractions of gas and high HI mass-to-light ratios. They are located at the upper envelope of the HI-mass-to-light ratio as some of the more massive galaxies in the study of Warren et al. (2007) and, unlike the other HI dwarfs, converted only the minimum quantity of baryons to remain stable. Moreover, they follow the same HI mass and gas fraction relations with the stellar mass than the most massive galaxies in the sample of Bradford et al. (2015). Note that most of them are located in the background of the ATLAS3D massive ETGs and LTGs, i.e. at distances above 50 Mpc. We suggest that these dwarfs, unlike the remaining of the MATLAS HI sample, are as efficient in forming stars as their more massive counterparts.
4.3 Baryonic Tully-Fisher relation
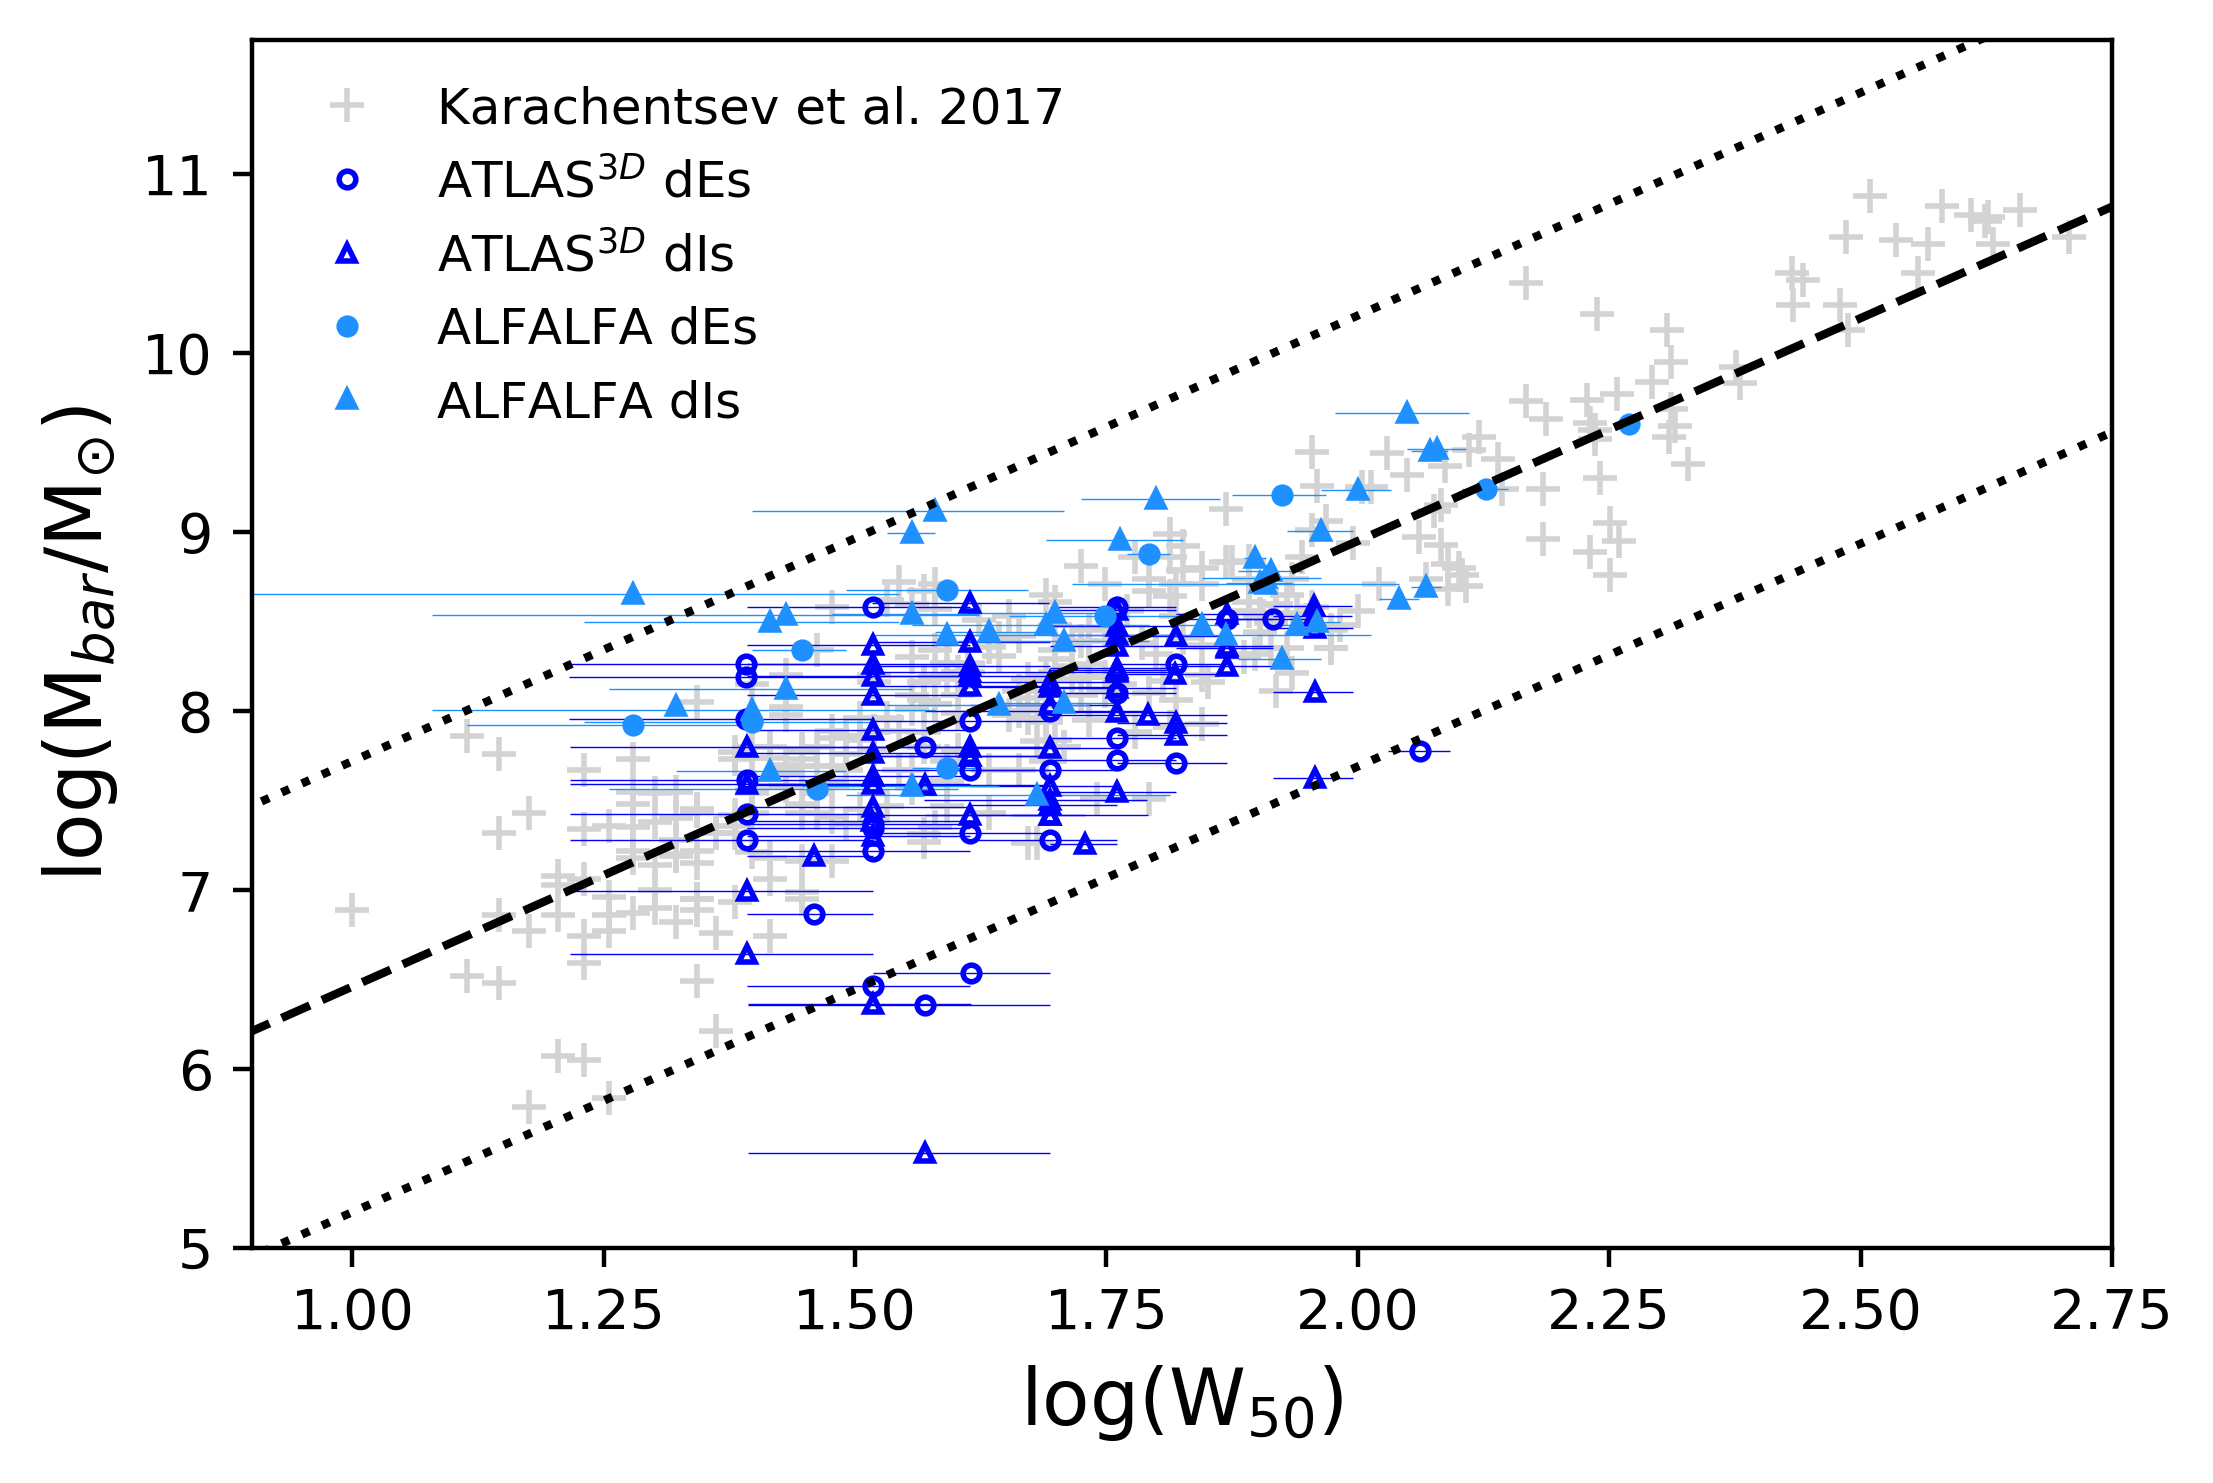
The power-law correlation observed between the luminosity and the HI line width of galaxies, found by Tully & Fisher (1977), is known as the Tully-Fisher relation. It is used to determine distances (e.g., Tully & Pierce 2000; Springob et al. 2007) as well as to constrain galaxy formation scenario (e.g., Desmond & Wechsler 2015; Macciò et al. 2016). However, McGaugh et al. (2000) showed that this relation breaks at the low-mass regime, and that a linear relation can be recovered if we use the sum of the gas mass and stellar mass, i.e., the baryonic mass (Mbar) instead of the luminosity. The resulting relation is called the baryonic Tully-Fisher relation (BTFR).
We can investigate the consistency of the BTFR obtained for the MATLAS dwarfs as compared to the general trend for dwarfs. As the three catalogs of dwarfs from Section 4.2.2 lack the data to study their BTFR, therefore we choose to compare our sample of HI-bearing dwarfs to the BTFR obtained for the large sample of dwarfs located in the LV from Karachentsev et al. (2017), taken from the Updated Nearby Galaxy Catalog (Karachentsev et al. 2013). This sample shares similar range of masses to the MATLAS HI-bearing dwarfs with log(Mbar/M, and has stellar masses derived according to the mass-to-light ratios from Bell et al. (2003). Similar to Karachentsev et al. (2017), we define the baryonic mass as with the factor accounting for the Helium abundance in the derivation of the gas mass. The BTFR for the two samples is shown in Figure 6. The MATLAS HI-bearing dwarfs are consistent with the relation fitted on the LV sample by Karachentsev et al. (2017). Moreover, we estimated a maximum dispersion from the relation of 1.26 dex for the LV sample and see that the MATLAS dwarfs show a similar range of scatter, apart from a handful of MATLAS dwarfs that shows a slightly larger dispersion with an absolute value up to 2.35 dex. Among the seven MATLAS dwarfs with a scatter larger than the one observed for the dwarfs from the LV, we see that they all have a significant uncertainty on their W50, and that one is the least massive. We note that the scatter of the BTFR is known to increase for dwarfs due to the larger uncertainties encountered in measuring their line width and magnitude (e.g, Begum et al. 2008a; McGaugh 2012).
4.4 Dynamical masses
Dwarf galaxies, except those of tidal origin (see Section 5.4.1), usually are dark matter dominated (e.g. in the LG; Martin et al. 2007; Simon & Geha 2007; Simon 2019). However, in recent years, dwarfs and UDGs with a potential dark matter deficiency have been observed (van Dokkum et al. 2018, 2019; Emsellem et al. 2019; Guo et al. 2020). We can investigate the dark matter content of our HI-bearing dwarfs making use of the dynamical mass.
We estimated the dynamical mass within the HI radius (RHI) of the dwarfs following the method from Guo et al. (2020). They used the formula:
| (2) |
where is the HI radius in kpc determined using the updated relation observed between the HI diameter (DHI) and the HI mass (MHI) (Broeils & Rhee 1997) from Wang et al. (2016):
| (3) |
and is the rotational velocity in km/s approximated to be . The line width is measured at 20% of the maximum intensity, and is the inclination angle defined by Hubble (1926) as:
| (4) |
where is the axis ratio of the dwarf estimated from the Sérsic modeling in the g-band when available (31 galaxies), or from ellipse fitting using ellipse from the photutils python package otherwise, and the intrinsic axis ratio of the dwarfs seen edge-on that we set to 0.2, a typical value used in the literature. We note that the value of is likely underestimated for faint dwarfs as it has been shown that they tend to be thicker (Roychowdhury et al. 2010; Sánchez-Janssen et al. 2010).
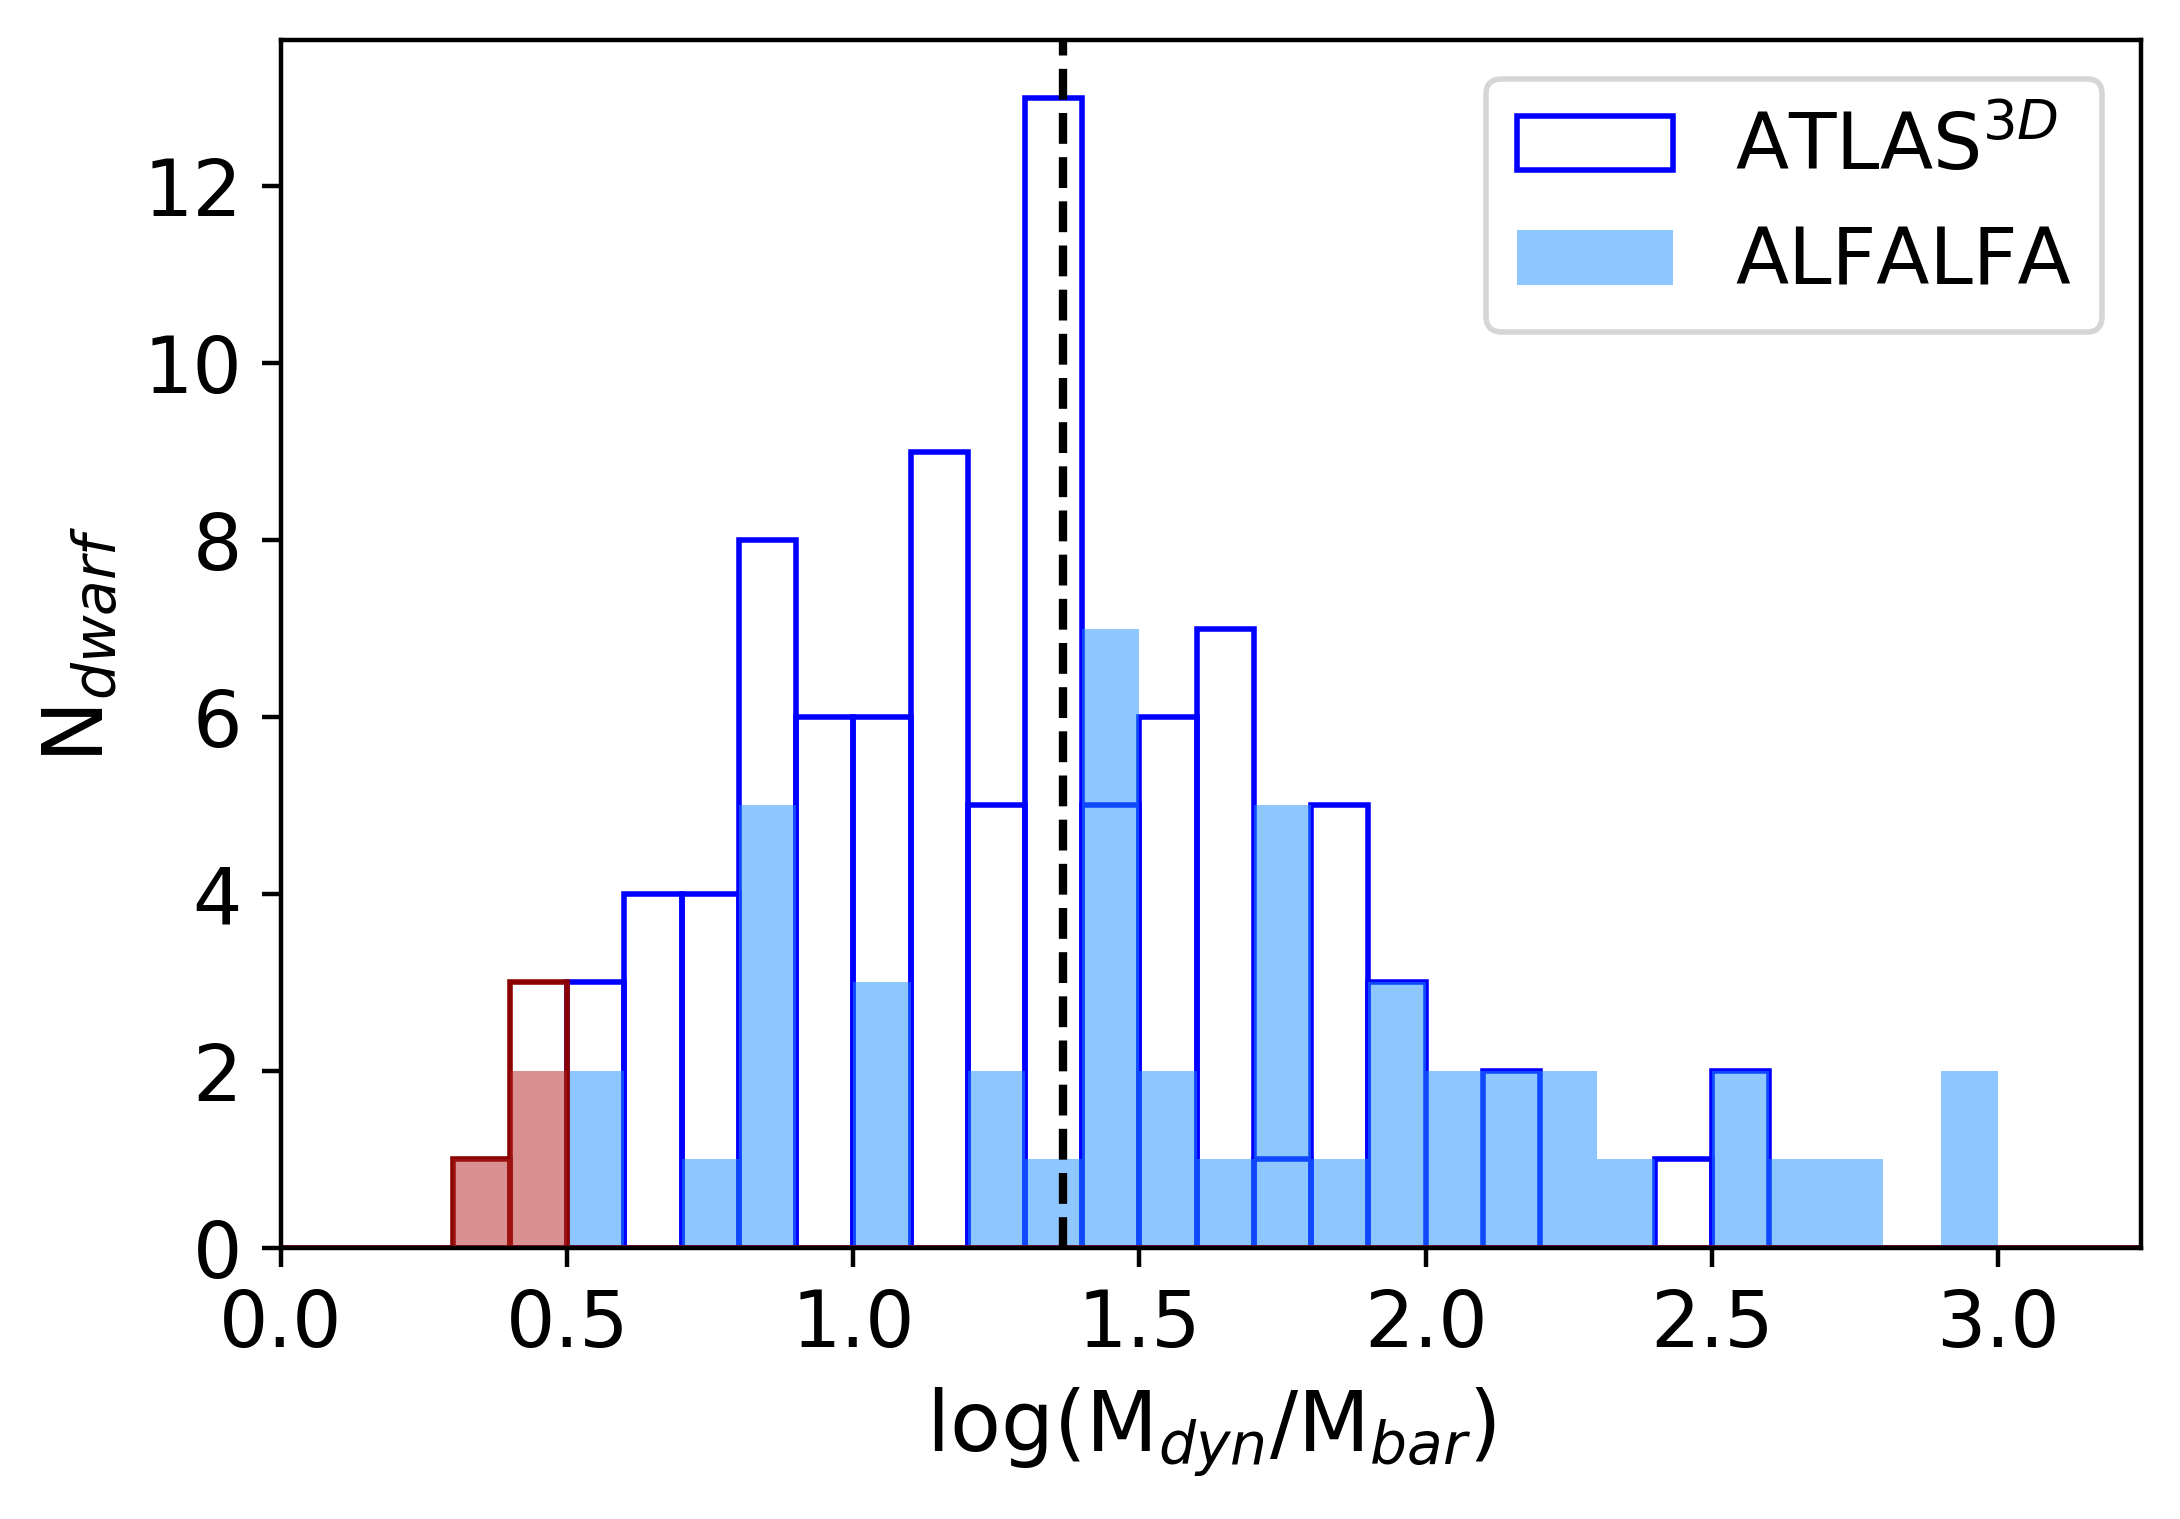
We find Mdyn in the range 7.3 ¡ log(Mdyn/M⊙) 11.4 (see Table 1), but due to the uncertainty on the galaxies inclination, we may under- or overestimate the dynamical masses. Assuming , the average value found for a sample of faint dIs in Roychowdhury et al. (2010), the dynamical masses change by a factor of 0.67.
To evaluate the dark matter content of the HI dwarfs, we compute the ratio Mdyn/Mbar, for which we show the distribution in Figure 7. With a median dynamical-to-baryonic mass ratio of 23.3, the HI dwarfs seem to be dark matter dominated, as expected. However we observe a wide range with 2.1 Mdyn/Mbar 879.9 suggesting that some of the galaxies may be dark matter poor. Guo et al. (2020) defined a dwarf as dark-matter deficient when Mdyn/M. However, a difference of value for from 0.2 to 0.6 involves a difference of for the smallest dynamical-to-baryonic mass ratios. For this reason, we consider in our study the dwarfs with Mdyn/M as dark matter deficient candidates. This represent a sample of five traditional dwarfs (MATLAS-146, MATLAS-580, MATLAS-1194, MATLAS-1750 and MATLAS-2126) and two UDGs (MATLAS-42 and MATLAS-1824).
5 Morphology and environment
The most detailed studies of the optical, HI properties, morphology, tidal features and local environment of dwarf satellites have been performed in the LG, for example with the investigation of the gas content of the dwarf population as a function of the distance to the host (either the Milky Way or M31) and the morphology (Grebel et al. 2003; Grcevich & Putman 2009; McConnachie 2012). However, no such complete analysis has been performed for other satellites systems. Some studies focus on the morphological distribution of dwarfs around more massive galaxies (e.g., Ann 2017). Others investigated signs of interactions between dwarfs and their host massive galaxy (e.g., Ludwig et al. 2012), or the spatial distribution of the satellites around their host (e.g., Müller et al. 2017). The HI content of dwarfs has also been examined as a function of their location in groups (e.g., Hess & Wilcots 2013). The MATLAS HI-bearing dwarf sample includes a significant fraction of dEs, and about 80% of the galaxies are estimated to be satellites of nearby massive ETGs. In this section, we perform a detail study of the morphology and local environment of the MATLAS HI-bearing dwarf satellites. We focus especially on the dEs, UDGs, TTDs, and interacting galaxies. We also examine the spatial distribution of the dwarfs.
5.1 Dwarf ellipticals
Several assumptions have been put forward to explain the observation of HI-bearing dEs. In the cluster environment, the HI-bearing dEs could be the evolution of an infalling star-forming galaxy into the cluster or could have recently accreted HI gas from an infalling HI cloud (Conselice et al. 2003; Hallenbeck et al. 2012, 2017). In low density environments, the HI gas in dEs could result from interactions with a companion or a gas accretion from the intergalactic medium (Grossi et al. 2009).
At most a dozen of HI-bearing dEs have been reported in the outskirts the Virgo cluster (Conselice et al. 2003; di Serego Alighieri et al. 2007; Hallenbeck et al. 2012, 2017), and a couple were observed in low density environments (Grossi et al. 2009). With an HI line detection for 42 dEs, our sample is significantly larger than the ones previously reported. We investigate the variation of the detection rate of the MATLAS HI-bearing dEs with the density of the environment. Considering the MATLAS dEs located in the regions observed by either the ATLAS3D HI survey and the ALFALFA survey, we find a detection rate of 3% for the low-to-moderate density environments of the MATLAS survey. This is similar to the findings of 2% in the Virgo cluster (di Serego Alighieri et al. 2007) but lower than the 13% found in low density environments (Grossi et al. 2009). However, these studies used apparent magnitude limited samples, and selected only galaxies with mr¿17.77. Applying a similar cut to the MATLAS dEs we obtain a detection rate of 9.5%, which is much closer to the one found in low density environments. The detection rate of the MATLAS dE sample decreases toward dwarfs with fainter apparent magnitude. This is probably due to the telescopes detection limits, as fainter dEs are either less massive or too far so their HI content can be detected. Thus, as concluded in Grossi et al. (2009), we find that the HI-bearing dEs appear to be more numerous in low-to-moderate density environments than in clusters.
Some studies mention a peculiar morphology for HI-bearing dEs (Grossi et al. 2009). As an example, Hallenbeck et al. (2017) argue that some of their studied dEs have a transitional morphology. The likelihood of the MATLAS HI-bearing dEs to be TTDs or the result of galaxy interactions is detailed in sections 5.3 and 5.4.
5.2 Ultra-diffuse galaxies
HI-bearing UDGs were recently studied in different environments such as in the field (e.g., Leisman et al. 2017; Papastergis et al. 2017; Janowiecki et al. 2019), in groups (Spekkens & Karunakaran 2018) or in poor galaxy clusters (Shi et al. 2017). Compared to galaxies of similar HI-mass and environment, these studies report a bluer color for the observed UDGs, a narrower line width and a larger gas fraction.
Of the 59 UDGs in the MATLAS dwarf sample, 51 are located in the regions observed by the ALFALFA and ATLAS3D HI surveys and three have an HI line detection (MATLAS-42, MATLAS-1337 and MATLAS-1824). These galaxies are located at distances from 33 to 46.5 Mpc with HI masses log(M, line widths W km s-1, and color in the range 0.06 – 0.4. They have MHI, W50 and values in the range of those observed for HI-bearing UDGs in other studies (e.g., Leisman et al. 2017; Karunakaran et al. 2020). We note that, due to their central structures and irregular shapes, not all 145 HI-bearing dwarfs have successful 2D surface brightness modeling and thus an available effective radius and central surface brightness, needed to asses their UDG nature. Moreover, based on the relation between the stellar and HI masses, at least 6 of the 48 UDGs located in the observed regions with no HI detection have stellar masses so low that we neither expect nor detect any HI in either survey. Considering only UDGs with a stellar mass high enough so we might detect HI gas in either the ALFALFA survey or the ATLAS3D HI survey, given their sky location, we estimate that 7% of them are HI-bearing UDGs. Using the same method for the MATLAS dwarfs which are not UDGs, we find that 10% are HI-bearing galaxies. Thus, HI-bearing UDGs are slightly rarer in our sample than HI-bearing traditional dwarfs.
We compare the properties of our HI-bearing UDGs to classical dwarfs of similar HI-mass and within the same survey. We find that the UDG line widths are smaller than the median line width of the HI dwarfs. Only one UDG in each survey has an available observation in the r and i bands and thus an available stellar mass, and colors. The UDG detected in the ATLAS3D HI survey has a gas fraction larger and bluer colors than all the ATLAS3D dwarfs of similar HI-mass, while the UDG detected in the ALFALFA survey has a smaller gas fraction and redder color than the median values of the dwarfs. We note that these two UDGs are dark matter deficient candidates with a dynamical-to-baryonic mass ratio of 2.8 and 2.9 for MATLAS-1824 and MATLAS-42, respectively.
5.3 Transition-type dwarfs
TTDs have properties of both dEs and dIs, generally showing central irregular star-forming regions and an outer region composed of an older stellar population associated with smooth elliptical external isophotes (Dellenbusch et al. 2008; Koleva et al. 2013). In clusters, these dwarfs are thought to correspond to a transition phase in the transformation of LTGs into quescient elliptical dwarfs when going through ram-pressure stripping during their infall (Boselli et al. 2008). In lower density environments, they could be the result of an internal interstellar medium instability or a galaxy-galaxy interaction, that would explain the central blue star-forming regions often observed (Dellenbusch et al. 2008). They also could be dIs or dEs going through episodic star-forming or gas infall, respectively (Koleva et al. 2013).
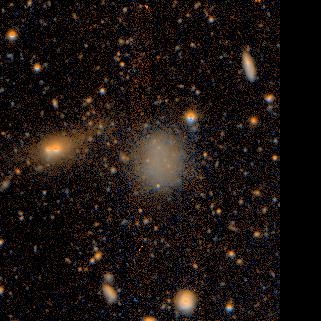
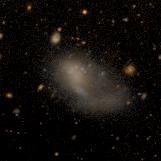
We investigated the morphology of the dwarfs as a function of the HI mass-to-light ratio . Although TTDs were not identified during the initial classification of the MATLAS dwarf sample, they can be identified as active star-forming galaxies with a mass-to-light ratio , while dEs usually are gas poor with ratios lower than 0.1 (in the LG, e.g., McConnachie 2012) coupled with an absence of star formation activity and the dIs are actively forming stars with a ratio greater than 1 (Da Costa et al. 2007). In our sample, 17 dwarfs (8 dEs and 9 dIs) have an HI mass-to-light ratio consistent with a transitional morphological type. These dwarfs all show an elliptical shape with inner star-forming regions (see Figure 15).
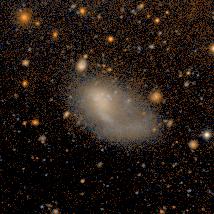
A number of galaxies in the sample have visual morphologies that do not correspond with the morphology expected from their HI mass-to-light-ratios. For example, 20 dwarfs identified as dIs have . These dwarfs all show an elliptical shape as well as internal structures (e.g. MATLAS-1750, MATLAS-519), large star-forming regions or signs of dwarf-dwarf interactions (e.g. the shells of MATLAS-602 discussed in Section 5.4). On the other hand, 28 dwarfs identified as dEs have . Finding dEs with a high HI mass-to-light ratio is not unexpected, as some have been observed in the outskirts of clusters (Conselice et al. 2003; Buyle et al. 2005). Three of these are tidal dwarf candidates (MATLAS-1824, MATLAS-1322 and MATLAS-1830; see Section 5.4), explaining their high gas content that might originate from massive galaxies. Three other dEs (MATLAS-696, MATLAS-720 and MATLAS-121) have a transitional morphology with an outer elliptical envelope with blue knots of star formation in the interior. They might be transitional dwarfs with an HI gas content as rich as the dIs, as already observed in Koleva et al. (2013). We note that some of the remaining gas-rich dEs appear to be blue (e.g. MATLAS-714 or MATLAS-1411) and resemble some of the gas-poor dIs previously mentioned. These dEs, together with the gas-poor dIs are difficult to classify, especially without information about the star formation rate, as they have properties of both ellipticals (outer isophotes shape) and irregulars (e.g. a blue color, large star-forming regions).
5.4 Galaxy interactions
Fine structures such as tidal tails or shells are often by-products of galaxy mergers. In the context of dwarf galaxies, two types of galaxy interactions are observed: the interaction between a dwarf and a massive galaxy, and dwarf-dwarf interactions. In the case of a dwarf-massive galaxy interaction, the dwarf can either be the result of a merger event or a tidal interaction between two massive galaxies, the so-called tidal dwarf galaxies (TDGs), or be a future minor merger of its host massive galaxy. With its deep imaging, the MATLAS survey allows us to identify low surface brightness features of galaxies. In this section, we discuss the observed fine structures around the HI-bearing dwarfs for the two types of galaxy interactions.
5.4.1 Tidal dwarf candidates
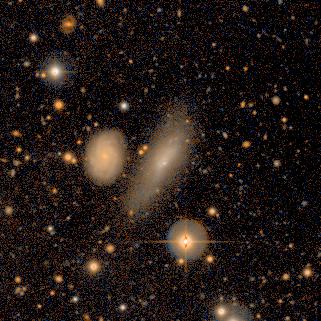
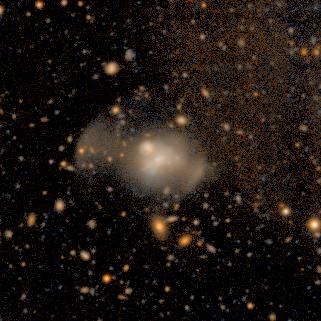
TDGs are formed from the gas and stellar material ejected in the interstellar medium during the interactions between two massive galaxies (Duc et al. 2000). TDGs, especially as they age, show similar structural properties to classical dwarfs. However, their properties differ in three main ways: they lack dark matter, have high metallicities (Hunter et al. 2000; Duc et al. 2007; Sweet et al. 2014; Lelli et al. 2015) and have no globular clusters (Jones et al. 2021). Duc et al. (2014) previously identified seven, likely old, TDGs around ATLAS3D ETGs showing fine structures. Among these dwarfs, four have an HI line detection in our study (MATLAS-785, MATLAS-1750, MATLAS-1824 and MATLAS-1830). Of the other three candidates, one is not in the MATLAS dwarf sample due to its very low surface brightness, while the other two were excluded as potential background galaxies. We also identified three new TDG candidates (see Figure 8): the first (MATLAS-1180) is located near the end of the tidal tail of a galaxy that seems to interact with the ETG NGC4111, the second (MATLAS-947) has extended isophotes oriented towards the ETG NGC3610, and the third (MATLAS-1322) has outer isophotes twisted towards the massive interacting galaxies NGC4281 and NGC4270. Therefore, 5% of our HI-bearing galaxies are possible TDGs. Of the TDGs candidates in Duc et al. (2014), two have effective radius and central surface brightness measurements consistent with a UDG classification. These two galaxies are in our sample of HI-bearing dwarfs. However, we note that one of these UDGs (MATLAS-1830) is not in the subsample of 59 UDGs considered in this work due to the absence of successful 2D surface brightness modeling caused by its very low surface brightness. Of the TDG candidates, three have low dynamical-to-baryonic mass ratios as compared to the whole HI dwarf sample, including two dark matter deficient candidates, which is consistent with these galaxies being dark matter poor.
5.4.2 Dwarf merger candidates
Understanding the role of the merging process in dwarf galaxy evolution is important as they might be the progenitors of some dEs (Kazantzidis et al. 2011; Graham et al. 2012; Toloba et al. 2014; Tarumi et al. 2021). The improvement of imaging facilities this last decade has made the observation of low surface brightness structures easier (Abraham & van Dokkum 2014; Duc et al. 2014; Bílek et al. 2020). This includes the faint structures resulting from dwarf galaxies interactions. As a consequence, there have been an increasing number of studies focusing on dwarf galaxy interactions and mergers (Rich et al. 2012; Paudel et al. 2015; Annibali et al. 2016; Pearson et al. 2016; Paudel et al. 2017, 2018). These works identify different structures such as tidal tails, plumes, bridges, stellar streams, shells or merged pairs of galaxies.
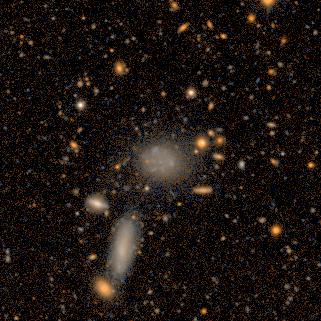
Similar to the classification system of Paudel et al. (2018), we define four categories of interaction features: pairs, Antennae-like systems, shells and extended isophotes. These categories likely represent different merging stages, e.g., with pairs or Antennae-like systems occurring in early stages, and shells being visible in late-stages. In total, 10% of the HI-bearing galaxies show signs of interactions. We display examples of the observed features in Figure 9, while all the dwarf merger candidates are visible in Figure 16.
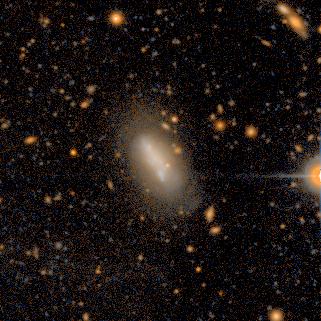
We report six possible pairs of interacting galaxies involving the HI-bearing dwarfs: the two HI-brearing dwarfs MATLAS-595 and MATLAS-596 interacting together, MATLAS-340 which shows extended ispohotes and an HI content overlapping both the dwarf and a nearby galaxy, MATLAS-1411 which is possibly interacting with a nearby galaxy with a tidal tail, MATLAS-1783 with a visible bridge connected to MATLAS-1784 and MATLAS-2160 that shows twisted extended isophotes that might be connected to the extended isophotes of MATLAS-2158. We find also a dwarf galaxy (MATLAS-546) whose shape resembles the Antennae system.
We observe shell-like features in three dwarfs: MATLAS-824, MATLAS-602, MATLAS-621. The first one exhibits symmetric structures, suggesting a merger event between two dwarfs of similar mass (Paudel et al. 2017). The second has asymmetric shell features, implying a different mass for the two dwarf mergers (Paudel et al. 2018). The last shows internal shell-like structures as well as a tidal tail, possible signs of a ongoing merger event.
We note three dwarfs showing extended isophotes with no clear origin. MATLAS-124 has extended isophotes and could be two dwarf galaxies interacting with a central bridge. MATLAS-580 has two central bright point sources, but its extended isophotes can also be contaminating Galactic cirrus. Finally MATLAS-447 has extended isophotes but is located in a stellar halo, making difficult to observe other nearby low surface brightness structures.
5.5 Spatial distribution
The HI content of galaxies appears to be correlated to their environment and morphology. The HI mass decreases with an increase of the local density for galaxies of similar stellar mass (Dénes et al. 2014). In the Local Group, dwarfs located within 270 kpc of their host (Milky Way or Andromeda) have MHI ¡ 105 M⊙ and a dE morphology, while TTDs and dIs are found at larger distances with higher HI masses (Grebel et al. 2003; Grcevich & Putman 2009).
5.5.1 Separation to the host
We investigate the projected separation around the host ETG, of the dwarfs with HI content. We consider here only fields with a single ETG for which at least one HI satellite is confirmed (see Section 4.1), which restricts the sample to 50 ETGs with distances from 11 to 45 Mpc, as taken from the ATLAS3D ETG catalog (Cappellari et al. 2011). The variation of the HI mass and gas fraction of the satellites are shown as a function of the projected distance from the host in Figure 10. We observe, on average, an increase of the HI mass with the projected distance to the host and also a distance limit of 100 kpc for the detection of dwarfs with log MHI/M⊙ ¡ 6.5. This result is consistent with the findings of Dénes et al. (2014) and Bouchard et al. (2009), where at fixed stellar mass, the HI mass of dwarfs increases towards lower local density environments, as well as with observations in the LG (Grcevich & Putman 2009), where the HI masses of the dwarfs increases with the distance to the host. However, unlike the LG, this trend is not obvious for the gas fraction. This can be due to a detection limit, as this relation is not clearly visible without observations of dwarfs with f in the LG (Grcevich & Putman 2009; McConnachie 2012).
Cosmological simulations from Jackson et al. (2021) suggest that dark matter deficient dwarfs are produced via tidal interactions between dwarfs and massive galaxies, and thus the majority of dark matter deficient dwarfs should be located within 150 kpc of the host ETG. Looking at the fraction of the dwarfs located below and above 150 kpc with a very low dynamical-to-baryonic mass ratios as compared to the whole MATLAS sample, defined here as log(Mdyn/Mbar) ¡ 0.8, we observe that of the satellites with a low ratio are located below 150 kpc from the host. However, we note that we do not observe a trend for the dark matter poor satellites to be located closer to the host than dark matter dominated dwarfs.
We focus on the morphology of the dwarfs as function of the projected separations. We can see in Figure 10 that the fraction of dEs seems to decrease with larger separation, while the TTDs are located at intermediate distances. These observations are in agreement with the spatial distribution of the LG dwarfs (Grebel et al. 2003; Grcevich & Putman 2009). Note that, unlike the LG, we observe a large fraction of dIs located close to the host, with about 50% of the HI-bearing dwarfs being dIs at a projected distance below 50 kpc. Ann (2017) investigated the fraction of dEs and dIs as a function of the distance to the host and its morphology (either an ETG or a LTG) and found that 40% of the satellites of ETGs located within 0.2 virial radius are dIs. This finding can explain the obtained fraction of dIs for the MATLAS sample. Only one HI-bearing UDG (MATLAS-1824) is satellite of an ETG from this subsample, the other two being likely located in groups. This UDG is relatively close to its host and show a very low dynamical-to-mass ratio, in agreement with its tidal origin (see Section 5.4.1.)
5.5.2 Local density
We examine possible effects of the local density on the gas content and the morphology of the HI-bearing dwarfs. We make use of two different parameters to estimate the local density of the dwarfs: the local volume density and the local surface density defined as and , respectively, with N the N-nearest galaxies and r the radius enclosing these galaxies in Mpc (Cappellari et al. 2011). We consider for our study the 10 nearest ETG and LTG neighbors of each dwarf from the ATLAS3D catalog (Cappellari et al. 2011a), assuming that the dwarf is located at the distance of its assumed host. To ensure the consistency of the local density estimates, we select the HI-bearing dwarfs confirmed to be satellites of their assumed host ETG. We define four subsamples based on the morphology and HI mass-to-light ratios of the dwarfs: UDGs, TTDs (see Section 5.3 for definition), dEs, and gas-rich dIs with MHI/LB¿1. We show in Figure 11 log() as a function of log() for the different morphologies. The TTDs and UDGs appear to populate intermediate densities while the gas-rich dEs and dIs are visible along the full range of densities probed by the MATLAS dwarfs.
We computed the running average of the gas fraction using three bins of log() in the range to 0.0. We find that the gas fraction slightly decreases with increasing local volume density with a mean of 0.630.20, 0.590.28 and 0.480.24 for each bin. Note that we observe a similar trend when using the local surface density as we obtain average gas fractions of 0.620.18, 0.590.26 and 0.540.27 considering three bins in the range – 0.5. This trend is consistent with the environment dependence found by Dénes et al. (2014).
6 Conclusions
We have studied the HI content of the optically identified MATLAS dwarfs, located in low to moderate density environments. We used radio observations from the ATLAS3D HI survey, performed by the WSRT, coupled with the final realease of the extragalactic HI sources catalog of the ALFALFA survey, based on radio data from Arecibo. These surveys are complementary, as the WSRT detects objects with smaller HI masses than Arecibo and the ALFALFA survey observes galaxies at farther distances than the ATLAS3D HI survey. Of the 1773 sources located in the regions targeted by either surveys, 8% (145) have an HI line detection. This sample of HI-bearing dwarfs includes 81 dwarfs with previously unreported HI detection. The majority of the dwarfs show irregular morphology (103 or 71%), while 29% (42) are ellipticals, the largest sample of HI-bearing dwarf ellipticals (dEs) to date. Based on their structural properties, 2% (3) are classified as UDGs. We derived their HI properties and compared them with their optical properties based on the Sérsic modeling (Poulain et al. 2021) and aperture photometry. We found that 79% are satellites of their assumed host ETG.
Based on the derived properties, we find that the HI-bearing dwarfs have bluer colors than the median color of the dwarfs with no HI detection. Moreover, the scaling relations between the HI and optical properties (MHI, M∗, fgas, color and MB) of the MATLAS HI-bearing dwarfs are consistent with the ones for dwarfs of similar mass and local environment. We observe that the MATLAS dwarfs with f tend to deviate from the HI-to-stellar mass relation of isolated dwarfs and are located in moderate local densities, suggesting an influence of the environment on the HI gas content. Most of the HI-bearing dwarfs show a gas fraction and an HI mass-to-light ratio typical of a galaxy with a baryonic mass dominated by the HI gas. Note that the dwarfs with high HI mass detected by ALFALFA, show a very high gas fraction and HI mass-to-light ratio as compared to the other dwarfs. We suggest this difference to be linked to the galaxy star-forming activity, with these dwarfs being as efficient in forming stars as more massive galaxies, unlike the other HI-bearing dwarfs. In addition to the described scaling relations, the MATLAS HI-bearing dwarfs show a BTFR consistent with the general trend for dwarfs in the LV. Based on the distribution of dynamical-to-baryonic mass ratios, the HI-bearing dwarfs are dark matter dominated, but we identified 5% (7) dark matter deficient candidates.
We investigated the morphology and environment of the HI-bearing dwarfs by looking at their HI mass-to-light ratios, the presence of galaxy interaction features and the spatial distribution of HI-bearing dwarfs satellites around their host ETGs. We report several findings. Focusing on the dEs, we estimate a detection rate of HI-bearing dEs in the MATLAS sample of 9.5%, suggesting as in Grossi et al. (2009) that HI-bearing dEs are more present in low-to-moderate density environments than in cluster. We compared UDGs to traditional dwarfs and find that, considering galaxies with location and stellar masses such that they can be detected in at least one of the surveys, there is a slightly smaller proportion of HI-bearing UDGs (7%) than HI-bearing traditional dwarfs (10%), and the UDGs have a smaller line width than the median value of the traditional dwarfs but have no tendency to be bluer or have a larger gas fraction. By investigating the morphology of the MATLAS HI-bearing dwarfs, we find that 12% (17) have HI mass-to-light ratios and morphological properties consistent with a transitional-type morphology, 2% (3) dEs are TTD candidates as gas-rich as dIs, 5% (7) show in their environment interaction features typical of massive galaxy interactions suggesting that they are possibly tidal dwarf galaxies, and 10% (14) possess low surface brightness structures characteristic of galaxy interactions such as shells, tidal tails or bridges. By studying the local environment, we observe an increase in the running average of the observed HI mass as a function of the projected separation to the host ETG, while the fraction of HI-bearing dEs decreases with the separation to the host ETG, and the TTDs are located at intermediate distances. Lastly, the gas fraction of the HI-bearing dwarfs depends on the local density, with the average gas fraction of the satellites increasing toward low density environments.
In summary, this study provides a large optically and HI selected sample of dwarf galaxies, including UDGs, outside galaxy clusters. The new generation telescopes in HI (e.g., Apertif, ASKAP, MeerKAT) and optical (e.g., Euclid, LSST) will provide a gain in both spatial coverage and HI sensitivity allowing us to better quantify the role of the environment on the gas content and morphology of dwarfs located in the LV and beyond.
Acknowledgements.
The authors thank the referee for the constructive comments that helped to improve this manuscript. Based on data obtained with the Westerbork Synthesis Radio Telescope (WSRT). The WSRT is operated by ASTRON (Netherlands Institute for Radio Astronomy) with support from the Netherlands Foundation for Scientific Research (NWO). Based on observations obtained with MegaPrime/MegaCam, a joint project of CFHT and CEA/IRFU, at the Canada-France-Hawaii Telescope (CFHT) which is operated by the National Research Council (NRC) of Canada, the Institut National des Science de l’Univers of the Centre National de la Recherche Scientifique (CNRS) of France, and the University of Hawaii. This work is based in part on data products produced at Terapix available at the Canadian Astronomy Data Centre as part of the Canada-France-Hawaii Telescope Legacy Survey, a collaborative project of NRC and CNRS. The authors acknowledge the work of the entire ALFALFA collaboration team in observing, flagging, and extracting the catalog of galaxies used in this work. The ALFALFA team at Cornell is supported by NSF grant AST-0607007 and AST-1107390 and by grants from the Brinson Foundation. M.P. acknowledges the Vice Rector for Research of the University of Innsbruck for the granted scholarship. S.P. acknowledges support from the New Researcher Program (Shinjin grant No. 2019R1C1C1009600) through the National Research Foundation of Korea. S.L. acknowledges the support from the Sejong Science Fellowship Program through the National Research Foundation of Korea (NRF-2021R1C1C2006790). M.B. acknowledges the support from the Polish National Science Centre under the grant 2017/26/D/ST9/00449.References
- Abraham & van Dokkum (2014) Abraham, R. G. & van Dokkum, P. G. 2014, PASP, 126, 55
- Aguerri et al. (2001) Aguerri, J. A. L., Balcells, M., & Peletier, R. F. 2001, A&A, 367, 428
- Ann (2017) Ann, H. B. 2017, Journal of Korean Astronomical Society, 50, 111
- Annibali et al. (2016) Annibali, F., Nipoti, C., Ciotti, L., et al. 2016, ApJ, 826, L27
- Baushev (2018) Baushev, A. N. 2018, New A, 60, 69
- Begum et al. (2008a) Begum, A., Chengalur, J. N., Karachentsev, I. D., & Sharina, M. E. 2008a, MNRAS, 386, 138
- Begum et al. (2008b) Begum, A., Chengalur, J. N., Karachentsev, I. D., Sharina, M. E., & Kaisin, S. S. 2008b, MNRAS, 386, 1667
- Bell et al. (2003) Bell, E. F., McIntosh, D. H., Katz, N., & Weinberg, M. D. 2003, ApJS, 149, 289
- Bennet et al. (2018) Bennet, P., Sand, D. J., Zaritsky, D., et al. 2018, ApJ, 866, L11
- Bertin (2012) Bertin, E. 2012, in Astronomical Society of the Pacific Conference Series, Vol. 461, Astronomical Data Analysis Software and Systems XXI, ed. P. Ballester, D. Egret, & N. P. F. Lorente, 263
- Bertin & Arnouts (1996) Bertin, E. & Arnouts, S. 1996, A&AS, 117, 393
- Bílek et al. (2020) Bílek, M., Duc, P.-A., Cuillandre, J.-C., et al. 2020, MNRAS, 498, 2138
- Blanton et al. (2011) Blanton, M. R., Kazin, E., Muna, D., Weaver, B. A., & Price-Whelan, A. 2011, AJ, 142, 31
- Boselli et al. (2008) Boselli, A., Boissier, S., Cortese, L., & Gavazzi, G. 2008, ApJ, 674, 742
- Boselli et al. (2014) Boselli, A., Voyer, E., Boissier, S., et al. 2014, A&A, 570, A69
- Bouchard et al. (2009) Bouchard, A., Da Costa, G. S., & Jerjen, H. 2009, AJ, 137, 3038
- Bradford et al. (2015) Bradford, J. D., Geha, M. C., & Blanton, M. R. 2015, ApJ, 809, 146
- Briggs (1995) Briggs, D. S. 1995, in American Astronomical Society Meeting Abstracts, Vol. 187, 112.02
- Broeils & Rhee (1997) Broeils, A. H. & Rhee, M. H. 1997, A&A, 324, 877
- Buyle et al. (2005) Buyle, P., De Rijcke, S., Michielsen, D., Baes, M., & Dejonghe, H. 2005, MNRAS, 360, 853
- Cannon et al. (2011) Cannon, J. M., Giovanelli, R., Haynes, M. P., et al. 2011, ApJ, 739, L22
- Cappellari et al. (2011a) Cappellari, M., Emsellem, E., Krajnović, D., et al. 2011a, MNRAS, 413, 813
- Cappellari et al. (2011) Cappellari, M., Emsellem, E., Krajnović, D., et al. 2011, MNRAS, 416, 1680
- Cappellari et al. (2011) Cappellari, M., Emsellem, E., Krajnović, D., et al. 2011, Monthly Notices of the Royal Astronomical Society, 413, 813
- Catinella et al. (2018) Catinella, B., Saintonge, A., Janowiecki, S., et al. 2018, MNRAS, 476, 875
- Chabrier (2003) Chabrier, G. 2003, PASP, 115, 763
- Conselice et al. (2003) Conselice, C. J., O’Neil, K., Gallagher, J. S., & Wyse, R. F. G. 2003, ApJ, 591, 167
- Côté et al. (2009) Côté, S., Draginda, A., Skillman, E. D., & Miller, B. W. 2009, AJ, 138, 1037
- Da Costa et al. (2007) Da Costa, G. S., Jerjen, H., & Bouchard, A. 2007, arXiv e-prints, arXiv:0710.1420
- Davies & Lewis (1973) Davies, R. D. & Lewis, B. M. 1973, MNRAS, 165, 231
- de Zeeuw et al. (2002) de Zeeuw, P. T., Bureau, M., Emsellem, E., et al. 2002, MNRAS, 329, 513
- Dellenbusch et al. (2008) Dellenbusch, K. E., Gallagher, John S., I., Knezek, P. M., & Noble, A. G. 2008, AJ, 135, 326
- Dénes et al. (2014) Dénes, H., Kilborn, V. A., & Koribalski, B. S. 2014, MNRAS, 444, 667
- Dénes et al. (2016) Dénes, H., Kilborn, V. A., Koribalski, B. S., & Wong, O. I. 2016, MNRAS, 455, 1294
- Desmond & Wechsler (2015) Desmond, H. & Wechsler, R. H. 2015, MNRAS, 454, 322
- Di Cintio et al. (2017) Di Cintio, A., Brook, C. B., Dutton, A. A., et al. 2017, MNRAS, 466, L1
- di Serego Alighieri et al. (2007) di Serego Alighieri, S., Gavazzi, G., Giovanardi, C., et al. 2007, A&A, 474, 851
- Dressler (1980) Dressler, A. 1980, ApJ, 236, 351
- Duc et al. (2007) Duc, P. A., Braine, J., Lisenfeld, U., Brinks, E., & Boquien, M. 2007, A&A, 475, 187
- Duc et al. (2000) Duc, P. A., Brinks, E., Springel, V., et al. 2000, AJ, 120, 1238
- Duc et al. (2015) Duc, P.-A., Cuillandre, J.-C., Karabal, E., et al. 2015, MNRAS, 446, 120
- Duc et al. (2014) Duc, P.-A., Paudel, S., McDermid, R. M., et al. 2014, MNRAS, 440, 1458
- Durbala et al. (2020) Durbala, A., Finn, R. A., Crone Odekon, M., et al. 2020, AJ, 160, 271
- Emsellem et al. (2019) Emsellem, E., van der Burg, R. F. J., Fensch, J., et al. 2019, A&A, 625, A76
- Ferguson & Sandage (1989) Ferguson, H. C. & Sandage, A. 1989, ApJ, 346, L53
- Ferrarese et al. (2012) Ferrarese, L., Côté, P., Cuillandre, J.-C., et al. 2012, The Astrophysical Journal Supplement Series, 200, 4
- Gavazzi et al. (2008) Gavazzi, G., Giovanelli, R., Haynes, M. P., et al. 2008, A&A, 482, 43
- Geha et al. (2006) Geha, M., Blanton, M. R., Masjedi, M., & West, A. A. 2006, ApJ, 653, 240
- Geha et al. (2012) Geha, M., Blanton, M. R., Yan, R., & Tinker, J. L. 2012, ApJ, 757, 85
- Giovanelli & Haynes (1985) Giovanelli, R. & Haynes, M. P. 1985, ApJ, 292, 404
- Giovanelli et al. (2005) Giovanelli, R., Haynes, M. P., Kent, B. R., et al. 2005, The Astronomical Journal, 130, 2598
- Graham & Driver (2005) Graham, A. W. & Driver, S. P. 2005, PASA, 22, 118
- Graham et al. (2012) Graham, A. W., Spitler, L. R., Forbes, D. A., et al. 2012, ApJ, 750, 121
- Grcevich & Putman (2009) Grcevich, J. & Putman, M. E. 2009, The Astrophysical Journal, 696, 385
- Grebel et al. (2003) Grebel, E. K., Gallagher, John S., I., & Harbeck, D. 2003, AJ, 125, 1926
- Grossi et al. (2009) Grossi, M., di Serego Alighieri, S., Giovanardi, C., et al. 2009, A&A, 498, 407
- Guo et al. (2020) Guo, Q., Hu, H., Zheng, Z., et al. 2020, Nature Astronomy, 4, 246
- Habas et al. (2020) Habas, R., Marleau, F. R., Duc, P.-A., et al. 2020, MNRAS, 491, 1901
- Hallenbeck et al. (2017) Hallenbeck, G., Koopmann, R., Giovanelli, R., et al. 2017, AJ, 154, 58
- Hallenbeck et al. (2012) Hallenbeck, G., Papastergis, E., Huang, S., et al. 2012, AJ, 144, 87
- Haynes et al. (2018) Haynes, M. P., Giovanelli, R., Kent, B. R., et al. 2018, The Astrophysical Journal, 861, 49
- Haynes et al. (2011) Haynes, M. P., Giovanelli, R., Martin, A. M., et al. 2011, AJ, 142, 170
- Hess & Wilcots (2013) Hess, K. M. & Wilcots, E. M. 2013, AJ, 146, 124
- Hickson (1997) Hickson, P. 1997, ARA&A, 35, 357
- Honey et al. (2018) Honey, M., van Driel, W., Das, M., & Martin, J. M. 2018, MNRAS, 476, 4488
- Hood et al. (2018) Hood, C. E., Kannappan, S. J., Stark, D. V., et al. 2018, ApJ, 857, 144
- Huang et al. (2012) Huang, S., Haynes, M. P., Giovanelli, R., et al. 2012, AJ, 143, 133
- Hubble (1926) Hubble, E. P. 1926, ApJ, 64, 321
- Hunter et al. (2000) Hunter, D. A., Hunsberger, S. D., & Roye, E. W. 2000, ApJ, 542, 137
- Jackson et al. (2021) Jackson, R. A., Kaviraj, S., Martin, G., et al. 2021, MNRAS, 502, 1785
- Janowiecki et al. (2019) Janowiecki, S., Jones, M. G., Leisman, L., & Webb, A. 2019, MNRAS, 490, 566
- Janowiecki et al. (2010) Janowiecki, S., Mihos, J. C., Harding, P., et al. 2010, ApJ, 715, 972
- Jones et al. (2021) Jones, M. G., Bennet, P., Mutlu-Pakdil, B., et al. 2021, ApJ, 919, 72
- Karachentsev et al. (2017) Karachentsev, I. D., Kaisina, E. I., & Kashibadze Nasonova, O. G. 2017, AJ, 153, 6
- Karachentsev et al. (2013) Karachentsev, I. D., Makarov, D. I., & Kaisina, E. I. 2013, AJ, 145, 101
- Karunakaran et al. (2020) Karunakaran, A., Spekkens, K., Zaritsky, D., et al. 2020, ApJ, 902, 39
- Kazantzidis et al. (2011) Kazantzidis, S., Łokas, E. L., Mayer, L., Knebe, A., & Klimentowski, J. 2011, ApJ, 740, L24
- Koleva et al. (2013) Koleva, M., Bouchard, A., Prugniel, P., De Rijcke, S., & Vauglin, I. 2013, MNRAS, 428, 2949
- Kormendy (1985) Kormendy, J. 1985, ApJ, 295, 73
- Kormendy & Kennicutt (2004) Kormendy, J. & Kennicutt, Robert C., J. 2004, ARA&A, 42, 603
- Lang et al. (2003) Lang, R. H., Boyce, P. J., Kilborn, V. A., et al. 2003, MNRAS, 342, 738
- Leisman et al. (2017) Leisman, L., Haynes, M. P., Janowiecki, S., et al. 2017, ApJ, 842, 133
- Lelli et al. (2015) Lelli, F., Duc, P.-A., Brinks, E., et al. 2015, A&A, 584, A113
- Lim et al. (2020) Lim, S., Côté, P., Peng, E. W., et al. 2020, ApJ, 899, 69
- Lim et al. (2018) Lim, S., Peng, E. W., Côté, P., et al. 2018, ApJ, 862, 82
- Ludwig et al. (2012) Ludwig, J., Pasquali, A., Grebel, E. K., & Gallagher, John S., I. 2012, AJ, 144, 190
- Lupton et al. (2004) Lupton, R., Blanton, M. R., Fekete, G., et al. 2004, PASP, 116, 133
- Macciò et al. (2016) Macciò, A. V., Udrescu, S. M., Dutton, A. A., et al. 2016, MNRAS, 463, L69
- Malin & Carter (1980) Malin, D. F. & Carter, D. 1980, Nature, 285, 643
- Marleau et al. (2021) Marleau, F. R., Habas, R., Poulain, M., et al. 2021, A&A, 654, A105
- Martin et al. (2007) Martin, N. F., Ibata, R. A., Chapman, S. C., Irwin, M., & Lewis, G. F. 2007, MNRAS, 380, 281
- McConnachie (2012) McConnachie, A. W. 2012, AJ, 144, 4
- McGaugh (2012) McGaugh, S. S. 2012, AJ, 143, 40
- McGaugh et al. (2000) McGaugh, S. S., Schombert, J. M., Bothun, G. D., & de Blok, W. J. G. 2000, ApJ, 533, L99
- Merritt et al. (2016) Merritt, A., van Dokkum, P., Danieli, S., et al. 2016, ApJ, 833, 168
- Mihos et al. (2015) Mihos, J. C., Durrell, P. R., Ferrarese, L., et al. 2015, ApJ, 809, L21
- Morganti et al. (2006) Morganti, R., Oosterloo, T. A., Weijmans, A., et al. 2006, Monthly Notices of the Royal Astronomical Society, 371, 157
- Mould et al. (2000) Mould, J. R., Huchra, J. P., Freedman, W. L., et al. 2000, ApJ, 529, 786
- Müller et al. (2019) Müller, O., Rich, R. M., Román, J., et al. 2019, A&A, 624, L6
- Müller et al. (2017) Müller, O., Scalera, R., Binggeli, B., & Jerjen, H. 2017, A&A, 602, A119
- Oosterloo et al. (2010) Oosterloo, T., Weijmans, A.-M., Krajnović, D., et al. 2010, Monthly Notices of the Royal Astronomical Society, 409, 500
- Papastergis et al. (2017) Papastergis, E., Adams, E. A. K., & Romanowsky, A. J. 2017, A&A, 601, L10
- Paudel et al. (2015) Paudel, S., Duc, P. A., & Ree, C. H. 2015, AJ, 149, 114
- Paudel et al. (2017) Paudel, S., Smith, R., Duc, P.-A., et al. 2017, ApJ, 834, 66
- Paudel et al. (2018) Paudel, S., Smith, R., Yoon, S. J., Calderón-Castillo, P., & Duc, P.-A. 2018, ApJS, 237, 36
- Pearson et al. (2016) Pearson, S., Besla, G., Putman, M. E., et al. 2016, MNRAS, 459, 1827
- Peng et al. (2010) Peng, C. Y., Ho, L. C., Impey, C. D., & Rix, H.-W. 2010, AJ, 139, 2097
- Poulain et al. (2021) Poulain, M., Marleau, F. R., Habas, R., et al. 2021, MNRAS, 506, 5494
- Revaz & Jablonka (2018) Revaz, Y. & Jablonka, P. 2018, A&A, 616, A96
- Revaz et al. (2009) Revaz, Y., Jablonka, P., Sawala, T., et al. 2009, A&A, 501, 189
- Rich et al. (2012) Rich, R. M., Collins, M. L. M., Black, C. M., et al. 2012, Nature, 482, 192
- Roberts (1962) Roberts, M. S. 1962, AJ, 67, 437
- Roychowdhury et al. (2010) Roychowdhury, S., Chengalur, J. N., Begum, A., & Karachentsev, I. D. 2010, MNRAS, 404, L60
- Sales et al. (2020) Sales, L. V., Navarro, J. F., Peñafiel, L., et al. 2020, MNRAS, 494, 1848
- Sánchez-Janssen et al. (2010) Sánchez-Janssen, R., Méndez-Abreu, J., & Aguerri, J. A. L. 2010, MNRAS, 406, L65
- Sault et al. (1995) Sault, R. J., Teuben, P. J., & Wright, M. C. H. 1995, in Astronomical Society of the Pacific Conference Series, Vol. 77, Astronomical Data Analysis Software and Systems IV, ed. R. A. Shaw, H. E. Payne, & J. J. E. Hayes, 433
- Schlafly & Finkbeiner (2011) Schlafly, E. F. & Finkbeiner, D. P. 2011, ApJ, 737, 103
- Schweizer (1982) Schweizer, F. 1982, ApJ, 252, 455
- Serra et al. (2012) Serra, P., Oosterloo, T., Morganti, R., et al. 2012, Monthly Notices of the Royal Astronomical Society, 422, 1835
- Sérsic (1963) Sérsic, J. L. 1963, Boletin de la Asociacion Argentina de Astronomia La Plata Argentina, 6, 41
- Shi et al. (2017) Shi, D. D., Zheng, X. Z., Zhao, H. B., et al. 2017, ApJ, 846, 26
- Simon (2019) Simon, J. D. 2019, ARA&A, 57, 375
- Simon & Geha (2007) Simon, J. D. & Geha, M. 2007, ApJ, 670, 313
- Skillman et al. (2003) Skillman, E. D., Côté, S., & Miller, B. W. 2003, AJ, 125, 593
- Spekkens & Karunakaran (2018) Spekkens, K. & Karunakaran, A. 2018, ApJ, 855, 28
- Springob et al. (2007) Springob, C. M., Masters, K. L., Haynes, M. P., Giovanelli, R., & Marinoni, C. 2007, ApJS, 172, 599
- Staveley-Smith et al. (1996) Staveley-Smith, L., Wilson, W. E., Bird, T. S., et al. 1996, PASA, 13, 243
- Sweet et al. (2014) Sweet, S. M., Drinkwater, M. J., Meurer, G., et al. 2014, ApJ, 782, 35
- Tal et al. (2009) Tal, T., van Dokkum, P. G., Nelan, J., & Bezanson, R. 2009, AJ, 138, 1417
- Tarumi et al. (2021) Tarumi, Y., Yoshida, N., & Frebel, A. 2021, ApJ, 914, L10
- Taylor et al. (2011) Taylor, E. N., Hopkins, A. M., Baldry, I. K., et al. 2011, MNRAS, 418, 1587
- Toloba et al. (2014) Toloba, E., Guhathakurta, P., van de Ven, G., et al. 2014, ApJ, 783, 120
- Toloba et al. (2018) Toloba, E., Lim, S., Peng, E., et al. 2018, ApJ, 856, L31
- Tully & Fisher (1977) Tully, R. B. & Fisher, J. R. 1977, A&A, 500, 105
- Tully & Pierce (2000) Tully, R. B. & Pierce, M. J. 2000, ApJ, 533, 744
- Valcke et al. (2008) Valcke, S., de Rijcke, S., & Dejonghe, H. 2008, MNRAS, 389, 1111
- van Dokkum et al. (2019) van Dokkum, P., Danieli, S., Abraham, R., Conroy, C., & Romanowsky, A. J. 2019, ApJ, 874, L5
- van Dokkum et al. (2018) van Dokkum, P., Danieli, S., Cohen, Y., et al. 2018, Nature, 555, 629
- van Dokkum et al. (2015) van Dokkum, P. G., Abraham, R., Merritt, A., et al. 2015, ApJ, 798, L45
- Verdes-Montenegro et al. (2001) Verdes-Montenegro, L., Yun, M. S., Williams, B. A., et al. 2001, A&A, 377, 812
- Wang et al. (2016) Wang, J., Koribalski, B. S., Serra, P., et al. 2016, MNRAS, 460, 2143
- Warren et al. (2007) Warren, B. E., Jerjen, H., & Koribalski, B. S. 2007, AJ, 134, 1849
- Zibetti et al. (2009) Zibetti, S., Charlot, S., & Rix, H.-W. 2009, MNRAS, 400, 1181
| ID | RA | Dec | vhelio | DHI | W50 | FHI | SNR | Mg | MB | Survey | Morph | |||||
|---|---|---|---|---|---|---|---|---|---|---|---|---|---|---|---|---|
| [deg] | [deg] | [km/s] | [Mpc] | [km/s] | [Jy-km/s] | mag | mag | mag | ||||||||
| (1) | (2) | (3) | (4) | (5) | (6) | (7) | (8) | (9) | (10) | (11) | (12) | (13) | (14) | (15) | (16) | (17) |
| MATLAS-23 | 19.7116 | 3.5617 | 4933.08.0 | 71.360.11 | 100 | 1.030.08 | 8.2 | 9.090.06 | -15.08 | -14.76 | 0.29 | 7.880.02 | 18.97 | 10.33 | ALFALFA | dI |
| MATLAS-42 | 20.6260 | 8.7614 | 2422.015.0 | 33.460.21 | 27 | 0.580.05 | 10.7 | 8.180.06 | -15.33 | -14.98 | 0.40 | 8.140.03 | 1.93 | 9.00 | ALFALFA | dI; UDG |
| MATLAS-121 | 26.5425 | 28.8157 | 3764.08.0 | 52.320.11 | 39 | 0.500.04 | 8.4 | 8.510.06 | -14.29 | -13.96 | 0.36 | 7.670.02 | 10.42 | 9.18 | ALFALFA | dE |
| MATLAS-122 | 26.9508 | 22.1426 | 2987.02.0 | 40.630.03 | 36 | 1.400.04 | 21.4 | 8.740.05 | -15.18 | -14.75 | 0.62 | 8.430.01 | 8.45 | 9.82 | ALFALFA | dI |
| MATLAS-124 | 27.2047 | 21.5792 | 3024.06.0 | 42.090.09 | 36 | 0.600.05 | 8.8 | 8.400.06 | -13.76 | -13.47 | 0.21 | 7.240.01 | 12.67 | 9.05 | ALFALFA | dI |
| MATLAS-125 | 27.2088 | 22.1143 | 3039.08.0 | 42.000.12 | 74 | 0.130.03 | 6.2 | 7.700.12 | -15.72 | -15.35 | 0.47 | 8.410.01 | 0.45 | 9.59 | ATLAS3D | dE,N; TTD |
| MATLAS-127 | 27.4368 | 22.3744 | 2947.08.0 | 41.760.12 | 90 | 0.220.06 | 4.8 | 7.940.11 | -15.93 | -15.57 | 0.42 | 8.430.00 | 0.64 | 9.42 | ATLAS3D* | dI |
| MATLAS-132 | 27.6409 | 22.0435 | 2347.08.0 | 34.540.12 | 33 | 0.050.03 | 3.5 | 7.170.24 | -10.95 | -10.55 | 0.57 | 6.650.05 | 11.12 | 9.35 | ATLAS3D | dI |
| MATLAS-146 | 29.9250 | 19.0219 | 2372.08.0 | 38.470.12 | 58 | 0.110.04 | 3.6 | 7.690.15 | -15.94 | -15.57 | 0.47 | 8.500.00 | 0.36 | 9.04 | ATLAS3D | dE; TTD |
| MATLAS-154 | 31.7166 | 10.9491 | 1955.08.0 | 28.920.12 | 66 | 0.120.05 | 3.5 | 7.410.18 | -12.96 | -12.6 | 0.42 | 7.240.01 | 2.86 | 8.98 | ATLAS3D | dE |
| … | … | … | … | … | … | … | … | … | … | … | … | … | … | … | … |
-
•
Notes. The columns are as follows: (1) Dwarf ID; (2) Right ascension (J2000); (3) Declination (J2000); (4) Heliocentric velocity; (5) HI distance from Hubble flow; (6) W50 line width; (7) HI flux; (8) Signal-to-noise ratio; (9) log10 of the HI mass; (10) g-band absolute magnitude; (11) B-band absolute magnitude; (12) Galactic extinction corrected color; (13) log10 of the stellar mass; (14) HI-mass-to-light ratio; (15) log10 of the dynamical mass; (16) Survey; (17) Morphology. Based on Poulain et al. (2021) for the dEs, dIs, and nucleated (indicated with ”,N”), and on Marleau et al. (2021) for the UDGs. ATLAS3D* means that the dwarf has also been detected in the ALFALFA survey. This table is available in its entirety at the CDS.
Appendix A Dwarfs HI spectra and color cutouts