Active forces in confluent cell monolayers
Abstract
We use a computational phase-field model together with analytical analysis to study how inter-cellular active forces can mediate individual cell morphology and collective motion in a confluent cell monolayer. Contractile inter-cellular interactions lead to cell elongation, nematic ordering and active turbulence, characterised by motile topological defects. Extensile interactions result in frustration, and perpendicular cell orientations become more prevalent. Furthermore, we show that contractile behaviour can change to extensile behaviour if anisotropic fluctuations in cell shape are considered.
Introduction: Asking how cells move collectively is a fascinating and important problem that encompasses both the concepts of forces and flows traditional to physics Trepat et al. (2009); Ladoux and Mège (2017) and the molecular signalling which drives many biological phenomena Boocock et al. (2021). Generic descriptions of cell motility, such as the phase-field model Mueller et al. (2019); Peyret et al. (2019); Zhang et al. (2020); Löber et al. (2014, 2015); Wenzel et al. (2019); Loewe et al. (2020); Palmieri et al. (2015) and vertex models Farhadifar et al. (2007); Bi et al. (2015); Giavazzi et al. (2018); Bi et al. (2016); Alt et al. (2017), have recently contributed to understanding several aspects of cell motility.
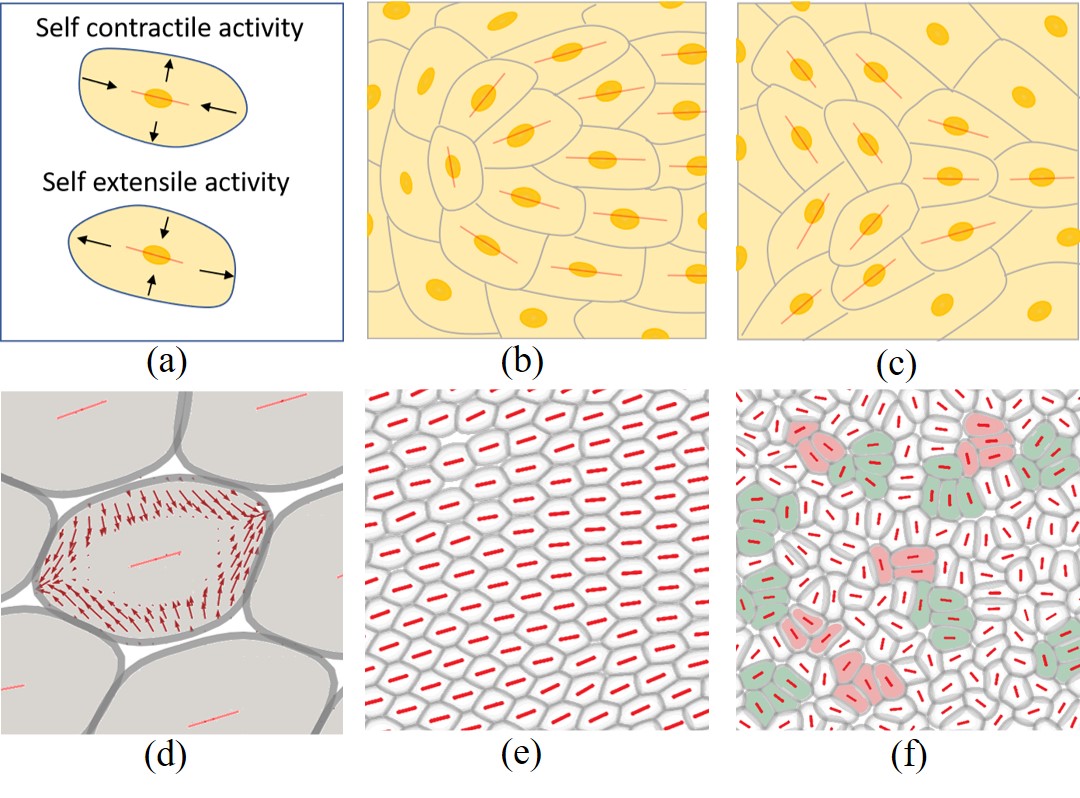
The forces driving single cells across a flat surface are well understood. The cell is controlled by directional actin filaments, which can continuously polymerize and depolymerize to produce lamellopodia, protrusions that push the cell forwards Alberts et al. (2003); Mitchison and Cramer (1996). To advance, the cell needs to push against the substrate and to do this effectively it creates focal adhesions, which are mechanical links between internal actin bundles and the external surface Sarangi et al. (2017). As it moves, the cell tends to polarize and elongate in the direction of motion Parsons et al. (2010). Contractile forces, mediated by myosin motors interacting with the actin network within the cell, tend to restore it to circular Pollard and Borisy (2003). Thus a minimal physical model of single cell motility comprises a net force in the direction of the cell polarity, together with contractile, balanced forces restoring the cell to a circular shape. (We will refer to forces that tend to return an elongated cell to circular, or to extend it further, as contractile and extensile respectively, Fig. 1(a)).
Much less is understood about the dynamics of confluent cell layers. The cells can be jammed with local fluctuations Bi et al. (2015); Sadati et al. (2013) or form liquid-like states where the motion has localised, correlated bursts of velocity or vorticity. Moreover, motile topological defects, regions where the long axes of the cells take comet or trefoil-like configurations (Fig.1(b)(c)), have been identified in several confluent cell layers Blanch-Mercader et al. (2018); Balasubramaniam et al. (2021); Saw et al. (2017); Kawaguchi et al. (2017). This is reminiscent of active turbulence, which is the dynamical behaviour of many active nematic materials, such as suspensions of microswimmers Sanchez et al. (2012); Dombrowski et al. (2004) or microtubules driven by motor proteins Sanchez et al. (2012). However, the appearance of active turbulence requires elongated particles Doostmohammadi et al. (2018) and therefore it is somewhat surprising to identify topological defects even in assemblies of e.g. MDCK cells that are on average isotropic in shape Saw et al. (2017). Moreover the comet defects can move towards their head, corresponding to extensile driving Giomi et al. (2014), even though individual cells are contractile Balasubramaniam et al. (2021). Indeed, experiments and simulations have shown that the defect motion changes direction - indicating a change from extensile to contractile behaviour - as the cell-cell adhesion is varied. Other theoretical work has shown that fluctuating polar (unbalanced) forces can result in extensile defects Patelli et al. (2019); Killeen et al. .
These observations raise questions about the identity of the physical forces governing collective cell motility. The formation of lamellopodia is suppressed in confluent cell layers, a phenomenon termed contact inhibition of locomotion, suggesting the absence of any persistent, unbalanced (polar) forces Abercrombie (1970); Stramer and Mayor (2017). Therefore balanced forces must be acting to drive the cellular dynamics and, because the motion is persistent, these must be active, i.e. continuously fuelled by chemical energy. The most likely physical origin for these are the contractile forces within a cell which act through inter-cellular junctions to pull on the cell’s neighbours.
We present analytical arguments and simulations, based on a two-dimensional, coarse-grained, phase-field model of cell motility, to show that active, contractile interactions between cells, mediated through cell junctions, lead to the cells elongating and lining up to give nematic ordering. Decreasing cell-cell adhesion leads to flows which destabilise the nematic order, resulting in active turbulence and contractile topological defects. We further show that anisotropic fluctuations of the inter-cellular forces can change the direction in which the defects move.
Model: The phase-field approach describing the dynamics of a confluent cell layer resolves individual cells and their interactions but not the internal cell machinery Mueller et al. (2019); Löber et al. (2014); Ziebert et al. (2011); Ziebert and Aranson (2013). Each cell is represented by an individual phase field, . The motion of each phase field is governed by a local velocity field, , according to the equation of motion
| (1) |
where is a free energy. describes the relaxation dynamics of the cells to a free energy minimum at a rate . Assuming over-damped dynamics, the velocity of a cell is determined by the local force density acting on the cell,
| (2) |
where is a friction coefficient.
The passive force density, , includes a Cahn-Hilliard term that encourages to take values , which we choose to correspond to the inside of the cell , or , which denotes the region outside the cell, a soft constraint, restricting the area of each cell, a repulsion energy that penalises overlap between cells and, of particular relevance here, a cell-cell adhesion energy with strength parameterised by . See the SM SM and Mueller et al. (2019); Zhang et al. (2020); Cates and Tjhung (2018); Löber et al. (2015) for more details.
To formulate the active contribution to the force density, , we first calculate the deformation tensor that quantifies the shape of a cell Mueller et al. (2019); Bigun and Granlund (1987),
| (3) | ||||
where and are the orthonormal eigenvectors of the , along and perpendicular to the elongation axis of the cell respectively, normalised so that .
We next define a director, , associated with each cell and assume that relaxes towards through a stochastic relaxation process,
| (4) |
controls the time scale of relaxation. We assume anisotropic, Gaussian noise, uncorrelated between cells, with
| (5) | ||||
The variance of the noise couples to the shape of the cell and can take different values for fluctuations along or .
In the absence of any unbalanced active forces, the leading order contribution to the active stress acting on cell is related to the director field by Simha and Ramaswamy (2002)
| (6) |
where
| (7) |
We distinguish between the stress acting on cell due to internal forces, of strength , and that due to other cells, of strength . Our arguments are not changed qualitatively by the value of and therefore we choose it to be zero. The force density arising from the active stress is then
| (8) |
Inter-cellular contractile forces: Individual cells are contractile, so a plausible physical picture is that a cell feels the contractile forces from its neighbours, transmitted through cell-cell junctions. Therefore, we first investigate contractile, inter-cellular forces (), assuming instantaneous relaxation of the director to the elongation axis of the cell . Fig. 1(d) shows the typical force density acting on a given cell due to its contractile neighbours. Surprisingly, the cell is stretched.
This can be explained by considering Eq. (8). The gradient of a phase-field, , points perpendicular to a cell boundary towards the cell centre. In addition, in a confluent monolayer with strong cell-cell adhesion, cells nestle closely sharing common interfaces. These properties allow us to approximate for the dominant contributions in Eq. (8), so the active inter-cellular force can be written
| (9) |
in terms of an effective -tensor, . The change in sign shows that a cell with contractile neighbours will be subject to an extensile-like, self-deformation force density (Fig. 1(a)) which stretches the cell (Fig. 1(d)). Moreover, Eq. (9) shows that each cell tends to align along the averaged elongation direction of its neighbours which, following the usual mean-field argument, is expected to result in nematic ordering.
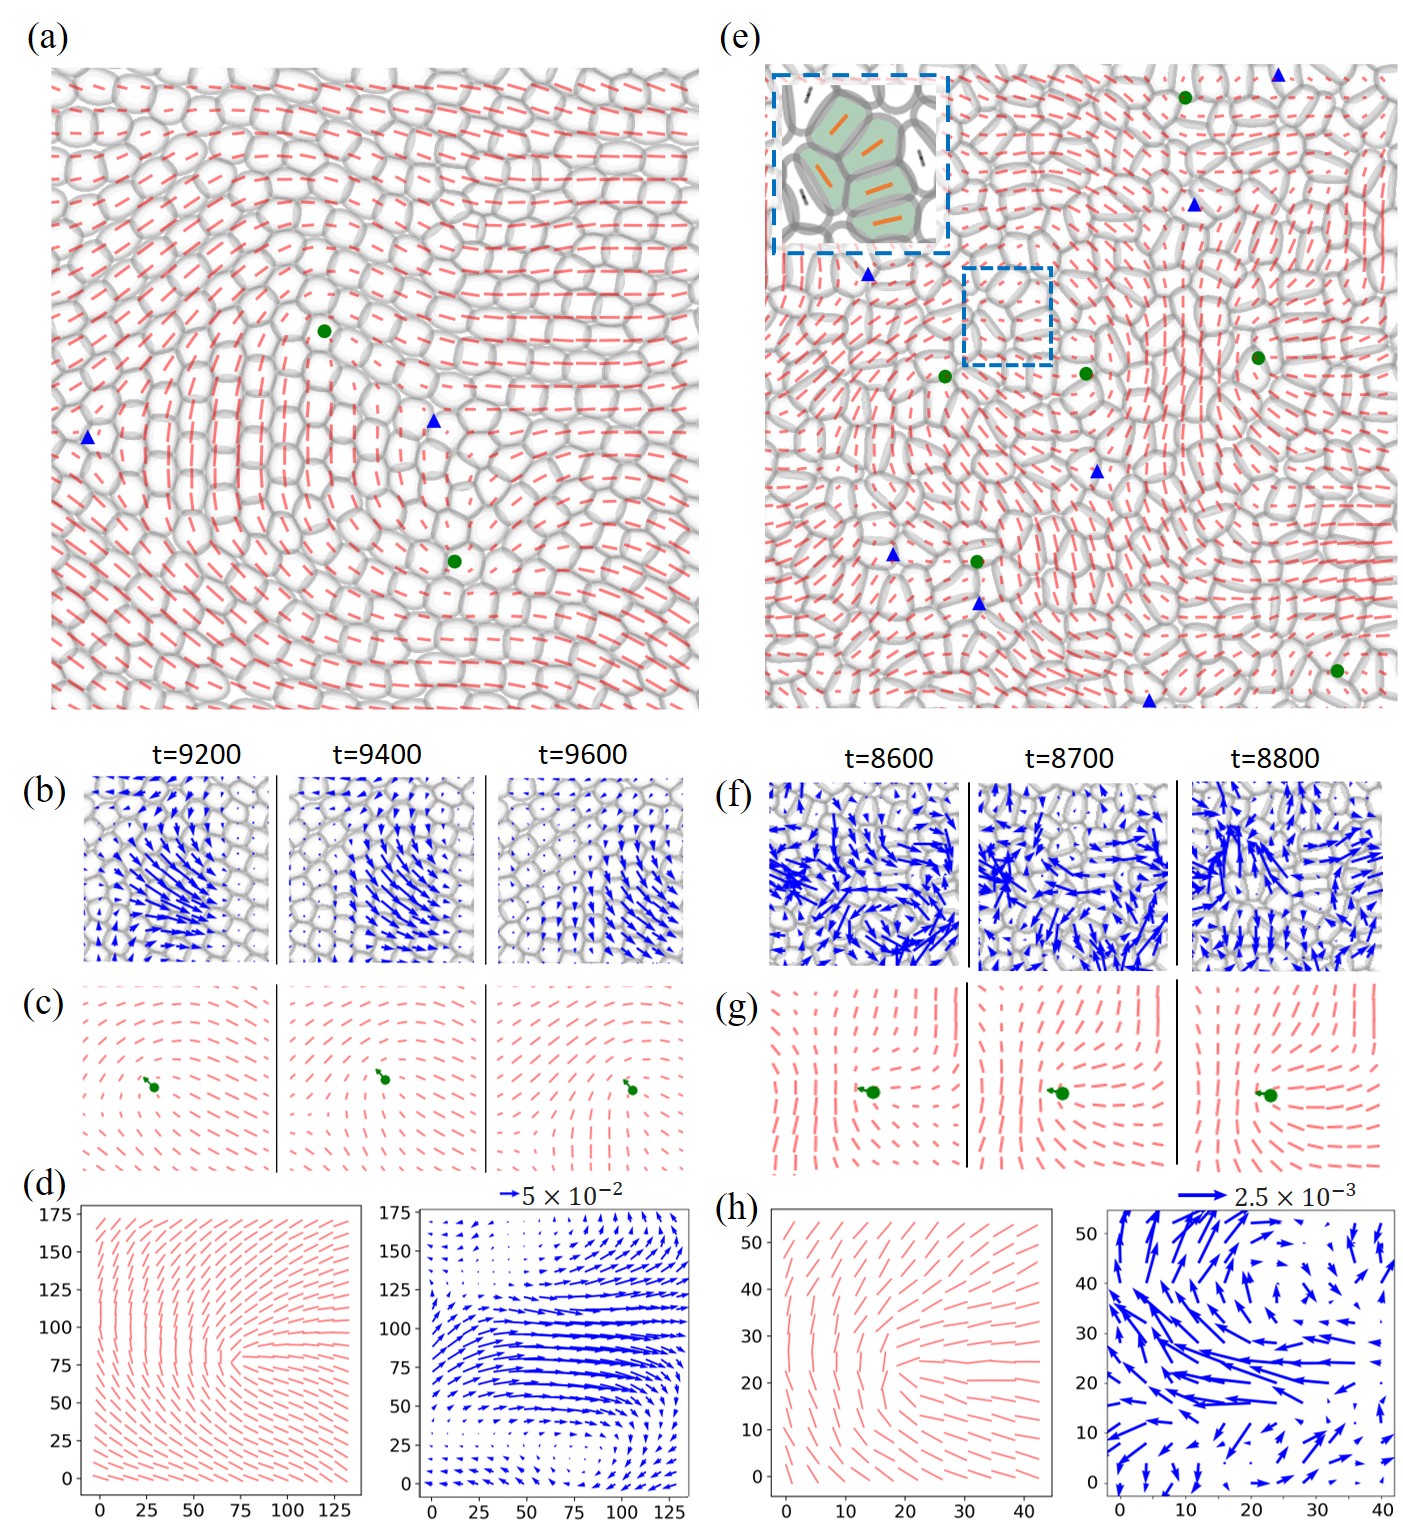
We check and extend this argument by solving the phase-field model numerically for cells (see SM for details SM ). For strong cell-cell adhesion, , the cells are extended and aligned and become jammed in the configuration shown in Fig 1(e). Decreasing the cell-cell adhesion to zero weakens the alignment and allows the cells to move collectively. We observe the well-known splay instability that characterises contractile active nematics, and which leads to active turbulence. Topological defects are continually created and destroyed. These move towards their tail confirming that they result from contractile forces (Fig. 2(a)-(d), Movie 1).
Inter-cellular extensile forces: Although a contractile, inter-cellular force is more physical, it is interesting to compare extensile forcing (). In this case, the alignment due to effective self-interactions is frustrated and there is no long-range ordering. Instead cells tend to align locally, at the scale of a few cells, in a capped line structure (Fig. 1(f), Fig. 2(e), Movie 2). Measuring the average velocity field around defects confirms that they move tail to head as expected in an extensile system (Fig. 2(e)-(h)). Defects form more easily, and are more localised and less persistent than in the contractile case (note the different scales of Fig. 2(d) and (h)). It is of interest that similar capped line structures are seen in simulations of hard rods, driven by a polar force Meacock et al. (2021); Wensink et al. (2012).
Fluctuations We next model the strong fluctuations in cell shape that are observed in many epithelial cell layers by including the anisotropic noise term, defined in Eq. (5), in the equation governing the relaxation of a cell director, Eq. (4). This leads to anisotropic fluctuations of the inter-cellular forces. If the relaxation of the director to the long axis of a cell is rapid compared to the time scale of cell reorientation, Eq. (4) can be integrated to give
| (10) |
where is the director of cell at . Using this expression in Eqs. (7) and (8) the averaged inter-cellular force follows as
| (11) |
Hence fluctuations in cell shape along tend to change the sign of the activity.
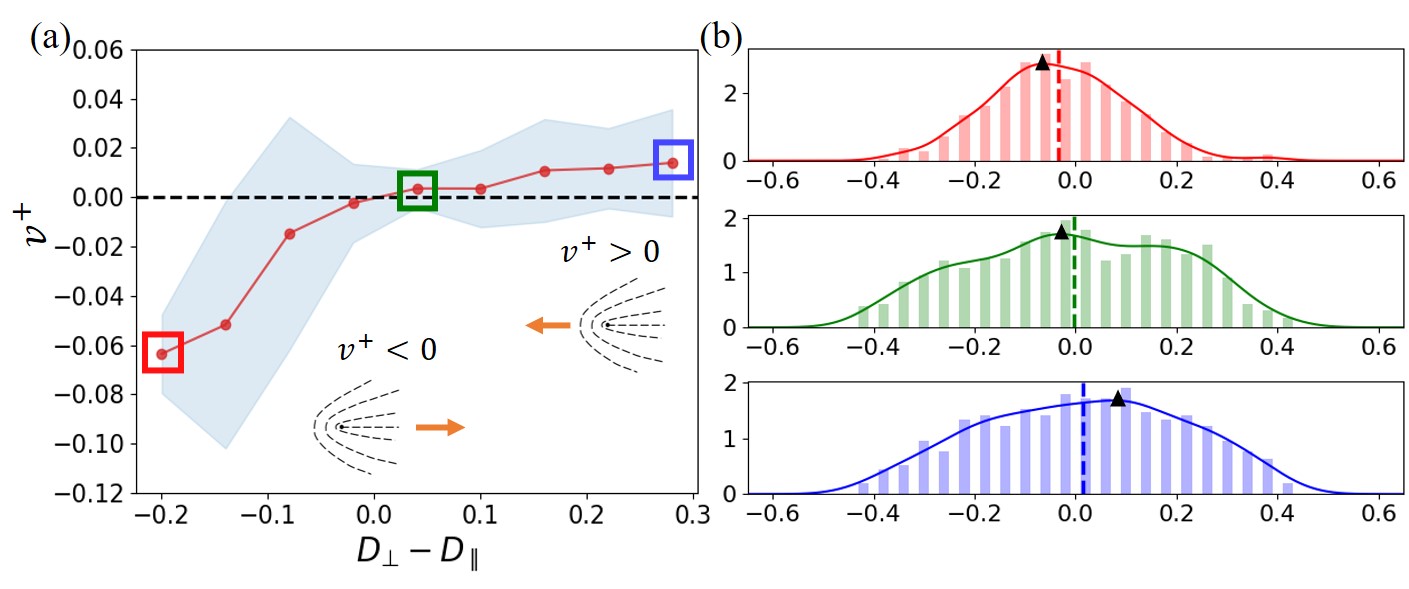
This is confirmed in Fig. 3 where we plot the defect velocity against , showing a change from contractile to extensile behaviour (see also Fig. S2, Movies 3,4). Further evidence for a crossover is presented in Fig. S3 where the distribution of the angles between the long axes of neighbouring cells is plotted. With increasing there is a crossover from a peak at signalling nematic ordering to two weaker peaks at and indicating the capped line state.
When extensile and contractile influences balance (green square in Fig. 3), a jammed phase emerges where the shape of cells is round on average, but fluctuates strongly (Movie 5).
Our work gives an explanation for why cells that are, on average, circular can exhibit nematic ordering and active turbulence in terms of fundamental, active, interactions between the cells. It also shows that the direction of motion of active defects can vary. Our prediction that this depends on anisotropic fluctuations of inter-cellular forces and hence of cell shape could be tested experimentally by analysing the dynamical evolution of monolayers.
References
- Trepat et al. (2009) X. Trepat, M. R. Wasserman, T. E. Angelini, E. Millet, D. A. Weitz, J. P. Butler, and J. J. Fredberg, Nature Physics 5, 426 (2009).
- Ladoux and Mège (2017) B. Ladoux and R.-M. Mège, Nature Reviews Molecular Cell Biology 18, 743 (2017).
- Boocock et al. (2021) D. Boocock, N. Hino, N. Ruzickova, T. Hirashima, and E. Hannezo, Nature Physics 17, 267 (2021).
- Mueller et al. (2019) R. Mueller, J. M. Yeomans, and A. Doostmohammadi, Physical Review Letters 122, 048004 (2019).
- Peyret et al. (2019) G. Peyret, R. Mueller, J. d’Alessandro, S. Begnaud, P. Marcq, R. M. Mège, J. M. Yeomans, A. Doostmohammadi, and B. Ladoux, Biophysical Journal 117, 464 (2019).
- Zhang et al. (2020) G. Zhang, R. Mueller, A. Doostmohammadi, and J. M. Yeomans, Journal of the Royal Society Interface 17, 20200312 (2020).
- Löber et al. (2014) J. Löber, F. Ziebert, and I. S. Aranson, Soft Matter 10, 1365 (2014).
- Löber et al. (2015) J. Löber, F. Ziebert, and I. S. Aranson, Scientific Reports 5, 9172 (2015).
- Wenzel et al. (2019) D. Wenzel, S. Praetorius, and A. Voigt, The Journal of Chemical Physics 150, 164108 (2019).
- Loewe et al. (2020) B. Loewe, M. Chiang, D. Marenduzzo, and M. C. Marchetti, Physical Review Letters 125, 038003 (2020).
- Palmieri et al. (2015) B. Palmieri, Y. Bresler, D. Wirtz, and M. Grant, Scientific Reports 5, 11745 (2015).
- Farhadifar et al. (2007) R. Farhadifar, J.-C. Röper, B. Aigouy, S. Eaton, and F. Jülicher, Current Biology 17, 2095 (2007).
- Bi et al. (2015) D. Bi, J. Lopez, J. M. Schwarz, and M. L. Manning, Nature Physics 11, 1074 (2015).
- Giavazzi et al. (2018) F. Giavazzi, M. Paoluzzi, M. Macchi, D. Bi, G. Scita, M. L. Manning, R. Cerbino, and M. C. Marchetti, Soft Matter 14, 3471 (2018).
- Bi et al. (2016) D. Bi, X. Yang, M. C. Marchetti, and M. L. Manning, Physical Review X 6, 021011 (2016).
- Alt et al. (2017) S. Alt, P. Ganguly, and G. Salbreux, Philosophical Transactions of the Royal Society B: Biological Sciences 372, 20150520 (2017).
- Alberts et al. (2003) B. Alberts, A. Johnson, J. Lewis, M. Raff, K. Roberts, P. Walter, D. Bray, and J. D. Watson, Molecular biology of the cell, Vol. 32 (W. W. Norton & Company, New York, 2003).
- Mitchison and Cramer (1996) T. Mitchison and L. Cramer, Cell 84, 371 (1996).
- Sarangi et al. (2017) B. R. Sarangi, M. Gupta, B. L. Doss, N. Tissot, F. Lam, R.-M. Mège, N. Borghi, and B. Ladoux, Nano Letters 17, 399 (2017).
- Parsons et al. (2010) J. T. Parsons, A. R. Horwitz, and M. A. Schwartz, Nature Reviews Molecular Cell Biology 11, 633 (2010).
- Pollard and Borisy (2003) T. D. Pollard and G. G. Borisy, Cell 112, 453 (2003).
- Sadati et al. (2013) M. Sadati, N. T. Qazvini, R. Krishnan, C. Y. Park, and J. J. Fredberg, Differentiation 86, 121 (2013).
- Blanch-Mercader et al. (2018) C. Blanch-Mercader, V. Yashunsky, S. Garcia, G. Duclos, L. Giomi, and P. Silberzan, Physical Review Letters 120, 208101 (2018).
- Balasubramaniam et al. (2021) L. Balasubramaniam, A. Doostmohammadi, T. B. Saw, G. H. N. S. Narayana, R. Mueller, T. Dang, M. Thomas, S. Gupta, S. Sonam, A. S. Yap, et al., Nature Materials 20, 1 (2021).
- Saw et al. (2017) T. B. Saw, A. Doostmohammadi, V. Nier, L. Kocgozlu, S. Thampi, Y. Toyama, P. Marcq, C. T. Lim, J. M. Yeomans, and B. Ladoux, Nature 544, 212 (2017).
- Kawaguchi et al. (2017) K. Kawaguchi, R. Kageyama, and M. Sano, Nature 545, 327 (2017).
- Sanchez et al. (2012) T. Sanchez, D. T. Chen, S. J. DeCamp, M. Heymann, and Z. Dogic, Nature 491, 431 (2012).
- Dombrowski et al. (2004) C. Dombrowski, L. Cisneros, S. Chatkaew, R. E. Goldstein, and J. O. Kessler, Physical Review Letters 93, 098103 (2004).
- Doostmohammadi et al. (2018) A. Doostmohammadi, J. Ignés-Mullol, J. M. Yeomans, and F. Sagués, Nature Communications 9, 1 (2018).
- Giomi et al. (2014) L. Giomi, M. J. Bowick, P. Mishra, R. Sknepnek, and M. C. Marchetti, Philosophical Transactions of the Royal Society A: Mathematical, Physical and Engineering Sciences 372, 20130365 (2014).
- Patelli et al. (2019) A. Patelli, I. Djafer-Cherif, I. S. Aranson, E. Bertin, and H. Chaté, Physical Review Letters 123, 258001 (2019).
- (32) A. Killeen, T. Bertrand, and C. F. Lee, arXiv:2107.03838 .
- Abercrombie (1970) M. Abercrombie, In vitro 6, 128 (1970).
- Stramer and Mayor (2017) B. Stramer and R. Mayor, Nature Reviews Molecular Cell Biology 18, 43 (2017).
- Ziebert et al. (2011) F. Ziebert, S. Swaminathan, and I. S. Aranson, Journal of the Royal Society Interface 9, 1084 (2011).
- Ziebert and Aranson (2013) F. Ziebert and I. S. Aranson, PLoS one 8, e64511 (2013).
- (37) See Supplemental Material at ”http://” for more details of the phase-field model and the simulation approaches and additional figures showing defect properties.
- Cates and Tjhung (2018) M. E. Cates and E. Tjhung, Journal of Fluid Mechanics 836, 1 (2018).
- Bigun and Granlund (1987) J. Bigun and G. H. Granlund, in Proceedings of the 1st International Conference on Computer Vision (IEEE Computer Society Press, London, 1987) pp. 433–438.
- Simha and Ramaswamy (2002) R. A. Simha and S. Ramaswamy, Physical Review Letters 89, 058101 (2002).
- Meacock et al. (2021) O. J. Meacock, A. Doostmohammadi, K. R. Foster, J. M. Yeomans, and W. M. Durham, Nature Physics 17, 205 (2021).
- Wensink et al. (2012) H. H. Wensink, J. Dunkel, S. Heidenreich, K. Drescher, R. E. Goldstein, H. Löwen, and J. M. Yeomans, Proceedings of the National Academy of Sciences 109, 14308 (2012).