Exploring the outskirts of the EAGLE disc galaxies
Abstract
Observations show that the surface brightness of disc galaxies can be well-described by a single exponential (TI), up-bending (TIII) or down-bending (TII) profiles in the outskirts. Here we characterize the mass surface densities of simulated late-type galaxies from the eagle project according to their distribution of mono-age stellar populations, the star formation activity and angular momentum content. We find a clear correlation between the inner scale-lengths and the stellar spin parameter, , for all three disc types with . The outer scale-lengths of TII and TIII discs show a positive trend with , albeit weaker for the latter. TII discs prefer fast rotating galaxies. With regards to the stellar age distribution, negative and U-shape age profiles are the most common for all disc types. Positive age profiles are determined by a more significant contributions of young stars in the central regions, which decrease rapidly in the outer parts. TII discs prefer relative higher contributions of old stars compared to other mono-age populations across the discs whereas TIII discs become progressively more dominated by intermediate age (2-6 Gyrs) stars for increasing radius. The change in slope of the age profiles is located after the break of the mass surface density. We find evidence of larger flaring for the old stellar populations in TIII systems compared to TI and TII, which could indicate the action of other processes. Overall, the relative distributions of mono-age stellar populations and the dependence of the star formation activity on radius are found to shape the different disc types and age profiles.
keywords:
galaxies: evolution – galaxies: formation – galaxies: stellar content – galaxies: disc1 Introduction
Stellar populations store important information on the evolution of galaxies and the physical processes that shaped their morphologies, star formation histories and chemical properties, among others. In the case of spiral galaxies, powerful information can be readily obtained through their surface brightness (SB) profiles. Disc components are typically consistent with well-behaved exponential profiles (Patterson, 1940; Freeman, 1970). To first order, their formation can be explained by the so-called standard model for disc formation (Fall & Efstathiou, 1980) which is based on the specific angular momentum conservation of baryons. However, within the current cosmological paradigm, galaxy formation proceeds in a non-linear way so that mergers and interactions with other galaxies, or with the global environment, can disturb galactic discs causing a redistribution of angular momentum (e.g. Pedrosa & Tissera, 2015; Teklu et al., 2015; Lagos et al., 2017), the formation of non-asymmetric features (e.g. Gómez et al., 2016, 2017; Gómez et al., 2021; Grand et al., 2016) and the loss of material via tidal stripping (Barnes & Hernquist, 1996), among others. It has become clear that not all spiral galaxies can be described by a single exponential profile extended to arbitrarily large radii (van der Kruit, 1979). Thus, while the SB distributions of some discs can be well-described by an exponential profile all the way out (TI), other discs show a brightness deficiency (TII) or excess (TIII) with respect to a single exponential profile. Such discs are are better described by double exponential fits (e.g. Pohlen & Trujillo, 2006) with a characteristic break radius (). Observational studies suggest a correlation between the Hubble type and the disc type. TIII systems are reported to be more frequent in early-type spirals while TII ones are more common in late-type ones (Erwin et al., 2008; Pohlen & Trujillo, 2006; Gutiérrez et al., 2011).
Several theoretical and observational works have analysed the characteristics of outer regions of disc galaxies (e.g Roškar et al., 2008b; Roškar et al., 2008a; Sánchez-Blázquez et al., 2009; Minchev et al., 2012a; Bakos et al., 2008; Yoachim et al., 2012; Ruiz-Lara et al., 2016). Yet, the origin of the deviation from a single exponential disc is still unclear. Variations of star formation efficiency, migration, accretion of small satellites, or a combination of all of them could be behind this. The main hypotheses formulated to explain "breaks" in the SB profiles are related to angular momentum redistribution (Debattista et al., 2006) and to the existence of a star formation threshold (Elmegreen & Hunter, 2006). Additionally, several works have reported a link between an outer upturn ("U-shape") in the age profiles and the TII profile, with the age up-turn causing the lack of light in the outer regions (Bakos et al., 2008; Roškar et al., 2008a; Sánchez-Blázquez et al., 2009; Martínez-Serrano et al., 2009; Yoachim et al., 2012). According to Sánchez-Blázquez et al. (2009), the origin of TII and TIII galaxies arises from a combination of two processes: (1) an abrupt change of slope in the radial star formation profile and (2) the effects of stellar radial migration inside-outside of . The first is due to a change in the gas volume density profile, which would cause the bending down in the stellar density profile. The second is due to radial migration of stars formed in the inner parts towards locations beyond . In addition, these authors proposed that the different types of stellar density profiles could be a consequence of a variation of efficiencies of both mechanisms. Ruiz-Lara et al. (2017b) reported different stellar age and metallicity inner gradients for galaxies displaying TI, TII and TIII SB profiles. Those results are interpreted as outcome of a gradual increase in the radial migration efficiency of stars from TII to TI and TIII galaxies.
Ruiz-Lara et al. (2016) analysed 44 spiral galaxies selected from the CALIFA survey (Walcher et al., 2014, see also Ruiz-Lara et al. 2017b). They compared the SB and age profiles in order to find differences between profile types (I and II). They also reported a U-shape in the age profiles of 17 galaxies that were either TII or TI. However in their sample, the U-shape feature is only observable in light-weighted age profiles. They claim that the mechanisms shaping the SB and stellar population distributions are not directly coupled and that the U-shape in age profiles would be due to an early formation of the disc followed by an inside-out quenching of the star formation.
On the other hand, Herpich et al. (2015); Herpich et al. (2017) investigated the role of the halo spin parameter () in shaping the outer SB profiles by analysing a set of simulations of isolated controlled galaxies. They found a clear transition from TIII galaxies, displaying low spin parameters to TII galaxies, showing higher values. TI discs are reported to have intermediate values, . Recently, Wang et al. (2018) found that the formation of TIII galaxies were linked to high HI-richness and low spin of the inner stellar disk. Hence there are still open questions regarding the origin of these characteristics features in the SB profiles. While the smooth formation of discs with global angular momentum conservation would lead to a correlation between scale-lengths and spin parameter (Mo et al., 1998a), these distributions could be disturbed by variety of physical processes such as stellar migration, dynamical heating, satellite accretion, bar formation, among others.
Clearly, the origin of the spread observed in the properties of galactic disk, such as surface density and brightness profiles, is complex and involves the action of several physical mechanisms. As such, these profiles can provide very rich information regarding the formation and evolution of galactic disc. For this purpose, we analyse the stellar surface density of disc galaxies selected from the simulation with the largest volume of the EAGLE Project (Schaye et al., 2015). The EAGLE simulations have been shown to reproduce several galaxy relations such as the gas content of galaxies at a given mass (Lagos et al., 2015; Bahé et al., 2016; Crain et al., 2017), the evolution of the galaxy stellar mass function (Furlong et al., 2015), the scale-resolved metallicity-star formation relation (Trayford & Schaye, 2019), the metallicity gradients as a function of stellar mass (Tissera et al., 2019; Tissera et al., 2022) and the azimuthal variation of the metallicity gradients at (Solar et al., 2020). Our goal is to characterize the origin of the different surface density and age profiles in a cosmological context. In this work, we focus on the analysis of stellar populations and their age distributions in central disc galaxies. The stellar surface density profiles, , are statistically analysed with the goal of identifying correlation between the distribution of mono-age stellar populations and the star formation activity.
The paper is organized as follows. In Section 2 we describe the main characteristics of the EAGLE simulations, the selected galaxy sample and the algorithm that is be applied to classify the different . Section 3 describes the analysis and results. In Section 4 we discuss and summarize our main findings.
2 Simulated galaxies
For this work we will use largest simulation (Ref-L100N1504) of the EAGLE Project111 In http://eaglesim.org, http://eagle.strw.leidenuniv.nl a global description of the project as well as access to movies and images and the database of galaxies can be found (McAlpine et al., 2016). (Schaye et al., 2015; Crain et al., 2015). The initial conditions are consistent with the Planck Cosmology parameters (Planck Collaboration et al., 2014): , , , , , n and where , and are the average densities of dark energy, matter and baryonic matter in units of the critical density at , is the square root of the linear variance of the matter distribution when smoothed with a top-hat filter of radius cMpc, is the Hubble parameter (), is the scalar power-law index of the power spectrum of primordial perturbations, and is the primordial mass fraction of helium. The subgrid physics parameters were calibrated to reproduce the galaxy mass function and the observed sizes of galaxies at (Schaye et al., 2015). In addition, other variations of the subgrid physics were explored as presented in Crain et al. (2015).
The Ref-L100N1504 run simulates a cubic volume of side 100 Mpc. The setup of the initial conditions provides a mass resolution of for dark matter and an initial mass of for baryonic particles. The gravitational calculations between particles are computed with a Plummer equivalent softening length of 2.66 comoving kpc limited to a maximum physical size of 0.70 pkpc (). This simulation provides a large number of galaxies formed in a variety of environments.
2.1 The simulated galaxy sample
We use the galaxy catalogue constructed by Tissera et al. (2019) from the Ref-L100N1504 at z=0. Only central galaxies within a given halo are analysed (i.e. no satellite galaxies have been included). The spheroidal and disc components were separated by applying a dynamical criterion based on the angular momentum content and the binding energy. This is done by estimating , where is the angular momentum component in the direction of the total angular momentum, and is the maximum over all particles at a given binding energy (see Tissera et al., 2012, for details on the procedure and conditions used). With this algorithm, the disc and bulge components are identified. The disc-to-total stellar mass ratio () is used to classify galaxies according to their morphologies. For this analysis, central galaxies with are selected. Additionally, only those with disc components resolved with more than 5000 stellar particles are considered. As a consequence, our sample comprises 1012 disc galaxies with stellar mass within the mass range [, ] . For each galaxy we calculated the optical radius, , as the radius that enclosed 83 percent of the stellar mass of a disk (Sáiz et al., 2001), and the effective radius, , as the radius that enclosed half of the disc stellar mass.
Hereafter, the profiles of the disc components of the selected galaxies are defined by projecting the stellar mass onto the rotational plane of the discs, from to . This is performed after the galaxies are rotated to have their z-axis aligned with the total angular momentum of the stellar discs.
To minimize potential issues due to numerical resolution or very local inhomogeneities, the profiles are calculated using moving averages. In practice, for a given galaxy, the azimuthally averaged disc surface density, , is estimated at the galactocentric distance of each disc stellar particle, . Here where is the total number of disc particles. To do so, we first sort all disc stellar particles with respect to in ascending order. We compute by selecting both the 10 percent of disc particles that are located at and the 10 percent of disc particles that are located at . In other words, a total of 20 percent of disc stellar particles are considered at each . We then add the mass of all selected disc stellar particles and compute the surface density considering the area enclosed by the selected subset222Note that, to always use the same number of particles when estimating , for the first and last 10 percent of the sorted disc particles, is not computed..
2.2 Break-Finder (BF) algorithm
In order to characterize the profiles, we follow a methodology similar to that established by previous authors (Erwin et al., 2008; Muñoz-Mateos et al., 2013), where profiles are presented as a double power-law piece-wise joined by an inflection point (see Erwin et al., 2008, equations 5 and 6). For this, we fit the profiles using the following piece-wise function:
| (1) |
| (2) |
where the two parts are joined at the break radius, . Here and ; inner and outer scale lengths, and ; inner and outer central densities and . Note that, the value of is set by the values of the remaining four parameters. Equations 1 and 2 are used to characterize the inner and outer regions of the discs, respectively.
Our BF fitting procedure considers star particles within 0.5 to . The BF algorithm is sensitive to breaks. A potential problem with the methods arises at the disc outer and inner most edges, where spurious inflection point could be defined. To avoid spurious results we allow to only vary within to . The remaining parameters are forced to be greater than 0. The parameter fitting is performed using a robust least squares optimization method for bounded problems called Trust Region Reflective algorithm 333 We implement Trust Region Reflective algorithm using the curve_fit function from the scipy library. More details can be found at https://scipy.org. The best fit minimizes the sum of squared residuals, which is quantified through the . The result is always a double exponential. The type of profiles are defined according to the criteria described in section 3.1
3 Analysis
3.1 Stellar surface density profiles
We analyse the of the selected disc galaxies and classify them as TI, TII and TIII profiles. For this purpose, the BF algorithm described in Section 2.2 is applied to the of all galaxies in our sample. The classification is performed by comparing the and scales. The strength of the break is quantified by defining
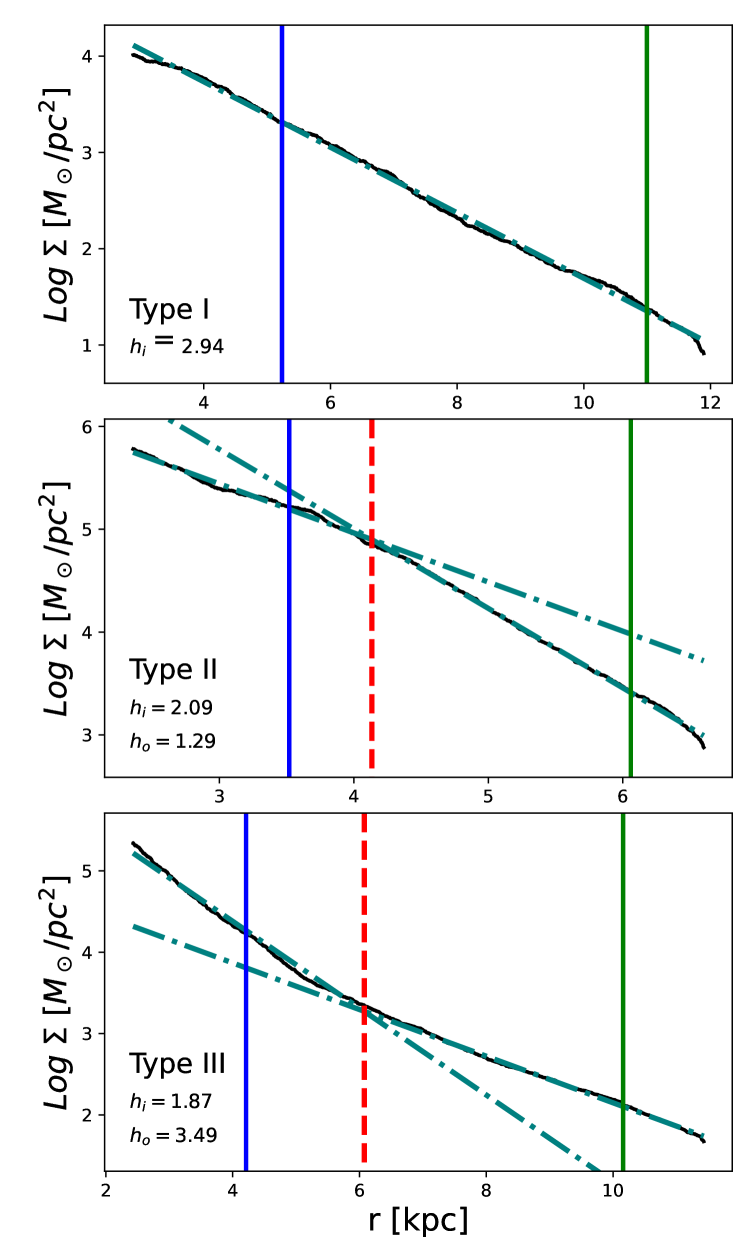
Following Ruiz-Lara et al. (2017b), we define TII discs are those with kpc, TIII discs have kpc, and TI discs have with kpc. This value corresponds to the quarter of standard deviation. Then, for TI discs, we perform a single power-law fit. In Fig. 1, we show the result of applying the fitting algorithm to three typical examples. Clearly, TII and TIII discs show double exponential profiles, with the inner disc defined for (the cyan, dashed vertical line), and the outer disc for .
Finally, we use the of the best fits to eliminate from the samples those discs that have more complex structure and hence require more than two exponentials to describe the . These discs are strongly disturbed and are not suitable for the study of this paper. For this purpose, only galaxies with , where is the median and is the standard deviation of the distribution for our total sample. In this way, we eliminate the outliers of at level, and build a well-fitted subsample of simulated galaxies whose can be described by either a pure or a double exponential. Our final sample comprises 912 galaxies.
With the aim of analysing a more trustworthy sample, we quantify the strong TII and TIII types groups by selecting the fifty percent of galaxies of each type which have the strongest deviation between the inner and outer discs. For this purpose, the median of the distribution for each type is calculated. Strong TII are galaxies that have larger than 1.02 kpc, while strong TIII galaxies have less than -1.66 kpc. Of course, there are no strong types for TI discs. In Table 1, we show the numbers of members and percentages of galaxy types in the total and strong samples. We can see that TIII is the most frequent type overall in the analysed sample. However TI are more frequent if we only consider the strong TII and TIII subsamples. The less frequent galaxy type in both EAGLE samples is TII. Hereafter, we will only consider the strong-type discs in the analysis with the purpose of disentangling clearly the similarities and differences among them.
As can be seen from Table 1, TI and TIII are the most frequent types in our simulated sample. This seems at odd with observations, which find TII to be the most common profile. However, observations also suggest that the fractions of galaxies with different disc types vary with morphology and probably with the environment. TII discs are reported to be more frequent in late-type galaxies while TIII discs tend to be identified in early-types. For example, Pohlen & Trujillo (2006) analysed a sample of 93 late-type galaxies and found a distribution of 10%:60%:30% for types TI:TII:TIII, respectively. Using 66 early-type spiral galaxies, Erwin et al. (2008) reported percentiles of 27%:42%:27%, and Gutiérrez et al. (2011) also detected a trend for TII to be more frequent in late-type spirals using a sample of 47 face-on early-type unbarred galaxies, they reported a global breakdown of 21%:50%:38%. As it will be discussed in Sec. 3.3, this dependence on morphology is reproduced by the EAGLE simulations. Although the frequencies between our EAGLE sample and the observations are not similar, recent work with galaxy triplets finds a high frequency of TIII galaxies in this environment. Members of such triplets typically show signs of interactions, highlighting the relevance of environment (Tawfeek et al., 2021). We note that, in our work, galaxies are located in different environments (Tissera et al., 2019) and that this aspect will be addressed in a forthcoming paper.
| NT | ||||
|---|---|---|---|---|
| All Types | 912 | 301 (33%) | 116 (13%) | 495 (54%) |
| Strong Types | 607 | 301 (49%) | 58 (10%) | 248 (41%) |
3.2 Age profiles
To understand the origin of the different types of profiles, and to confront them with observations, we also estimate age profiles for each galaxy. As for the profiles, the mass-weighted stellar age profiles are constructed by using stars located between and and are estimated by using moving averages. We note that the age profiles have been calculated within the same radial range used for the surface density profiles in order to be able to correlate their trends. Then a double-linear piece-wise function is fitted within the radial range [,1.5]444The radial range have been extend towards larger radii to ensure the detection of any change of slope in the age profiles since they are found to occur at larger galactocentric distances than the . using our BF algorithm. The profiles were fitted using logarithmic scale. In this way the inner, , and outer, , slopes and the inflection point are obtained (see Section 2.2). To classify the age profiles, we use the and slopes. We define four different behaviours by applying the criteria described below:
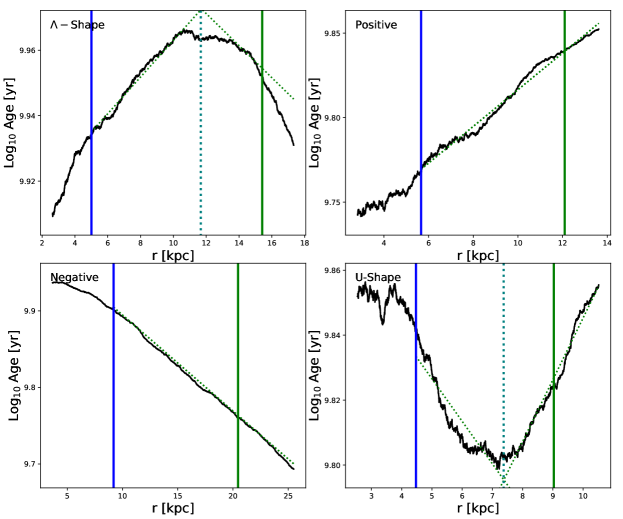
For the U-shape profiles, we refer the radial position at which the profiles with slopes and intersect each other as . For the -shape profiles this radial position is referred as . These definitions are related to the position of the minimum and maximum age, respectively. Fig. 2 show typical examples of positive, negative U- and -shape age profiles. These different types of age profiles are found in simulated discs regardless of their type (i.e. TI, TII and TIII). However, their frequencies change for TI, TII and TIII discs as summarized in Table 2. On the one hand, the U-shape profile is found to be the dominant class in TI and TII discs while for TIII discs the most frequent are negative and U-shaped age profiles. On the other hand, positive and -shape age profiles are the least frequent in TIII galaxies (where together represent only 4 percent to the total TIII), but are more numerous in TI where they are found in 37 per cent of the total TI galaxies. Observationally, Roediger et al. (2012) reported 15% of the TI and 36% of TII and TIII to have U-shape profiles. They also reported 30% of TI to have negative age slopes. Our estimations for the EAGLE galaxies are in general agreement with these observations. Roediger et al. (2012) also found that more than 50% of galaxies in their Virgo sample had positive age gradients regardless of the disc types, indicating the possible action of environmental effects. However, we have not found any report of -shape age profiles in observations yet.
| TI | TII | TIII | |
|---|---|---|---|
| Negative | 85 (0.29) | 13 (0.22) | 120 (0.50) |
| U-shape | 101 (0.34) | 25 (0.43) | 110 (0.46) |
| Positive | 49 (0.17) | 14 (0.24) | 6 (0.02) |
| -shape | 59 (0.20) | 6 (0.10) | 5 (0.02) |
We compare our results with Ruiz-Lara et al. (2017a), where 214 spiral galaxies selected from the CALIFA survey are analysed. They estimated both the light-weighted and mass-weighted age profiles. To make a fair comparison with our simulated data, we adopted the slopes of the linear regression fits of their mass-weighted age profiles. We also consider the definitions proposed by Ruiz-Lara et al. (2017b) to compute the inner and outer gradients. The inner discs are defined between 0.5 and for TII and TIII discs, and between 0.5 and 1.5 for TI discs. The outer regions in TII and TIII discs are calculated form to 1.5. The inner gradients are normalized by the inner scale-length and for outer gradients.
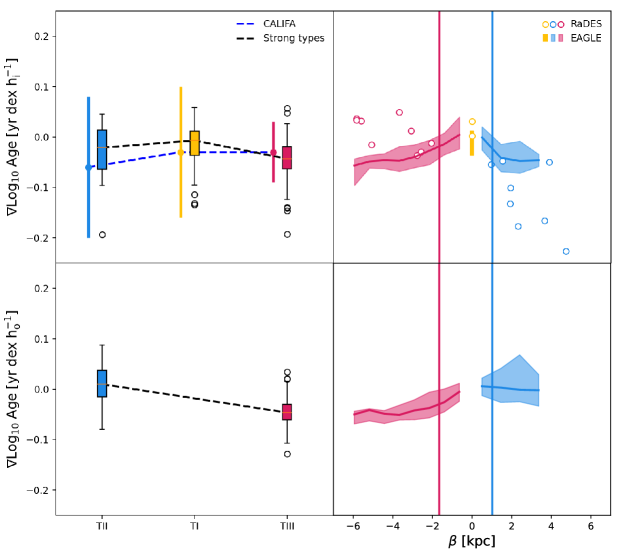
In the left panel of Fig. 3, we display the age gradients for TI, TII and TIII, including the observational results presented in Ruiz-Lara et al. (2017b). Our sample is represented by the colored boxes in the left panels. As can be seen, the simulated age profiles for each type are within the observed range. However, there is a trend for the simulated age gradients to be slightly shallower for TI and TII. In the top right panel of Fig. 3 the median age gradients for the strong TII and TIII for our EAGLE sample are displayed as a function of and compared with the results of RaDES simulated discs (Ruiz-Lara et al., 2017b, open circles). We note that these authors estimated light-weighed age profiles using the r-band SDSS luminosities and this might introduce difference with our results. The EAGLE discs show a weak correlation for TIII and anticorrelation for TII between the inner age gradients with . The Pearson correlation factor of each one are and respectively. Regarding TIII discs, RaDES reported an anticorrelation while EAGLE is consistent with the opposite trend. These differences could originate by the different subgrid physics implemented in RaDES and EAGLE simulations. Hence, the information stored in both age and profiles could help to constrain the galaxy formation models.
In the lower panels of Fig. 3 we also include similar relations for the age gradients in the outer regions using . This plot can be done only for TII and TIII discs. As can be seen the age profiles are shallower/positive for TII, while the outer regions of TIII discs show stronger negative age profiles and a trend for stronger TII to have more negative outer age gradients.
3.3 The angular momentum content
As mentioned in Section 1, different mechanisms could simultaneously act to shape the profiles. Here, we explore the connection between disc type and degree of galaxy rotation. To analyse this, we use the D/T ratio (Tissera et al., 2019), the stellar spin parameter, , and the ratio between the rotational velocity, , and the dispersion velocity, , of galaxies, (Lagos et al., 2018). All these parameters can be used to quantify the degree of stellar rotational support of galaxies. We highlight that, while D/T values are estimated using 3D information of the particle distributions and their angular momentum content, the and are 2D parameters obtained from a mock catalogue constructed by Lagos et al. (2018). From this catalogue, in this work we adopted the and values obtained when taking edge-on orientations of the galactic discs. These parameters are r-band luminosity-weighted within half-mass radius. Hence, and provides a more direct comparison with observations while D/T ratios measure the actual degree of rotation.
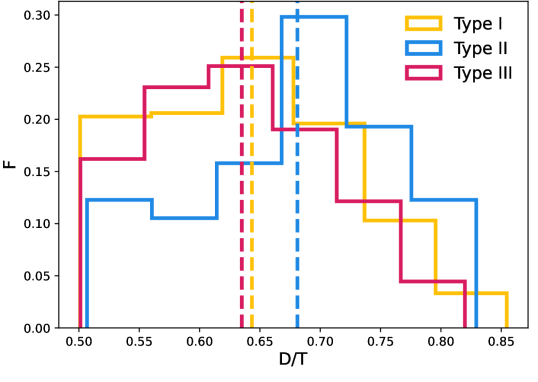
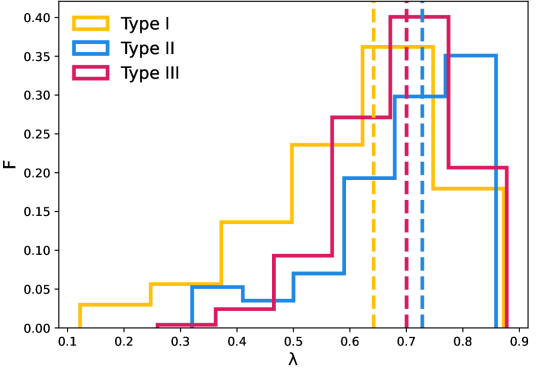
In Fig. 4, the D/T distribution for the three types are shown. As can be seen, TII discs tend to have larger contributions of galaxies with while TI and TIII have larger number of galaxies with . The median D/T for the three samples are: , , for TI, TII, TIII, respectively (the errors correspond to the standard deviation). These trends are in agreement with observations that reported a trend for TII discs to be more frequent in late-type galaxies while TIII profiles, in more dispersion-dominated disc galaxies (Erwin et al., 2008; Pohlen & Trujillo, 2006; Gutiérrez et al., 2011; Debattista et al., 2017).
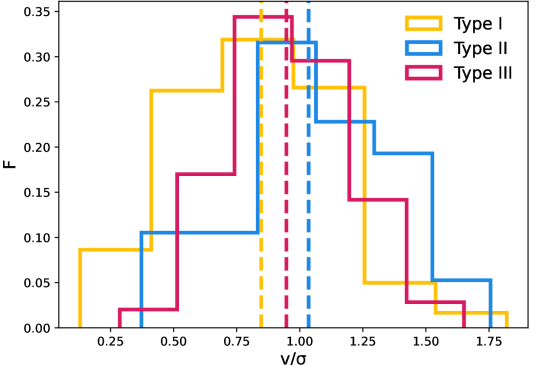
Values for the spin parameter and the distributions of galaxies for each disc type are taken from Lagos et al. (2018). Clear disc-dominated systems are expected to have approximately. However, in the middle panel of Fig. 4 we can see an small tail towards lower values which can be explained by the fact that these two parameters are estimated along the line-of-sight of edge-on projections (see also figure 4 in Rosito et al., 2019a). In Appendix B we discuss the relation determined by these two parameters in more detail. The provides an alternative quantification of the level of rotational support of galaxies. As can be seen from the middle panel of Fig. 4, the three distributions are skewed to low values, with the median values at , , for TI, TII and TIII, respectively. The errors correspond to the standard deviations of each subsample. TII galaxies tend to have larger parameters while TI and TIII profiles tend to have larger contributions of galaxies with smaller . In the lower panel of Fig. 4, the distributions for are shown with similar results. The median values of the distributions are , , for TI, TII and TIII.
To assess the statistical significance of these findings, we applied a Kolmogorov-Smirnov test (KS test) to the , , D/T distributions. Table 3 shows the p-values corresponding to the comparison between the different distributions shown Fig. 4. It provides, for different parameters, an assessment of how different/similar the samples are between them. In the case of D/T, the KS analysis is consistent with the trend for TII to prefer disc-dominated galaxies.
TI and TIII show a trend to prefer galaxies less rotationally supported and, likely, with more significant inner spheroidal components or bulges. Conversely, disc-dominated galaxies have a larger fraction of TII profiles. We note that these are only global trends since there is a variety of galaxies with different morphologies for a given disc type. This finding suggests that, although the angular momentum content of the galaxies is relevant to shape the stellar mass distribution, and its disc scale-length, it is certainly not the only physical mechanisms at play.
| Disc type | p-valueλ | p-valuev/σ | p-valueD/T |
|---|---|---|---|
| TI vs TII | 0.0006 | 0.0003 | 0.01 |
| TI vs TIII | 0 | 0 | 0.43 |
| TII vs TIII | 0.39 | 0.08 | 0.0003 |
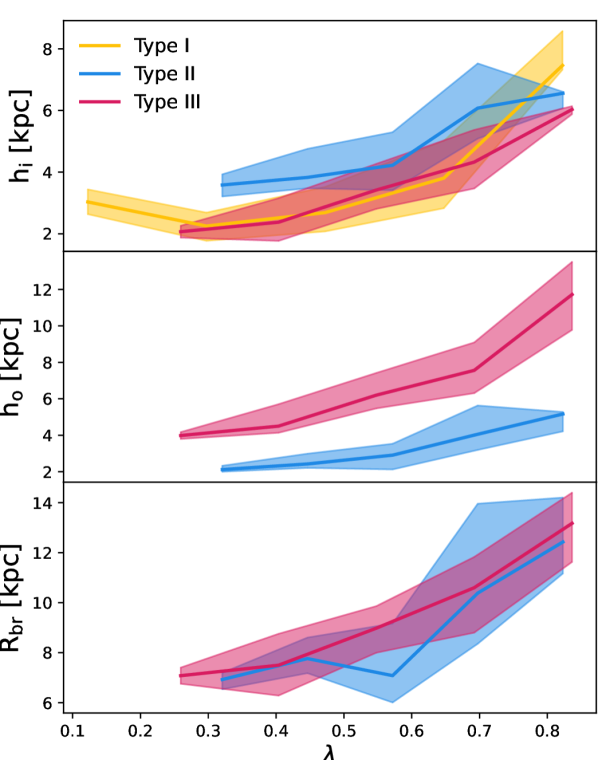
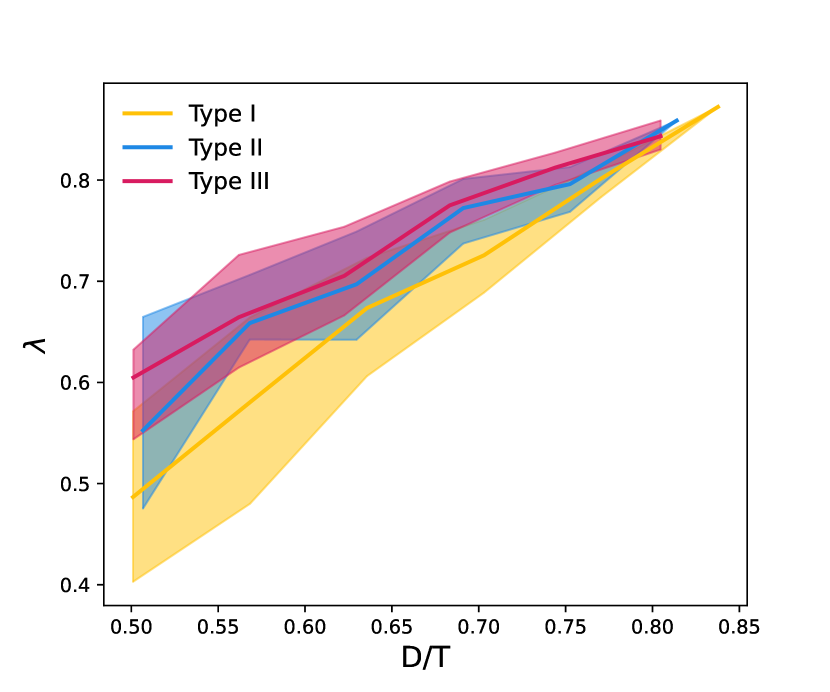
To get further insight into the relation between the degree of rotation and the disc types, in Fig. 5 we show the inner scale-lengths, the outer scale-lengths and the as a function of . We note that for TI discs only one scale-length can be defined and hence, there is no for these galaxies. Similar trends are found if is used instead of . From the upper panel of Fig. 5, it is clear that, galaxies with , increases with increasing , for all types of discs. This is the expected trend when discs form under global angular momentum conservation (Mo et al., 1998b). However, the trends change for in TI discs, where an anticorrelation is detected. We estimated that the Pearson correlation is for and for , for TI discs. Galaxies in this last range of have less significant discs than bulges and they might have been more affected by mergers and interactions (Lagos et al., 2018; Rosito et al., 2019a). From this figure, we can also see that, at a given high , increases systematically from TI, TIII and TII discs. This suggests the action of different processes during disc formation beyond global angular momentum conservation, such as redistribution of gas and/or stellar populations due to e.g. the accretion of satellites or disc perturbations like bars, spiral and lopsided modes. The tendency for to be larger in TIII than in TI is agreement with the observational results reported by Gutiérrez et al. (2011).
Regarding TII and TIII discs, we can extend the comparison to and as shown in the middle and lower panels of Fig. 5. As can be seen, the for TIII discs are systematically larger than those of TII discs at given . The of both disc types increase with increasing . However, the processes that shape the profiles in the outskirts of strong TII produce a different dependence of on . TIII and TII discs show clearly correlations between with and . We estimated Pearson correlation factors of for both relations for TIII discs and for TII discs, we obtained and , respectively.
The values are similar for TII and TIII profiles at a given , in both cases, showing a positive trend, so that more rotationally supported discs break at larger galactocentric radius.
Our results show that TII discs are preferentially found in galaxies which are strongly dominated by rotation.
3.4 Statistical analysis of and the age profiles
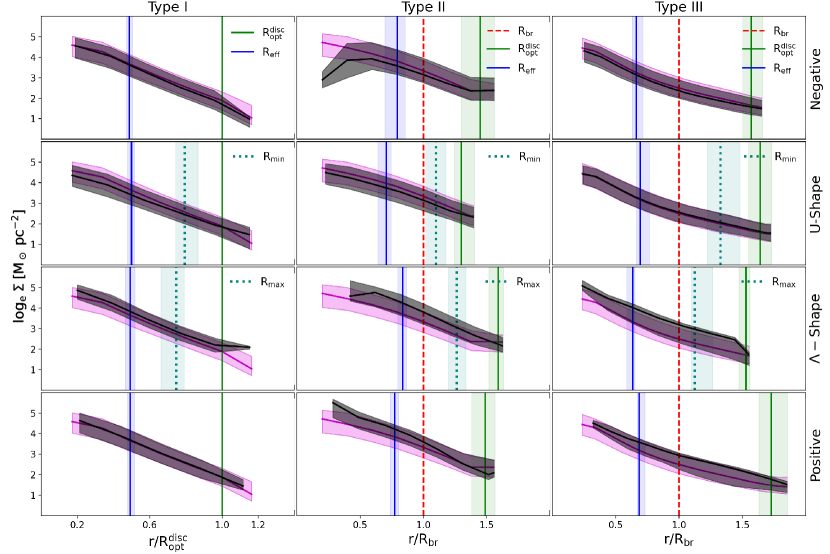
As we mentioned above, three types of and four different types of age profiles are defined and identified in the EAGLE sample. In order to further explore the connection between characteristics of the and the distribution of stellar age in the discs, in Fig. 6 we show the median for a given disc type (violet lines): TI (left column), TII (middle column) and TIII (right column). For each disc type subsample, we subdivided and stacked the profiles according to the corresponding four age profiles. The resulting median of each subpopulation is shown by a black solid line. To perform the stacking of profiles, they were first normalised by a characteristic radius. For the double-exponential , i.e. TII and TIII, the median distributions are normalized by , while for TI galaxies by . The vertical green and blue solid lines show the medians of and , respectively. is shown with a dashed red line while both and ( depending on the and age type) with cyan dashed lines, respectively. These last two radii denote the location of the minimum and maximum of the age profiles, respectively. All shaded areas shown in this figure are defined by the and percentiles of the corresponding distributions.
As can be seen from Fig. 6, TI discs show very similar for all age profiles. For the double exponential profiles (i.e. TII and TIII) the dominating age profiles are the negative and U-shape ones (black solid lines). The positive and -shape profiles show slightly higher densities than the global stacked profile. Certain trends can be also noticed in the distributions of the characteristic radii, namely , , , and (the latter two only correspond to the U-shape and -shape age profiles, respectively). For TI profiles, both and tend to be located within , whereas for TII and TIII these radii are located between and .
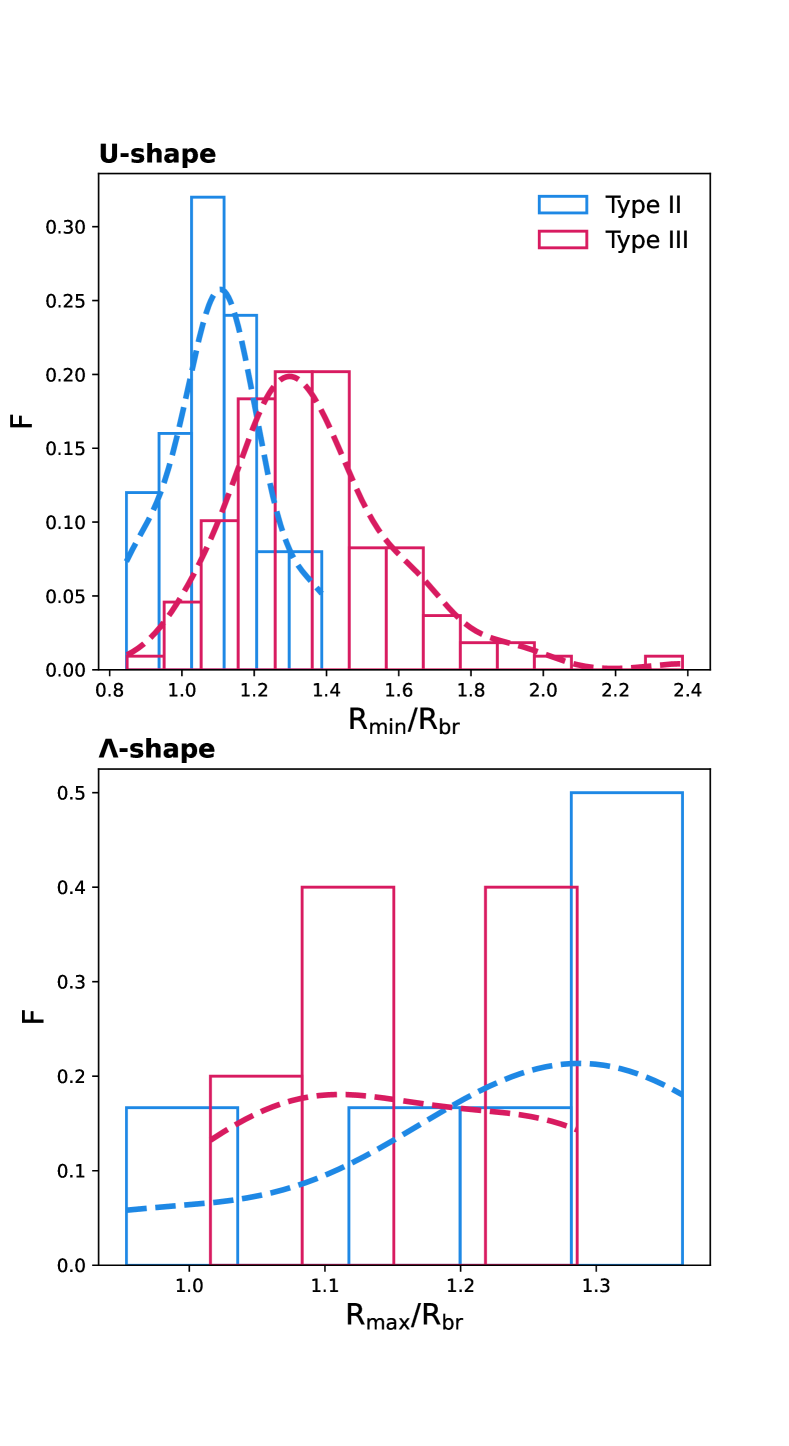
If we focus on the discs with the U-shape profiles, we note the upward bend of the age profile for TII galaxies (see is located closer to than for the TIII type, where tends to be at larger radii on average (but still within ). In order to show how different the distributions are between these scalelengths, in Fig. 10 we display distributions for TII and TIII discs. This suggests that TII discs with U-shape age profiles, where is closer to in general, experience a sharp decrease of star formation rate giving rise to an outer disc with older population. In the case of the TIII profiles the change of the star formation activity may occur further out in the discs. As a result the TIII discs could be populated by younger/intermediate age stars out to larger radii. In the following sections, we will analyse the distribution of stellar populations by age and the star formation rate density. We also acknowledge the fact that that other processes such as mergers, radial migration or environmental effects could also contribute with old stars to the outer regions of TIII, particularly.
3.5 Distribution of the mono-age stellar populations
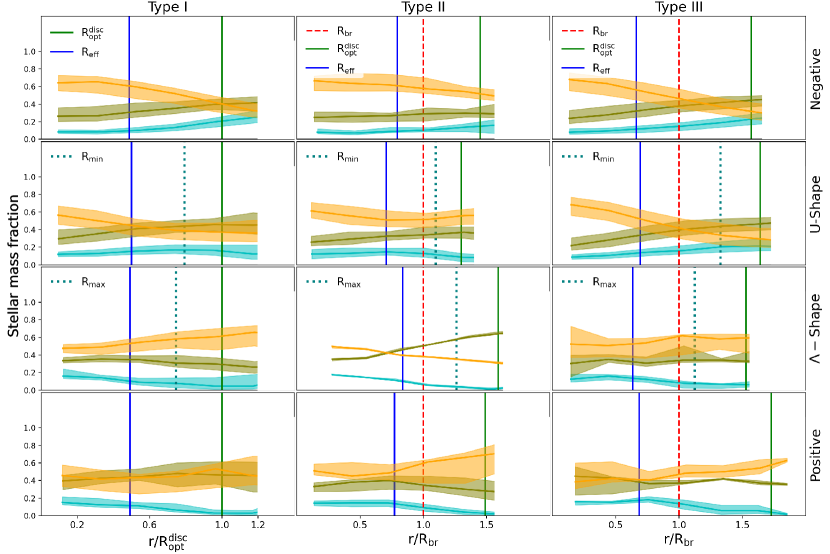
In order to understand the origin of the different profiles in relation to the characteristics of their age distributions, we compute the stellar mass fraction profiles for each galaxy by considering three different age intervals: young stars ( Gyr), intermediate age stars (2-6 Gyr) and old stars ( Gyr). They will be considered as three mono-age stellar populations. TI galaxies are normalised by , while TII and TIII galaxies are normalised by . In this way, they can be stacked according to galaxies disc types and age profiles. For each subsample, the median stellar mass fraction for mono-age stellar populations is estimated as a function of radius. The mass fraction is calculated with respect to the total stellar mass per radial interval. Figure 7 shows the stacked stellar mass fractions of discs for each of type and each age type. The corresponding characteristics radii are also included. The shaded colored regions correspond to young, intermediate and old age intervals (cyan, olive and orange regions respectively), and are enclosed by and percentiles of the stacked profiles each subsample. For these stacked profiles, , , and are the corresponding medians for each and age types. Hereafter , we will only use these medians for reference.
As can be seen from Fig. 7, TI profiles with the U-shape and negative age profiles tend to have larger mass fractions of old populations than intermediate ones in the central region. In fact, approximately 60 per cent of the stellar mass corresponds to old stars. The contribution of these mono-age populations decreases rapidly for increasing radius. Meanwhile, the fraction of young stellar populations varies slightly within , increasing systematically with increasing radius for discs with negative age profiles so that it reaches 20% by . For systems with U-shape age profiles, the fraction of young stars are similar, with a weak increase around . However, at this characteristic radius the contribution of intermediate age stars is more important than the old stars, explaining the change in slope of the age profile. For -shape and positive profiles, the relative fractions of the old and intermediate populations are dominant throughout the discs. However, they have higher concentration of young stars in the central regions. This concentration diminishes significantly at about for -shape and close to for the positive profiles.
For TII discs with U-shape and negative age profiles, the old population represents the largest mass contribution on the whole disc, representing more 60 per cent in the central regions. It is interesting to note the change of trends in the old populations from in U-shape profiles. Intermediate age stars have an increasing contribution from the inner to the outer regions in U-shape age profiles, while negative age profiles is almost constant. In particular, the mass fraction of young populations for negative profiles tend to be almost constant within . However, for systems with U-shape profiles, there is clear decrease of the contribution of young population from . The latter suggests a drop in star formation activity at large galactocentric distances. For galaxies with positive age profiles, there is an important contribution of old stars populations in the outer region (), and a decrease of young and intermediate populations. Conversely, the mass fractions of young and intermediate stellar populations increases in the central regions. However, we stress that for -shape age profiles the number of galaxies is very small to draw a robust conclusion.
For TIII discs with negative and U-shape age profiles we also find larger fractions of old populations in the inner regions. The old disc decrease rapidly for while the intermediate age populations have more contribution in this range. This might indicate the presence of an old inner disc which is more concentrated than in the TII. On the other hand, the outer discs are more dominated by intermediate age stars from in U-shape and from for negative age profiles. The young populations tend to increase in the outer region, even are similar to the contribution of old stars in the very outskirt of the discs. Similar to TII, the low number of galaxies in the -shapes and negatives profiles are not enough to draw a robust conclusion.
In summary, we find different contributions of mono-age stellar populations in the three defined disc types, which modulate their profiles. We note the physical meaning of in U-shape age profiles, which might highlight the locus of a drop in star formation activity in TII profiles (and probably the origin of the break in these types) and the dominance of the intermediate population, even over the old stellar population for in TIII galaxies. We will explore this issue in more detail in the following section.
3.6 Statistical analysis of the star formation activity
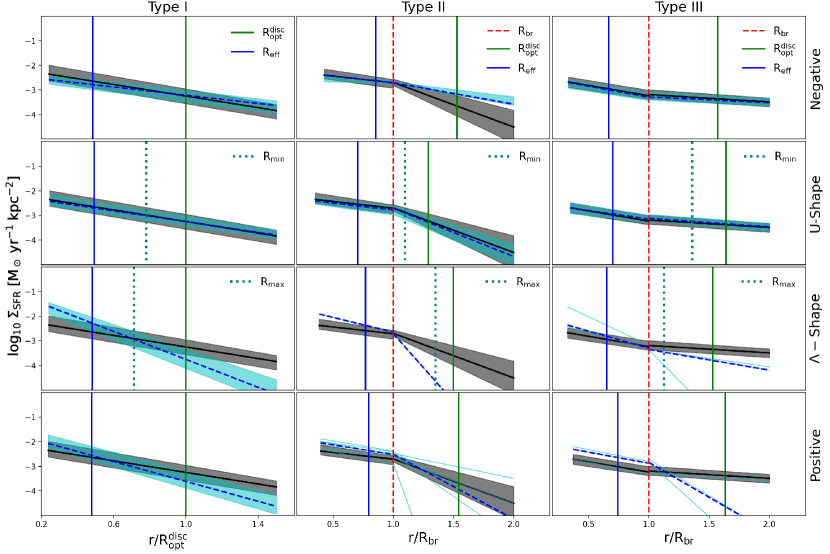
In this section, we explore the star formation rate surface density, , for galaxies with different and age profiles to provide an interpretation on the origin of the behaviours described above. To estimate the current star formation activity, the is computed considering stars particles younger than 2 Gyr. For this estimation, only galaxies with more than 500 young stars particles were considered555We acknowledge the fact that this is a relative large age interval. However, adopting a shorter one results in significant reduction of the number of galaxies. Consequently, it would affects our statistics. On the other hand, 2 Gyr is the same threshold assumed to define young stellar populations. This allow us to correlate the results of Fig. 6 and Fig. 7 more directly.. The profiles are estimated by using moving averages. The aim of this section is to analyse the changes of profiles between the inner and outer zones of the discs. For TII and TIII discs, profiles are normalized by while for TI discs, they are normalized by . Then we fitted a linear regression between and for the TI galaxies, and applied a double linear regression to the TII and TIII galaxies (see Section 2.2), within the radial range [- ] and [- ]. We then estimate the median gradients and the and percentiles for each corresponding subsample. The results of this procedure are shown in Fig. 8. The black solid lines show the overall median profile for TI (left panels), TII (middle panels) and TIII (right panels) type discs, and has been included for reference. The blue, dotted lines show the median profiles obtained by subdividing the samples according to their age profiles. The shaded regions (cyan) correspond to 25-75th percentiles of the corresponding subsample. Due to the low number of galaxies with enough young stars, TII and TII galaxies with positive and -shape age profiles are shown individually.
As can be seen from Fig. 8, the negative and U-shaped age profiles show a slightly lower in the inner regions than the overall TI profile. This is agreement with our previous results that show that the old populations dominate the inner regions while the intermediate stellar populations become more important in the outer regions as expected in a inside out formation model. Both types of age profiles are the most numerous in TI. Indeed, the general shape for TI galaxies (black region) is mainly determined by the U- and negative age profiles. We note that the profiles in TI discs with U-shape age profiles does not show a break, in agreement with Fig. 6 where we can see that the intermediate age stars seem to be responsible of the shape of age profiles. TI discs with positive or -shape age profiles show a clear change in the median slope of with respect to the overall TI profiles, indicating higher level of star formation activity in the inner regions than in the outer parts. TI galaxies with -shape show the highest SFR density in the central regions and the lower one in the outskirts.
TII discs have mainly negative and U-shape profiles. Those with negative slopes have higher profiles than average for . These SFR profiles can be well fitted by a single exponential (the change in slopes between the and is very small). TII systems with U-shape age profiles have a SFR distribution consistent with profiles, i.e. they show a clear break at about the . The higher star formation activity in the central region keeps reinforcing the break in the profiles. In TII discs there is only one -shaped age profile, indicating that the rest of the galaxies in this group have few young stellar particles. These systems have higher SFR in the inner region and a sharp decrease for . We emphasize that the change of slopes of the age profiles at is due to higher contributions of the intermediate and old stellar populations in the outer regions. Finally those discs with positive profiles have higher inner SFR and slightly lower one in the outer parts.
TIII discs show profiles with similar breaks and change of slopes for discs with negative and U-shape age profiles. The change in slope is consistent with a slight increase of the SFR in the outer regions, for , but the is further away from . This could suggest that U-shape profile might be modulated by other processes beyond the star formation activity in the galaxy. Those with positive and -shape age distributions show again higher SFR in the central regions as expected. We recall that there are fewer than 10 galaxies in these subsamples. Hence TIII tend to have negative and U-shape profiles, as mentioned in the previous section. The U-shape in age profiles can be associated to both a decrease of the SF activity with decreasing radius and the more significant contribution of intermediate age stars in the outskirts as discussed in the previous section.
In summary, the profiles vary differently for different disc types. TI discs have gradients that vary for different age profiles, being negative steeper for discs with positive gradients. TII and TIII discs have profiles that change the slopes towards steeper negatives and shallower negative values for , respectively. In the case of TIII profiles the break in the U-shape age profiles are further out, overall, in comparison with the break in the profiles, suggesting that the other mechanisms could contribute to shape them.
3.7 Statistical analysis of the median vertical height profiles
Radial migration via scattering by non-asymmetric perturbations or churning might have an impact on the outskirt of disc galaxies (Debattista et al., 2017). The contribution of stellar migration to vertical heating in the outskirts and secular evolution in disc galaxies could also lead to flaring (Minchev et al., 2012b), although mergers and interactions are also proposed to be the main cause for the effects (García de la Cruz et al., 2021; Grand et al., 2017). Disc flaring increases with radius in older stellar populations, while flaring in younger populations is reported to be weaker (Minchev et al., 2015). Thus, a thick disc component and a high velocity dispersion of the old stellar populations in the disc outskirts could indicate the action of scattering (Minchev & Famaey, 2010) or radial migration (Minchev et al., 2012a). Nevertheless the effect of radial migration on discs is still a controversial issue with many works providing different results (Roškar et al., 2013; Grand et al., 2016).
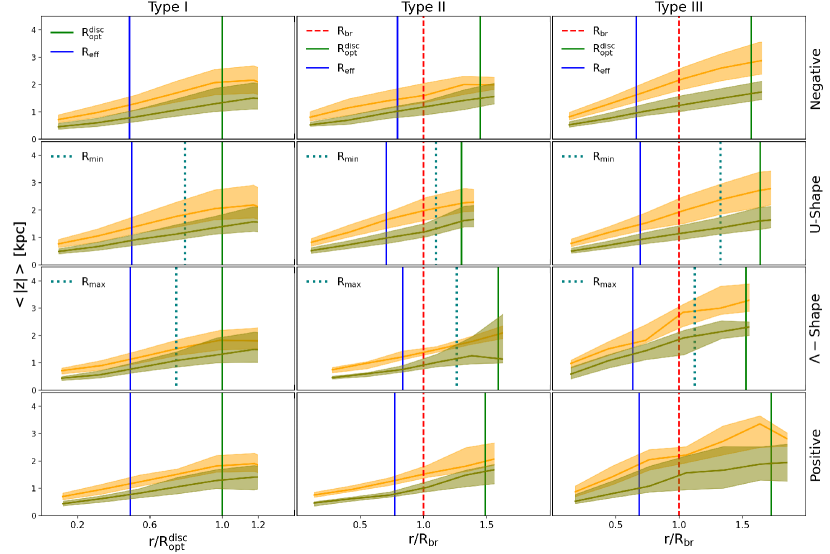
While it is beyond the scope of this paper to study in detail the impact of these mechanisms666We will not analyse in detail the displacement of stellar particles from their birth radius due to the low number of snapshots available to follow the orbits. This introduces numerical noise which does not allow a clear estimation of the fraction of migrated stars., we can assess the behaviour of the flaring in the median absolute heights, , for different types of discs. For this purpose we estimate the heights of the old ( Gyr) and intermediate (2-6 Gyr) age stellar populations with respect to the galactic mid-plane as a function of radius (normalized by in double exponential types and for TI discs) for the different disc types. Then, the distributions are stacked per and age profile types.
In Fig. 9 we show the profiles stacked for the old stars (orange regions) and intermediate stars (olive regions).
For TIII discs the old stellar populations tend to have the larger flaring with respect to other two disc types. This trend is present for disc with different age profiles. Discs with positive and -shape age profiles have larger variations due to the low number of members (i.e. less than 10 galaxies in the subsamples). TI and TII discs have similar level of flaring but TII systems show very low variety (quantified by the 25-75th percentiles). These trend suggest that TIII would be more affected by radial migration or by the accretion of satellites in the outer parts (Debattista et al., 2017).
4 Discussion and Conclusions
In this paper we explored the shape of the surface density profiles, , of disc-dominated galaxies selected from the largest-volume simulation of the eagle Project. Our sample of simulated galaxies was required to have and their disc components were classified according to their as types TI, TII and TIII. To obtain reliable results, we focused our statistical analysis on the so-called strong type, i.e., those galaxies identified to have the strongest breaks on their density distribution. We also analysed the age profiles, the SFR surface densities, the mono-age stellar distributions and variation of the vertical height and its dispersion of galaxies belonging to the three defined disc type. Our main results can be summarized as follows:
-
•
The eagle discs show the three expected distributions so that they can be classified as TI, TII and TIII discs. We find that, in this simulation and for mass-weighted , TIII and TI are the more frequent types in our EAGLE sample. We note that the simulated galaxies can be located in different kind of environment.
-
•
Overall, there is a trend between the morphology (i.e. quantified by ) and the disc types. TII discs are more frequent in late-type spirals, while TI and TIII tend to be detected in more early-type spiral systems. These trends are in agreement with observations (Pohlen & Trujillo, 2006; Gutiérrez et al., 2011). However, we note that there is a large variety of morphologies for galaxies with different disc types, which suggests the action of other physical mechanisms on the distributions of the stellar populations in the discs.
-
•
Our analysis shows a clear correlation between the inner disc scale-lengths and the stellar spin parameter, for all three disc types with . Additionally, at a given , there is a systematic increase of the inner disc scale-lengths from TI to TIII and TII, in that order. Indeed, TII discs have the larger inner disc scale-lengths in agreement with observations. Regarding the outer disc scale-lengths, both TII and TIII discs show a positive correlation with and that the outer scale-lengths of TIII are systematically larger. This suggests that the outer disc regions in the TII discs might have grown by a weak star formation activity, maybe fed by smooth accretion (Fig. 8), whereas in TIII discs other mechanisms associated with the local environment, such as galaxy interactions, could have affected the distribution of stellar populations (Younger et al., 2007; Laine et al., 2014) or stellar migration of intermediate age stars.
-
•
Four types of age profiles are identified in discs regardless of their type: negative, U-shape, positive and the so-called -shape age profiles. The U-shape is the most frequent type followed by the negative one. Together they represent percent of the strong types subsamples. The positive and -shape age profiles are found mainly in TI and TII galaxies, together accounting for 37 and 34 percent, respectively. While U-shape, negative, and positive age profiles have been reported in previous works (e.g. Debattista et al., 2017), we also identify -shape profiles in the few simulated discs. In this simulation, this age profile is produced by a significant increase of the star formation activity in the inner disc regions, together with a slight increase of the intermediate populations (2-6 Gyr old) in the outer regions. However, we note that previous studies of dispersion-dominated galaxies in the eagle simulations have also reported larger star formation activity in the central regions than expected, which might suggest the need for a more efficient AGN feedback, which could prevent late star formation activity (Rosito et al., 2019b, a; Lagos et al., 2020). This could be also true for our sample which is composed by disc-dominated galaxies.
-
•
TI discs show the distributions of mono-age stellar populations consistent with an inside-out formation scenario, and have profiles that decay systematically with increasing galactocentric distances. The U-shape profiles can be associated to larger contributions of intermediate age stellar populations. In fact, the minimum median age is statistically located at a radius from which the frequency of intermediate stars surpass those of the others mono-age stellar populations. TI discs with positive and -shape age profiles have both similar fractions of old and intermediate stars and more significant contributions of young stars in the central regions. The larger star formation activity in the central regions is accompanied by a shirking of the SFR in the outer regions. The overall median is well approximately by a single exponential law but with a shorter typical scale-length than TI with negative and U-shape age profiles. The triggering of star formation activity in the inner regions could have been produced by recent interactions with nearby galaxies that destabilized the gaseous discs, transporting material to the centre. This would feed the star formation and the bulge component. This is consistent with the fact that TI discs tend to be found in early-type spirals. These events together with radial migration could also explain the increasing flaring detected in TI discs.
-
•
TII discs tend to have mainly negative or U-shape profiles. The inner regions are dominated by old stars whose fractions decrease steadily with increasing radius. Those with negative age profiles have smaller fractions of young stars than those with U-shape ones. In the latter case, the median and are very similar, indicating that the break in the density profiles is immediately followed by a the change of slope in age distributions. This change is produced by a lower contribution of young stars as a results of the sharper truncation of the star formation activity. The few TII discs found to have positive/-shape age profiles have larger star formation activity in the central region, which is strongly truncated in the outskirts. Additionally, they have larger contributions of young stars in the inner discs as expected. TII discs also show flaring in the heights but with the smallest dispersion.
-
•
The up-bending of TIII discs coincides with a sharp decrease in the fraction of old stars that dominate within . For intermediate and young stars contribute more significantly than old ones. In case of U-shape and negative age profiles the fractions of young stars are almost constant as a function of radius. Additionally, the for is higher than expected from a simple extrapolation of the inner . The of the U-shape age profiles are located further out in the discs in comparison with those of TII discs. We also note that the fact that there are very few positive age profiles in TIII discs suggests that these discs could be more stable to perturbations that drive gas inflows to the inner regions and trigger central star formation activity, reinforcing the speculation that accreted material from interactions or minor mergers in the outer regions could be a crucial mechanisms to shape the profiles (see also Fig.7 where the contribution from different mono-age stellar populations are displayed).
We identified discs with the three expected types in the eagle simulations, which can be associated with different relative contributions of mono-age stellar populations, SFR activity across the discs and angular momentum content of the galaxies. In a future work, we will focus on the role of environment, mergers and interactions.
Acknowledgements
We thank the referee for useful comments which contribute to improve this paper. SVL acknowledges financial support from the ULS through the "Beca Doctoral". FAG and SVL acknowledges financial support from CONICYT through the project FONDECYT Regular Nr. 1211370. FAG acknowledge funding from the Max Planck Society through a Partner Group grant. PBT acknowledges partial support from Fondecyt 1200703/2020 (ANID) and ANID BASAL projects ACE210002 and FB210003. This project was partially supported by the European Union Horizon 2020 Research and Innovation Programme under the Marie Sklodowska-Curie grant agreement No 734374 and the ANID BASAL project FB210003. LAB acknowledges support from CONICYT FONDECYT/POSTDOCTORADO/3180359. CDPL has received funding from the ARC Centre of Excellence for All Sky Astrophysics in 3 Dimensions (ASTRO 3D), through project number CE170100013. This work used the DiRAC Data Centric system at Durham University, operated by the Institute for Computational Cosmology on behalf of the STFC DiRAC HPC Facility (www.dirac.ac.uk). This equipment was funded by BIS National E-infrastructure capital grant ST/K00042X/1, STFC capital grants ST/H008519/1 and ST/K00087X/1, STFC DiRAC Operations grant ST/K003267/1 and Durham University. DiRAC is part of the National E-Infrastructure. We acknowledge PRACE for awarding us access to the Curie machine based in France at TGCC, CEA, Bruyeres-le-Chatel.
Data availability
The EAGLE simulations are publicly available; see McAlpine et al. (2016)
References
- Bahé et al. (2016) Bahé Y. M., et al., 2016, MNRAS, 456, 1115
- Bakos et al. (2008) Bakos J., Trujillo I., Pohlen M., 2008, ApJ, 683, L103
- Barnes & Hernquist (1996) Barnes J. E., Hernquist L., 1996, ApJ, 471, 115
- Crain et al. (2015) Crain R. A., et al., 2015, MNRAS, 450, 1937
- Crain et al. (2017) Crain R. A., et al., 2017, MNRAS, 464, 4204
- Debattista et al. (2006) Debattista V. P., Mayer L., Carollo C. M., Moore B., Wadsley J., Quinn T., 2006, ApJ, 645, 209
- Debattista et al. (2017) Debattista V. P., Roškar R., Loebman S. R., 2017, The Impact of Stellar Migration on Disk Outskirts. p. 77, doi:10.1007/978-3-319-56570-5_3
- Elmegreen & Hunter (2006) Elmegreen B. G., Hunter D. A., 2006, ApJ, 636, 712
- Erwin et al. (2008) Erwin P., Pohlen M., Beckman J. E., 2008, AJ, 135, 20
- Fall & Efstathiou (1980) Fall S. M., Efstathiou G., 1980, MNRAS, 193, 189
- Freeman (1970) Freeman K. C., 1970, ApJ, 160, 811
- Furlong et al. (2015) Furlong M., et al., 2015, MNRAS, 450, 4486
- García de la Cruz et al. (2021) García de la Cruz J., Martig M., Minchev I., James P., 2021, MNRAS, 501, 5105
- Gómez et al. (2016) Gómez F. A., White S. D. M., Marinacci F., Slater C. T., Grand R. J. J., Springel V., Pakmor R., 2016, MNRAS, 456, 2779
- Gómez et al. (2017) Gómez F. A., White S. D. M., Grand R. J. J., Marinacci F., Springel V., Pakmor R., 2017, MNRAS, 465, 3446
- Gómez et al. (2021) Gómez F. A., et al., 2021, ApJ, 908, 27
- Grand et al. (2016) Grand R. J. J., Springel V., Gómez F. A., Marinacci F., Pakmor R., Campbell D. J. R., Jenkins A., 2016, MNRAS, 459, 199
- Grand et al. (2017) Grand R. J. J., et al., 2017, MNRAS, 467, 179
- Gutiérrez et al. (2011) Gutiérrez L., Erwin P., Aladro R., Beckman J. E., 2011, AJ, 142, 145
- Herpich et al. (2015) Herpich J., et al., 2015, MNRAS, 448, L99
- Herpich et al. (2017) Herpich J., Stinson G. S., Rix H. W., Martig M., Dutton A. A., 2017, MNRAS, 470, 4941
- Lagos et al. (2015) Lagos C. d. P., et al., 2015, MNRAS, 452, 3815
- Lagos et al. (2017) Lagos C. d. P., Theuns T., Stevens A. R. H., Cortese L., Padilla N. D., Davis T. A., Contreras S., Croton D., 2017, MNRAS, 464, 3850
- Lagos et al. (2018) Lagos C. d. P., Schaye J., Bahé Y., Van de Sande J., Kay S. T., Barnes D., Davis T. A., Dalla Vecchia C., 2018, MNRAS, 476, 4327
- Lagos et al. (2020) Lagos C. d. P., Emsellem E., van de Sande J., Harborne K. E., Cortese L., Davison T., Foster C., Wright R. J., 2020, arXiv e-prints, p. arXiv:2012.08060
- Laine et al. (2014) Laine J., et al., 2014, MNRAS, 441, 1992
- Martínez-Serrano et al. (2009) Martínez-Serrano F. J., Serna A., Doménech-Moral M., Domínguez-Tenreiro R., 2009, ApJ, 705, L133
- McAlpine et al. (2016) McAlpine S., et al., 2016, Astronomy and Computing, 15, 72
- Minchev & Famaey (2010) Minchev I., Famaey B., 2010, ApJ, 722, 112
- Minchev et al. (2012a) Minchev I., Famaey B., Quillen A. C., Di Matteo P., Combes F., Vlajić M., Erwin P., Bland-Hawthorn J., 2012a, A&A, 548, A126
- Minchev et al. (2012b) Minchev I., Famaey B., Quillen A. C., Dehnen W., Martig M., Siebert A., 2012b, A&A, 548, A127
- Minchev et al. (2015) Minchev I., Martig M., Streich D., Scannapieco C., de Jong R. S., Steinmetz M., 2015, ApJ, 804, L9
- Mo et al. (1998a) Mo H. J., Mao S., White S. D. M., 1998a, MNRAS, 295, 319
- Mo et al. (1998b) Mo H. J., Mao S., White S. D. M., 1998b, MNRAS, 295, 319
- Muñoz-Mateos et al. (2013) Muñoz-Mateos J. C., et al., 2013, ApJ, 771, 59
- Patterson (1940) Patterson F. S., 1940, Harvard College Observatory Bulletin, 914, 9
- Pedrosa & Tissera (2015) Pedrosa S. E., Tissera P. B., 2015, A&A, 584, A43
- Planck Collaboration et al. (2014) Planck Collaboration et al., 2014, A&A, 571, A16
- Pohlen & Trujillo (2006) Pohlen M., Trujillo I., 2006, A&A, 454, 759
- Roediger et al. (2012) Roediger J. C., Courteau S., Sánchez-Blázquez P., McDonald M., 2012, The Astrophysical Journal, 758, 41
- Rosito et al. (2019a) Rosito M. S., Tissera P. B., Pedrosa S. E., Lagos C. D. P., 2019a, A&A, 629, L3
- Rosito et al. (2019b) Rosito M. S., Tissera P. B., Pedrosa S. E., Rosas-Guevara Y., 2019b, A&A, 629, A37
- Roškar et al. (2008a) Roškar R., Debattista V. P., Stinson G. S., Quinn T. R., Kaufmann T., Wadsley J., 2008a, ApJ, 675, L65
- Roškar et al. (2008b) Roškar R., Debattista V. P., Quinn T. R., Stinson G. S., Wadsley J., 2008b, ApJ, 684, L79
- Roškar et al. (2013) Roškar R., Debattista V. P., Loebman S. R., 2013, MNRAS, 433, 976
- Ruiz-Lara et al. (2016) Ruiz-Lara T., et al., 2016, MNRAS, 456, L35
- Ruiz-Lara et al. (2017a) Ruiz-Lara T., et al., 2017a, A&A, 604, A4
- Ruiz-Lara et al. (2017b) Ruiz-Lara T., Few C. G., Florido E., Gibson B. K., Pérez I., Sánchez-Blázquez P., 2017b, A&A, 608, A126
- Sáiz et al. (2001) Sáiz A., Domínguez-Tenreiro R., Tissera P. B., Courteau S., 2001, MNRAS, 325, 119
- Sánchez-Blázquez et al. (2009) Sánchez-Blázquez P., Courty S., Gibson B. K., Brook C. B., 2009, MNRAS, 398, 591
- Schaye et al. (2015) Schaye J., et al., 2015, MNRAS, 446, 521
- Solar et al. (2020) Solar M., Tissera P. B., Hernandez-Jimenez J. A., 2020, MNRAS, 491, 4894
- Tawfeek et al. (2021) Tawfeek A. A., et al., 2021, New Astron., 87, 101603
- Teklu et al. (2015) Teklu A. F., Remus R.-S., Dolag K., Beck A. M., Burkert A., Schmidt A. S., Schulze F., Steinborn L. K., 2015, ApJ, 812, 29
- Tissera et al. (2012) Tissera P. B., White S. D. M., Scannapieco C., 2012, MNRAS, 420, 255
- Tissera et al. (2019) Tissera P. B., Rosas-Guevara Y., Bower R. G., Crain R. A., del P Lagos C., Schaller M., Schaye J., Theuns T., 2019, MNRAS, 482, 2208
- Tissera et al. (2022) Tissera P. B., Rosas-Guevara Y., Sillero E., Pedrosa S. E., Theuns T., Bignone L., 2022, MNRAS, 511, 1667
- Trayford & Schaye (2019) Trayford J. W., Schaye J., 2019, MNRAS, 485, 5715
- Walcher et al. (2014) Walcher C. J., et al., 2014, A&A, 569, A1
- Wang et al. (2018) Wang J., et al., 2018, MNRAS, 479, 4292
- Yoachim et al. (2012) Yoachim P., Roškar R., Debattista V. P., 2012, ApJ, 752, 97
- Younger et al. (2007) Younger J. D., Cox T. J., Seth A. C., Hernquist L., 2007, ApJ, 670, 269
- van der Kruit (1979) van der Kruit P. C., 1979, A&AS, 38, 15
Appendix A Distributions of , and
In order to better quantify the relative position of and of the age profiles with respect to of the profiles, whose median values have been included in Fig. 6, 7 and 8, we estimated the ratios /and /for TII and TIII discs.
In Fig. 10 we show the probability density function (PDF) by using the Kernel Density Estimation. As can be seen from the top panel, galaxies with U-shape age profiles have different values and distributions of /. TII discs show this ratio with a maximum frequency at / and the distribution are more concentrated around this value. Conversely, TIII discs have a more extended distribution, which cover a larger values of /, indicating that in these discs the minima in the age profiles are located further out in the discs with respect to . This justifies the conclusion that the upward bend of the U-shape age profile for TII galaxies is located closer to than for TIII as shown in Fig. 6, 7 and 8 where the median values are displayed.
The larger variety of /detected for TIII discs, most of them larger than 1, suggest that the physical mechanisms behind the change in age might not be directly related with the star formation process and hence, could be more associated to environmental effects or migration.
Similar estimations were performed for /. As can be seen from the right panel of Fig. 10, the distributions are very noisy because of the low number of galaxies with this particular age profile. There is a weak trend for TII to have slightly larger values. However considering the low number of members of this subsample, we prefer to be caution and not draw a conclusion as discussed in the main text.
Appendix B Relation between and D/T
We have adopted to main parameters to quantify the angular momentum of the galaxies: the disc-to-total stellar mass ratio and the spin parameter . The first one is estimated by using the full 3D distribution following Tissera et al. (2012) as described in Section 2.1.
The spin parameter is taken from Lagos et al. (2018) and correspond to the r-band luminosity-weighted estimations along the line-of-sight towards galaxies oriented edge-on. These provides a quantification of the angular momentum more comparable to observations.
Both parameters are used to show that the correlations between disc types and morphologies have physical meaning and the observed-motivated parameters show results comparable to observations. In Fig. 11 we show the relations between the these parameters for the three types of discs. As can be seen they trace each other very well with Pearson correlation factors of 0.65, 0.611, 0.67 for TI, TII and TIII discs, respectively. We note, however, that the dispersion increases for decreasing D/T, i.e. as the bulge component becomes more important to equal the disc. In this range of D/T there is more variation of which could be due to projection effects.