CoFeVSb: A Promising Candidate for Spin Valve and Thermoelectric Applications
Abstract
We report a combined theoretical and experimental study of a novel quaternary Heusler system CoFeVSb from the view point of room temperature spintronics and thermoelectric applications. It crystallizes in cubic structure with small DO3-type disorder. The presence of disorder is confirmed by room temperature synchrotron X-ray diffraction(XRD) and extended X-ray absorption fine structure (EXAFS) measurements. Magnetization data reveal high ordering temperature with a saturation magnetization of 2.2 /f.u. Resistivity measurements reflect half-metallic nature. Double hysteresis loop along with asymmetry in the magnetoresistance(MR) data reveals room temperature spin-valve feature, which remains stable even at 300 K. Hall measurements show anomalous behavior with significant contribution from intrinsic Berry phase. This compound also large room temperature power factor ( mWatt/m/K2) and ultra low lattice thermal conductivity ( W/m/K), making it a promising candidate for thermoelectric application. Ab-initio calculations suggest weak half-metallic behavior and reduced magnetization (in agreement with experiment) in presence of DO3 disorder. We have also found an energetically competing ferromagnetic (FM)/antiferromagnetic (AFM) interface structure within an otherwise FM matrix: one of the prerequisites for spin valve behavior. Coexistence of so many promising features in a single system is rare, and hence CoFeVSb gives a fertile platform to explore numerous applications in future.
Introduction: Heusler alloys have drawn enormous attention in several fields due to their interesting properties. Most of them are versatile and quite promising because of their robust structure, high Curie temperature (), and high spin polarization; hence highly suited for spin-transport applications. Half metallic ferromagnets (HMFs),de Groot et al. (1983); Pickett and Moodera (2001) which are one of the earliest classes of spin-polarized materials, have led a revolution in the field of spintronics. HMFs possess a unique electronic structure exhibiting a finite band gap in one spin channel and metallic behavior in the other. There has been a large number of materials in the Heusler family,Bombor et al. (2013); Graf et al. (2011a); Rani et al. (2017); Moodera and Mootoo (1994) which are reported to be HMF and are predicted to show 100% spin-polarization because of the complete absence of minority spin states at the Fermi level (). Such materials are in great demand for applications such as magnetic tunnel junctionsTezuka et al. (2006); Sakuraba et al. (2010) spin injectors, spin valves Kasahara et al. (2014); Furubayashi et al. (2013) etc. A spin valve is a device, consisting of two or more conducting magnetic layers, where electrical resistance can change between two values depending on the relative alignment of the magnetization in the layers. The resistive state of such a composite system can be switched by changing the direction of the applied magnetic field, resulting in asymmetric magnetoresistance (MR). The spin valve concept is often used in devices such as magnetic sensing, recording etc. This feature is generally observed in multilayer ferromagnetic thin films Dieny et al. (1991) and is extremely rare in bulk materials.Singh et al. (2012) Another important research area where Heusler alloys, specially Half Heuslers, are found promising is the thermoelectric(TE) application.Sakurada and Shutoh (2005); Yan et al. (2011)
In this article, we report a combined theoretical and experimental study on promising spin-valve and TE properties of a quaternary Heusler alloy, CoFeVSb (CFVS). Though there exists a theoretical study on ordered CFVSXiong et al. (2014) predicting its half metallic behavior, no experimental/theoretical investigation reporting its potential for spin valve and TE applications is reported so far. Using combined synchrotron XRD and EXAFS measurements, we confirm CFVS to crystallize in LiMgPdSn structure with robust partial DO3 disorder. Our ab-initio calculations confirm half-metallic nature of CFVS in its ordered phase, as reported earlier. The disordered DO3 structure, however, makes it a weak half metal, as also supported by our magnetotransport measurement. The measured saturation magnetization is found to be 2.2 /f.u. along with a high , in fair agreement with theory. Magnetization and MR data strongly indicate room temperature (RT) spin valve feature in this alloy. A careful analysis of Hall data indicates the dominance of intrinsic Berry phase contribution to the anomalous Hall effect (AHE). CFVS also shows enormous promise for TE applications, with a high thermopower ( mWatt/m/K2) and ultra low simulated lattice thermal conductivity ( W/m/K) at RT. High , robust structure, half metallicity, promising spin-valve and thermoelectric properties make CFVS a potential candidate for multifunctional applications.
Experimental and Computational Details: Experimental details including synthesis procedure, normal and synchrotron XRD, EXAFS, magnetization and transport measurements are given in supplementary material (SM).sup (2021) Computational details are also provided in SM.sup (2021)
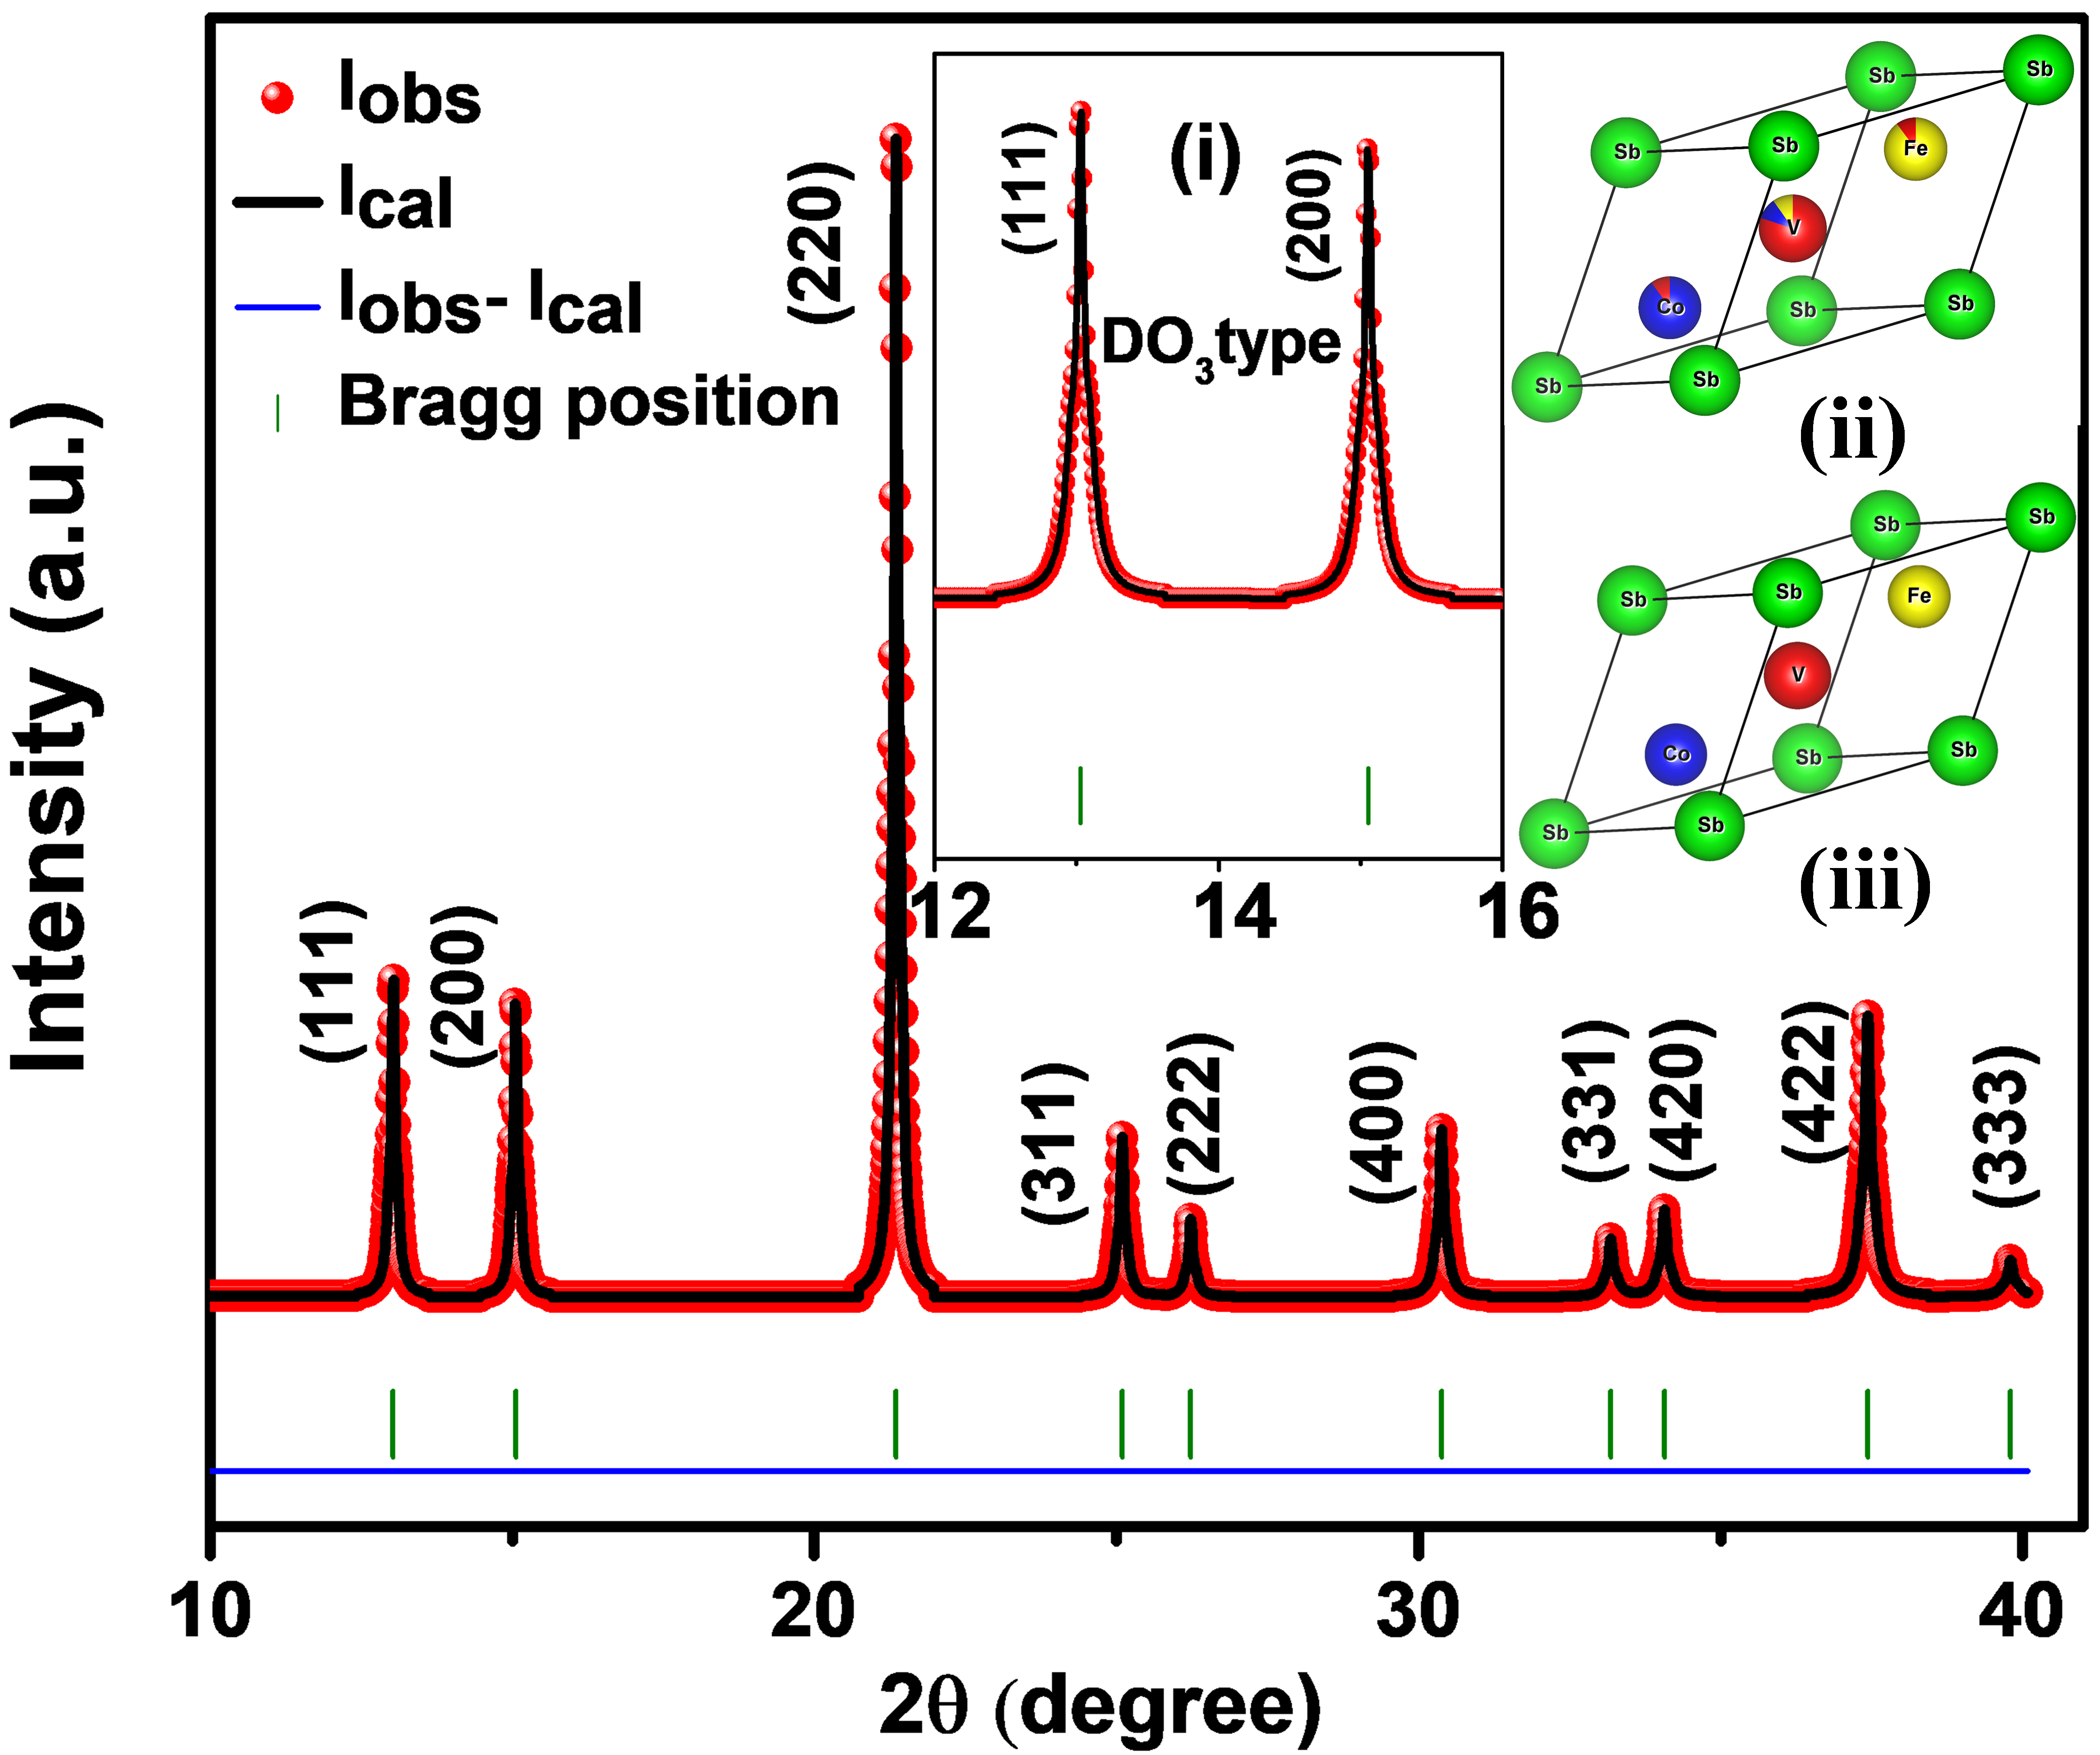
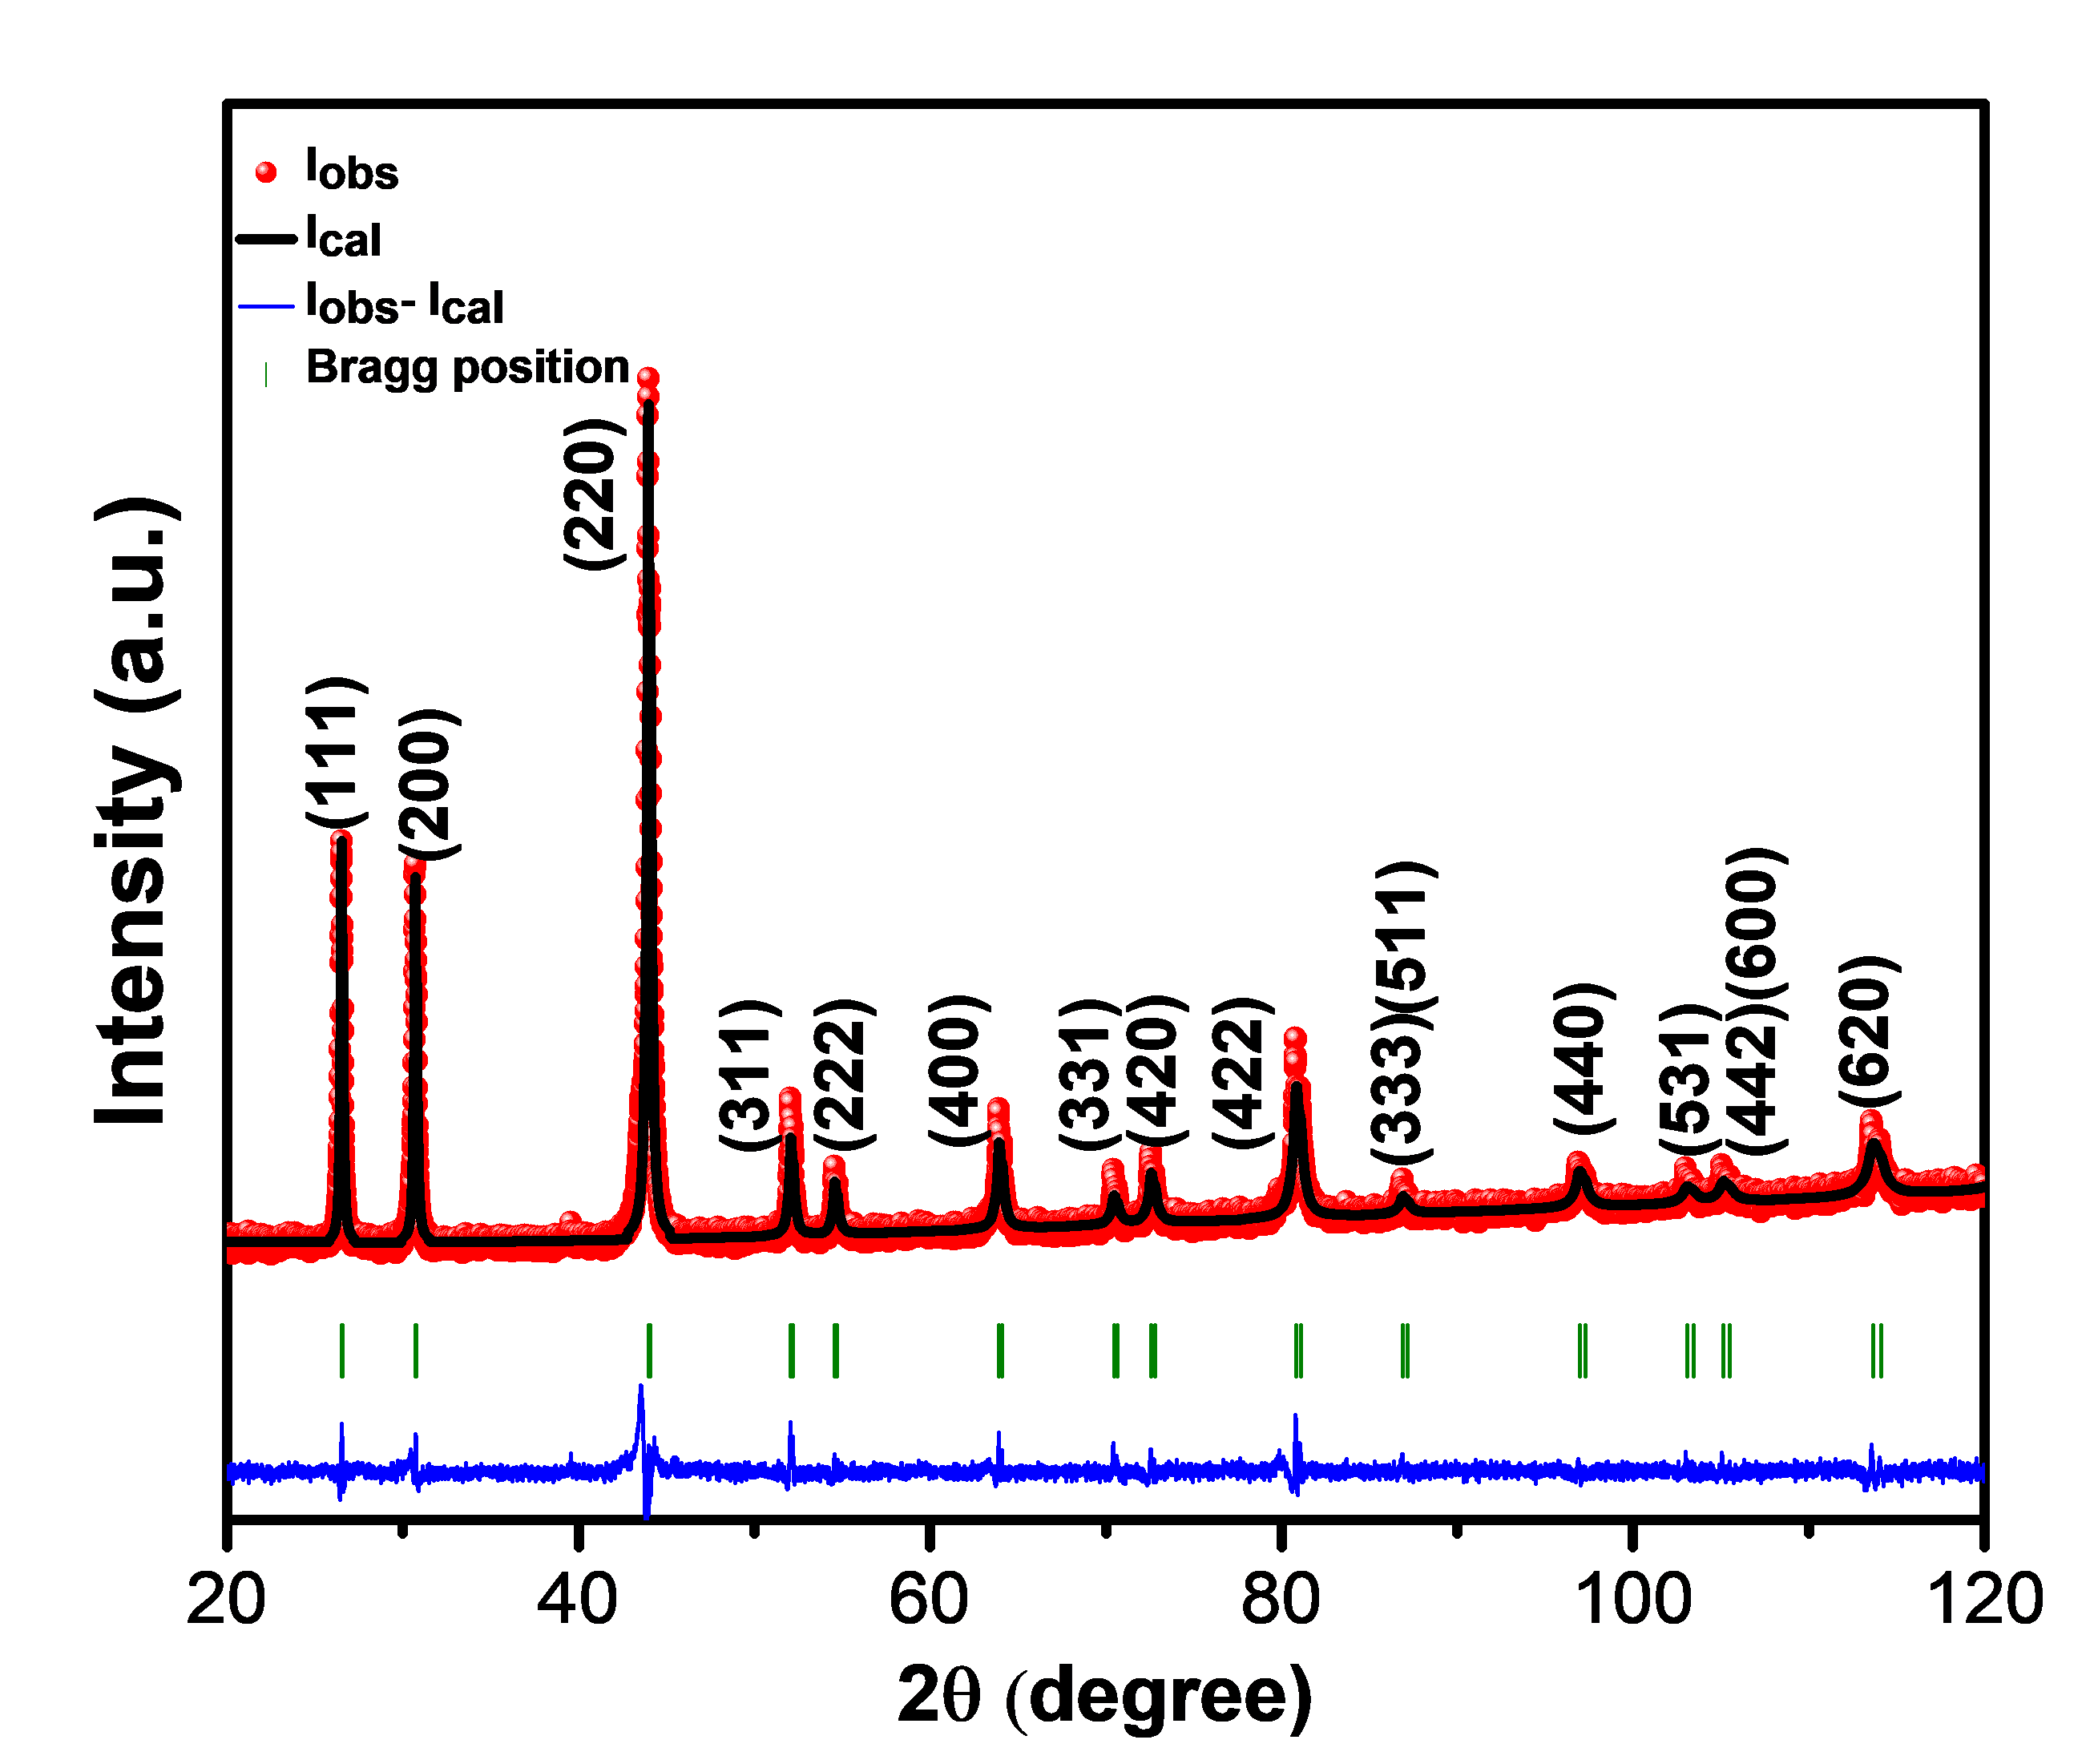
Crystal Structure (X-ray diffraction): CFVS crystallizes in the LiMgPdSn prototype structure (space group ) with lattice parameter 5.82 Å. There exist three non-degenerate crystal configurations for any equi-atomic quaternary Heusler structure.Nag et al. (2021) These are discussed in theoretical results section, which confirm Type-I to be the energetically most stable configuration. Figure S9 shows Rietveld refined ( = 0.5) synchrotron XRD (SXRD) pattern (using ) at RT, where Type-I configuration with 12.5% disorder between Co-V (X-Y) and 12.5% disorder between Fe-V (X′ -Y) atoms is considered for fitting. This combination gives the best fitting compared to all other ordered and disordered ones we tried. Normal XRD data show a similar trend for Rietveld refinement, see SM.sup (2021) Inset (i) of Fig. S9 shows a zoomed in view of the the refined SXRD data near (111) and (200) peaks. As these superlattice reflections are very prominent, possibility of A2 or B2-type disorder is ruled out. There may be some possibility of DO3 disorder because of a slight reduction of (200) peak intensity in comparison to (111) peak. This is also predicted by our EXAFS data, described below. In general, for XXYZ alloy, intermixing of X/X′ with Y or X/X′ with Z sites yields DO3 type disorder. In the present case, we have considered only the swap disorder involving X/X′ and Y (Co/Fe with V) since EXAFS measurements have not found any contribution from swapping of Sb with Co/Fe.
Crystal Structure (EXAFS): Figure 2 shows the XANES spectra of CFVS at Co, Fe and V K-edges along with those of the respective metal foils. These K-edges coincide with the edges of their respective metal foils, indicating the absence of oxide phases. The oscillations in the spectra immediately above the absorption edge are completely different as compared to their respective foils for Co and V K-edges. The weighted vs. spectra are shown in the insets of Fig. 2(d,e,f).
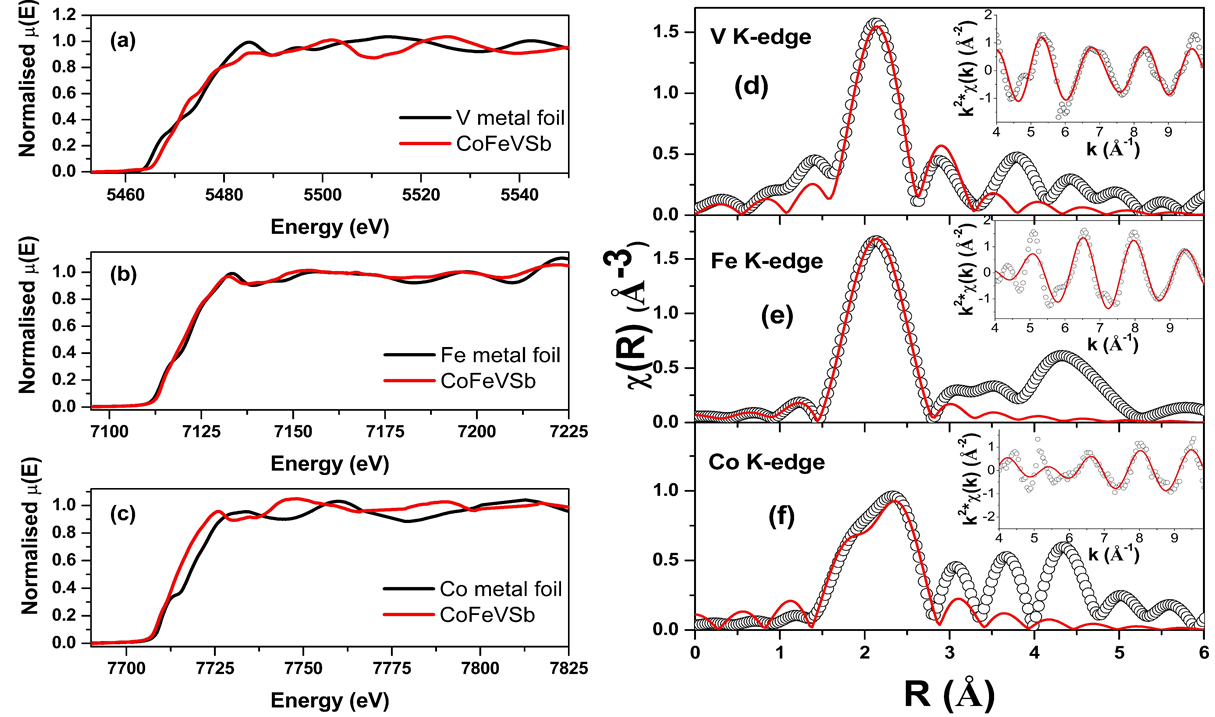
The vs. spectra (generated from the Fourier transform of ) are shown in Fig. 2(d,e,f) measured at Co, Fe and V K-edges. Figure 2(d-f) shows the best fit vs. spectra, along with the experimental data. The anti-site disorder paths have been generated by swapping the absorption atom site. The bond distances, disorder (Debye-Waller) factor ( ) which gives the mean square fluctuations in the distances, and the fraction of anti-site disorder () are used as the fitting parameters (given in Table S1 of SMsup (2021)). The first coordination peak is used for fitting because of the relatively low data range . From the fitting, it appears that there is no contribution of anti-site disorder due to the swapping of Sb with Co and Fe, rather it arises due to the swapping of V with Fe/Co. Thus, EXAFS measurements confirm the possibility of anti-site disorder between Co-V and Fe-V sites, giving rise to the DO3 disorder, which is also supported by XRD data.
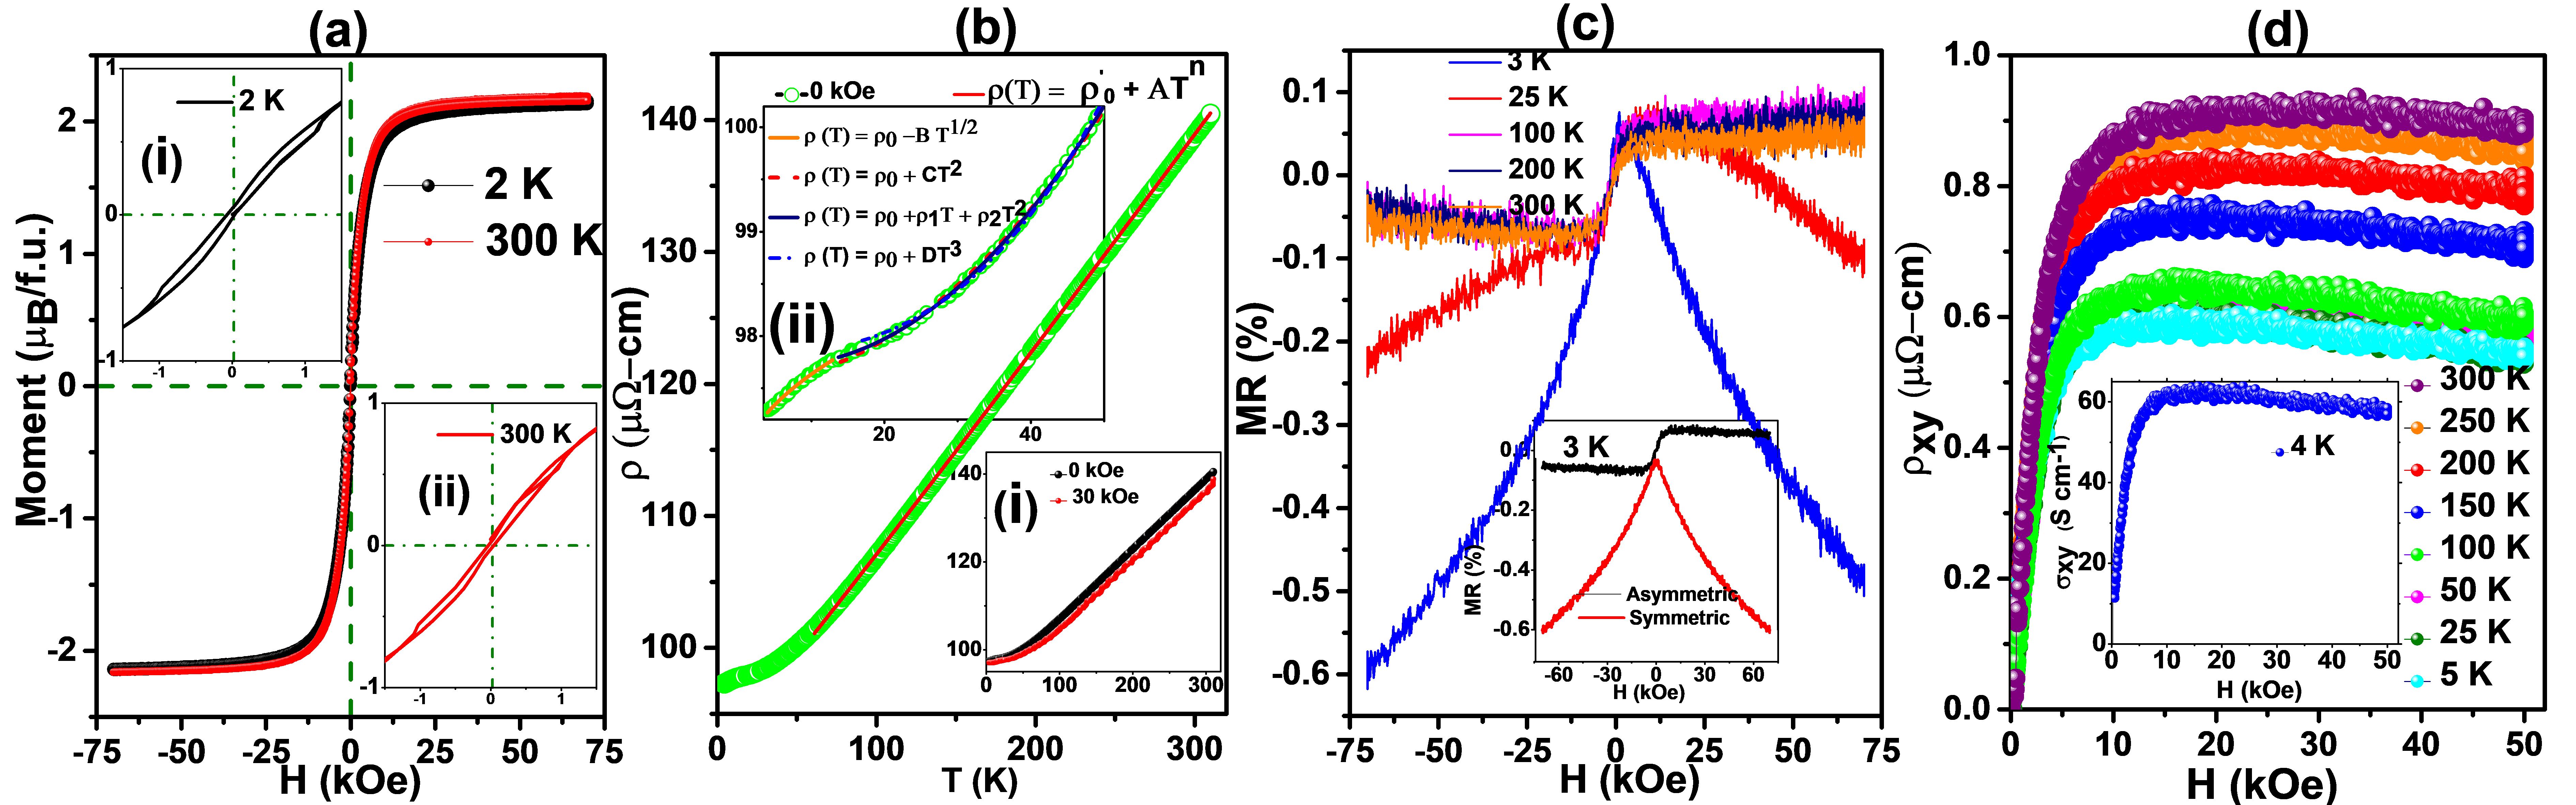
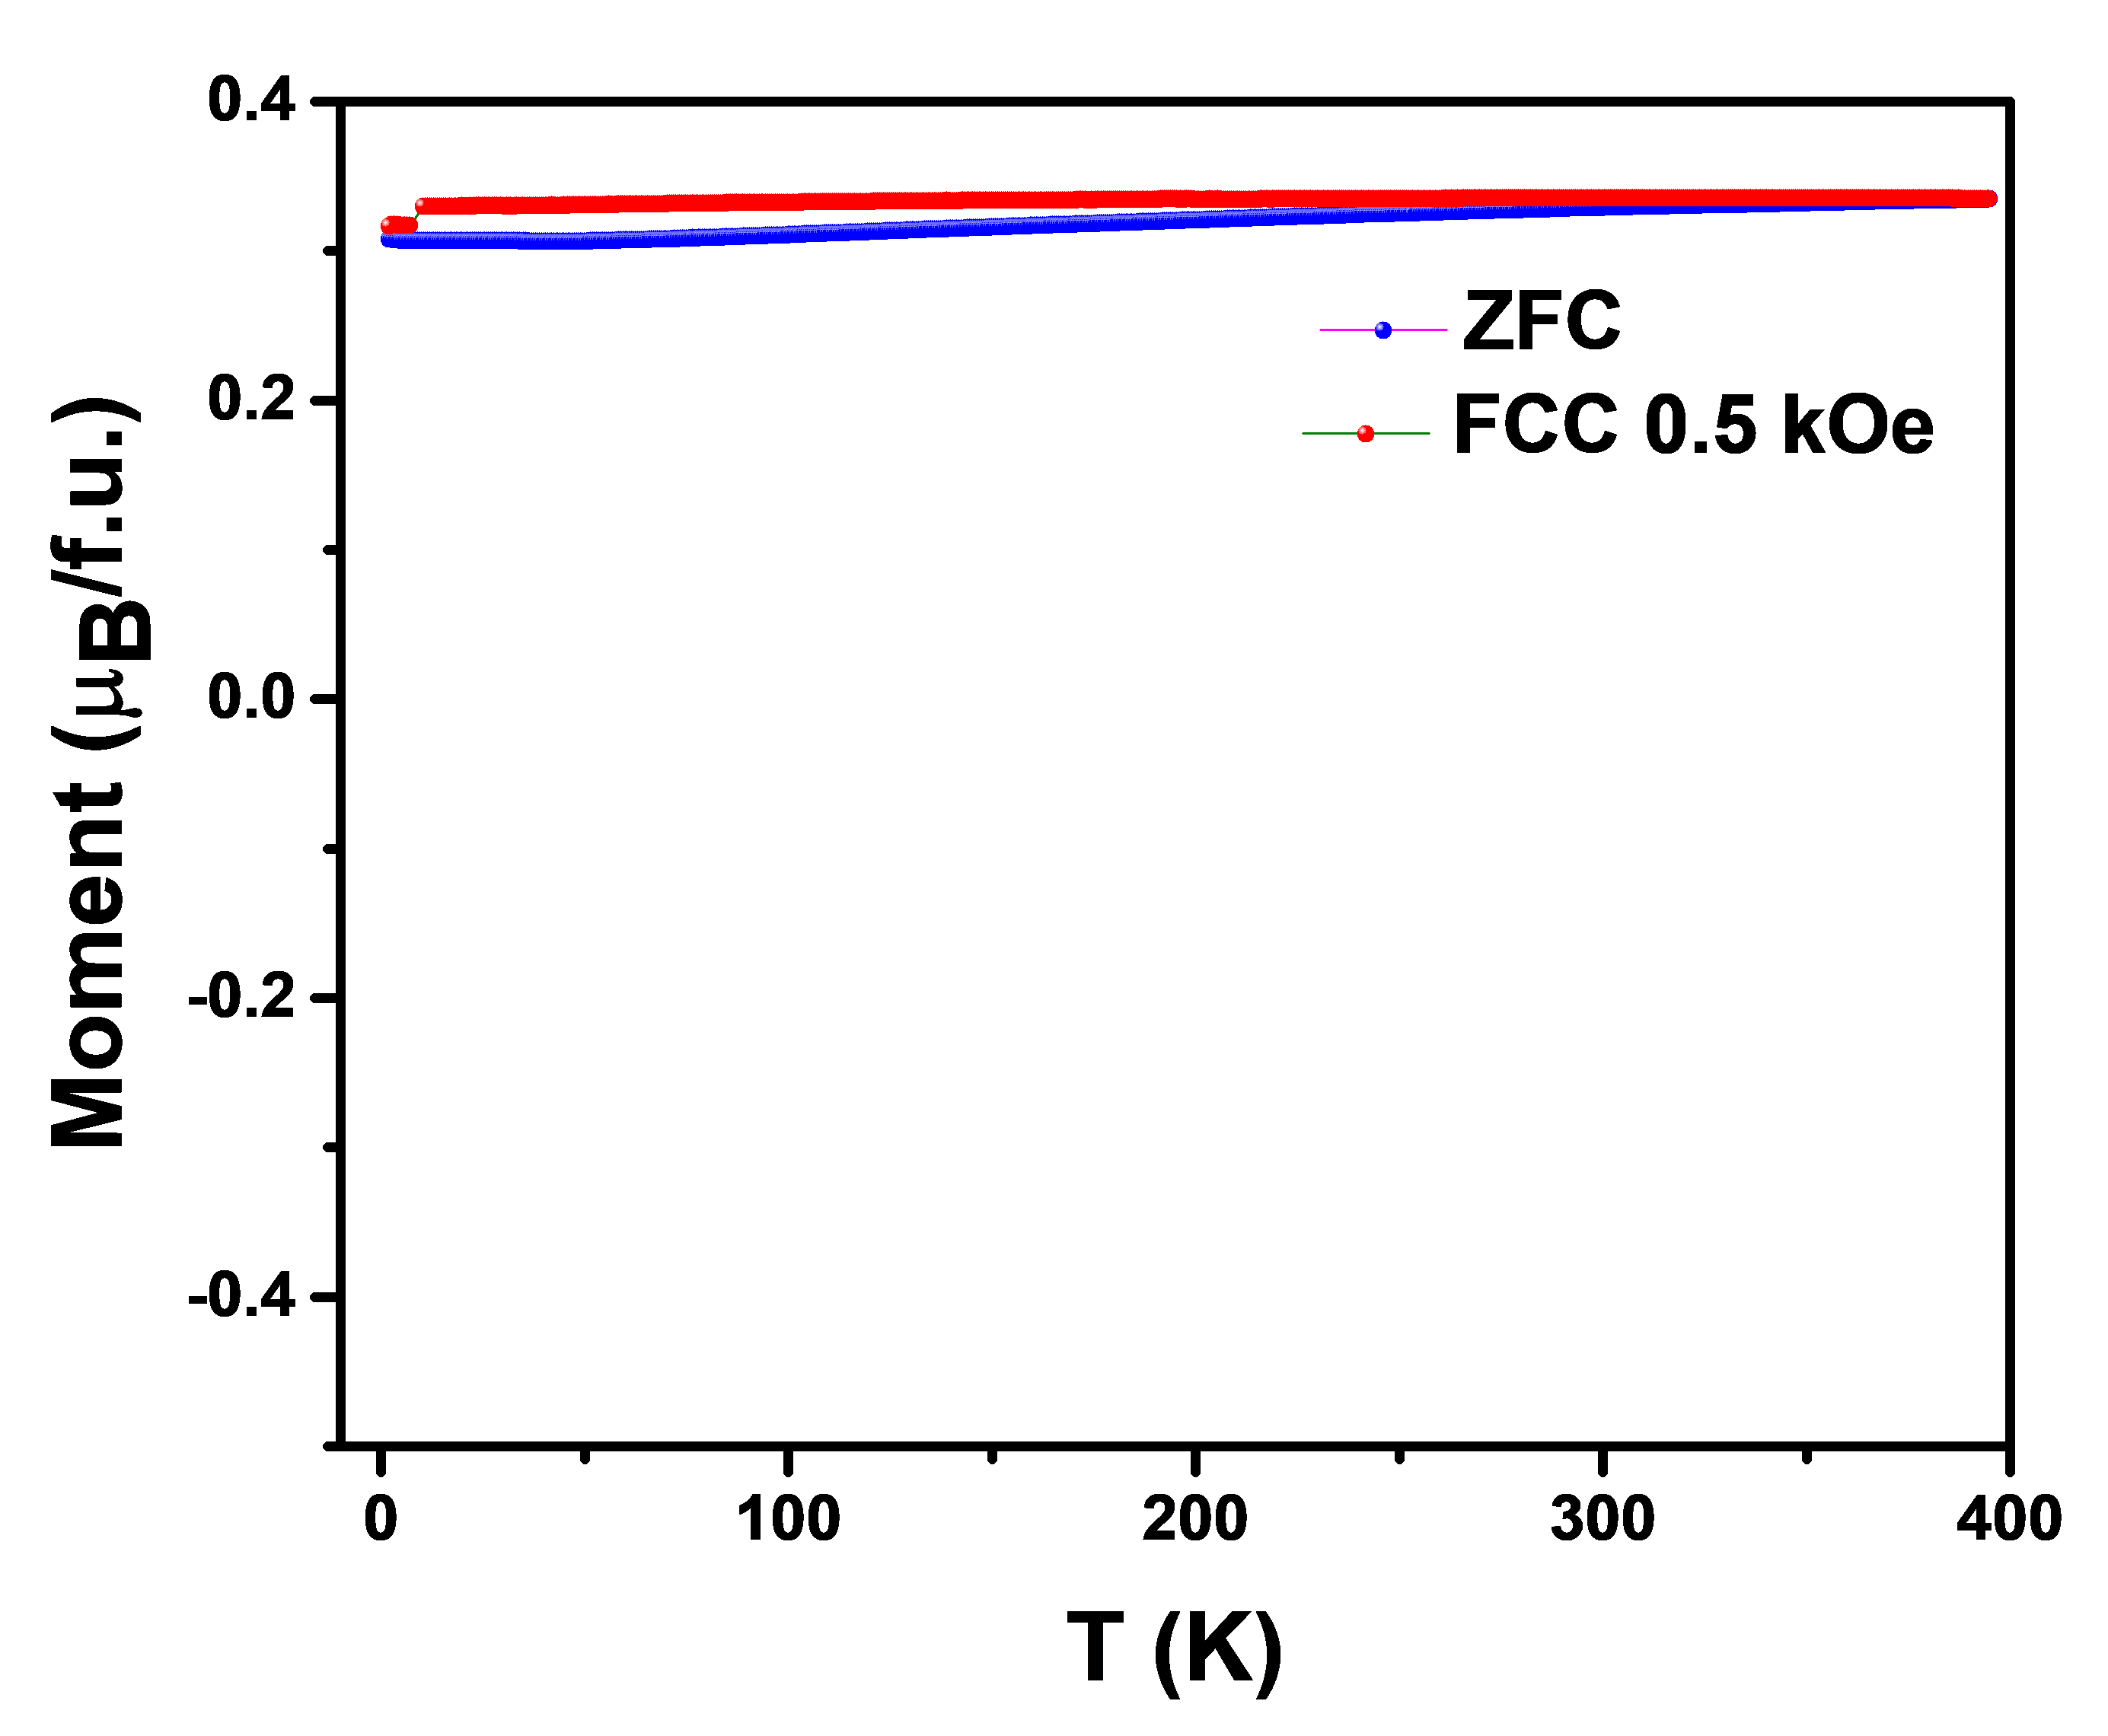
Magnetic Properties: Figure 3(a) shows M vs. H curves for CFVS. Insets (i and ii) show a zoomed in view at 2 K and 300 K. The M vs. T curve is shown in Fig. S5 of SMsup (2021) which indicates high for this alloy. M-H curves show plateau-like magnetization with a small but non-zero hysteresis and 70 Oe coercivity (at 3 K), indicating CFVS to be a soft ferromagnet. The low field part of the M-H curve shown in the insets clearly indicate the presence of a double hysteresis loop, a property usually signifying the spin valve effect.Yoneda et al. (2015) The plateau-like feature in the M-H curves seen here is nearly identical to that seen in some superlattice structures involving magnetic oxides. Such a behavior is attributed to the coexistence of spin-glass and the ferromagnetic background in compounds with magnetic anisotropy.Pang et al. (2017). One can also notice a step-like feature at about 1 kOe, indicating the presence of an additional, low magnetization phase. One should also note that total magnetic moment at 300 K is slightly higher than 2K, that again indicates the possibility of small ferri/AFM regimes. The total moment () per formula unit for a Heusler alloy can be calculated in terms of the number of valence electrons (),(Graf et al., 2011b) using Slater-Pauling (SP) rule: Özdoğan et al. (2013); Zheng and Jin (2012) As such, for CFVS, a moment of 3.0 /f.u. is expected in its completely ordered state. The measured moment turns out to be 2.2 /f.u. This difference is attributed partially to the anti-site (DO3) disorder Vidal et al. (2011) or the presence of competing magnetic ordering. This is also supported by significant contrast in our magnetic force microscopy (MFM) data highlighting boundaries between domains of two competing magnetic phases even at RT (see Fig. S2 and experimental details in SMsup (2021)). All these coexisting features, such as double hysteresis loop, reduced magnetization, metamagnetic-like step in the M-H loop, contrasting regions of competing magnetic phases in MFM data strongly indicates the existence of some disordered phase involving FM/AFM clusters within a FM matrix. Such features are observed rarely in a bulk material and are responsible for the spin-valve effect.
Transport properties (Resistivity): Figure 3(b) shows the temperature dependence of longitudinal resistivity () at different fields (0 and 30 kOe) (see inset (i)). increases and varies almost linearly with T towards 300 K. To get a better understanding of the variation of resistivity with T, we analyzed the data in three different T ranges: I (3 T13 K), II (14 T60 K) and III (60T310 K). The details of the fitting considering different models are given in SM.sup (2021) From the fitting, it appears that T2 dependence is very weak and linear behavior dominates throughout the T-range (specially high T). Such a dependence implies the dominance of electron-phonon scattering. This, in turn, hints towards the redundant spin-flip scattering, arising out of single-magnon scattering, suggesting the HMF behavior of CFVS.Bombor et al. (2013)
Transport properties (Magnetoresistance): Figure 3(c) shows the field dependence of MR, defined as MR(H)=, at various T. Magnitude of MR is low, increases with H in a sub-linear fashion and does not saturate till 70 kOe at 3 K. Interestingly, it shows an asymmetric feature between positive and negative fields. Inset of Fig. 3(c) shows the asymmetric and symmetric components of MR at 3 K.111The asymmetric component is calculated as MR(H)= while the symmetric component as MR(H)=. The symmetric part is -ve and shows a linear variation with H. As T is raised to 25 K, in addition to the asymmetry, one can notice a clear hump as H changes from negative to positive. At 25 K, a sharp plateau like feature is observed at lower H, which gets suppressed at higher H giving rise to the asymmetric nature. MR exhibits a crossover behavior (-ve to +ve) starting from 50 K, which continues till 300 K. These features of MR clearly reflect the spin-valve like behavior,Singh et al. (2012) which remains intact in the T-range of 50-300 K and even under a field of 70 kOe.Agarwal et al. (2018) One should note that the double hysteresis loop also points towards the spin valve like feature in this alloy. The emergence of competing magnetic phases necessary for the spin-valve effect is discussed in the theoretical results section.
Transport properties (Hall Measurements): Figure 3(d) shows the Hall resistivity vs. H, at different T. The H-dependance of Hall conductivity ( ) is shown in the inset. The residual is found to be 64.4 S-cm-1 at 4 K, which is much smaller compared to that of half-metallic systems.Bombor et al. (2013) mainly consists of two contributions, (i) ordinary Hall effect (OHE) and (ii) anomalous Hall effect. The later arises due to the magnetic contribution as a result of the asymmetric scattering of conducting electrons.
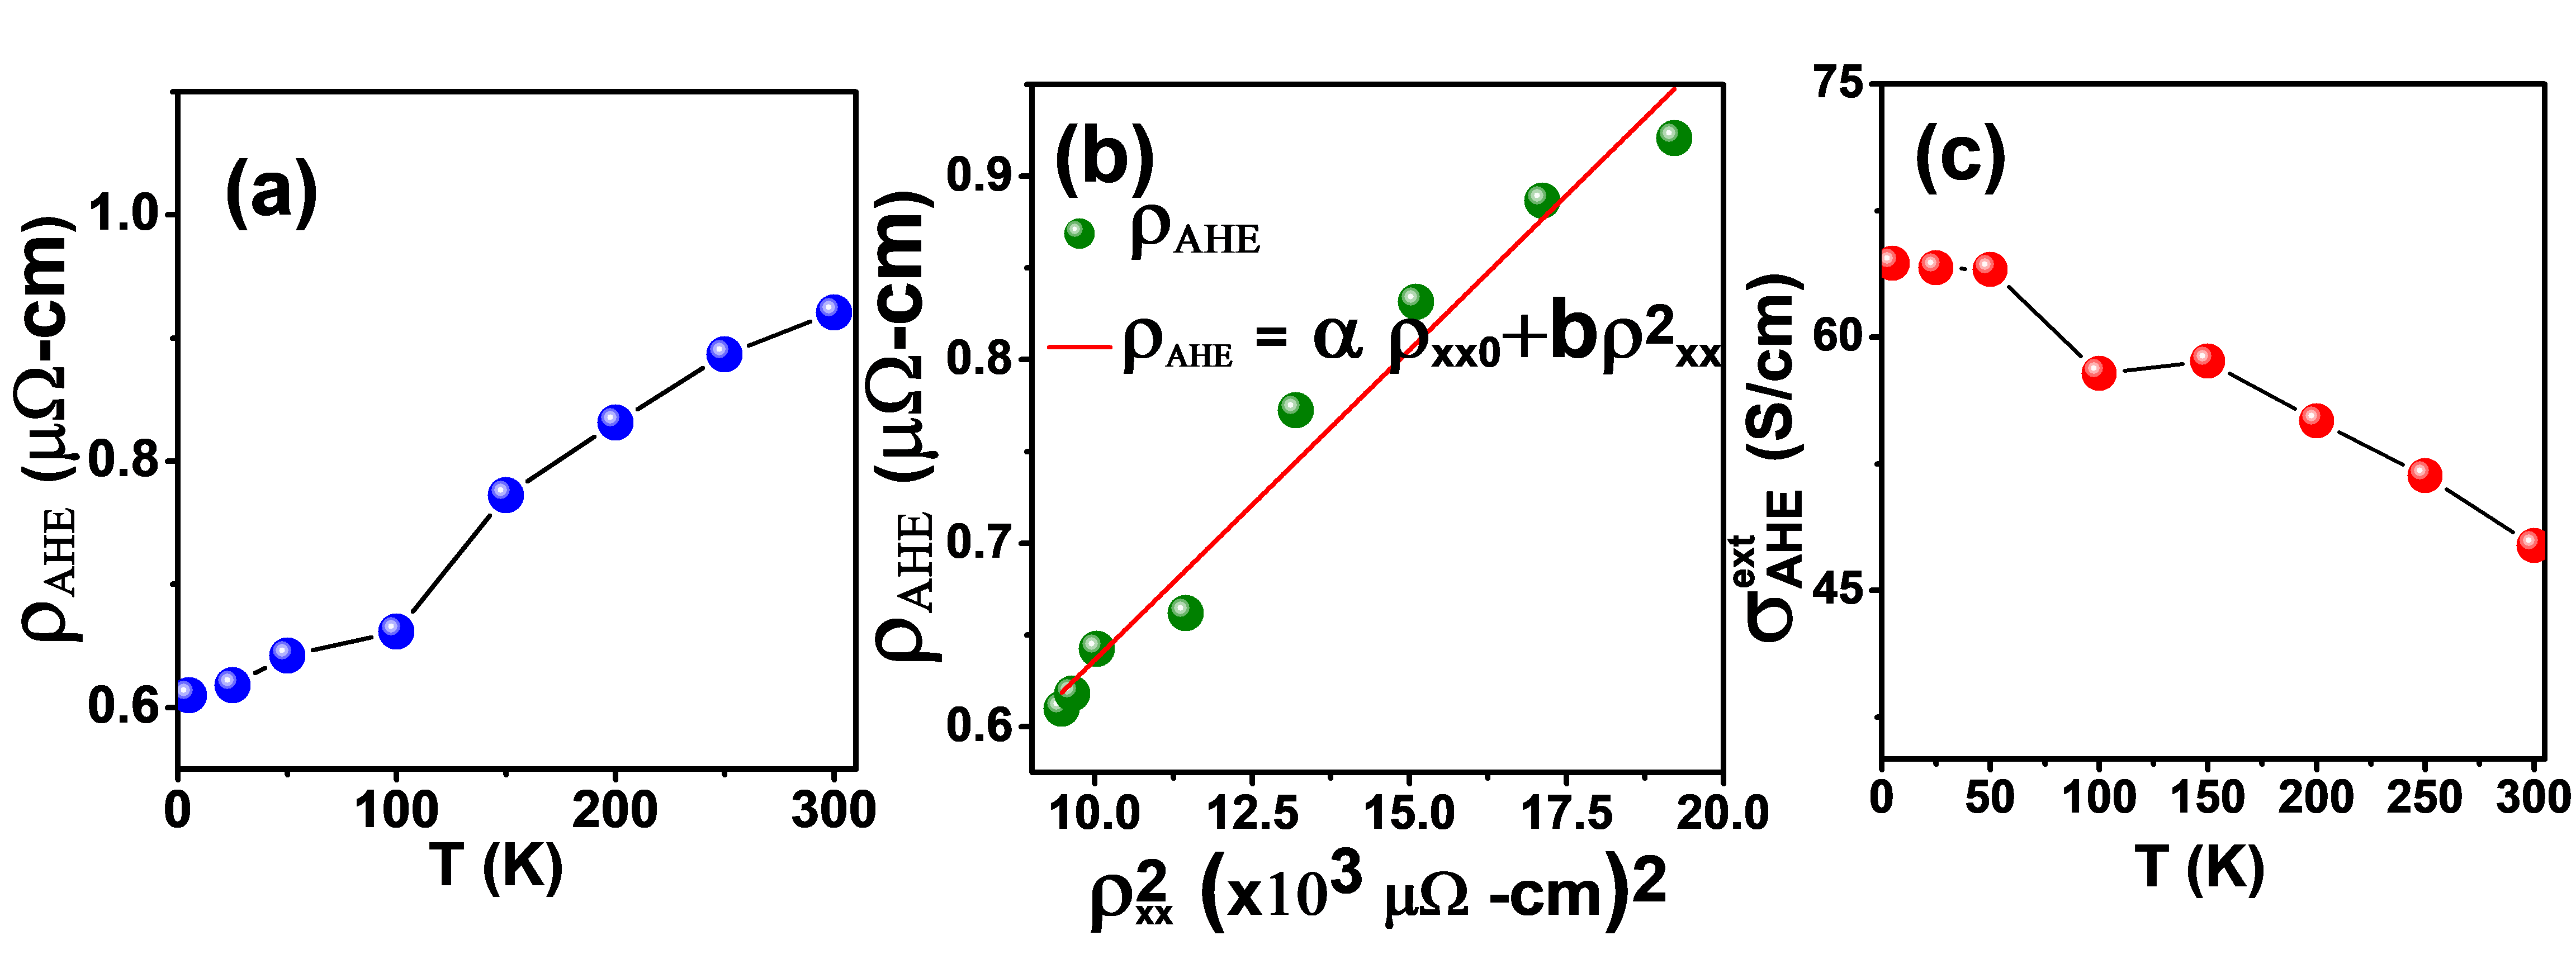
In general, Hall resistivity can be expressed as,Nagaosa et al. (2010) , where , , and are anomalous Hall resistivity, ordinary Hall coefficient, anomalous Hall coefficient and magnetization respectively. In low H-range, AHE dominates while OHE is dominant at relatively higher H. AHE contributions to can be obtained by extrapolating the high field data to zero field. Further details of AHE analysis are given in SM.sup (2021) The negative slope of ordinary Hall coefficient suggests electrons to be majority charge carriers, an inference that matches with the TE results, shown below. From the fitting of Hall data and detailed AHE analysis (see SMsup (2021)) we obtain a non-zero Karplus-Luttinger term confirming a finite contribution of intrinsic mechanism. This, in turn, indicates the dominance of intrinsic Berry phase contribution to AHE.Tian et al. (2009)
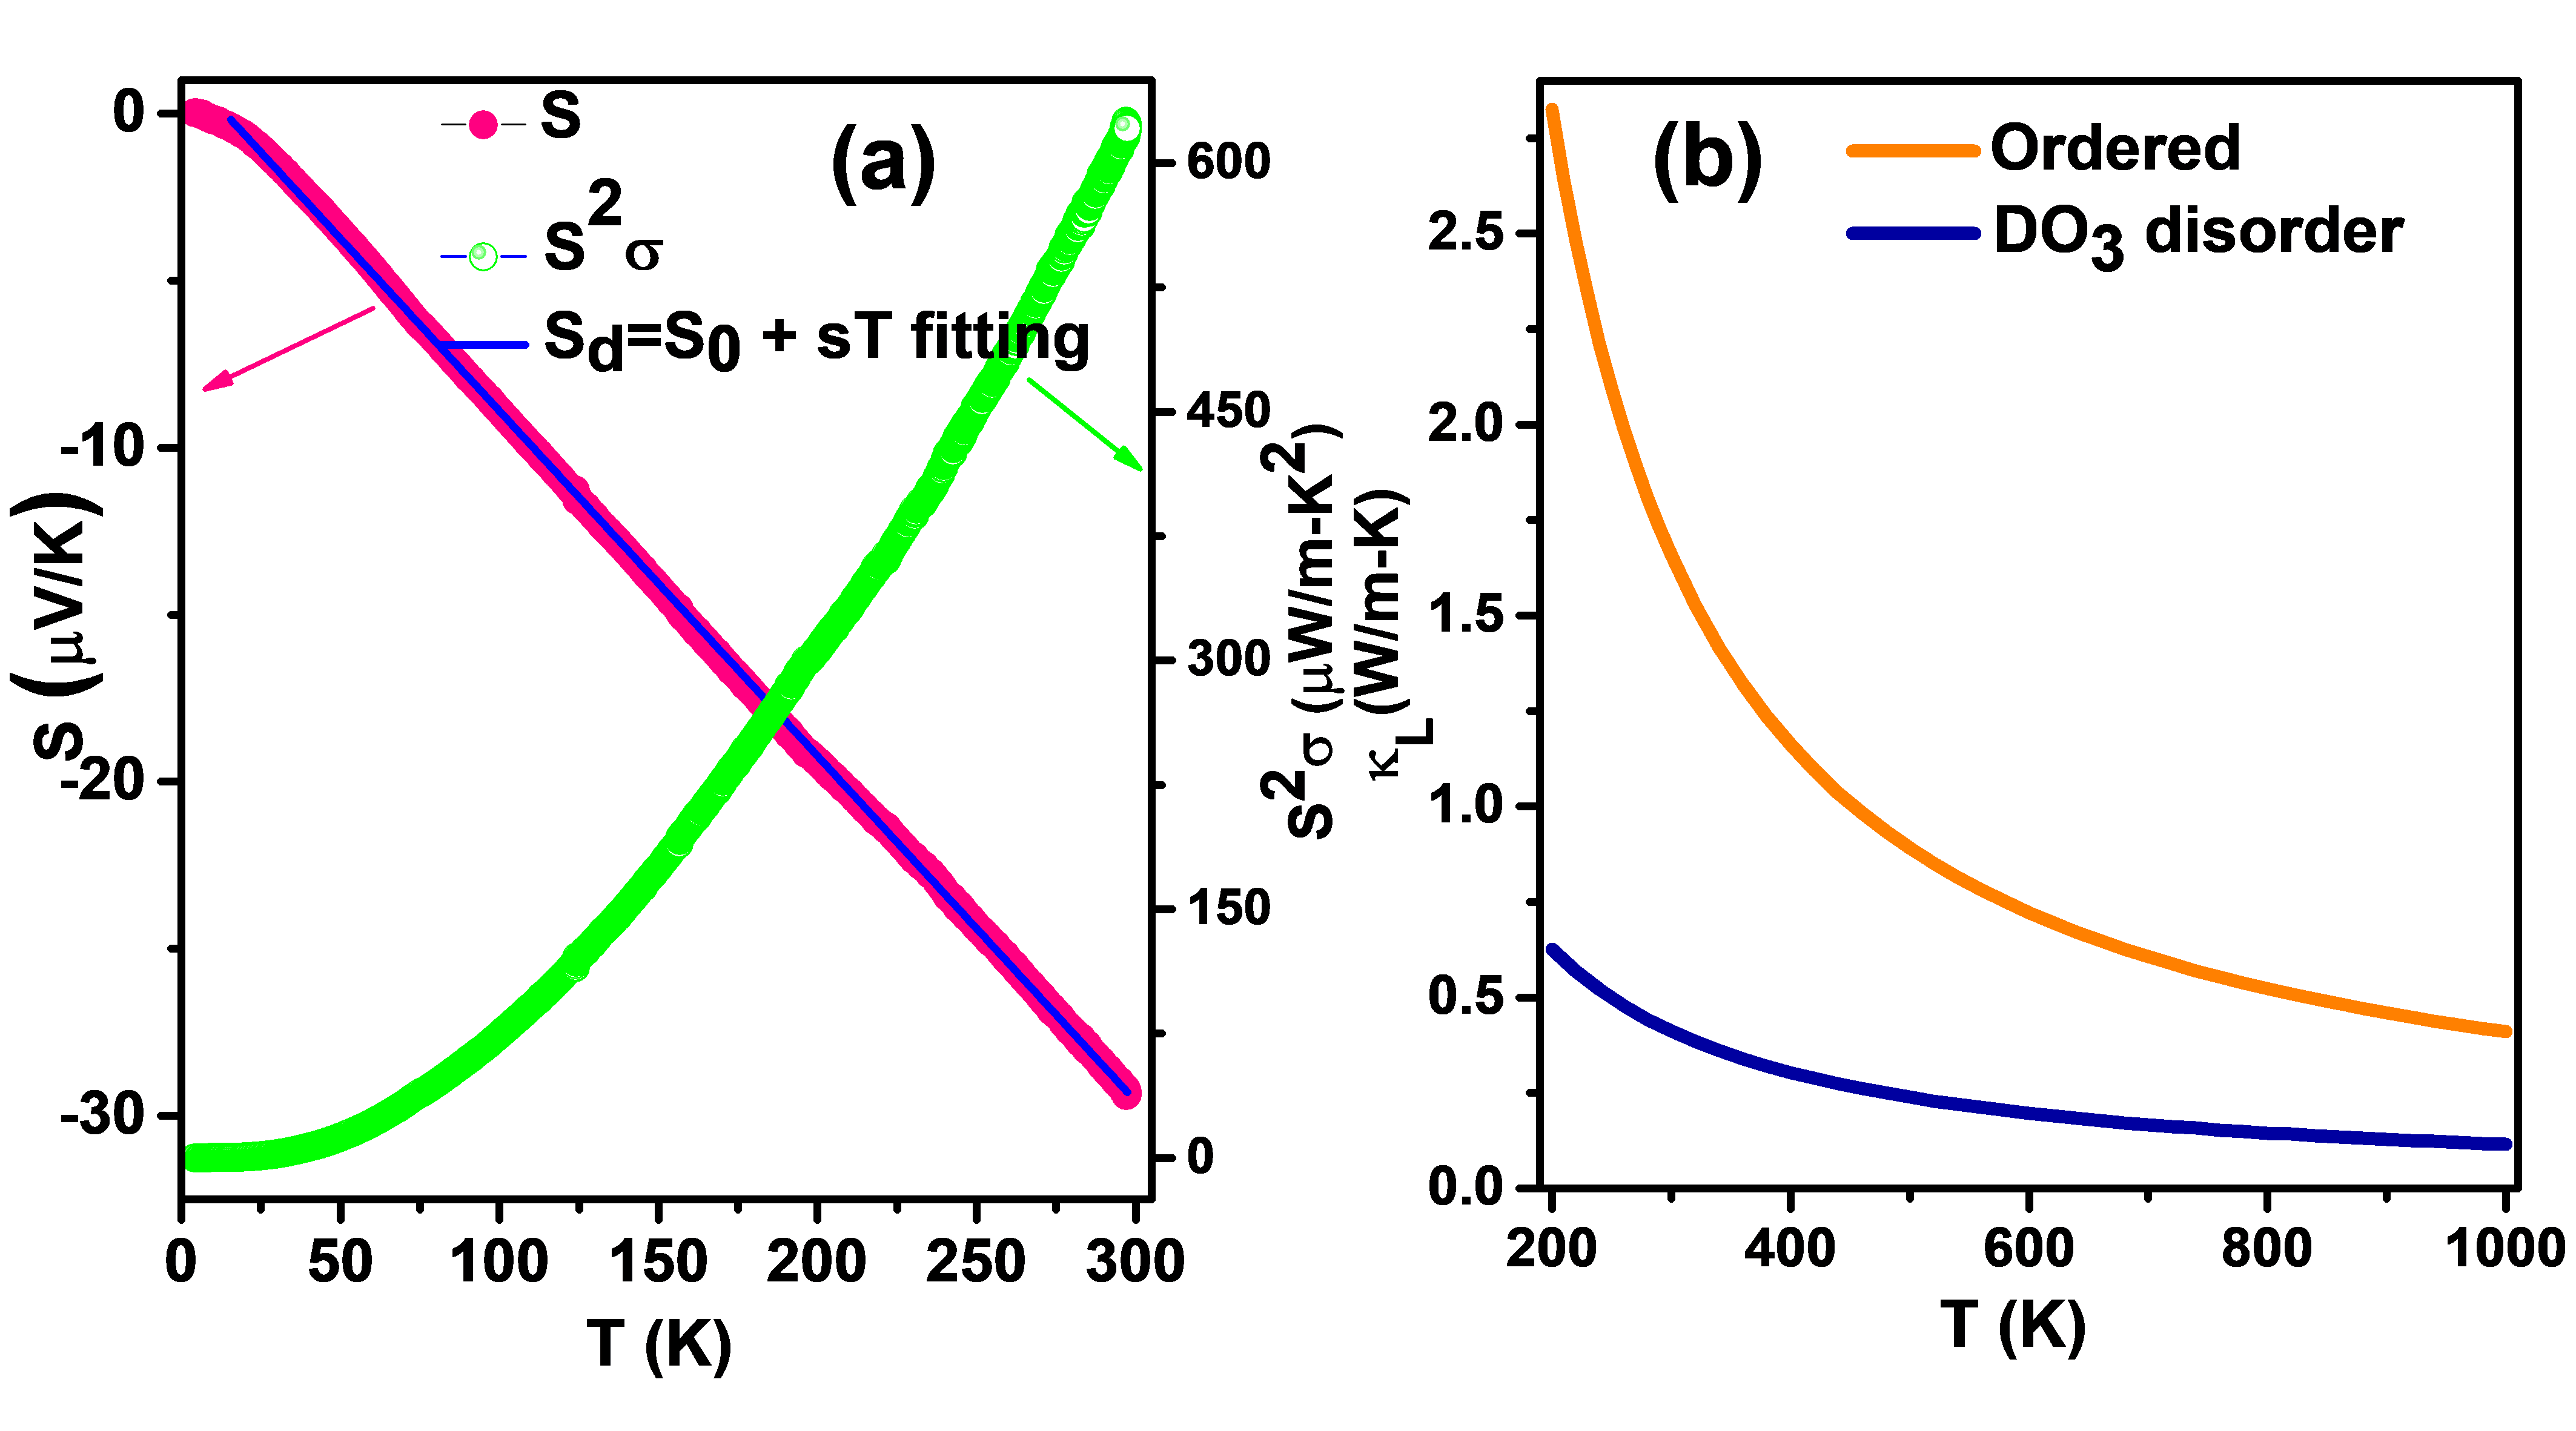
Thermoelectric properties: Figure 4(a) shows the variations of the Seebeck coefficient (S) and power factor () with T. S increases linearly with T throughout the T-range, which is a typical behavior of weak half-metal. The negative slope of S vs. T plot corresponds to a purely electron driven , which is reflected in the Hall data as well. The linear behavior of suggests the dominance of diffusion thermopower. The magnitude of S is 30 at 300 K, which is fairly high and comparable to other potential TE materials, at RT.Yu et al. (2009); Hayashi et al. (2017); Lue and Kuo (2002) Power factor shows an almost quadratic nature with a maximum value of 621 at RT. This is one of the highest among many Heusler based TE materials,Sakurada and Shutoh (2005); Yan et al. (2011) and also in line with other reported promising TE materials.Fu et al. (2015); Huang et al. (2015); Fu et al. (2013) Carrier concentration () is evaluated by fitting the -data with the equation Sd=S0+s in the T-range of 25-300 K, where Sd is the diffusion thermopower and is a constant. s = yields a carrier concentration of . Typical for promising TE materials lie in the range 1019 to 1021 cm-3.
To further evaluate the potential of CFVS for TE applications, we have simulated the lattice thermal conductivity () with and without DO3 disorder, as shown in Fig. 4(b). CFVS with DO3 disorder (the actual experimental phase) shows ultra low values (0.1-0.6 Wm-1K-1) due to the increased phonon scattering in comparison to the completely ordered phase. Similar values are reported in a few other promising TE materials as well.Sajjad et al. (2020); Mukhopadhyay et al. (2018) This again confirms the potential of CFVS for TE applications.
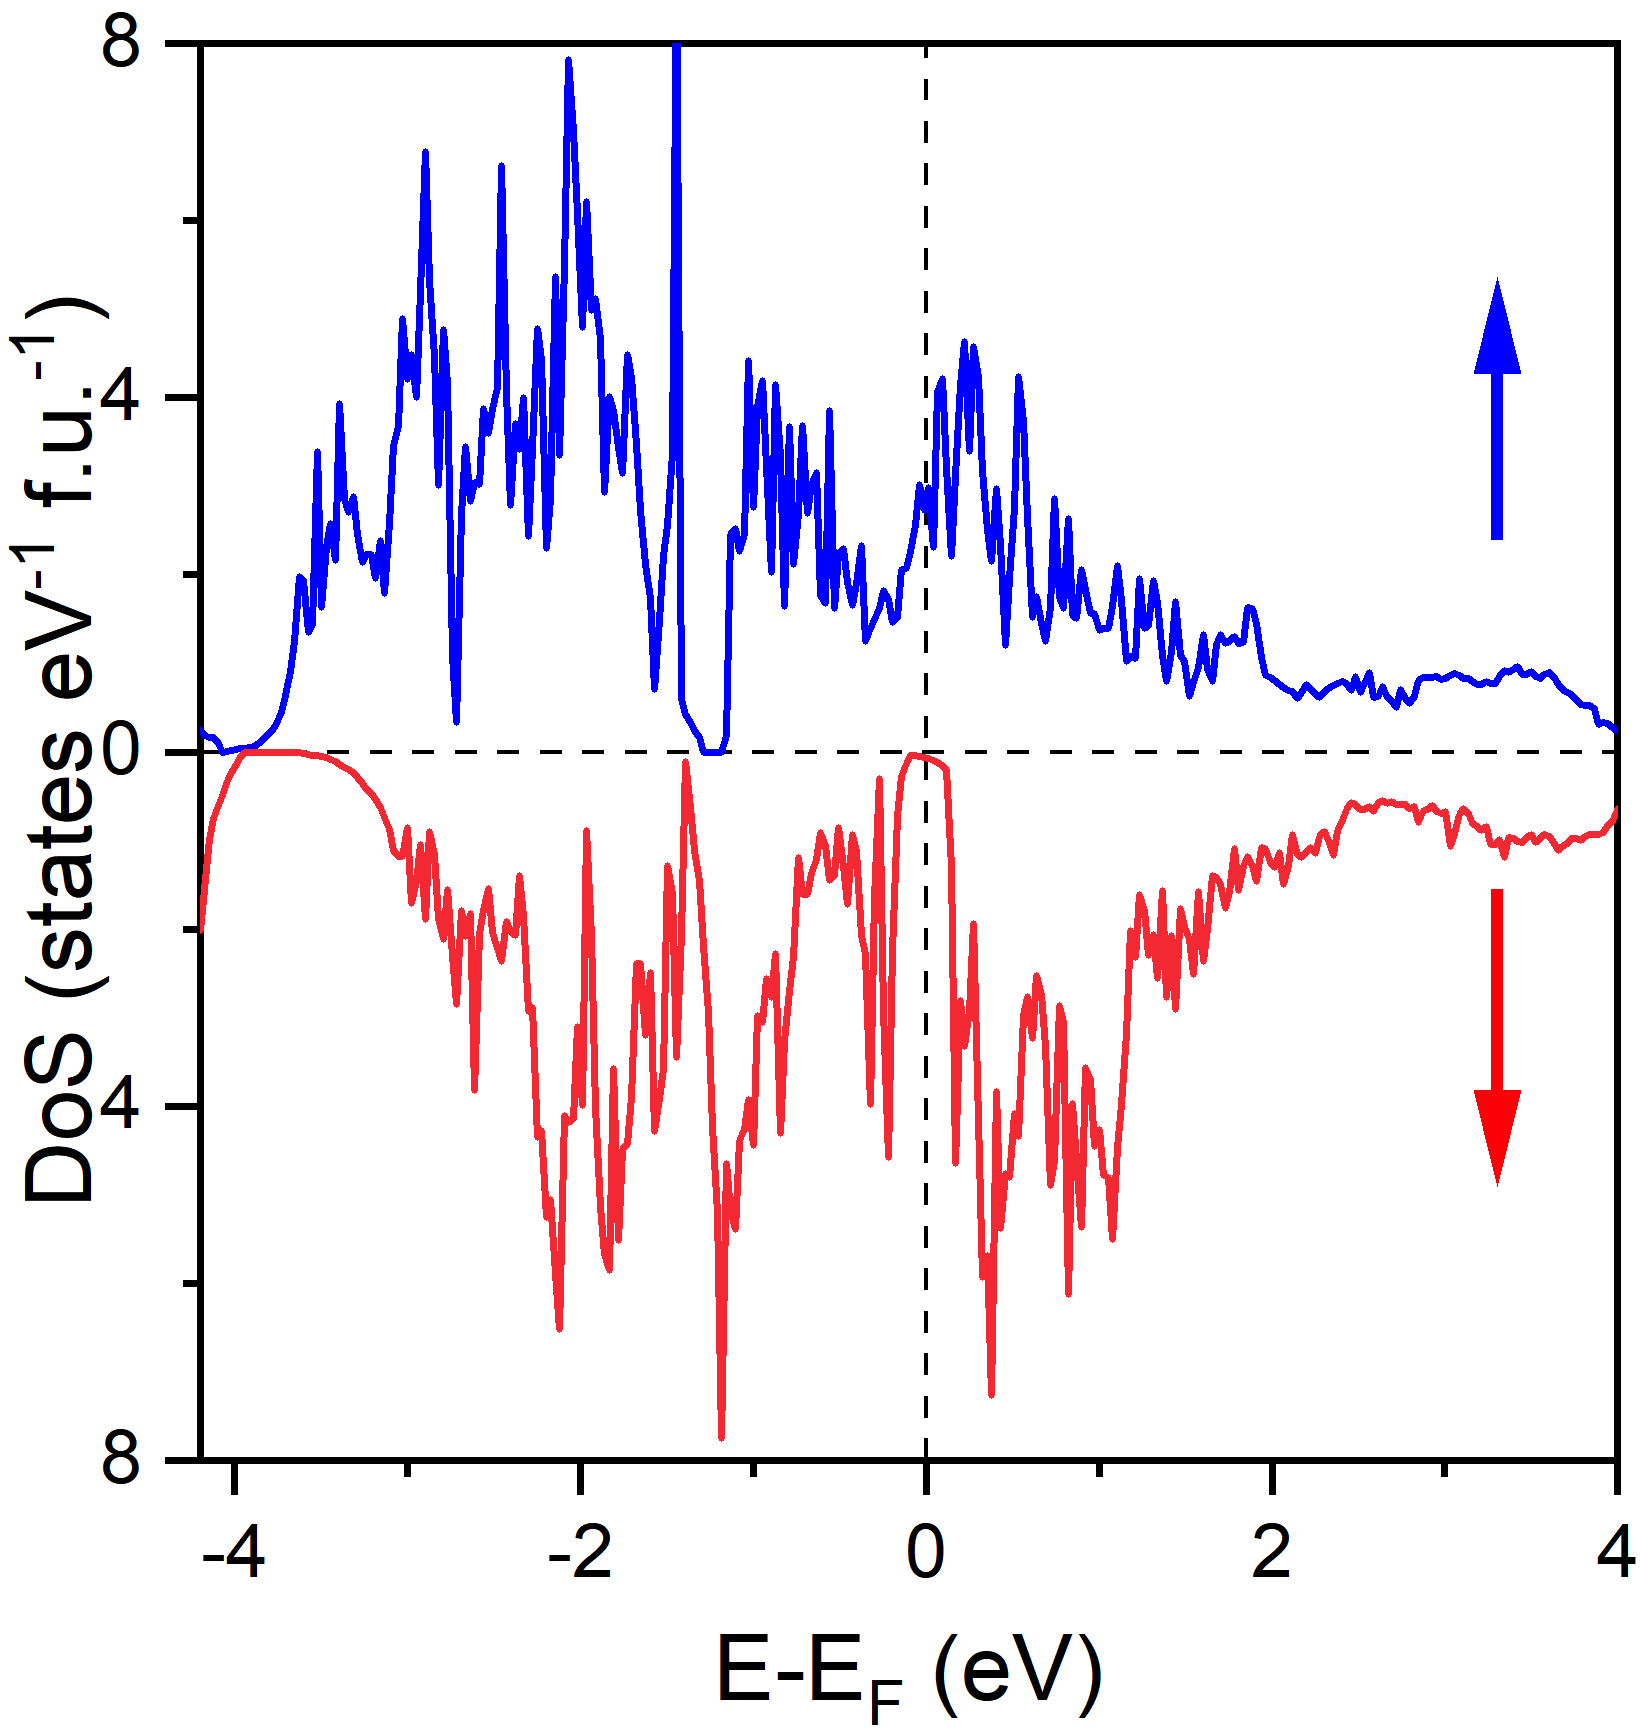
Theoretical Results: Ab-initio total energy calculations are performed considering three different structural configurations (Type-I, Type-II and Type-III) of CFVS (see SMsup (2021) for more details) We also simulated various magnetic states by considering different magnetic arrangements (antiferro-, ferro- and ferri-magnetic) in all the three configurations. Table SIII of SMsup (2021) shows the energetics, optimized lattice parameters and moments of the three ordered configurations. Type-I turns out to be energetically the most stable configuration with ferromagnetic ordering. Figure 5 displays the spin polarized band structure and density of states (DoS) for this configuration, which clearly shows a half-metallic nature with a band gap of 0.48 eV in the minority spin channel.
The total magnetic moment of Type-I configuration is 3.0 /f.u., which agrees well with the SP rule. In contrast, the experimentally observed moment is 2.2 /f.u. This difference is partially due to the DO3 disorder in this system, as observed experimentally. To understand this discrepancy, we have constructed a DO3 disordered structure of CFVS by swapping 1 Co with 1 V and 1 Fe with 1 V atoms in a supercell, which gives a 12.5% swap disorder, as predicted by XRD and EXAFS measurements. See 222XRD and EXAFS measurements reveal a DO3-type disorder in CFVS, which in the present case arises due to disorder between Co and V as well as Fe and V sites. To simulate the experimentally observed structure, a supercell of the primitive cell of the most stable ordered configuration (Type I) of CFVS was constructed. This supercell contains a total of 32 atoms, including 8-atoms of each kind. In a supercell, exchanging one of the eight Co/Fe atom positions with one of the eight ’V’ atom positions leads to a 12.5% swap disorder between Co/Fe and V atoms. All possible configurations for replacement of Co/Fe by V and vice versa were simulated, and the results of energetically most stable configurations are chosen to present here. As compared to the completely ordered structure, the atom projected local moments in the disordered case changes considerably due to the change in the local atomic environment. for more details about this structure. The simulation of this structure indeed gives a reduced magnetization of 2.5 /f.u., in line with experimental prediction. With DO3 disorder, the V atoms which replace Co and Fe sites remain FM but gain moment as compared to their own designated Wyckoff sites. In contrast, Co and Fe atoms which replace V sites become antiferromagnetically aligned and hence cause an overall reduction in the net moment. Also, with DO3 disorder, CFVS behaves like a weak half metal (metallic in one spin channel and almost zero gap in other, see SMsup (2021)).
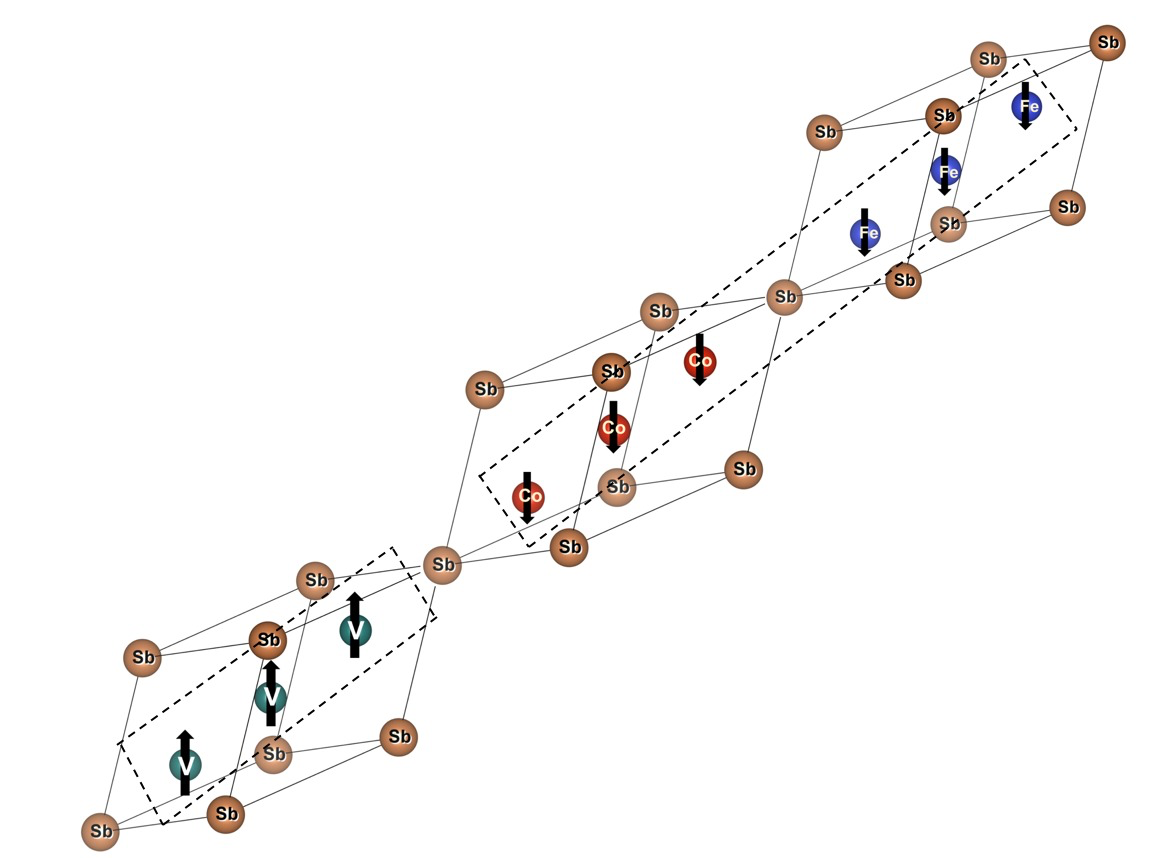
Taking a hint from the spin alignment of different atoms in DO3 disordered structure, we have modelled a FM/AFM interface structure involving Co, Fe and V atoms. This magnetic structure is shown in Fig. S7 of SM,sup (2021) which clearly resembles a FM/AFM interface embedded within a host of FM matrix, supporting the spin-valve behavior in CFVS. This magnetic structure is energetically close (within 2 meV) to the lowest energy Type-I FM structure and has a net moment of 2.3 /f.u.
Summary and Conclusion: Here, we report a new quantum material, CoFeVSb, which is predicted to be a potential candidate for spintronics and thermoelectric applications. Using a combined theoretical and experimental study, we predict CoFeVSb to host various interesting multifunctional properties such as room temperature spin-valve nature, large power factor, high spin polarization. The system crystallizes in a cubic structure with small amount of DO3 disorder, as confirmed by both normal/synchrotron XRD and EXAFS measurements. Both ab-initio calculations and resistivity data confirms half metallic nature, leading to high spin polarization. Observation of double hysteresis loop, asymmetric magnetoresistance and stability of FM/AFM interface from ab-initio calculations strongly suggests the room temperature spin-valve behavior. Hall measurements show anomalous behavior, dominated by the intrinsic Berry phase contribution. Further, large power factor and ultra low lattice thermal conductivity confirm CFVS to be a potential candidate for TE applications as well. In conclusion, coexistence of so-many interesting properties in a single material opens up new opportunities for numerous applications such as spincalorics, thermoelectrics etc.
Acknowledgments: JN acknowledges the financial support provided by IIT Bombay in the form of fellowship. Authors thank Dr. Velaga Srihari, ECXRD beamline, BL-11, Indus-2, RRCAT for carrying out anomalous x-ray diffraction measurements. AA acknowledges DST-SERB (Grant No. CRG/2019/002050) for funding to support this research.
References
- de Groot et al. (1983) R. A. de Groot, F. M. Mueller, P. G. v. Engen, and K. H. J. Buschow, Phys. Rev. Lett. 50, 2024 (1983).
- Pickett and Moodera (2001) W. E. Pickett and J. S. Moodera, Phys. Today 54, 39 (2001).
- Bombor et al. (2013) D. Bombor, C. G. Blum, O. Volkonskiy, S. Rodan, S. Wurmehl, C. Hess, and B. Büchner, Phys. Rev. Lett. 110, 066601 (2013).
- Graf et al. (2011a) T. Graf, C. Felser, and S. S. Parkin, Prog. Solid State Chem. 39, 1 (2011a).
- Rani et al. (2017) D. Rani, Enamullah, K. G. Suresh, A. K. Yadav, S. N. Jha, D. Bhattacharyya, M. R. Varma, and A. Alam, Phys. Rev. B 96, 184404 (2017).
- Moodera and Mootoo (1994) J. Moodera and D. Mootoo, J. Appl. Phys. 76, 6101 (1994).
- Tezuka et al. (2006) N. Tezuka, N. Ikeda, A. Miyazaki, S. Sugimoto, M. Kikuchi, and K. Inomata, Appl. Phys. Lett. 89, 112514 (2006).
- Sakuraba et al. (2010) Y. Sakuraba, N. Hirose, M. Oogane, T. Nakamura, Y. Ando, and K. Takanashi, Appl. Phys. Lett. 96, 092511 (2010).
- Kasahara et al. (2014) K. Kasahara, Y. Fujita, S. Yamada, K. Sawano, M. Miyao, and K. Hamaya, Appl. Phys. Express 7, 033002 (2014).
- Furubayashi et al. (2013) T. Furubayashi, T. Nakatani, H. Goripati, H. Sukegawa, Y. Takahashi, K. Inomata, and K. Hono, J. Appl. Phys. 114, 123910 (2013).
- Dieny et al. (1991) B. Dieny, V. S. Speriosu, S. S. P. Parkin, B. A. Gurney, D. R. Wilhoit, and D. Mauri, Phys. Rev. B 43, 1297 (1991).
- Singh et al. (2012) S. Singh, R. Rawat, S. E. Muthu, S. W. D’Souza, E. Suard, A. Senyshyn, S. Banik, P. Rajput, S. Bhardwaj, A. M. Awasthi, R. Ranjan, S. Arumugam, D. L. Schlagel, T. A. Lograsso, A. Chakrabarti, and S. R. Barman, Phys. Rev. Lett. 109, 246601 (2012).
- Sakurada and Shutoh (2005) S. Sakurada and N. Shutoh, Appl. Phys. Lett. 86, 082105 (2005).
- Yan et al. (2011) X. Yan, G. Joshi, W. Liu, Y. Lan, H. Wang, S. Lee, J. Simonson, S. Poon, T. Tritt, G. Chen, et al., Nano Lett. 11, 556 (2011).
- Xiong et al. (2014) L. Xiong, L. Yi, and G. Gao, J. Magn. Magn. Mater. 360, 98 (2014).
- sup (2021) See the Supplementary Information (2021).
- Nag et al. (2021) J. Nag, D. Rani, J. Kangsabanik, D. Singh, R. Venkatesh, P. D. Babu, K. G. Suresh, and A. Alam, Phys. Rev. B 104, 134406 (2021).
- Yoneda et al. (2015) M. Yoneda, S. Obata, and M. Niwa, Mater. Trans , MAW201502 (2015).
- Pang et al. (2017) B. Pang, L. Zhang, Y. Chen, J. Zhou, S. Yao, S. Zhang, and Y. Chen, ACS Appl. Mater. Interfaces 9, 3201 (2017).
- Graf et al. (2011b) T. Graf, C. Felser, and S. S. Parkin, Prog. Solid State Chem. 39, 1 (2011b).
- Özdoğan et al. (2013) K. Özdoğan, E. Şaşıoğlu, and I. Galanakis, J. App. Phys. 113, 193903 (2013).
- Zheng and Jin (2012) N. Zheng and Y. Jin, J. Magn. Magn. Mater. 324, 3099 (2012).
- Vidal et al. (2011) E. V. Vidal, H. Schneider, and G. Jakob, Phys. Rev. B 83, 174410 (2011).
- Note (1) The asymmetric component is calculated as MR(H)= while the symmetric component as MR(H)=.
- Agarwal et al. (2018) S. Agarwal, B. Wang, H. Yang, P. Dhanapal, Y. Shen, J. Wang, H. Wang, J. Zhao, and R.-W. Li, Phys. Rev. B 97, 214427 (2018).
- Nagaosa et al. (2010) N. Nagaosa, J. Sinova, S. Onoda, A. H. MacDonald, and N. P. Ong, Rev. Mod. Phys. 82, 1539 (2010).
- Tian et al. (2009) Y. Tian, L. Ye, and X. Jin, Phys. Rev. Lett. 103, 087206 (2009).
- Yu et al. (2009) C. Yu, T.-J. Zhu, R.-Z. Shi, Y. Zhang, X.-B. Zhao, and J. He, Acta Mater. 57, 2757 (2009).
- Hayashi et al. (2017) K. Hayashi, M. Eguchi, and Y. Miyazaki, J. Electron. Mater. 46, 2710 (2017).
- Lue and Kuo (2002) C. S. Lue and Y.-K. Kuo, Phys. Rev. B 66, 085121 (2002).
- Fu et al. (2015) C. Fu, S. Bai, Y. Liu, Y. Tang, L. Chen, X. Zhao, and T. Zhu, Nat. Commun. 6, 1 (2015).
- Huang et al. (2015) L. Huang, R. He, S. Chen, H. Zhang, K. Dahal, H. Zhou, H. Wang, Q. Zhang, and Z. Ren, Mater. Res. Bull. 70, 773 (2015).
- Fu et al. (2013) C. Fu, Y. Liu, H. Xie, X. Liu, X. Zhao, G. Jeffrey Snyder, J. Xie, and T. Zhu, J. Appl. Phys. 114, 134905 (2013).
- Sajjad et al. (2020) M. Sajjad, Q. Mahmood, N. Singh, and J. A. Larsson, ACS Appl. Energy Mater. 3, 11293 (2020).
- Mukhopadhyay et al. (2018) S. Mukhopadhyay, D. S. Parker, B. C. Sales, A. A. Puretzky, M. A. McGuire, and L. Lindsay, Science 360, 1455 (2018).
- Note (2) XRD and EXAFS measurements reveal a DO3-type disorder in CFVS, which in the present case arises due to disorder between Co and V as well as Fe and V sites. To simulate the experimentally observed structure, a supercell of the primitive cell of the most stable ordered configuration (Type I) of CFVS was constructed. This supercell contains a total of 32 atoms, including 8-atoms of each kind. In a supercell, exchanging one of the eight Co/Fe atom positions with one of the eight ’V’ atom positions leads to a 12.5% swap disorder between Co/Fe and V atoms. All possible configurations for replacement of Co/Fe by V and vice versa were simulated, and the results of energetically most stable configurations are chosen to present here. As compared to the completely ordered structure, the atom projected local moments in the disordered case changes considerably due to the change in the local atomic environment.
- Rodríguez-Carvajal (1993) J. Rodríguez-Carvajal, Physica B 192, 55 (1993).
- Poswal et al. (2014) A. Poswal, A. Agrawal, A. Yadav, C. Nayak, S. Basu, S. Kane, C. Garg, D. Bhattachryya, S. Jha, and N. Sahoo, in AIP Conference Proceedings, Vol. 1591 (American Institute of Physics, 2014) pp. 649–651.
- Basu et al. (2014) S. Basu, C. Nayak, A. Yadav, A. Agrawal, A. Poswal, D. Bhattacharyya, S. Jha, and N. Sahoo, in J. Phys. Conf. Ser., Vol. 493 (IOP Publishing, 2014) p. 012032.
- Sharath Chandra et al. (2008) L. Sharath Chandra, A. Lakhani, D. Jain, S. Pandya, P. Vishwakarma, M. Gangrade, and V. Ganesan, Rev. Sci. Instrum. 79, 103907 (2008).
- Hammersley et al. (1996) A. Hammersley, S. Svensson, M. Hanfland, A. Fitch, and D. Hausermann, International Journal of High Pressure Research 14, 235 (1996).
- Hohenberg and Kohn (1964) P. Hohenberg and W. Kohn, Phys. Rev. 136, B864 (1964).
- Kresse and Furthmüller (1996a) G. Kresse and J. Furthmüller, Phys. Rev. B 54, 11169 (1996a).
- Kresse and Furthmüller (1996b) G. Kresse and J. Furthmüller, Comput. Mater. Sci 6, 15 (1996b).
- Kresse and Hafner (1993) G. Kresse and J. Hafner, Phys. Rev. B 47, 558 (1993).
- Kresse and Joubert (1999) G. Kresse and D. Joubert, Phys. Rev. B 59, 1758 (1999).
- Perdew et al. (1996) J. P. Perdew, K. Burke, and M. Ernzerhof, Phys. Rev. Lett. 77, 3865 (1996).
- Fan and Oganov (2020) T. Fan and A. R. Oganov, Comput. Phys. Comm. 251, 107074 (2020).
- Togo and Tanaka (2015) A. Togo and I. Tanaka, Scr. Mater. 108, 1 (2015).
- Baroni et al. (2001) S. Baroni, S. De Gironcoli, A. Dal Corso, and P. Giannozzi, Rev. Mod. Phys. 73, 515 (2001).
- Newville et al. (1995) M. Newville, B. Ravel, D. Haskel, J. Rehr, E. Stern, and Y. Yacoby, Physica B: Condens. Matter. 208, 154 (1995).
- Karplus and Luttinger (1954) R. Karplus and J. M. Luttinger, Phys. Rev. 95, 1154 (1954).
- Sundaram and Niu (1999) G. Sundaram and Q. Niu, Phys. Rev. B 59, 14915 (1999).
- Smit (1958) J. Smit, Physica 24, 39 (1958).
- Berger (1970) L. Berger, Phys. Rev. B 2, 4559 (1970).
Supplementary Material for “CoFeVSb: A Promising Candidate for Spin Valve and Thermoelectric Applications”
Here, we present the details of experimental synthesis, different measurement tools, and ab-initio computation. We have demonstrated the details of the surface morphology, XRD refinement, EXAFS, synchrotron XRD, EDS data, resistivity and Hall data for CoFeVSb. We present further results on ab-initio calculations.
I Experimental details
Polycrystalline samples of CoFeVSb were synthesized using an arc melting system in a high purity Ar environment of the stoichiometric quantities of constituent elements having a purity of at least 99.99%. To stabilize the desired phase, samples were annealed for 1 week at C in sealed quartz tubes, followed by quenching in ice-water. For the structural studies, X-ray diffraction (XRD) patterns at RT were taken using Cu-K radiation with the help of Panalytical X-pert diffractometer. Crystal structure analysis was done using FullProf Suite software.Rodríguez-Carvajal (1993) EXAFS measurements were carried out at the Energy-Scanning EXAFS beamline (BL-9) in transmission mode at the INDUS-2 Synchrotron Source (2.5 GeV, 200 mA) at the Raja Ramanna Centre for advanced Technology (RRCAT), Indore, India Poswal et al. (2014); Basu et al. (2014) The ratio of the measured compositions turns out to be , indicating the almost desired stoichiometry. Magnetization measurements at various temperatures were obtained using a vibrating sample magnetometer (VSM) attached to the physical property measurement system (PPMS) (Quantum design) for fields up to 70 kOe. Temperature and field dependent resistivity measurements were carried out using a PPMS (DynaCool) employing the electrical transport option (ETO) in the four-probe method (10 mA current at 18 Hz frequency). Hall measurements were also carried out using the same setup, with the van der Pauw method under the same current and frequency. Thermoelectric power (TEP) was measured using differential dc sandwich method in an in-house setup in the temperature range of 4–300 K.Sharath Chandra et al. (2008)
As XRD cannot provide complete structural details of this system because of the fact that the constituents are near neighbors in the periodic table, with almost identical atomic scattering amplitudes,
EXAFS was used. For the EXAFS measurements the Energy-Scanning EXAFS beamline (BL-9) was operated in the energy range of 4-25 KeV. The beamline optics consisted of a Rh/Pt coated
collimating meridional cylindrical mirror and the collimated beam reflected by the mirror was monochromatized by a Si(111) (2d=6.2709 Å) based double crystal monochromator (DCM).
The second crystal of the DCM was a sagittal cylinder, which was used for horizontal focusing while a Rh/Pt coated bendable post mirror facing down was used for vertical focusing
of the beam at the sample position. Three ionization chambers (300 mm length each) were used for data collection in transmission mode, one ionization chamber for measuring incident
flux (I0), second for measuring transmitted flux (IT) and the third for measuring EXAFS spectrum of a reference metal foil for energy calibration. Appropriate gas pressure and
gas mixture were chosen to achieve 10-20% absorption in the first ionization chamber and 70-90% absorption in the second ionization chamber to improve the signal to noise ratio.
Rejection of the higher harmonics content in the X-ray beam was performed by second mirror. The absorption coefficient was obtained using the relation:
| (1) |
Synchrotron XRD measurement was carried out using the synchrotron wavelength . Synchrotron based powder x-ray diffraction measurements were performed on well-ground powder samples at Extreme Conditions Angle Dispersive/Energy dispersive x-ray diffraction (EC-AD/ED-XRD) beamline (BL-11) at Indus-2 synchrotron source. Measurements were carried out in capillary mode and capillary was rotated at 150 rpm to reduce the orientation effects. Desired wavelength for ADXRD diffraction experiments was selected from the white light from the bending magnet using a Si(111) channel cut monochrometer. The monochromatic beam was then focused on to the sample with a Kirkpatrick-Baez mirror or K-B mirror. A MAR345 image plate detector (which is an area detector) was used to collect 2-dimensional diffraction data. Sample to detector distance and the wavelength of the beam were calibrated using NIST standards LaB6 and CeO2. Calibration and conversion/integration of 2D diffraction data to 1D, intensity vs 2, was carried out using FIT2D software Hammersley et al. (1996).
Surface morphology of the bulk sample was analyzed by atomic force microscopy (AFM) and magnetic force microscopy (MFM) using NanoScope Multimode-IV Veeco, Digital Instruments. Transmission electron microscopy (TEM) images and selected area electron diffraction (SAED) patterns have been recorded using FEG-TEM (Philips CM200) on a powder sample.
II Computational details
Ab initio calculations were performed using spin polarized density functional theory (DFT)Hohenberg and Kohn (1964) implemented within Vienna ab initio simulation package (VASP) Kresse and Furthmüller (1996a, b); Kresse and Hafner (1993) with a projected augmented-wave (PAW) basis.Kresse and Joubert (1999) The exchange-correlation potential due to Perdew, Burke, and Ernzerhof (PBE) Perdew et al. (1996) was used within the generalized gradient approximation (GGA) scheme. Brillouin zone integration was done within the tetrahedron method using a k-mesh. A plane wave energy cut-off of 500 eV was used for all the calculations. All the structures were fully relaxed with total energies (forces) converged to values less than 10-6 eV (0.01 eV/Å). In order to further evaluate the potential of CFVS for thermoelectric (TE) applications, we simulated the lattice thermal conductivity () using Ab Initio Conductivities (AICON) codeFan and Oganov (2020). AICON is the modified Debye-Callaway (DC) model, which calculates by including the contribution from both acoustic as well as optical phonon branches scaled by their specific heat ratio. The mode velocities, Debye temeperature, mode Gruneisen parameters are some of the key quantities used as the input parameters for this model which were calculated from the phonon band structure using Phonopy codeTogo and Tanaka (2015). This requires density functional perturbation theory (DFPT)Baroni et al. (2001) calculations, as implemented within the VASPKresse and Furthmüller (1996b, a); Kresse and Hafner (1993) package. Fig. 4(b) in the manuscript shows the phonon band structure for ordered CoFeVSb. The mode velocities () for acoustic modes are calculated by taking the slope of the band corresponding to vibrational mode at point. The Debye temperature () is obtained from the maximum frequency corresponding to the vibrational mode. In addition to and , this model for the lattice thermal conductivity also requires the mode Gruneisen parameters (). is a measure of the degree of anharmonicity of the lattice. Higher the value, more anharmonic the lattice will be. is defined as:
| (2) |
where denotes longitudinal acoustic, / denote two transverse acoustic branches and denotes the optical phonon branches. and are the specific heat ratio for acoustic and optical branches respectively, and are the specific heat of the respective phonon branches (=acoustic/optical).
III Experimental Results
III.1 Composition analysis
The energy-dispersive spectra (EDS) for CoFeVSb sample is shown in the Fig. S6. The ratio of the constituent elements was found to be , which agrees with the desired composition of the sample.
III.2 Surface morphology analysis
Fig. S7(a-b) shows the AFM and MFM surface images of the sample. The root mean square (RMS) roughness is found to be 15 nm when area of the surface was scanned. It is well known that in MFM the phase and frequency of the oscillating cantilever is mapped while scanning the sample surface. A repulsive magnetic force results in the shifting of the resonance curve towards a higher frequency accompanied by an increase in phase shift, which gives rise to the bright contrasts, while an attractive magnetic force gradient gives rise to dark contrasts in MFM image. Bright and dark contrast regions in MFM surface image indicate different magnetic domains of competing magnetic phases as shown in Fig. S7(b). Hence, our MFM data strongly supports the existence of competing ferromagnetic (FM)/antiferromagnetic (AFM) interface structures within a host of FM matrix. Fig. S8 (b-c) shows the high resolution transmission electron microscopy (HR-TEM) image for CoFeVSb while its SAED pattern is shown in Fig. S8 (a).
III.3 Crystal Structure
III.3.1 XRD
The crystal structure of CoFeVSb can be seen as four interpenetrating fcc sublattices with Wyckoff positions 4, 4, 4 and 4. In general, for a quaternary XX′YZ alloy, there exists three energetically non-degenerate structural configurations (keeping Z-atom at 4-site). They are
-
•
X at 4, X′ at 4 and Y at 4 site (Type I)
-
•
X at 4 , X′ at 4d and Y at 4c site (Type II)
-
•
X at 4 , X′ at 4 and Y at 4 site (Type III)
For a detailed XRD analysis, the structure factor with the configuration I (Z-atom at 4-site, X at 4, X′ at 4, and Y at 4 site) can be expressed as
| (3) |
where are the miller indices. Here , , , and are the atomic scattering factors for , , , and atoms respectively. For super lattice reflections, i.e. for (111) and (200), the structure factor takes the form,
| (4) |
| (5) |
Fig. S9 shows XRD pattern along with the refinement for configuration-I with 12% disorder between Co-V (X-Y) and 12% disorder between Fe-V (X′ -Y) atoms. Rietveld refinement was also done by fitting configurations II and III, but those did not fit well. We have also performed refinement considering several degrees of antisite disorder such as 5, 10, 15, 20 % between Co-V and Fe-V sites for all the three configurations (I, II and III). However, the best fit with the lowest (2.01) was found with 12.5% antisite disorder between Co-V sites and 12.5% antisite disorder between Fe-V sites in the configuration-I.
III.3.2 EXAFS
| Co K-edge | Fe K-edge | V K-edge | |||||||||
| Path | R () | N | Path | R () | N | Path | R () | N | |||
| Co-V | 2.540.02 | 4 | 0.00760.0016 | Fe-Sb | 2.530.02 | 4 | 0.00950.0015 | V-Co | 2.540.02 | 4 | 0.00760.0016 |
| Co-Sb | 2.540.02 | 4 | 0.00130.0011 | Fe-V | 2.510.02 | 4 | 0.01640.0013 | V-Fe | 2.510.02 | 4 | 0.01640.0013 |
| Co-Fe | 2.930.02 | 6 | 0.00940.0033 | Fe-Co | 2.930.02 | 6 | 0.00940.0033 | V-Sb | 2.940.03 | 6 | 0.00790.0028 |
| Co-Co/Fe(V) | 2.540.02 | 4 | 0.00750.0015 | Fe-Co/Fe(V) | 2.45 0.03 | 4 | 0.00210.0010 | V-V(Co/Fe) | 2.490.03 | 8 | 0.00120.0010 |
| x=0.25 | x=0.35 | x=0.25 | |||||||||
In order to take care of the oscillations, absorption spectra has been converted to absorption function defined asPoswal et al. (2014)
| (6) |
where is the absorption edge energy, is the bare atom background and is the step in value at the absorption edge. The absorption coefficient can also be expressed in terms of wave number () using the following relation,
| (7) |
here, is the mass of electron. is weighted by to amplify the oscillation at higher . The functions are Fourier transformed to generate the spectra in terms of the real distances from the center of the absorbing atom. The programme available within IFEFFIT software package has been used for EXAFS data analysis.Newville et al. (1995) This includes background reduction and Fourier transform to derive the vs. spectra from the absorption spectra (using ATHENA software). This helps to generate the theoretical EXAFS spectra starting from an assumed crystallographic structure and finally fit the experimental data with the theoretical spectra using ARTEMIS software. Co, Fe and V K-edge are fitted simultaneously with common fitting parameters. This simultaneous fitting reduces the number of independent parameters and enhances the statistical significance of the fitting model. The structural parameters (atomic coordination and lattice parameters) of CoFeVSb used for simulation of the theoretical EXAFS spectra are taken from XRD results. Table S1 shows the detailed EXAFS fitting results. The first peak in Fourier transform EXAFS spectrum at V K-edge (see Fig. 2(d) of the manuscript) arises from the contribution of V-Co, V-Fe and V-Sb coordination shells along with the antisite disorder contribution from V-VCo/VFe (VCo means V at Co site and VFe means V at Fe site). The first peak at Fe K-edge arises from the contribution of Fe-Sb, Fe-V and Fe-Co. Relatively smaller (2.27 ) Fe-Fe/Co bond distance is due to the possible presence of metallic Fe, which corroborates with the x-ray absorption near edge structures (XANES) result. The first peak at Co K-edge arises from the contribution of Co-V, Co-Sb and Co-Fe coordination shells. The antisite scattering contribution Co-Co/FeV is found at 2.54 .
III.3.3 Synchrotron XRD
To support our normal XRD results, we have carried out synchrotron XRD measurements for CoFeVSb. Fig. 1 of the manuscript shows room temperature synchrotron XRD pattern of CoFeVSb, which gives a similar set of reflection peaks as that of the normal XRD. From synchrotron XRD pattern, it appears that the (111) peak is much more intense and prominent as compared to the (200) peak. This becomes more clear from synchrotron XRD data than normal XRD. To understand the DO3 disorder in this system in more detail, we have analysed the relative intensities of the superlattice reflection peaks (111) and (200). The calculated value of relative intensities of the superlattice peaks ((I111/I200)) was found to be 1.35, which further confirms the presence of DO3 ordering in this alloy. Similarly, relative values of (I111/I220) and (I200/I220) are found to be 0.37 and 0.27 respectively. These values agree fairly well with those obtained from the normal room temperature XRD data. Hence, synchrotron data fully supports the results of structural analysis as obtained using the normal XRD data.
III.4 Magnetic Properties
Fig. S10 shows M vs. T curves for CoFeVSb. It clearly shows high TC (400 K) for the present compound.
III.5 Transport Properties
| Region | Temperature Range | Fitting Equation | Fitting Parameters |
|---|---|---|---|
| I | 3 T 13 K | = - B T0.5 | B =- 0.32 -cm K-0.5 |
| =96.6 -cm | |||
| II | 14 T 50 K | = + CT2 | C= -cm K-2 |
| =97.55 -cm | |||
| = + + | = 0.02 -cm K-1 | ||
| = 0.0001 -cm K-2 | |||
| =97.8 -cm | |||
| = + | D = -cm K-3 | ||
| =97.8 -cm | |||
| III | 60 T 310 K | = + ATn | |
| A=0.13 -cm K-n | |||
| =92.1 -cm |
To evaluate the contribution of different scattering mechanisms, we utilize the general power law fitting along with different models in various T-regimes. In the low T regime (region-I), T0.5 power law fits well. In the region-II, we have tried to fit different models e.g. T2, T3 and combination of linear and quadratic behavior as shown in the inset (ii) of Fig. 4(a) of the manuscript. The general power law has the following form :
| (8) |
Fitting parameters considering various models in different T-regimes are shown in Table S2. In the regime-I, there is a clear hump around 15 K and the resistivity data follow behavior well, indicating the possibility of weak localization at low temperature (T 15 K). In the regime-II, the data do not fit well with the T2 () or T3 () models throughout the T-range. Best fitting for this region was obtained considering .
III.6 Hall measurements
Figure S11(a) shows the temperature dependance of for CoFeVSb, which has a similar behavior as that of longitudinal resistivity(). AHE is generally composed of two components: intrinsic and extrinsicNagaosa et al. (2010). The transverse velocity of Bloch electrons in an ideal magnetic crystal gives rise to intrinsic AHE, which depends on the band structure of the material only. Karplus and Luttinger first proposed the mechanism of such intrinsic contribution to AHE, which was reconstructed later in terms of Berry phase.Karplus and Luttinger (1954); Sundaram and Niu (1999) The extrinsic mechanism, on the other hand, arises from the spin-orbit coupling-induced asymmetric scattering of electrons near impurity sites, and this can be classified into (i) Skew scattering Smit (1958) and (ii) side-jump scattering.Berger (1970) To find out the intrinsic and extrinsic contributions to AHE, we have used a scaling model reported by Tian et al.,Tian et al. (2009) according to which can be expressed as:
| (9) |
Separating the T-independent and dependent terms, Eq. 9 takes the form
| (10) |
where = is the T-independent term representing the extrinsic part coming from the skew scattering and side jump impurity scattering, while is the contribution due to intrinsic part. vs. along with the fit to Eq. 10 is shown in Fig. S11 (b). From the fitting, and values turn out to be and S cm-1 respectively.
For a better understanding of extrinsic and intrinsic contributions to AHE, we consider the anomalous Hall conductivity , which can be written asTian et al. (2009):
| (11) |
where, is the intrinsic Karplus-Luttinger term while and represent the skew scattering and side jump contributions respectively. Considering Eq. 9 and 10, Eq. 12 can be expressed as:
| (12) |
where is the residual conductivity. Figure S11(c) shows the T dependance of .
| Type | (Å) | (eV/f.u.) | ||||
|---|---|---|---|---|---|---|
| I | 5.9 | 1.04 | 1.13 | 0.84 | 3.0 | 0 |
| II | 6.1 | 1.2 | 1.9 | -1.3 | 1.78 | 0.7 |
| III | 6.0 | 1.056 | 2.6 | -1.11 | 2.55 | 0.36 |