A Census of the Circumstellar Disk Populations in the Sco-Cen Complex11affiliation: Based on observations made with the Gaia mission, the Two Micron All Sky Survey, and the Wide-field Infrared Survey Explorer.
Abstract
I have used mid-infrared (IR) photometry from the Wide-field Infrared Survey Explorer (WISE) to perform a census of circumstellar disks among 10,000 candidate members of the Sco-Cen complex that were recently identified with data from the Gaia mission. IR excesses are detected for more than 1200 of the WISE counterparts that are within the commonly adopted boundary for Sco-Cen, of which are newly reported in this work. The richest population in Sco-Cen, UCL/LCC, contains the largest available sample of disks (500) for any population near its age (20 Myr). UCL/LCC also provides the tightest statistical constraints to date on the disk fractions of low-mass stars for any single age beyond that of Upper Sco ( Myr). For Upper Sco and UCL/LCC, I have measured the disk fractions as a function of spectral type. The disk fraction in Upper Sco is higher at later spectral types, which is consistent with the results for previous samples of candidate members. In UCL/LCC, that trend has become more pronounced; the disk fractions in UCL/LCC are lower than those in Upper Sco by factors of 10, 5.7, and 2.5 at B7–K5.5, K6–M3.5, and M3.75–M6, respectively. The data in UCL/LCC also demonstrate that the disk fraction for low-mass stars remains non-negligible at an age of 20 Myr (0.090.01). Finally, I find no significant differences in the ages of disk-bearing and diskless low-mass stars in Upper Sco and UCL/LCC based on their positions in color-magnitude diagrams.
1. Introduction
The lifetimes of primordial circumstellar disks around newborn stars constrain the time available for the formation of giant planets (Pollack et al., 1996; Boss, 1998). Those lifetimes are estimated by comparing the prevalence of disks among clusters and associations that span a range of ages (Haisch et al., 2001; Mamajek, 2009; Cloutier et al., 2014; Ribas et al., 2015; Meng et al., 2017; Richert et al., 2018)111Disk lifetimes are subject to the systematic errors in age estimates for young stellar populations (Mayne & Naylor, 2008; Bell et al., 2013; Herczeg & Hillenbrand, 2015).. The stars that harbor disks in a given population can be identified using either accretion signatures or infrared (IR) excess emission from cool dust, where the latter is usually easier to measure for large samples of stars. To detect disks via IR excesses, the imaging should be performed at wavelengths that are long enough that typical disks dominate the stellar photospheres (i.e., excesses are large) but short enough that the sensitivity reaches photospheric flux levels, which corresponds to 4–10 µm. Observations at longer IR wavelengths are also useful for detecting more evolved disks that have developed inner holes and thus lack the hot dust that produces excesses at µm.
The Spitzer Space Telescope (Fazio et al., 2004; Rieke et al., 2004; Werner et al., 2004) and the Wide-field Infrared Survey Explorer (WISE, Wright et al., 2010) have been the best available facilities for detecting disks via IR excesses. Spitzer offered higher sensitivity and angular resolution while WISE provided data for the entire sky, making them well-suited for compact star-forming clusters (e.g., Lada et al., 2006; Sicilia-Aguilar et al., 2006; Cieza et al., 2007; Currie et al., 2007; Hernández et al., 2007; Luhman et al., 2008) and widely-distributed associations (Rizzuto et al., 2012), respectively. Based on data from Spitzer and WISE, disk fractions decrease significantly between ages of 1–10 Myr with low-mass stars experiencing the slowest decline (Carpenter et al., 2006; Kennedy & Kenyon, 2009; Ribas et al., 2015). A substantial fraction of low-mass stars retain disks at ages of Myr (%, Luhman & Esplin, 2020) and a few at ages of 20–50 Myr have been found to harbor disks that may be primordial (White & Hillenbrand, 2005; Hartmann et al., 2005; Boucher et al., 2016; Silverberg et al., 2016, 2020; Murphy et al., 2018; Lee et al., 2020)222It is unclear whether these disks should be classified as old primordial disks or young debris disks (Flaherty et al., 2019).. Disk fractions for low-mass stars are uncertain at ages beyond 10 Myr because most clusters and associations at those ages are too distant for available mid-IR data to reach 0.1 or have insufficient numbers of known members for good statistical constraints.
The oldest populations in the Scorpius-Centaurus complex (Sco-Cen, Preibisch & Mamajek, 2008) contain several thousand stars with ages of 20 Myr and distances of 100–200 pc (Damiani et al., 2019; Luhman & Esplin, 2020), making Sco-Cen the most promising site for measuring a disk fraction for low-mass stars at an age greater than 10 Myr. The primary obstacle in capitalizing on Sco-Cen for that purpose has been the difficulty in identifying its members, which are distributed across a large area of sky (). The high-precision astrometry and photometry from the Gaia mission (Perryman et al., 2001; de Bruijne, 2012; Gaia Collaboration et al., 2016) have made it possible to perform a thorough census of Sco-Cen down to the hydrogen burning mass limit. Several studies have used Gaia data to identify candidate members of populations within Sco-Cen (e.g., Damiani et al., 2019; Galli et al., 2020) and some of those candidates have been examined for evidence of disks (e.g., Goldman et al., 2018; Teixeira et al., 2020). I have used the early installment of the third data release of Gaia (EDR3, Gaia Collaboration et al., 2021) to perform a census of the stellar populations in the Sco-Cen complex (Luhman, 2021). In this paper, I present a census of the circumstellar disks among those candidate members based on mid-IR photometry from WISE.
2. Identification of Disks in Sco-Cen
2.1. Gaia Census of Stellar Members of Sco-Cen
Early studies of the Sco-Cen OB association divided it into three subgroups that are adjacent on the sky: Upper Sco, Upper Centaurus-Lupus (UCL), and Lower Centaurus-Crux (LCC, Blaauw, 1964; de Zeeuw et al., 1999). UCL and LCC are now known to form a single continuous distribution of stars that extends across Upper Sco (Rizzuto et al., 2011; Luhman, 2021). Age estimates for Upper Sco and UCL/LCC have ranged from 5–12 Myr and 15–21 Myr, respectively (de Geus et al., 1989; Preibisch et al., 2002; Pecaut et al., 2012; Song et al., 2012; Herczeg & Hillenbrand, 2015; Pecaut & Mamajek, 2016; David et al., 2019; Luhman & Esplin, 2020; Luhman, 2021), where the older values are favored by the more recent work. Gaia data have revealed an additional group associated with the star V1062 Sco that is coeval with UCL/LCC (Röser et al., 2018; Damiani et al., 2019). These populations contain several thousand stars and overlap spatially and kinematically with smaller groups of younger stars ( Myr) associated with the Ophiuchus and Lupus clouds.
In Luhman (2021), I performed a survey for members of the populations in the Sco-Cen complex – Upper Sco, UCL/LCC, the V1062 Sco group, Ophiuchus, and Lupus – using astrometry and photometry from Gaia EDR3333The photometry from Gaia is in bands at 3300–10500 Å (), 3300–6800 Å (), and 6300-10500 Å ().. That analysis identified 10,509 candidate members of Sco-Cen with parallax errors of mas and 195 additional sources that did not satisfy the kinematic criteria for membership but that are possible companions to candidates in the first sample based on their small separations () and positions in color-magnitude diagrams (CMDs), IR excesses, or roughly similar proper motions and parallaxes. Spectral classifications were available for more than 3000 candidates, and extinctions were derived for those stars from optical and near-IR colors (e.g., ) relative to the typical intrinsic values for young stars. For the remaining candidates, both spectral types and extinctions were estimated by dereddening their observed colors to the sequences of intrinsic colors in color-color diagrams.
2.2. Compilation of Infrared Photometry
WISE is the only available source of mid-IR photometry for most of the candidate members of Sco-Cen from Luhman (2021). As discussed in that study, all candidates that are not blended with other stars should be detected by WISE. The Spitzer Space Telescope provided higher sensitivity and angular resolution than WISE, but only a small fraction of the Sco-Cen candidates are within fields imaged by that facility. Most of those stars have been searched for IR excesses from disks with the Spitzer data (e.g., Carpenter et al., 2006; Cieza et al., 2007; Merín et al., 2008).
The images from WISE were obtained in bands centered at 3.4, 4.6, 12, and 22 m, which are denoted as W1, W2, W3, and W4, respectively. I have made use of the data from the WISE All-Sky Source Catalog (Cutri et al., 2012a), the AllWISE Source Catalog, and the AllWISE Reject Table (Cutri et al., 2013). AllWISE is newer than the All-Sky catalog and is more reliable than the Reject Table, so AllWISE is normally preferred, but some stars only have entries in All-Sky or the Reject Table. To facilitate the measurement of mid-IR excesses in the WISE bands, I also have employed near-IR photometry in , , and (1.25, 1.65, 2.16 µm) from the Point Source Catalog of the Two Micron All Sky Survey (2MASS, Skrutskie et al., 2006).
The point spread functions in the images from 2MASS and AllWISE exhibit FWHM2.5–3 and 6–12 (W1–W4), respectively (Skrutskie et al., 2006; Wright et al., 2010). The diffraction limit for Gaia is and the effective resolution of EDR3 is (Fabricius et al., 2021). Because of its much higher resolution, Gaia frequently resolves groups of closely spaced stars that appear as single unresolved sources in 2MASS and WISE.
The candidate members of Sco-Cen from Luhman (2021) were selected from Gaia EDR3. For each candidate, I calculated its expected position at an epoch of 2010.5 (near the midpoint of the WISE survey) based on the Gaia astrometry and identified the closest matching source within in each of the three WISE catalogs mentioned previously. I selected as the matching threshold because it should be large enough to capture nearly all true matches. A smaller threshold for a more reliable sample of matches can be applied in later analysis as necessary (e.g., Section 3.1). I preferred the matches from AllWISE even if matches from the other two catalogs were somewhat closer. Therefore, I adopted the match from AllWISE unless one of the other two catalogs offered a match that was closer to the Gaia source by at least , in which case I adopted that match. A threshold of was adopted because most matching sources between AllWISE and All-Sky have separations less than that value. In other words, if AllWISE and All-Sky sources are separated by , they are likely the same object, whereas a larger separation indicates that they may correspond to different objects. The adopted WISE match for each Gaia source is provided in the tables of candidates from Luhman (2021). Those tables also include the separation between each Gaia source and its WISE match (at 2010.5) and a flag indicating whether the Gaia source is the closest match in EDR3 for the WISE source. The latter flag is useful because it is common for multiple Gaia sources to have the same WISE source as their closest match. Whereas Luhman (2021) presents tables of Gaia sources (and the Gaia data) and the names of matching sources in WISE (and 2MASS), Table 1 compiles all of those WISE matches and their data from WISE. The tables from Luhman (2021) contain a total of 10,704 Gaia sources while Table 1 contains 9675 WISE sources. The latter number is smaller because a given WISE source can be matched to multiple Gaia sources and some Gaia sources lack WISE counterparts within , which is usually due to blending with other stars. For each WISE source, Table 1 also includes the name of the closest match in 2MASS within , the separation between the 2MASS and WISE sources, and the photometry from 2MASS.
Spurious detections in the WISE catalogs are increasingly common in the bands at longer wavelengths. Therefore, I visually inspected the AllWISE Atlas images of all WISE matches to candidate members of Sco-Cen to check for false detections. The latter are indicated by a flag in Table 1. If a photometric measurement is flagged as a false detection, it has been omitted from Table 1 and is not used in this work. Since the WISE images are less sensitive to stellar photospheres at longer wavelengths, all WISE sources in Table 1 have detections in W1 and the fraction with detections decreases from W2 through W4.
While inspecting the WISE images, I identified 21 sources whose centroids shifted significantly () between W1 and W3/W4. In each case, the four bands of data are associated with a single WISE source, but the detections at shorter and longer wavelengths likely correspond to different objects. Most of these blended pairs are resolved by Gaia EDR3. In Table 2, I present the names of the WISE sources and the names of the Gaia sources that likely dominate in W1 and W3/W4. I also indicate whether each pair could be a binary system based on a comparison of the parallaxes and proper motions of the components. Most of the pairs are possible binary systems. In those systems, the dominance of the secondaries in W3 or W4 indicates that they likely harbor disks. Two of the objects that are responsible for the W3/W4 emission are classified as field stars based on the Gaia data. Two of the sources that dominate at W3/W4 are not detected by Gaia, which may be disk-bearing companions with very low masses or unrelated objects (e.g., galaxies). If the source dominating in W3/W4 is not a candidate member of Sco-Cen from Luhman (2021) that is matched to the WISE source in that study, then the W3 and W4 detections are flagged as false in Table 1.
2.3. Measurement of Infrared Excesses
I have searched for evidence of disks among the WISE sources in Table 1 by checking for emission in the WISE bands in excess above that expected from stellar photospheres. I have measured excesses in W2, W3, and W4 using colors between those bands and W1. The band is frequently used as an alternative to W1 when measuring excesses in mid-IR bands. has the advantage of producing somewhat larger color excesses while W1 avoids errors in excesses due to variability and is better matched to the other WISE bands in angular resolution. The two bands produce very similar results when identifying excesses in W2–W4.
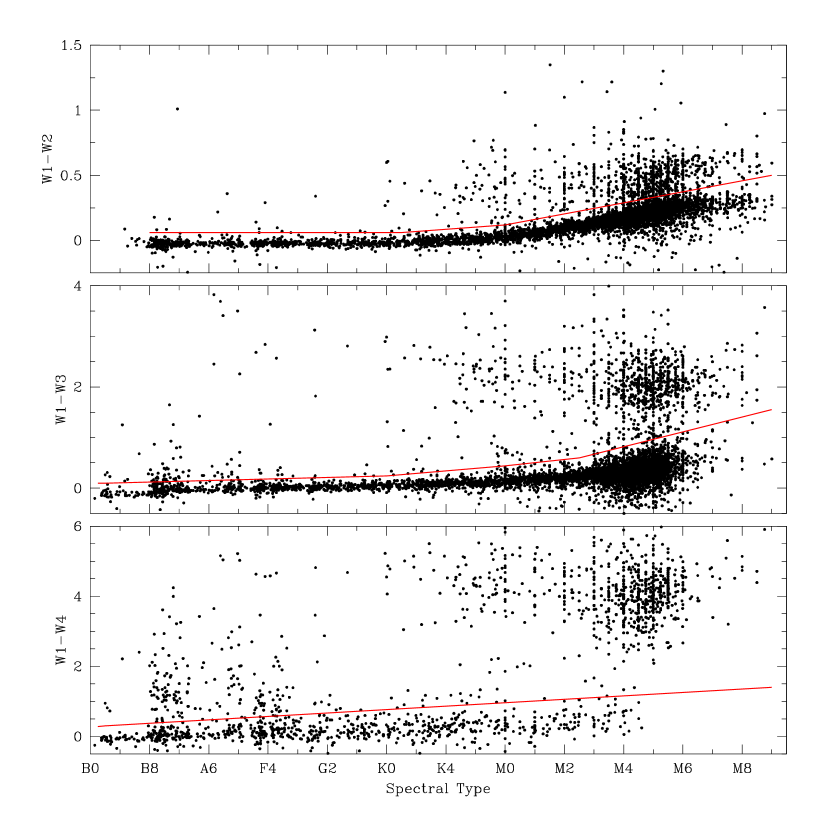
In Figure 1, I have plotted extinction-corrected W1W2, W1W3, and W1W4 versus spectral type for the WISE sources from Table 1 that are within of a Gaia candidate from Luhman (2021). The W2 data at W26 have been omitted since they are subject to significant systematic errors (Cutri et al., 2012b). I have adopted the spectral types and extinction estimates for the Gaia candidates from Luhman (2021) (see Section 2.1). For each of the three WISE colors in Figure 1, the data exhibit a well-defined sequence of blue sources and a broader distribution of redder sources that correspond to stellar photospheres and disk-bearing stars, respectively. The spectral types earlier than M0 have been shifted by random amounts between subclass in Figure 1 to give each photospheric sequence a smoother appearance. As mentioned in the previous section, the WISE data are less sensitive to photospheres at longer wavelengths, which is reflected in the limiting spectral types reached by the photospheric sequences.
In each diagram in Figure 1, I have marked the threshold that I have used for identifying color excesses. If a star appears above the threshold for an excess in a given band but a detection in any band at a longer wavelength is consistent with a photosphere, an excess is not assigned to the first band. For the small fraction of the WISE sources (%) that are separated by from a Gaia candidate, it was unclear whether the spectral type and extinction of the latter could be adopted, so I identified excesses with diagrams like those in Figure 1 with W1 as a substitute for spectral type and no correction for extinction.
Table 1 contains three flags that indicate whether excesses were identified in W2, W3, and W4. Flags are absent for non-detections. Eight sources are detected only in W1, so they lack excess flags. Two of those objects do have disk classifications from previous work that are based on Spitzer data. I have previously used WISE to search for disks among some of the sources in Table 1 (Luhman & Mamajek, 2012; Esplin et al., 2018; Esplin & Luhman, 2020; Luhman & Esplin, 2020; Luhman, 2020). A small number of those excess classifications have changed in this work, primarily for data that are near the excess thresholds.
2.4. Classification of Disks
For each source from Table 1 that exhibits IR excess emission, I have classified the evolutionary stage of its disk from among the following options (Kenyon & Bromley, 2005; Rieke et al., 2005; Hernández et al., 2007; Luhman et al., 2010; Espaillat et al., 2012): full disks are optically thick at IR wavelengths and lack significant clearing of primordial dust and gas; transitional disks have large inner holes in their dust components; evolved disks are becoming optically thin at IR wavelengths but have not experienced significant clearing; evolved transitional disks are optically thin and have large inner holes; debris disks consist of second-generation dust produced by collisions of planetesimals. All of these classes except for the latter are considered primordial disks. For reference, young stars can be classified based on the presence or absence of a disk or infalling envelope (Lada & Wilking, 1984; Lada, 1987; André et al., 1993; Greene et al., 1994): classes 0 and I (protostar with an infalling envelope and a primordial disk), class II (star with a primordial disk but no envelope), and class III (star that no longer has a primordial disk but that can have a debris disk).
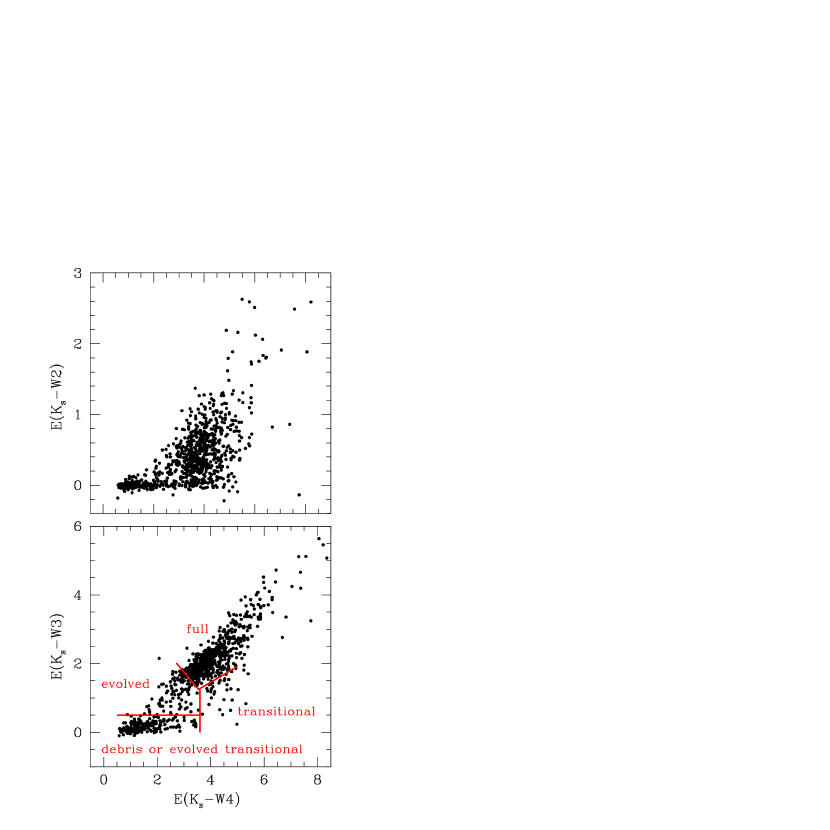
I have assigned disk classes based on the sizes of the excesses in W3 and W4 as done in my previous disk surveys with WISE (Luhman & Mamajek, 2012; Esplin et al., 2014, 2018). If a given WISE source is separated by from the nearest 2MASS source, the value of from 2MASS is used for calculating those colors. The color excesses, E(W3) and E(W4), are then calculated by subtracting the estimated reddening and the expected photospheric color for the spectral type in question (Luhman, 2021). Otherwise, if the WISE/2MASS separation is , I have derived color excesses relative to W1, namely E(W1W3) and E(W1W4), which serve as lower limits on E(W3) and E(W4) given that E(W3)=E(W1)+E(W1W3) and E(W4)=E(W1)+E(W1W4). These limits should be close to the actual values for most sources since most (94%) disk-bearing members of Sco-Cen with data have E(W1)0.5. The estimates of E(W3) and E(W4) are plotted in Figure 2 with the criteria for the disk classes (Esplin et al., 2018). As indicated in that diagram, the same criteria are used for debris and evolved transitional disks, which are indistinguishable in mid-IR data. If a source has a detection in W3 but not W4, I have classified it in the following manner: full disk for E(W3)1.25, evolved or transitional for E(W3)=0.5–1.25, and debris or evolved transitional for E(W3)0.5. An object that has an excess in W2 and lacks detections in W3 and W4 is listed as a full disk since most disks that have W2 excesses are full (e.g., Luhman & Mamajek, 2012). I also have included a diagram with E(W2) in Figure 2 to illustrate the sizes of the excesses in W2.
Sources that lack excesses in any of the WISE bands are omitted from Figure 2. Those stars are designated as class III unless previous photometry from Spitzer has detected excesses at wavelengths in which WISE lacks detections, in which case the disk classifications from Spitzer are adopted (e.g., Luhman & Mamajek, 2012; Esplin et al., 2018). For instance, some sources have photospheric fluxes in W2 and W3 and lack detections in W4 but have excesses detected by more sensitive Spitzer data in a band similar to W4. A few sources are listed as Be stars based on previous work (Hiltner et al., 1969; Houk, 1975; Irvine, 1990; Rivinius et al., 2013). Most protostars in Sco-Cen (which reside in Ophiuchus and Lupus) are absent from Table 1 because they are too faint at optical wavelengths for Gaia detections. Some of the early-type stars have larger IR excesses than expected from my adopted criteria for debris and evolved transitional disks but have been previously classified as debris disks with unusually large amounts of hot dust (Chen et al., 2006, 2011, 2012, 2014; Moór et al., 2011; Melis et al., 2013; Vican et al., 2016). Those objects are listed as debris disks in my catalog. All objects in Table 1 have disk classifications except for six stars that lack detections in Spitzer or WISE bands longward of W1.
IR excesses are detected by WISE or Spitzer for 1340 of the 9675 sources in Table 1, 1297 of which are within the Sco-Cen boundary from de Zeeuw et al. (1999). The latter consist of six Be stars and 822 full, 43 transitional, 124 evolved, seven debris, 244 debris or evolved transitional, and 51 evolved or transitional disks. Approximately 900 of these disks have been reported in previous studies (Mamajek et al., 2002; Rieke et al., 2005; Carpenter et al., 2006, 2008, 2009; Allers et al., 2007; Padgett et al., 2006, 2008; Cieza et al., 2007, 2010; Chen et al., 2005, 2011, 2012; Chapman et al., 2007; Scholz et al., 2007; Merín et al., 2008; Riaz et al., 2009, 2012; Spezzi et al., 2011; Luhman & Mamajek, 2012; Rizzuto et al., 2012, 2015; Schneider et al., 2012; Dawson et al., 2013; Cotten & Song, 2016; Pecaut & Mamajek, 2016; Esplin et al., 2018; Goldman et al., 2018; Esplin & Luhman, 2020; Luhman & Esplin, 2020; Teixeira et al., 2020; Luhman, 2020). The remaining 400 disks are newly identified in this work. In Luhman (2021), I used my census of Sco-Cen with Gaia EDR3 to examine the membership of the stars from some of the previous disk surveys. Many of the samples contained mixtures of field stars and members of multiple Sco-Cen populations, which can have an impact on the interpretation of the data in terms of disk statistics. In addition, there are differences between this work and previous surveys in terms of whether disks are detected for specific stars. For instance, some of WISE data previously identified as excess emission are flagged as false or unreliable detections in my catalog. As a reminder, my census of disks is restricted to candidate members of Sco-Cen identified with Gaia EDR3. Some of the previous disk surveys include candidate members that lack parallax measurements from Gaia, such as those with high extinction or very low masses.
2.5. Candidates for Edge-on Disks
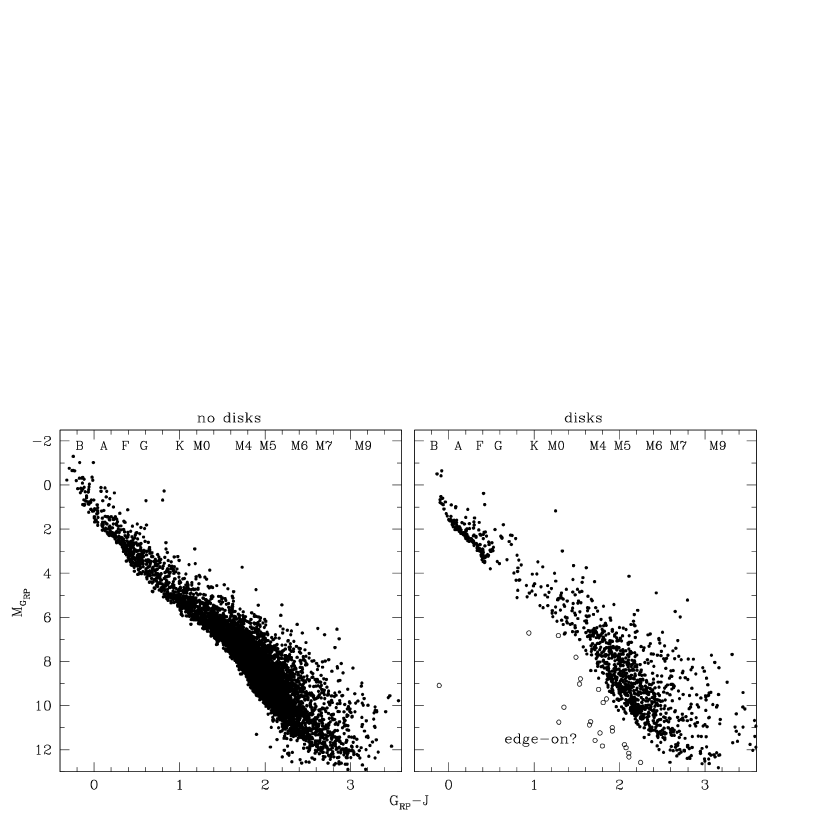
Young stars that are occulted by edge-on disks are often observed primarily in scattered light at optical and near-IR wavelengths. As a result, they can appear unusually faint at a given color or spectral type. I have attempted to use this signature to identify candidates for edge-on disks among the sources in Table 1 that exhibit IR excesses. I have selected a CMD constructed from the reddest Gaia band, , and because they should contain the minimum amount of accretion-related emission (bright in the UV) and dust emission (bright in the mid-IR) among the available bands of photometry. In Figure 3, I have plotted diagrams of versus for WISE sources from Table 1 that are separated by from Gaia candidates from Luhman (2021) that have mas, renormalized unit weight error (RUWE), and positions within the boundary of Sco-Cen from de Zeeuw et al. (1999). Sources with and without IR excesses from disks are shown in separate diagrams. The sequence of diskless stars exhibits a well-defined lower boundary. It is only at the faintest magnitudes that a few diskless stars appear below the sequence formed by the bulk of the population. Meanwhile, the disk-bearing sample contains a few dozen stars that are unusually faint for their colors compared to the diskless stars, and thus are candidates for edge-on disks. Those stars have “edge-on?” appended to their disk classifications in Table 1. Ten of the candidates have previous spectroscopy that confirms their youth (Luhman, 2021, references therein), one of which is the star associated with HH 55. Many of the edge-on candidates are possible members of Upper Sco and UCL/LCC (Luhman, 2021), which have ages of and 20 Myr, respectively. Edge-on primordial disks at those relatively advanced ages could be valuable for studies of disk structure.
2.6. Estimate of Contamination among IR Excesses
It is possible that some of the IR excesses detected toward candidate members of Sco-Cen are due to very red background objects rather than circumstellar disks. I have estimated the rate of such contamination among excesses detected in W3 or W4. The AllWISE Source Catalog contains 732,000 sources that have W1W31 or W1W41, photometric errors less than 0.1 mag in these bands, and positions within the boundary of Sco-Cen from de Zeeuw et al. (1999). Based on the corresponding surface density, of the sources in Table 1 are expected to have red contaminants of that kind within angular separations of . If a contaminant is more widely separated than that value, its centroid in W4 is likely to be noticeably offset from the centroid of the Sco-Cen candidate in W1 (Table 2). The contamination estimate should be an upper limit since some of the red background objects will not be sufficiently bright to produce an IR excess when blended with the Sco-Cen candidates. The presence of disks among the IR excess sources can be verified through spectroscopy of accretion signatures and through high-resolution astrometry of the long-wavelength components for comparison to the Gaia positions of the short-wavelength components.
3. Properties of the Disk Populations in Sco-Cen
3.1. Adopted Samples
In Luhman (2021), to characterize the stellar populations in Sco-Cen, I defined samples of candidate members that were meant to have minimal contamination from field stars and between Sco-Cen populations. I also use those samples of Gaia candidates in this work when characterizing the disk populations in Sco-Cen. The samples consist of candidates with RUWE1.6, mas, and or that have 1) Ophiuchus kinematics and a location within the boundary of Ophiuchus from Esplin et al. (2018); 2) Upper Sco kinematics and a location outside of Ophiuchus and within the triangular field from Luhman & Esplin (2020); 3) Lupus kinematics and a location within the fields toward clouds 1–4 from Luhman (2020); 4) V1062 Sco kinematics and a location within a radius of from the center of that group; and 5) UCL/LCC kinematics and a location within the boundary from de Zeeuw et al. (1999) and not within the fields for the other four samples. For the disk analysis, I apply additional criteria to the candidates: detections in W2, W3, or W4 are available so that an assessment of IR excess was made; the WISE/Gaia separations are ; the Gaia candidates are the closest matches for the WISE sources (i.e., exclude a Gaia candidate if its best WISE match is closer to a different Gaia source). In addition, the UCL/LCC candidates with or are excluded since they appear to be slightly younger than the remainder of that population (Luhman, 2021).
3.2. Comparison of Disk Populations within Sco-Cen
Among the Gaia-selected candidate members, extinctions extend to higher values in Ophiuchus than in any of the other Sco-Cen populations (Luhman, 2021). The Ophiuchus clouds also exhibit higher levels of extinction than the Lupus clouds (Lombardi et al., 2008). As a result, a substantial fraction of Ophiuchus members are too reddened for Gaia detections. For instance, the census of Ophiuchus from Esplin & Luhman (2020) contains objects with spectral types of M6 that lack Gaia parallaxes, most of which have . The disk fraction is somewhat higher among those stars (2/3) than among the members in the Gaia-selected sample (1/2). In comparison, IR imaging of the Lupus clouds has identified only a few candidate members that lack Gaia detections because of high extinction (Luhman, 2020). The remaining populations in Sco-Cen are older and have little obscuration (Luhman, 2021), so the completeness of their disk fraction samples is unaffected by extinction.
The Gaia-selected samples defined in the previous section have (Ophiuchus), 62/93 (Lupus), 273/1098 (Upper Sco), 23/337 (V1062 Sco), and 488/4889 (UCL/LCC) based on the data in Table 1. The fractions decrease from Ophiuchus/Lupus to Upper Sco to V1062 Sco/UCL/LCC, which is correlated with increasing age, as expected. The disk fraction in the V1062 Sco group is roughly similar to that in UCL/LCC, which is consistent with the fact that they have similar ages (Luhman & Esplin, 2020; Luhman, 2021). Given the sizes of the samples in V1062 Sco and UCL/LCC, the latter provides much better statistical constraints on disk fractions at the age of the two populations. Therefore, the V1062 Sco group is omitted from the remainder of the disk analysis.
To further illustrate the evolution of the Sco-Cen disk populations with age, I have plotted in Figure 4 E(W3) and E(W4) for the disk-bearing objects in the samples for Ophiuchus, Lupus, Upper Sco, and UCL/LCC. As seen in previous disk surveys (Luhman et al., 2010; Espaillat et al., 2014), Figure 4 shows that the youngest populations contain primarily full disks while disks in the more advanced stages become increasingly common in older regions. Ophiuchus contains 50 previously proposed members that exhibit IR excesses and are too obscured for Gaia detections, and hence are absent from the sample shown in Figure 4 (Evans et al., 2009). Two objects of that kind are present in the Lupus clouds, consisting of IRAS 153983359 and IRAS 160593857/Lupus 3 MMS (Merín et al., 2008). Those embedded sources in Ophiuchus and Lupus, many of which are protostellar, overlap with the full disks in Figure 4 and extend to redder colors.
3.3. Excess and Disk Fractions for Upper Sco and UCL/LCC
Because Upper Sco and UCL/LCC contain a large majority of the stars in Sco-Cen, they are the best populations in Sco-Cen for measuring excess and disk fractions as a function of spectral type, which serves as a proxy for stellar mass. Measurements of that kind have been performed with previous samples of candidates in Upper Sco using photometry from Spitzer and WISE (Carpenter et al., 2006, 2009; Luhman & Mamajek, 2012; Luhman & Esplin, 2020). The most recent study, Luhman & Esplin (2020), considered a sample of candidates that extended across a large field toward Upper Sco and that included objects that had been vetted with Gaia DR2 data and sources that lacked Gaia parallaxes (e.g., brown dwarfs). In this work, my sample is restricted to candidates selected from Gaia EDR3 within a smaller field that encompasses the central concentration of Upper Sco members (Section 3.1) in order to minimize contamination from UCL/LCC, which overlaps spatially and kinematically with Upper Sco (Luhman, 2021). As a result, the sample from Luhman & Esplin (2020) provides better statistical constraints on excess fractions (particularly at early types) and reaches later spectral types while the sample in this work should have better reliability.
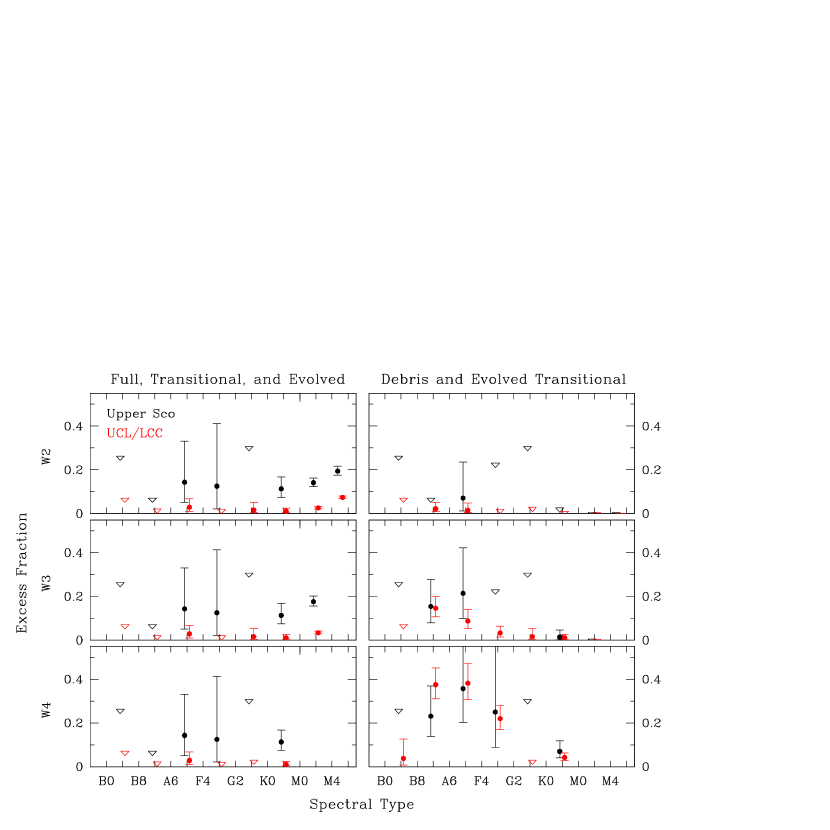
For the Upper Sco and UCL/LCC samples defined in Section 3.1, I have calculated excess fractions in W2, W3, and W4 for up to eight ranges of spectral type between B0 and M6. All sources in these samples have detections in W2 but some are not detected in W3 and W4. For the latter bands, the excess fractions are reported only for ranges of spectral type in which most candidates have detections so that the measurements are not biased against the faintest stars at given spectral type, which tend to be those with little or no excess. As done in Luhman & Mamajek (2012) and Luhman & Esplin (2020), I calculate one excess fraction for three classes of primordial disks (full, evolved, transitional) and one for debris and evolved transitional disks. The latter two classes are combined because they are indistinguishable in the available mid-IR data. Be stars are included among the sources that lack excesses since their IR emission does not arise from primordial or debris disks (Rivinius et al., 2013). The statistical errors in the excess fractions are taken from Gehrels (1986).
If some of the candidate members of Upper Sco and UCL/LCC are field stars, the excess fractions would be underestimated since field stars are unlikely to exhibit IR excesses. In Luhman (2021), I estimated the amount of field star contamination among the candidate members of Sco-Cen considered in this work. Among the spectral type ranges in which excess fractions are calculated, the highest contamination should occur at F4–G2, where of the 89 UCL/LCC candidates are expected to be field stars. The estimated contamination is lower (%) in all other spectral type ranges for UCL/LCC. The contamination should be much lower in the Upper Sco sample due to the small size of the field in which candidates were selected. Thus, field star contamination may lead to slightly underestimated excess fractions in UCL/LCC at F4–G2 and should have negligible effects on all other measurements.
In Tables 3 and 4 and Figure 5, I present the excess fractions in W2, W3, and W4 as a function of spectral type for the samples of candidate members of Upper Sco and UCL/LCC defined in Section 3.1. As in Section 2.3, photometric estimates of spectral types are used when spectroscopic data are not available. The measurements for Upper Sco are qualitatively similar to those for the Upper Sco sample in Luhman & Esplin (2020) except that the statistical errors for the early-type stars are larger in this study because of the smaller field. The most notable feature of the Upper Sco data is the increase in excess fractions with later spectral types, which was first detected by Carpenter et al. (2006). That trend continues beyond the latest spectral type considered here, M6 ( ), down to early L ( ) (Luhman & Mamajek, 2012; Luhman & Esplin, 2020). The debris disk fraction in Upper Sco peaks at A and F types, as discussed in previous work (Carpenter et al., 2009; Chen et al., 2011).
The excess fractions for UCL/LCC represent a significant improvement over previous data in that population because the sample of candidates is much larger and more reliable than those in previous studies, particularly at later spectral types. Like Upper Sco, UCL/LCC exhibits increasing excess fractions with later spectral types and high debris disk fractions among A and F stars. In addition to appearing in the diagram of excess fractions in Figure 5, the sharp drop in debris disk fractions from F to G types is also evident in the CMD of disk-bearing stars in Figure 3. Meanwhile, the excess fractions of primordial disks are lower in UCL/LCC than in Upper Sco at all spectral types, as expected given the difference in ages. The drop in those fractions from Upper Sco to UCL/LCC is larger at earlier types; the ratio of their fractions in W2 is 9.7, 6.1, and 3.0 at K0–M0, M0–M4, and M4–M6, respectively. Upper Sco had previously demonstrated that disks are dispersing more quickly at earlier types by the age Myr, and UCL/LCC shows that the trend continues between 11 and 20 Myr.
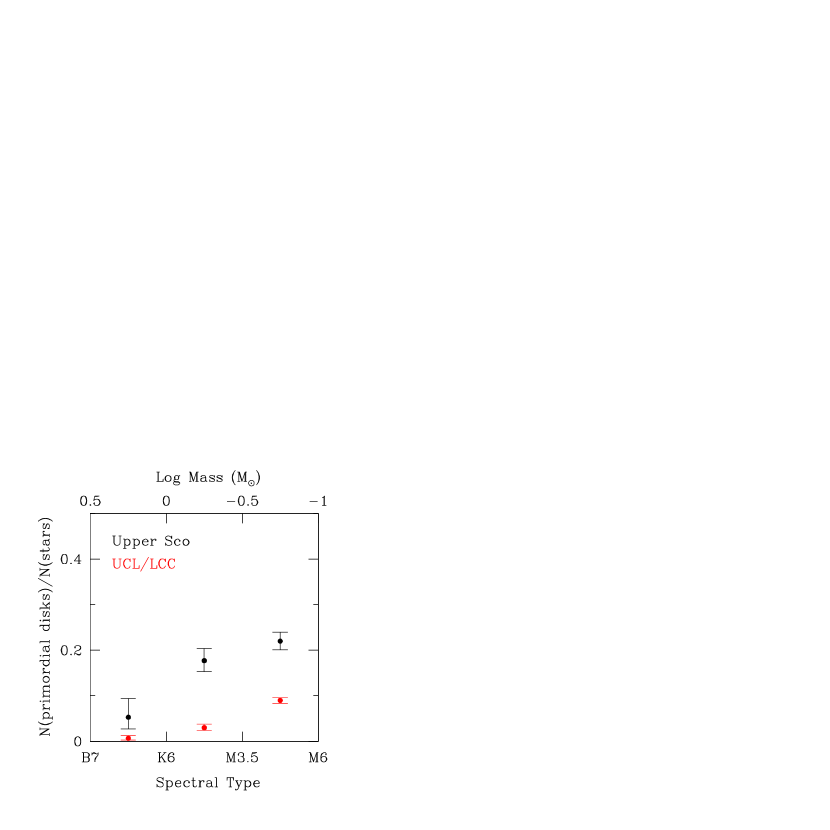
In addition to the excess fractions, I have calculated the primordial disk fractions of the candidates in the Upper Sco and UCL/LCC samples for three ranges of spectral types that correspond roughly to logarithmic intervals of stellar mass (Baraffe et al., 1998, 2015). The numerator in the disk fraction consists of full, evolved, and transitional disks, or all class II objects except evolved transitional disks. The disk fractions are presented in Table 5 and Figure 6. The fractions are lower in UCL/LCC than in Upper Sco by factors of 10, 5.7, and 2.5 at B7–K5.5, K6–M3.5, and M3.75–M6, respectively.
3.4. Relative Ages of Stars with and without Disks
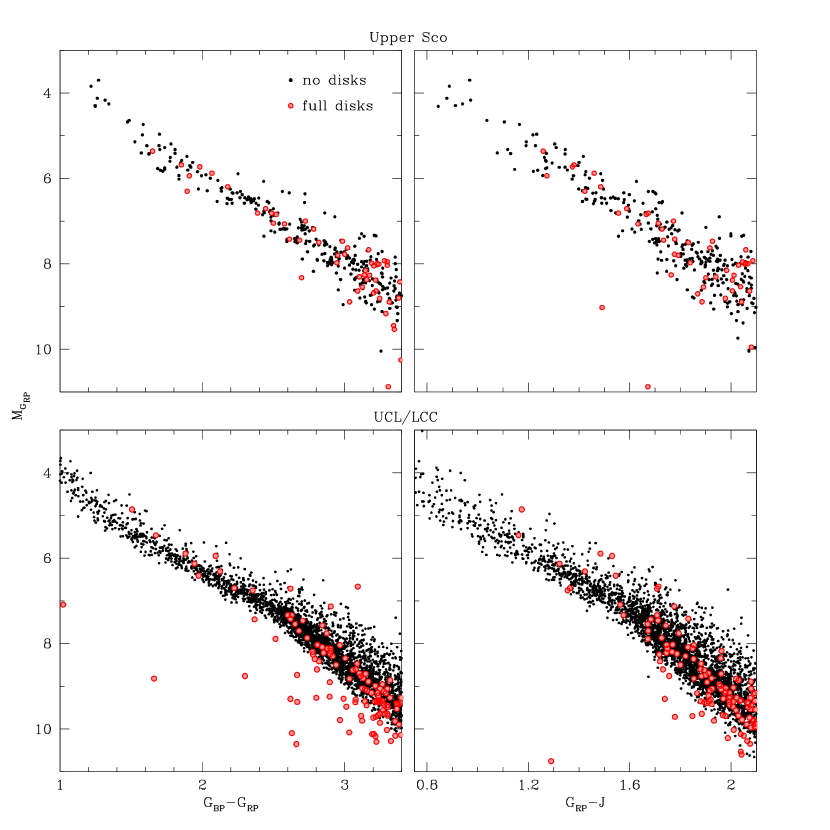
The high-precision parallaxes and photometry from Gaia have facilitated measurements of relative ages of populations in Sco-Cen via their sequences of low-mass stars in the Hertzsprung-Russell (H-R) diagram (e.g., Damiani et al., 2019; Luhman & Esplin, 2020). I have used that method to constrain the relative ages of the disk-bearing and diskless stars in Upper Sco and UCL/LCC. is selected for the vertical axis of the H-R diagram since is less affected by extinction and accretion-related emission than the other two Gaia bands. The diagrams are constructed with colors instead of spectral types (i.e., CMDs) since most low-mass stars in UCL/LCC lack spectroscopy. is used for one of the CMDs as done in Figure 3 (Section 2.5). I also employ a CMD with because both bands have high precision, although some of the disk-bearing stars may have noticeable excesses in due to accretion. I consider the samples of candidate members of Upper Sco and UCL/LCC defined in Section 3.1 with the additional criteria of mas and . A smaller threshold on parallax error is adopted since the relative ages rely on the precisions of the absolute magnitudes. Only stars with low extinction are included to minimize errors in the relative ages due to errors in the extinction corrections. The photometry for the CMDs has been corrected for extinction using the estimates from Luhman (2021).
In Figure 7, I have plotted CMDs for the low-mass stars in Upper Sco and UCL/LCC that have been classified as class III or full disks in Table 1. Only the earliest and latest evolutionary stages are shown in order to facilitate the detection of systematic differences in ages among the stages. For each CMD, I calculated the offsets in of the late-type stars (–3.4, –2.1) from the median sequence for the combined sample of full disks and class III objects. Stars appearing below the sequence in a CMD were excluded from the analysis, most of which are disk-bearing stars and likely have accretion-related emission in or edge-on disks (Section 2.5). I then calculated the difference between the median offsets for the two evolutionary stages for a given CMD and population. The error in the difference was characterized using the median absolute deviation for the distribution of differences produced by bootstrapping. The resulting differences in from the and CMDs are and mag for Upper Sco and and mag for UCL/LCC where positive values correspond to older ages for the full disks. Thus, I do not find any significant differences in the ages of full disks and class III objects in Upper Sco or UCL/LCC. For perspective, a difference of 0.1 mag in luminosity is predicted to correspond to 0.06 dex in age for low-mass stars at 10–20 Myr (Baraffe et al., 2015; Choi et al., 2016; Dotter, 2016; Feiden, 2016).
4. Conclusions
I recently used data from Gaia EDR3 to identify candidate members of the stellar populations within the Sco-Cen complex (Luhman, 2021), which consist of Ophiuchus, Lupus, Upper Sco, the V1062 Sco group, and UCL/LCC. In this study, I have performed a survey for circumstellar disks among those candidates using mid-IR photometry from WISE. The results are summarized as follows:
-
1.
In Luhman (2021), I used astrometry and photometry from Gaia EDR3 to identify 10,509 candidate members of Sco-Cen. I also presented 195 additional sources that did not satisfy the kinematic criteria for membership but that are possible companions to candidates in the first sample. The tabulations of those candidates in Luhman (2021) included the names of the closest 2MASS and WISE sources within . The 9675 matching WISE sources are compiled in Table 1, which contains their photometry from 2MASS and WISE. I have inspected the WISE images for all objects and have flagged detections that appear to be false or unreliable.
-
2.
I have used the WISE colors to identify sources in Table 1 that exhibit IR excesses from disks and I have classified the evolutionary stages of the detected disks using the sizes of the excesses. IR excesses are detected for more than 1200 of the WISE sources that are within the Sco-Cen boundary from de Zeeuw et al. (1999), of which are newly detected in this work. Because of its proximity and size, UCL/LCC offers the largest available sample of disks (500) for any population near its age (20 Myr). Among the disk-bearing objects in Sco-Cen, I have identified 23 candidates for edge-on disks based on their unusually faint positions in a CMD.
-
3.
For the two largest stellar populations in Sco-Cen, Upper Sco and UCL/LCC, I have measured the fractions of sources that have excesses in W2, W3, and W4 as a function of spectral type. Separate excess fractions are reported for disks that are full, transitional, or evolved and disks that are evolved transitional or debris. In addition, I have measured the fractions of sources with disks that are full, transitional, or evolved (i.e., class II objects with the exception of evolved transitional disks). The new excess and disk fractions in Upper Sco are qualitatively similar to measurements for earlier samples of candidate members (Carpenter et al., 2006; Luhman & Mamajek, 2012; Luhman & Esplin, 2020). As found in the previous work, the most notable feature of the data in Upper Sco is an increase in disk fractions with later spectral types, which indicates that disk lifetimes are longer for stars at lower masses.
-
4.
The new census of stars and disks in UCL/LCC ( Myr) has provided the tightest statistical constraints to date on the disk fractions of low-mass stars for any single age beyond that of Upper Sco ( Myr). As in Upper Sco, the disk fraction in UCL/LCC is higher at later spectral types. That trend is more pronounced in UCL/LCC, where the fractions are lower than those in Upper Sco by factors of 10, 5.7, and 2.5 at B7–K5.5, K6–M3.5, and M3.75–M6, respectively. The data in UCL/LCC also demonstrate that the disk fraction for low-mass stars remains non-negligible at an age of 20 Myr (0.090.01).
-
5.
I have used CMDs to constrain the relative ages of disk-bearing and diskless low-mass stars in Upper Sco and UCL/LCC. No significant differences in ages are found at a level of dex.
References
- Allers et al. (2007) Allers, K. N., Jaffe, D. T., Luhman, K. L., et al. 2007, ApJ, 657, 511
- André et al. (1993) André, P., Ward-Thompson, D., & Barsony, M. 1993, ApJ, 406, 122
- Baraffe et al. (1998) Baraffe, I., Chabrier, G., Allard, F., & Hauschildt, P. H. 1998, A&A, 337, 403
- Baraffe et al. (2015) Baraffe, I., Hormeier, D., Allard, F., & Chabrier, G. 2015, A&A, 577, 42
- Bell et al. (2013) Bell, C. P. M., Naylor, T., Mayne, N. J., Jeffries, R. D., & Littlefair, S. P. 2013, MNRAS, 434, 806
- Blaauw (1964) Blaauw, A. 1964, ARA&A, 2, 213
- Boss (1998) Boss, A. P. 1998, ApJ, 503, 923
- Boucher et al. (2016) Boucher, A., Lafrenière, D., Gagné, J., et al. 2016, ApJ, 832, 50
- Carpenter et al. (2008) Carpenter, J. M., Bouwman, J., Silverstone, M. D., et al. 2008, ApJS, 179, 423
- Carpenter et al. (2006) Carpenter, J. M., Mamajek, E. E., Hillenbrand, L. A., & Meyer, M. R. 2006, ApJ, 651, L49
- Carpenter et al. (2009) Carpenter, J. M., Mamajek, E. E., Hillenbrand, L. A., & Meyer, M. R. 2009, ApJ, 705, 1646
- Chapman et al. (2007) Chapman, N. L., Lai, S.-P., Mundy, L. G., et al. 2007, ApJ, 667, 288
- Chen et al. (2005) Chen, C. H., Jura, M., Gordon, K. D., & Blaylock, M. 2005, ApJ, 623, 493
- Chen et al. (2011) Chen, C. H., Mamajek, E. E., Bitner, M. A., et al. 2011, AJ, 738, 122
- Chen et al. (2014) Chen, C. H., Mittal, T., Kuchner, M., et al. 2014, ApJS, 211, 25
- Chen et al. (2012) Chen, C. H., Pecaut, M., Mamajek, E. E., Su, K. Y. L., & Bitner, M. A. 2012, ApJ, 756, 133
- Chen et al. (2006) Chen, C. H., Sargent, B. A., Bohac, C., et al. 2006, ApJS, 166, 351
- Choi et al. (2016) Choi, J., Dotter, A., Conroy, C., et al. 2016, ApJ, 823, 102
- Cieza et al. (2007) Cieza, L., Padgett, D. L., Stapelfeldt, K. R., et al. 2007, ApJ, 667, 308
- Cieza et al. (2010) Cieza, L. A., Schreiber, M. R., Romero, G. A., et al. 2010, ApJ, 712, 925
- Cloutier et al. (2014) Cloutier, R., Currie, T., Rieke, G. H., et al. 2014, ApJ, 796, 127
- Cotten & Song (2016) Cotten, T. H., & Song, I. 2016, ApJS, 225, 15
- Currie et al. (2007) Currie, T., Balog, Z., Kenyon, S. J., et al. 2007, ApJ, 659, 599
- Cutri et al. (2012a) Cutri, R. M., Wright, E. L., Conrow, T., et al. 2012a, yCat, 2311, 0C
- Cutri et al. (2012b) Cutri, R. M., Wright, E. L., Conrow, T., et al. 2012b, Explanatory Supplement to the WISE All-Sky Data Release Products
- Cutri et al. (2013) Cutri, R. M., Wright, E. L., Conrow, T., et al. 2013, yCat, 2328, 0C
- Damiani et al. (2019) Damiani, F., Prisinzano, L., Pillitteri, I., Micela, G., & Sciortino, S. 2019, A&A, 623, A112
- David et al. (2019) David, T. J., Hillenbrand, L. A., Gillen, E., et al. 2019, ApJ, 872, 161
- Dawson et al. (2013) Dawson, P., Scholz, A., Ray, T. P., et al. 2013, MNRAS, 429, 903
- de Bruijne (2012) de Bruijne, J. H. J. 2012, Ap&SS, 341, 31
- de Geus et al. (1989) de Geus, E. J., de Zeeuw, P. T., & Lub, J. 1989, A&A, 216, 44
- de Zeeuw et al. (1999) de Zeeuw, P. T., Hoogerwerf, R., de Bruijne, J. H. J., Brown, A. G. A., & Blaauw, A. 1999, AJ, 117, 354
- Dotter (2016) Dotter, A. 2016, ApJS, 222, 8
- Espaillat et al. (2012) Espaillat, C., Ingleby, L., Hernandez, J., et al. 2012, ApJ, 747, 103
- Espaillat et al. (2014) Espaillat, C., Muzerolle, J., Najita, J., et al. 2014, in Protostars and Planets VI, ed. H. Beuther et al.(Tucson, AZ: Univ. Arizona Press), 497
- Esplin & Luhman (2020) Esplin, T. L., & Luhman, K. L. 2020, AJ, 160, 44
- Esplin et al. (2014) Esplin, T. L., Luhman, K. L., & Mamajek, E. E. 2014, ApJ, 784, 126
- Esplin et al. (2018) Esplin, T. L., Luhman, K. L., Miller, E. B., & Mamajek, E. E. 2018, AJ, 156, 75
- Evans et al. (2009) Evans, N. J., Dunham, M. M., Jørgensen, J. K., et al. 2009, ApJS, 181, 321
- Fabricius et al. (2021) Fabricius, C., Luri, X., Arenou, F., et al. 2021, A&A, 649, A5
- Fazio et al. (2004) Fazio, G. G., Hora, J. L., Allen, L. E., et al. 2004, ApJS, 154, 10
- Feiden (2016) Feiden, G. A. 2016, A&A, 593, A99
- Flaherty et al. (2019) Flaherty, K., Hughes, A. M., Mamajek, E. E., & Murphy, S. J. 2019, ApJ, 872, 92
- Gaia Collaboration et al. (2021) Gaia Collaboration, Brown, A. G. A., Vallenari, A., Prusti, T., et al. 2021, A&A, 649, A1
- Gaia Collaboration et al. (2016) Gaia Collaboration, Prusti, T., de Bruijne, J. H. J., et al. 2016, A&A, 595, A1
- Galli et al. (2020) Galli, P. A. B., Bouy, H., Olivares, J., et al. 2020, A&A, 634, A98
- Gehrels (1986) Gehrels, N. 1986, AJ, 303, 336
- Goldman et al. (2018) Goldman, B., Röser, S., Schilbach, E., Moór, A. C., & Henning, T. 2018, ApJ, 868, 32
- Greene et al. (1994) Greene, T. P., Wilking, B. A., André, P., Young, E. T., & Lada, C. J. 1994, ApJ, 434, 614
- Haisch et al. (2001) Haisch, K. E., Lada, E. A., & Lada, C. J. 2001, ApJ, 553, L153
- Hartmann et al. (2005) Hartmann, L., Calvet, N., Watson, D. M., et al. 2005, ApJ, 628, L147
- Herczeg & Hillenbrand (2015) Herczeg, G. J., & Hillenbrand, L. A. 2015, ApJ, 808, 23
- Hernández et al. (2007) Hernández, J., Hartmann, L., Megeath, T., et al. 2007, ApJ, 662, 1067
- Hiltner et al. (1969) Hiltner, W. A., Garrison, R. F., & Schild, R. E. 1969, ApJ, 157, 313
- Houk (1975) Houk, N. 1975, Michigan Catalogue of Two-dimensional Spectral Types for the HD Stars. Vol. 1, (Ann Arbor: Univ. Mich.)
- Irvine (1990) Irvine, N. J. 1990, PASP, 102, 669
- Kennedy & Kenyon (2009) Kennedy, G. M., & Kenyon, S. J. 2009, ApJ, 695, 1210
- Kenyon & Bromley (2005) Kenyon, S. J., & Bromley, B. C. 2005, AJ, 130, 269
- Lada (1987) Lada, C. J. 1987, in IAU Symp. 115, Star Forming Regions, ed. M. Peimbert & J. Jugaku (Dordrecht: Reidel), 1
- Lada et al. (2006) Lada, C. J., Muench, A. A., Luhman, K. L., 2006, AJ, 131, 1574
- Lada & Wilking (1984) Lada, C. J., & Wilking, B. A. 1984, ApJ, 287, 610
- Lee et al. (2020) Lee, J., Song, I., & Murphy, S. 2020, MNRAS, 494, 62
- Lombardi et al. (2008) Lombardi, M., Lada, C. J., Alves, J. 2008, A&A, 489, 143
- Luhman (2020) Luhman, K. L. 2020, AJ, 160, 186
- Luhman (2021) Luhman, K. L. 2021, AJ, in press
- Luhman et al. (2008) Luhman, K. L., Allen, L. E., Allen, P. R., et al. 2008, ApJ, 675, 1375
- Luhman et al. (2010) Luhman, K. L., Allen, P. R., Espaillat, C., Hartmann, L., & Calvet, N. 2010, ApJS, 186, 111
- Luhman & Esplin (2020) Luhman, K. L., & Esplin, T. L. 2020, AJ, 160, 44
- Luhman & Mamajek (2012) Luhman, K. L., & Mamajek, E. E. 2012, ApJ, 758, 31
- Mamajek (2009) Mamajek, E. E. 2009, in AIP 1158, Exoplanets and Disks: Their Formation and Diversity, ed. T. Usuda, M. Tamura, & M. Ishii (Melville, NY: AIP), 3
- Mamajek et al. (2002) Mamajek, E. E., Meyer, M. R., & Liebert, J. 2002, AJ, 124, 1670
- Mayne & Naylor (2008) Mayne, N. J., & Naylor, T. 2008, MNRAS, 386, 261
- Melis et al. (2013) Melis, C., Zuckerman, B., Rhee, J. H., et al. 2013, ApJ, 778, 12
- Meng et al. (2017) Meng, H. Y. A., Rieke, G. H., Su, K. Y. L., & Gáspár, A. 2017, ApJ, 836, 34
- Merín et al. (2008) Merín, B., Jørgensen, J., Spezzi, L., et al. 2008, ApJS, 177, 551
- Moór et al. (2011) Moór, A., Ábrahám, P., Juhász, A., et al. 2011, ApJ, 740, L7
- Murphy et al. (2018) Murphy, S. J., Mamajek, E. E., & Bell, C. P. M. 2018, MNRAS, 476, 3290
- Padgett et al. (2006) Padgett, D. L., Cieza, L., Stapelfeldt, K. R., et al. 2006, ApJ, 645, 1283
- Padgett et al. (2008) Padgett, D. L., Rebull, L. M., Stapelfeldt, K. R., et al. 2008, ApJ, 672, 1013
- Pecaut & Mamajek (2016) Pecaut, M. J., & Mamajek E. E. 2016, MNRAS, 461, 794
- Pecaut et al. (2012) Pecaut, M. J., Mamajek E. E., & Bubar E. J. 2012, ApJ, 746, 154
- Perryman et al. (2001) Perryman, M. A. C., de Boer, K. S., Gilmore, G., et al. 2001, A&A, 369, 339
- Pollack et al. (1996) Pollack, J. B., Hubickyj, O., Bodenheimer, P., et al. 1996, Icarus, 124, 62
- Preibisch et al. (2002) Preibisch, T., Brown, A. G. A., Bridges, T. Guenther, E., & Zinnecker, H. 2002, AJ, 124, 404
- Preibisch & Mamajek (2008) Preibisch, T., & Mamajek, E. 2008, in Handbook of Star Forming Regions, Vol. 2, The Southern Sky, ASP Monograph Series 5, ed. B. Reipurth (San Francisco, CA: ASP), 235
- Riaz et al. (2009) Riaz, B., Lodieu, N., & Gizis, J. E. 2009, ApJ, 705, 1173
- Riaz et al. (2012) Riaz, B., Lodieu, N., Goodwin, S., Stamatellos, D., & Thompson, M. 2012, MNRAS, 420, 2497
- Ribas et al. (2015) Ribas, Á, Bouy, H., & Merín, B. 2015, A&A, 576, A52
- Richert et al. (2018) Richert, A. J. W., Getman, K. V., Feigelson, E. D., et al. 2018, MNRAS, 477, 5191
- Rieke et al. (2005) Rieke, G. H., Su, K. Y. L., Stansberry, J. A., et al. 2005, ApJ, 620, 1010
- Rieke et al. (2004) Rieke, G. H., Young, E. T., Engelbracht, C. W., et al. 2004, ApJS, 154, 25
- Rivinius et al. (2013) Rivinius, T., Carciofi, A. C., & Martayan, C. 2013, A&ARv, 21, 69
- Rizzuto et al. (2015) Rizzuto, A. C., Ireland, M. J., & Kraus, A. L. 2015, MNRAS, 448, 2737
- Rizzuto et al. (2011) Rizzuto, A. C., Ireland, M. J., & Robertson, J. G. 2011, MNRAS, 416, 3108
- Rizzuto et al. (2012) Rizzuto, A. C., Ireland, M. J., & Zucker, D. B. 2012, MNRAS, 421, L97
- Röser et al. (2018) Röser, S., Schilbach, E., Goldman, B., et al. 2018, A&A, 614, A18
- Schneider et al. (2012) Schneider, A., Song, I., Melis, C., Zuckerman, B., & Bessell, M. 2012, ApJ, 757, 163
- Scholz et al. (2007) Scholz, A., Jayawardhana, R., Wood, K., et al. 2007, ApJ, 660, 1517
- Sicilia-Aguilar et al. (2006) Sicilia-Aguilar, A., Hartmann, L., Calvet, N., et al. 2006, ApJ, 638, 897
- Silverberg et al. (2016) Silverberg, S. M., Kuchner, M. J., Wisniewski, J. P., et a l. 2016, ApJ, 830, L28
- Silverberg et al. (2020) Silverberg, S. M., Wisniewski, J. P., Kuchner, M. J., et a l. 2020, ApJ, 890, 106
- Skrutskie et al. (2006) Skrutskie, M., Cutri, R. M., Stiening, R., et al. 2006, AJ, 131, 1163
- Song et al. (2012) Song, I., Zuckerman, B., & Bessell, M. S. 2012, AJ, 144, 8
- Spezzi et al. (2011) Spezzi, L., Vernazza, P., Merín, B., et al. 2011, ApJ, 730, 65
- Teixeira et al. (2020) Teixeira, P. S., Scholz, A., & Alves, J. 2020, A&A, 642, A86
- Vican et al. (2016) Vican, L., Schneider, A., Bryden, G., et al. 2016, ApJ, 833, 263
- Werner et al. (2004) Werner, M. W., Roellig, T. L., Low, F. J., et al. 2004, ApJS, 154, 1
- White & Hillenbrand (2005) White, R. J., & Hillenbrand, L. A. 2005, ApJ, 621, L65
- Wright et al. (2010) Wright, E. L., Eisenhardt, P. R., Mainzer, A. K., et al. 2010, AJ, 140, 1868
| Column Label | Description |
|---|---|
| wise | Source name from WISE catalogsaaSource name from AllWISE Source Catalog, AllWISE Reject Catalog, or WISE All-Sky Source Catalog. |
| RAdeg | Right ascension (J2000) from WISE |
| DEdeg | Declination (J2000) from WISE |
| 2m | Closest 2MASS source within |
| 2msep | Angular separation between WISE and 2MASS |
| Jmag | 2MASS magnitude |
| e_Jmag | Error in Jmag |
| Hmag | 2MASS magnitude |
| e_Hmag | Error in Hmag |
| Ksmag | 2MASS magnitude |
| e_Ksmag | Error in Ksmag |
| W1mag | WISE W1 magnitude |
| e_W1mag | Error in W1mag |
| f_W1mag | Flag on W1magbbnodet = nondetection; false = detection from WISE catalog appears to be false or unreliable based on visual inspection. |
| W2mag | WISE W2 magnitude |
| e_W2mag | Error in W2mag |
| f_W2mag | Flag on W2magbbnodet = nondetection; false = detection from WISE catalog appears to be false or unreliable based on visual inspection. |
| W3mag | WISE W3 magnitude |
| e_W3mag | Error in W3mag |
| f_W3mag | Flag on W3magbbnodet = nondetection; false = detection from WISE catalog appears to be false or unreliable based on visual inspection. |
| W4mag | WISE W4 magnitude |
| e_W4mag | Error in W4mag |
| f_W4mag | Flag on W4magbbnodet = nondetection; false = detection from WISE catalog appears to be false or unreliable based on visual inspection. |
| ExcW2 | Excess present in W2? |
| ExcW3 | Excess present in W3? |
| ExcW4 | Excess present in W4? |
| DiskType | Disk TypeccCandidates for edge-on disks from Figure 3 have “edge-on?” appended to their disk classifications. |
Note. — This table is available in its entirety in a machine-readable form.
| WISE Source | Dominates at W1aaDesignations are from Gaia EDR3. | Dominates at W3 or W4aaDesignations are from Gaia EDR3. | Possible |
|---|---|---|---|
| Binary? | |||
| WISEA J122420.62544354.1 | 6076080033122502400/6076080033122502528 | 6076080033106941440 | no |
| WISEA J132335.83471846.9 | 6083750638577673088 | 6083750638540951552 | yes |
| WISEA J133255.99580710.8 | 5870395561188264320 | 5870395561176603392 | no |
| WISEA J134906.74441317.8 | 6108605060227272960 | 6108605064523357056 | yes |
| WISEA J140659.03423842.8 | 6109774841820067968 | 6109774841820067072 | yes |
| WISEA J144449.43435008.5 | 6100428065273180672 | 6100428095333967744 | |
| WISEA J145833.85422342.9 | 5908685327718523520 | 5908685332019899520 | |
| WISEA J152759.91320804.8 | 6206980427151256192 | 6206980431449776640 | yes |
| WISEA J153102.01341635.0 | 6014310603731467008/6014310638092127616 | 6014310638092127616 | yes |
| WISEA J153639.94342143.2 | 6014168251335936640 | 6014168251336833024 | |
| WISEA J154335.49384805.2 | 6009110841455006336 | 6009110807095267712 | yes |
| WISEA J155548.78251224.1 | 6235742349962813824 | 6235742349962814592 | yes |
| WISEA J155734.29232112.4 | 6237142264484167296 | 6237142268777708928 | yes? |
| WISEA J160408.41190730.2 | 6247323329838233472/6247323334141396992 | 6247323334141396992 | yes |
| WISEA J160842.76390617.6 | 5997082214303850880 | 5997082218616859264 | yes |
| WISEA J161002.77234440.5 | 6242136319309548928/6242137796783514240 | 6242136319309548928 | yes |
| WISEA J161019.15250230.6 | 6049748791208799488 | 6049748786908497408 | yes |
| WISEA J161343.96373644.3 | 5997644343928854656/5997644343928856704 | 5997644343928854656 | yes |
| WISEA J162459.13252118.2 | 6048951366100474368 | non-Gaia source | |
| WISE J162902.95242749.3 | 6049102587605960064 | 6049102621963483136 | yes |
| WISEA J183123.23344500.5 | 6734855001900424704 | non-Gaia source |
| Spectral Type | MassaaMasses that correspond to the given range of spectral types for an age of 10 Myr (Baraffe et al., 1998, 2015; Choi et al., 2016; Dotter, 2016). | W2 | W3 | W4 |
|---|---|---|---|---|
| () | ||||
| Full, Transitional, and Evolved Disks | ||||
| B0–B8 | 3–18 | 0/7=0.26 | 0/7=0.26 | 0/7=0.26 |
| B8–A6 | 1.8–3 | 0/26=0.07 | 0/26=0.07 | 0/26=0.07 |
| A6–F4 | 1.5–1.8 | 2/14= | 2/14= | 2/14= |
| F4–G2 | 1.4–1.5 | 1/8= | 1/8= | 1/8= |
| G2–K0 | 1.3–1.4 | 0/6=0.31 | 0/6=0.31 | 0/6=0.31 |
| K0–M0 | 0.7–1.3 | 8/71= | 8/71= | 8/71= |
| M0–M4 | 0.2–0.7 | 53/376= | 66/374= | |
| M4–M6 | 0.1–0.2 | 100/515= | ||
| Debris and Evolved Transitional Disks | ||||
| B0–B8 | 3–18 | 0/7=0.26 | 0/7=0.26 | 0/7=0.26 |
| B8–A6 | 1.8–3 | 0/26=0.07 | 4/26= | 6/26= |
| A6–F4 | 1.5–1.8 | 1/14= | 3/14= | 5/14= |
| F4–G2 | 1.4–1.5 | 0/8=0.23 | 0/8=0.23 | 2/8= |
| G2–K0 | 1.3–1.4 | 0/6=0.31 | 0/6=0.31 | 0/6=0.31 |
| K0–M0 | 0.7–1.3 | 0/71=0.03 | 1/71= | 5/71= |
| M0–M4 | 0.2–0.7 | 0/376=0.01 | 0/374=0.01 | |
| M4–M6 | 0.1–0.2 | 0/515=0.004 | ||
| Spectral Type | MassaaMasses that correspond to the given range of spectral types for an age of 20 Myr (Baraffe et al., 1998, 2015; Choi et al., 2016; Dotter, 2016). | W2 | W3 | W4 |
|---|---|---|---|---|
| () | ||||
| Full, Transitional, and Evolved Disks | ||||
| B0–B8 | 3–11 | 0/26=0.07 | 0/26=0.07 | 0/26=0.07 |
| B8–A6 | 1.7–3 | 0/89=0.02 | 0/89=0.02 | 0/88=0.02 |
| A6–F4 | 1.4–1.7 | 2/69= | 2/69= | 2/68= |
| F4–G2 | 1.1–1.4 | 0/92=0.02 | 0/92=0.02 | 0/91=0.02 |
| G2–K0 | 1.0–1.1 | 1/64= | 1/64= | 0/62=0.03 |
| K0–M0 | 0.7–1.0 | 2/189= | 2/189= | 2/189= |
| M0–M4 | 0.2–0.7 | 26/1005= | 34/1004= | |
| M4–M6 | 0.1–0.2 | 159/2149= | ||
| Debris and Evolved Transitional Disks | ||||
| B0–B8 | 3–11 | 0/26=0.07 | 0/26=0.07 | 1/26= |
| B8–A6 | 1.7–3 | 2/89= | 13/89= | 33/88= |
| A6–F4 | 1.4–1.7 | 1/69= | 6/69= | 26/68= |
| F4–G2 | 1.1–1.4 | 0/92=0.02 | 3/92= | 20/91= |
| G2–K0 | 1.0–1.1 | 0/64=0.03 | 1/64= | 0/62=0.03 |
| K0–M0 | 0.7–1.0 | 0/189=0.01 | 2/189= | 8/189= |
| M0–M4 | 0.2–0.7 | 1/1005= | 1/1004= | |
| M4–M6 | 0.1–0.2 | 0/2149=0.001 | ||
| Spectral Type | N(primordial disks)/N(stars) |
|---|---|
| Upper Sco | |
| B7–K5.5 | 4/76= |
| K6–M3.5 | 55/311= |
| M3.75–M6 | 139/633= |
| UCL/LCC | |
| B7–K5.5 | 3/452= |
| K6–M3.5 | 22/725= |
| M3.75–M6 | 222/2488= |