Anomalous behavior of two-dimensional Hertzian sphere system
Аннотация
The anomalous behavior of a two-dimensional system of Hertzian spheres with exponent has been studied using the method of molecular dynamics. The phase diagram of this system is the melting line of a triangular crystal with several maxima and minima. Water-like density and diffusion anomalies have been found in the reentrant melting regions. Noteworthy, a density anomaly has been observed not only in the liquid and hexatic but also solid phase. The calculations of the phonon spectra of longitudinal and transverse modes have yielded negative dependence of the frequency of transverse modes on density along all directions in the regions with a density anomaly. This indicates an association of the density anomaly with transverse oscillations of the crystal lattice. The regions of density and diffusion anomalies have been drawn on the phase diagram. It has been found that the stability regions of anomalous diffusion extend to temperatures well above maximum melting point of the triangular crystal. From analysis of the translational order parameter, which decreases with increasing density in the reentrant melting regions, the presence of a structural anomaly in the system has been assumed.
pacs:
61.20.Gy, 61.20.NeI Introduction
It is known that two-dimensional (2D) systems can demonstrate a number of properties that are very different from those of three-dimensional (3D) systems. The most common example is melting of 2D crystals. While in a 3D space melting always occurs through a first-order phase transition, in 2D crystals there are known at least three different melting scenarios. To date, for microscopic description of 2D melting there are three recognized scenarios ufn ; 3d1 : (i) the theory of Berezinskii - Kosterlitz - Thouless - Halperin - Nelson - Young (BKTHNY), according to which melting occurs via two continuous transitions with an intermediary hexatic phase with quasi-long-range orientational order and short-range translational order berez ; kt ; halpnel1 ; halpnel2 ; young ; (ii) melting in one transition of the first order chui ; ourjetp ; (iii) the crystal-hexatic phase transition takes place by means of a continuous transition of the Berezinskii - Kosterlitz - Thouless (BKT) type, whereas the hexatic phase-isotropic liquid transition - through a first-order transition bernard ; krauth ; dikstra ; kapfer ; alice . This makes 2D systems extremely complex and interesting to study.
In addition, it is known that some systems may display complex anomalous behavior. The most striking example of such systems is water, in which dozens of different anomalous properties were found, such as density anomaly, diffusion anomaly, and others. In the case of water, many anomalies occur in the existence domain of liquid. However, anomalous properties may take place in the crystalline phase as well. For example, there are many crystals known to demonstrate a density anomaly (in the case of crystals, the term "a negative coefficient of thermal expansion"is commonly used).
Many models have been proposed in literature to qualitatively explain the anomalous behavior of water and other substances. An important class of models leading to anomalous behavior in the liquid phase is the class of systems with negative curvature potentials (core-softened systems). Many different model core-softened potentials have been proposed, some of which exhibit anomalous behavior.
Another class of model systems in which anomalous behavior can occur is associated with the so-called bounded potentials, i.e., those that do not show singularity at zero. Despite the seeming simplicity of these potentials, they can demonstrate very complex behavior, including reentrant melting, formation of cluster crystals, numerous structural transitions, etc.
In a 2D space, systems with bounded potentials also show complex behavior. For example, in the work gaussian melting of a system with the Gaussian potential was studied. Melting was shown to occur through an intermediate hexatic phase. Besides, as in the 3D system with the Gaussian potential, anomalies of structure, density and diffusion were found in 2D.
One of the most extensively studied systems with bounded potential is the Hertzian sphere system (Hertzian spheres). It is defined by the potential:
| (1) |
where is the Heaviside step function and parameters and set the energy and length scales. The value of parameter corresponds to the Hertz problem of energy during deformation of two elastic spheres.
The Hertzian sphere system with various values of was studied in both 3D and 2D. In the work c15 , the phase diagram of a 3D system of Hertzian spheres with was calculated. It was shown that a large number of structural transitions among crystal phases of different symmetries occurred in this system. At the same time, all phases showed a maximum on the melting line. After that, in the work rosbreak it was shown that a diffusion anomaly and structural anomaly were also observed in this system, moreover, there were two diffusion anomaly areas in the system: at low and high densities. At the same time, the diffusion anomaly at low density was more pronounced. Later, qualitatively similar results were obtained for a Hertzian sphere system with as well lev1 ; lev2 .
The phase diagram of a 2D system of Hertzian spheres was studied in even more detail. This issue was first addressed in the paper miller . In this article, the phase diagram of the system was roughly estimated at three different values of the power of : , and . Despite some inaccuracies, this article detected the main trend of change in the phase diagram with an increase in the power of : with an increase in , the number of stable crystalline and quasicrystalline phases in the system decreases. This result was subsequently confirmed in the paper hertzqc .
In the work hertzmelt , the melting scenario of the triangular phase with low density in a 2D system of Hertzian spheres with was calculated. It was shown that the melting line showed a maximum, in which the melting scenario changed: at densities lower than the density at the melting line maximum, a first-order transition from the hexatic phase to liquid and a continuous transition from hexatic to crystal (the third melting scenario) were observed, while at higher densities both transitions were continuous according to the BKTHNY theory. However, this paper examined the melting of only one triangular phase at low densities. A complete phase diagram of the Hertzian sphere system with was built in the article molphys . In the sequence of the density increase several successive ordered phases are observed in the system, including dodecagonal quasicrystal. The melting lines were evaluated for all phases.
The system with deserves separate consideration. As shown in miller , there is only one crystal phase in this system, a triangular crystal. At the same time, the melting line looks complex. It is "wavy"in nature, that is, several maxima and minima occur on the melting line. This result was significantly expanded and revised in the article hz72 . In this paper it was confirmed that only one crystal phase, a triangular crystal, was observed in the system, and melting scenarios were calculated for different parts of the melting line of this crystal. It was shown that there were two melting scenarios in the system: the third scenario, with a first-order transition from hexatic to liquid, and the first scenario, with a continuous hexatic-liquid transition according to the BKTHNY theory in all regions of reentrant melting. In addition, a mechanism was proposed that could lead to such non-standard behavior of the melting line.
Based on the complex behavior of the phase diagram of the 2D Hertzian sphere system with and the presence of regions with reentrant melting (a negative slope of the melting line) of the triangular crystal, it can be assumed that certain anomalous properties that were previously found in other 3D and 2D systems with bounded potentials, will be observed in this system. The purpose of this work is to search for such anomalies in the studied system and to mark the areas of anomalous behavior on the phase diagram.
II System and methods
In our work, using the molecular dynamics method a 2D system of Hertzian spheres with was simulated in a rectangular box with periodic boundary conditions. The system consisted of 20000 particles. A triangular crystal was selected as the initial configuration. The simulation was carried out in the canonical ensemble (constant number of particles N, volume V and temperature T). The time step was . First, 30 million steps were performed to thermalize the system. Next, the system was simulated for another 20 million steps to calculate its properties. In conclusion, the system was simulated for more 20 million steps in the microcanonical ensemble (constant N, V and internal energy E) to calculate the diffusion coefficient. The diffusion coefficient was calculated from the mean square displacement by the Einstein method.
The work also included calculation of the phonon spectra of the crystal at different densities. The calculations were made in the ground state using the Born-von Karman method.
III Results and discussion
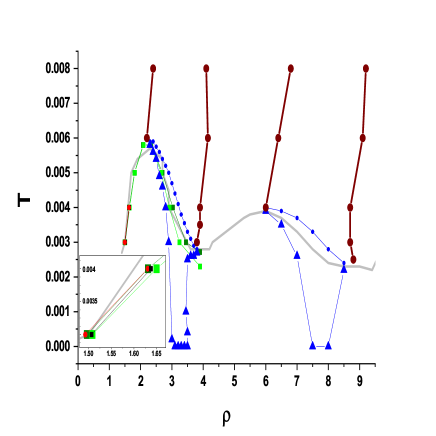
The phase diagram of the system under consideration was calculated in our previous work hz72 . Recall that this phase diagram has a very unusual shape: despite the fact that there is only one crystalline phase, the melting line has a wavy shape with several maxima and minima. Part of the phase diagram in the area of studied densities is shown in Fig. 1. In the present work, we continue studying the 2D Hertzian sphere system with and investigate into the origination of various anomalies in it, which are observed in many systems with anomalous phase diagrams.
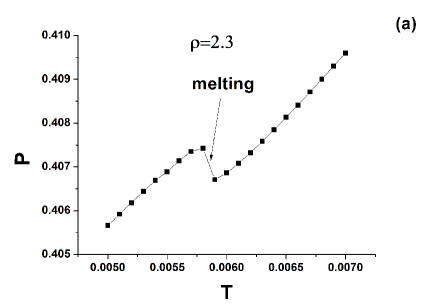
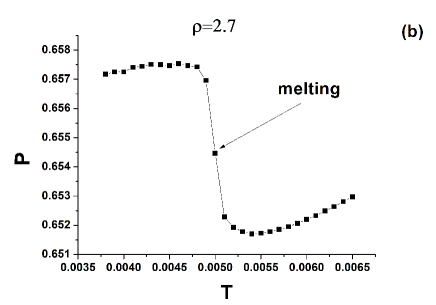
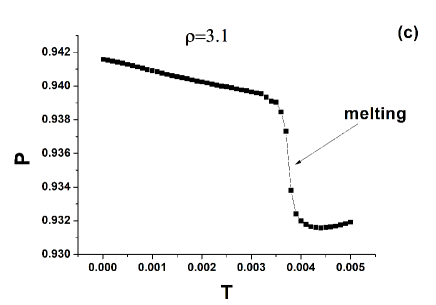
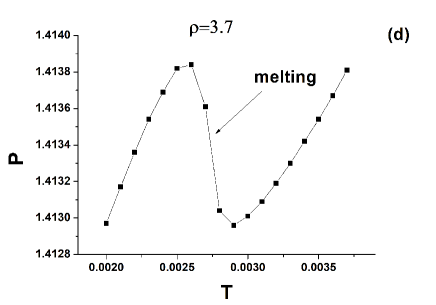
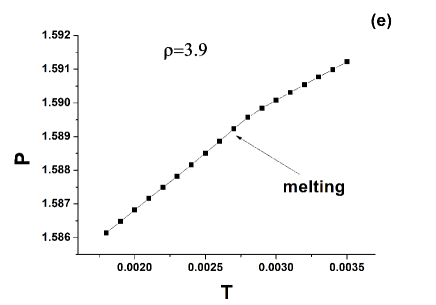
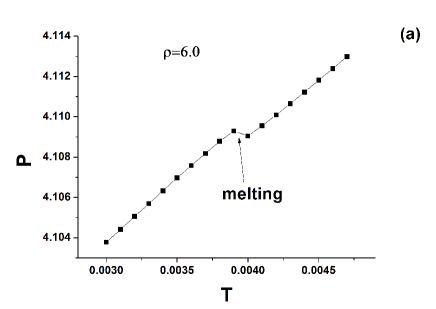
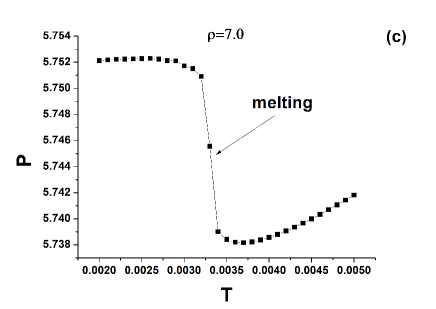
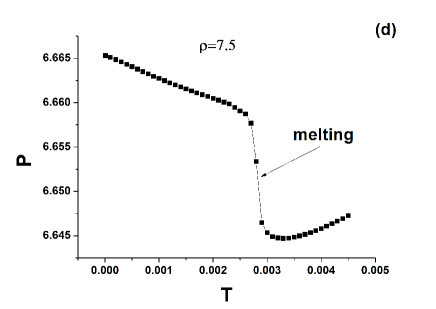
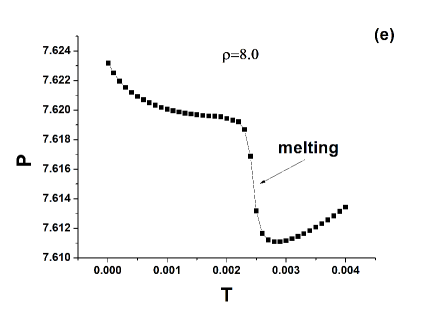
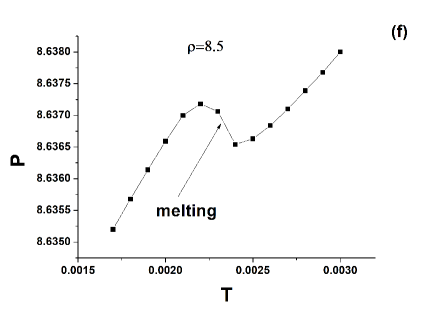
Let us begin the description of the obtained results with looking for a density anomaly in the system whose physical meaning consists in the negative coefficient of thermal expansion. Using the thermodynamic relationship = /, where is the coefficient of thermal expansion and is isothermal compressibility, and considering that is always positive and finite for systems in equilibrium outside a critical point, it can be concluded that a density anomaly corresponds to a decrease in pressure with an increase in temperature along the isochores, and a minimum on this dependence - to the boundary of the anomalous area [see Eq. (6) in s135e , anomwe ]. The derivative in the anomalous area should be negative. Therefore, we studied the equations of state along the isochores. Recall that in the areas of reentrant melting under consideration, the crystal melts via two continuous BKT transitions through the hexatic phase. Figures 2 (a) - (e) show a number of the system isochores. It can be seen that at density , the pressure increases with increasing temperature in both solid and liquid phases. Only in a very narrow temperature range with width 0.0001 the pressure decreases. Density is near the maximum of the melting line, where melting passes through a very narrow region of the hexatic phase. Therefore, it can be assumed that the observed density anomaly occurs in the orientationally ordered liquid-hexatic phase. At density , the pressure decreases to a minimum in the temperature region, the width of which is by an order of magnitude greater than at . At the same time, the density anomaly area includes part of the crystalline phase, full hexatic and part of the liquid phase. On the equation of state along isochore , starting with temperature close to zero, a monotonous pressure decrease is observed with an increase in temperature, which corresponds to the anomaly of density in the crystal. Then a region of an abrupt pressure drop appears as a function of temperature, which mainly falls within the existence domain of the hexatic phase. Next, a minimum appears on the equation of state that corresponds to the boundary of the density anomaly area in the liquid. With a further increase in temperature, pressure increases, which indicates the disappearance of the density anomaly in the liquid. Thus, at density the domains of existence of the crystalline and hexatic phases completely and of the liquid phase partially fall within the area of the density anomaly. On isochore the maximum and minimum correspond to the density anomaly area, which completely covers the existence domain of the hexatic phase and a very small area of the liquid phase. It should be noted that such a course of the equation of state along the above-mentioned isochores, namely, a pressure drop with an increase in temperature, is mainly characteristic of the reentrant melting regions on the phase diagram. With a further increase in density (), normal behavior of pressure dependence on temperature is observed, i.e., the density anomaly disappears. Thus, we see that the density anomaly in the system under investigation is observed not only in the liquid and hexatic but also in solid phases.
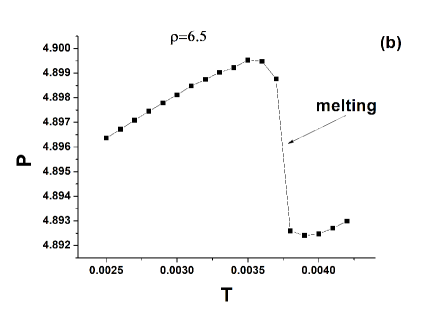
Recall that the melting line of the system has a wavy shape. This suggests that the behavior of anomalies may also be periodic. Therefore, we studied the isochores corresponding to the right branch of the melting line’s second maximum. Corresponding graphs are shown in Fig. 3. We see that isochore behavior is indeed similar to that at the densities around the first peak. A density anomaly can appear in both solid and liquid phase (densities and ). With a further increase in density, the anomaly disappears.
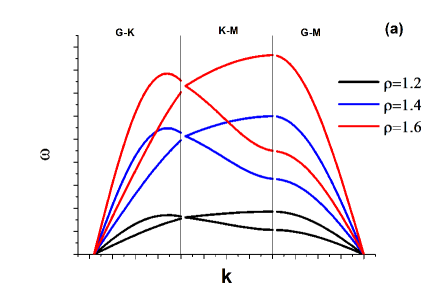
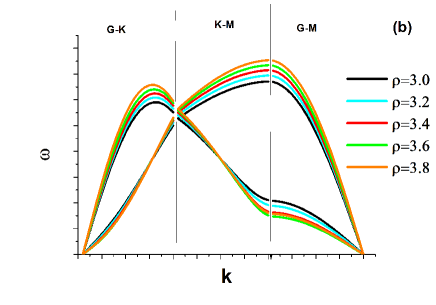
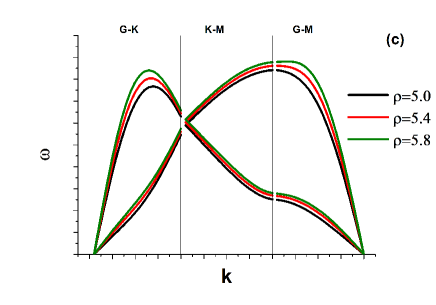
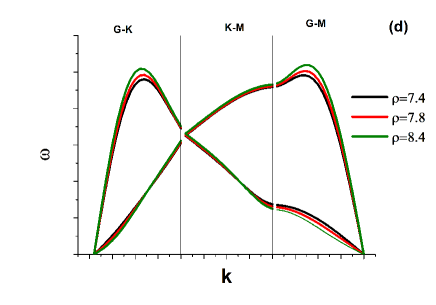
It is known that in the case of a density anomaly in the crystal, anomalous behavior of phonon frequencies is observed, i.e., the frequency of phonons on one or several phonon branches can decrease with increasing density. In a normal crystal, the frequency of all phonon branches increases with increasing density. We performed calculations of phonon spectra (longitudinal and transverse modes) in several ranges of densities, namely, in two regions where a density anomaly was detected, and in two regions with a positive coefficient of thermal expansion. The calculation results are shown in Figs. 4 (a) - (d). The density areas in panels (a) and (c) correspond to normal mode. It can be seen that in these regions the frequencies of all branches increase with increasing density. The behavior of phonon spectra in the areas with a density anomaly (panels (b) and (d)) is different from normal. In both density intervals ( - for the first area with a density anomaly and - for the second), the transverse modes along all directions show negative dependence on density. This suggests a connection of the density anomaly in the studied system with exactly the transverse oscillations of the crystalline lattice.
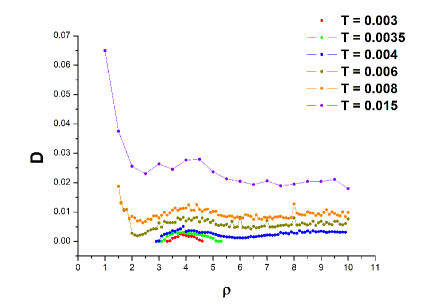
Along with the density anomaly, we found a diffusion anomaly, i.e., an increase in the diffusion coefficient of the system with an isothermal increase in density. Figure 5 shows the diffusion coefficients of the system along several isotherms. It can be seen that even at high temperatures, for example, (the maximum melting point in the system is ) there are two areas with an anomalous increase in the diffusion coefficient: from density to and from density to .
In the 2D system of Hertzian spheres with , the anomalous properties of the liquid in the reentrant melting region molphys between two different crystal phases can be explained by the restructuring of the liquid as a result of melting of the triangular crystal and crystallization of the square one. In the case of , a diffusion anomaly was detected in the reentrant melting regions of only one triangular phase. Let us try to explain this phenomenon using the example of the behavior of radial distribution functions (RDF) (see Figs. 12 (b) and (c) in our paper hz72 ) and translational order parameter (TOP) (see Fig. 2 in hz72 ) along isotherm . From Fig. 12 (b) it can be seen that with an increase in density to 3.7 corresponding to the anomalous diffusion boundary at , the RDFs become less structured, which leads exactly to an increase in the diffusion coefficient with increasing density. With a further increase in density and approaching the left branch of the melting line of the second bump (see Fig. 12 (c)), the behavior of the RDFs changes to the opposite, they become more structured, which will lead to normal liquid behavior, that is, a decrease in the diffusion coefficient with increasing density. According to Fig. 2, in the anomalous diffusion region, the TOP decreases with increasing density, which is a sign of the presence of a structural anomaly in the system.
The areas of density and diffusion anomalies are shown on the phase diagram in Fig. 1. It can be seen from this figure that the existence domain of the density anomaly is close to the melting line, while the existence domain of the diffusion anomaly reaches very high temperatures. This stability of the diffusion anomaly evidences complex behavior of the dynamic properties of the Hertzian sphere system with , which was discussed above.
IV Conclusions
The paper presents a molecular dynamics simulation study of anomalous behavior of a 2D system of Hertzian spheres with exponent . Previously, it has been shown miller ; hz72 that in this system there is only one crystalline phase, a triangular crystal, with several maxima and minima on the melting line. We find water-like density and diffusion anomalies in the liquid phase in the reentrant melting regions. Moreover, a density anomaly was observed in both liquid and solid phase. We have calculated the phonon spectra of longitudinal and transverse modes. The transverse modes along all directions have been shown to display negative dependence of frequency on density in the regions with density anomalies. This indicates an association of the density anomaly with transverse oscillations of the crystal lattice.
The regions of density and diffusion anomalies have been drawn on the phase diagram.
It has been found that the stability regions of anomalous diffusion extend to temperatures well above the maximum melting point of the triangular crystal at .
From analysis of the translational order parameter, which decreases with increasing density in the reentrant melting regions, an assumption has been made that there was a structural anomaly in the system.
V Acknowledgments
This work was carried out using computing resources of the federal collective usage centre "Complex for simulation and data processing for mega-science facilities"at NRC "Kurchatov Institute http://ckp.nrcki.ru, and supercomputers at Joint Supercomputer Center of the Russian Academy of Sciences (JSCC RAS). The work was supported by the Russian Science Foundation (Grant No 19-12-00092).
Список литературы
- (1) V. N. Ryzhov, E. E. Tareyeva, Yu. D. Fomin, E.N. Tsiok, Physics-Uspekhi 60, 857 (2017).
- (2) V. N. Ryzhov, E. E. Tareyeva, Yu. D. Fomin, E. N. Tsiok, Physics-Uspekhi 63, 417 (2020).
- (3) V. L. Berezinskii, ZhETF 59, 907 (1971) [JETP 32, 493 (1971)].
- (4) J. M. Kosterlitz and D. J. Thouless, J. Phys. C: Solid State Phys. 6, 1181 (1973).
- (5) B. I. Halperin and D. R. Nelson, Phys. Rev. Lett., 1978, 41, 121.
- (6) D. R.Nelson and B. I. Halperin, Phys. Rev. B: Condens. Matter Mater. Phys., 1979, 19, 2457.
- (7) A. Young, Phys. Rev. B: Condens. Matter Phys. 19, 1855 (1979).
- (8) S. T. Chui, Phys. Rev. B: Condens. Matter Phys. 28, 178 (1983).
- (9) V. N. Ryzhov, ZhETF 100, 1627 (1991) [JETP 73, 899 (1991)].
- (10) E. P. Bernard and W. Krauth, Phys. Rev. Lett. 107,155704 (2011).
- (11) M. Engel, J. A. Anderson, S. C. Glotzer, M. Isobe, E. P.Bernard, W. Krauth, Phys. Rev. E 87, 042134 (2013).
- (12) W. Qi, A. P. Gantapara and M. Dijkstra, Soft Matter 10, 5449 (2014).
- (13) S.C. Kapfer and W. Krauth, Phys. Rev. Lett. 114, 035702 (2015).
- (14) Alice L. Thorneywork, Joshua L. Abbott, Dirk G. A. L. Aarts, and Roel P. A. Dullens, Phys. Rev. Lett. 118, 158001 (2017).
- (15) Santi Prestipino, Franz Saija, and Paolo V. Giaquinta, Phys. Rev. Lett. 106, 235701 (2011).
- (16) J. Pamies, A. Cacciuto and D. Frenkel, J. Chem. Phys., 2009, 131, 044514.
- (17) Yu. D. Fomin, V. N. Ryzhov, N. V. Gribova, Phys. Rev. E: Stat. Phys., Plasmas, Fluids, Relat. Interdiscip. Top., 2010, 81, 061201.
- (18) V. A. Levashov, J. Chem. Phys. 147, 114503 (2017).
- (19) V. A Levashov, R. Ryltsev , N. Chtchelkatchev, Soft Matter 15, 8840-8854 (2019).
- (20) W. L. Miller, A. Cacciuto, Soft Matter, 2011, 7, 7552.
- (21) M. Zu, P. Tan and N. Xu, Nature Comm., 2017, 8, 2089.
- (22) M. Zum J. Liu, H. Tong and N. Xu, Phys. Rev. Lett., 2016, 117, 085702.
- (23) Yu. D. Fomin, E. A. Gaiduk, E. N. Tsiok, and V. N. Ryzhov, Molecular Physics, 2018, 116, 3258-3270.
- (24) E. N. Tsiok, E. A. Gaiduk, Yu. D. Fomin and V. N. Ryzhov, Soft Matter 16, 3962-3972 (2020).
- (25) Fomin Yu. D., Tsiok E. N., and Ryzhov V. N., 2011, J. Chem. Phys. 135, 124512
- (26) Fomin Yu. D., Tsiok E. N., and Ryzhov V. N., 2011, J. Chem. Phys. 135, 234502