Properties of 2017-18 ‘failed’ Outburst of GX 339-4
Abstract
The Galactic transient black hole candidate GX 339-4 is a very interesting object to study as it showed both complete and failed types of outbursts. We studied both spectral and temporal properties of the 2017-18 outburst of the source using archival data of NICER and AstroSat instruments. This 2017-18 outburst is found to be failed in nature, as during the entire period of the outburst, the source was only in the hard spectral state. Source spectra were highly dominated with the non-thermal fluxes. When we tried to fit spectra with phenomenological models, most of the spectra were fitted with only the powerlaw model, and only six spectra required disk black body plus powerlaw models. While fitting spectra with the physical two-component advective flow (TCAF) model, we observed that the flow was highly dominated by the sub-Keplerian halo rate. The presence of stronger shock at a larger radius from the black hole was also observed during the rising and declining phases of the outburst. A prominent signature of Hz QPO is observed with its four harmonics. Mass of the black hole was also estimated from our spectral analysis with the TCAF model as .
keywords:
\KWDX-Rays:binaries , stars: individual: (GX 339-4) , stars:black holes , accretion:accretion discs , radiation:dynamics , shock waves1 Introduction
Galactic stellar massive transient black hole X-ray binaries (BHXRBs) are very interesting objects to study as they show rapid evolution in their spectral and temporal properties. A strong correlation between these two properties is seen in the BHXRBs. In the temporal domain, they show an evolution of their hard and soft band X-ray counts/fluxes. Sometimes they show time and phase lags between hard and soft band photons. Observation of low and high (occasionally found) frequency quasi-periodic oscillations (QPOs) are one of the important temporal features. They are found in the power-density spectrum (PDS), obtained from the fast-Fourier transformation of the light curves. In an outburst, we generally see four spectral states, such as hard (HS), hard-intermediate (HIMS), soft-intermediate (SIMS), soft (SS), which forms hysteresis loop in the following sequence : HS HIMS SIMS SS SIMS HIMS HS. But in a failed or harder type of outburst, soft states (sometimes even intermediate states) are missing. Outflow/jet is also a common feature of these black hole candidates (BHCs). The nature of the QPOs, jets are found to vary with the spectral states (see, Remillard & McClintock 2006; Debnath 2018 for reviews). Type-C QPOs are commonly observed in the harder (HS and HIMS) spectral states, whereas type-B or A QPOs are found in the SIMS. Low-frequency QPOs are non-observable in the SS. Furthermore, sometimes in the rising and declining harder spectral states monotonic evolution of the type-C QPOs are observed during an outburst of a transient BHC. In the SIMS, QPOs are generally observed sporadically. In a jet dominated source, compact jets are observed in the harder spectral states, predominately in the hard state. Discrete or blobby jets are observed in the intermediate spectral states.
Although there is a conflict about the triggering of an outburst, according to Ebisawa et al. (1996) an outburst in a transient BHC is triggered by the sudden increase of viscosity at the outer edge of the accretion disk. When viscosity becomes weaker, we see that BHCs move toward the declining phase of their outbursts. Recently, Chakrabarti et al. (2019), Bhowmick et al. (2021), and Chatterjee et al. (2022) discussed a possible relation between the quiescence and outburst phases of three well known recurring transient BHCs H 1743-322, GX 339-4 and 4U 1630-472 respectively. According to them, matter supplied by the companions starts to pile up at a pile-up radii () located at the outer disk during the quiescence phases of these transient BHCs. An outburst could be triggered by a sudden rise in viscosity at the temporary reservoir at . A good correlation between outburst and quiescence periods are found for these sources. The nature (duration, peak numbers, highest peak flux, etc.) of the outbursts are now more clearly understood. In a failed outburst, it is often found that the matter accumulated at before the outburst is not cleared completely. Fresh matter is added to the leftover matter to trigger the next failed or complete outburst.
To understand accretion flow dynamics around a black hole, one needs to study both spectral and temporal properties with a physical model. Recent studies of our group have found that the two-component advective flow (TCAF) model is quite successful to explain physics around these compact objects. Accretion flow dynamics of these objects are now more clear from the variation of the model fitted physical flow parameters (Keplerian disk rate , sub-Keplerian halo rate , location of the shock , and compression ratio ) of more than fifteen BHCs (see, Debnath et al. 2014, 2015a,b, 2017; Chatterjee et al. 2016, 2019, 2020, 2021a,b; Jana et al. 2016, 2017; Shang et al. 2019). Origin of the QPOs are well understood from the TCAF model fitted shock parameters (Debnath et al. 2014; Mondal et al. 2015; Chakrabarti et al. 2015; Chatterjee et al. 2016, 2021b). One can also estimate black hole mass and contribution of jet component of the X-ray fluxes into the total observed X-ray, etc. (Debnath & Chatterjee et al. 2021; Jana et al. 2020, 2021; Nath et al. 2021) from the spectral analysis with the model. 2010, 2016 outbursts of this source were also studied with the TCAF model in past (Debnath et al. 2015a; Mondal et al. 2016).
Galactic transient BHC GX 339-4 was discovered in 1973 by the MIT X-ray detector onboard OSO-7 satellite (Markert et al. 1973). This low mass BHXRB system has a BH mass function of = with companion mass = . It is located at a distance of kpc with R.A.= and Dec.= (Hynes et al., 2003, 2004). Parker et al. (2016) has estimated mass and distance of the source to be and kpc from the spectral analysis. Sreehari et al. (2019) also estimated the mass of the source as from the spectro-temporal analysis of its multiple outbursts. In the last two and half decades, it showed five major complete/normal outbursts during the RXTE era (1996-2011), whereas in the MAXI era until 2020 (2009-2020), it showed three complete and three failed outbursts (for more details see, Bhowmick et al. 2021). This source has been extensively studied in multiwavelength bands during the complete outbursts.
This outburst was first reported by Russell, Lewis & Gandhi (2017) in the optical band using Australia’s 2m Faulkes Telescope South. Subsequently, this outburst was monitored in X-ray (Gandhi et al. 2017; Remillard et al. 2017), radio (Russell et al. 2017) and other wavebands. Garcia et al. (2019) also examined X-ray reflection near the black hole with NuSTAR and Swift data of the 2017 failed outburst of GX 339-4. Wang et al. (2020) analyzed the NICER and NuSTAR spectra during the 2017 and 2019 outbursts using relativistic and distant reflection models. They also observed a reverberation lag of ms. Husain et al. (2021) also analyzed the 2017 and 2019 outbursts of this source using AstroSat data. Recently, de Haas et al. (2021) presented quasi-simultaneous radio and X-ray observations for 2017–18 outburst. They established a correlation between the radio and X-ray fluxes during the outburst, which suggested a flatter correlation between them. This indicates an inefficient coupling between the outflow and inflow that supports the existence of hard states only. Here, we have re-looked at the 2017–18 failed outburst of the source. To get a more clear picture of the accretion flow dynamics during the outburst, we studied it using the TCAF model.
The paper is organized in the following way. In the next Section, observation and data analysis procedures are discussed. In §3, the results obtained from our analysis, first temporal and then spectral are discussed. In the §4, a discussion and conclusion based on our analysis are presented. Finally, a summary of our results is discussed in the §5.
2 Observation and Data Analysis
We studied the outburst of GX 339-4 using archival data of MAXI/GSC, Swift/BAT, NICER/XTI, and AstroSat/LAXPC instruments. To study the nature of the outburst profile in soft and hard X-ray bands and evolution of the hardness ratio, we used MAXI/GSC (in keV band) and Swift/BAT (in keV band) during a period of months from 2017 August 25 (MJD=57990) to 2018 March 20 (MJD=58197). For the detailed spectral and temporal analysis, we used both NICER and AstroSat data.
NICER monitored the outburst of the BHC GX 339-4. However, observations are not present on a daily basis. There is a data gap of close to 2.5 months from 2017 November 3 (MJD 58060) to 2018 January 18 (MJD 58136). We have checked for archival Swift/XRT data also. However, we have found a similar period of data gap there also. Depending on the noise level of spectra, we have used a total of 21 observations from NICER and 2 observations (orbits) from AstroSat/LAXPC data. For this work we have used keV MAXI/GSC, keV Swift/BAT, keV NICER data. For broadband analysis, we have also used archival AstroSat/LAXPC data. The data reduction process for different satellites/instruments is given below.
2.1 NICER
NICER has unprecedented spectral and timing resolutions of eV at 1 keV and nanoseconds respectively. We have used the latest calibration files (20210707) to run the data reduction process. First, we run the ‘nicerl2’ script which runs a standard pipeline that produces level-2 cleaned event files using standard calibration. Then we run the ‘barycorr’ command which applies barycenter correction to the cleaned event files. Using the barycenter corrected event files, we extract light curves of desired binsize using XSELECT task. We also extract spectrum files from XSELECT using the cleaned event file. At last, we run the nibackgen3c50 command which produces background spectra corresponding to each observation ids.
To search for QPOs, we initially extracted 1s binned lightcurves from the barycenter corrected event files. There were large data gaps in the resulting lightcurves. In order to select good time intervals (GTIs) with continuous data, we used time filtering in XSELECT. We extracted 0.01s binned lightcurves from the selected GTIs. The powspec task of XRONOS software package was then used to generate the white noise subtracted power density spectra (PDS). Each lightcurve was divided into 8192 intervals and a PDS for each interval was generated which were normalized such that their integral gives the squared rms fractional variability. All the individual PDSs were then averaged to obtain the final PDS which was geometrically rebinned with a factor of 1.05. To model the PDS, we used a power-law model for the red noise part and Lorentzian model for QPO peaks.
For spectral fitting purposes, we have used 21 observations of NICER/XTI data in an energy range of keV. At first, we have done the fitting using the combined disk black body (DBB) and power-law (PL) models (DBB+PL). We have used the photoelectric absorption model ‘PHABS’ for spectral analysis. After the PHABS(DBB+PL) model fitting, we have refitted all the observations using the TCAF model in the same energy range. We have frozen the hydrogen column density to for both the models. A systematic error of has been used for the spectral fitting.
2.2 AstroSat/LAXPC
From the LAXPC Software website we use the publicly available code to run the extraction process to generate level-2 files to create source and background spectra for LAXPC10 unit (unit 1) using all anode layers. The ‘laxpcl1.f’ program is run first to process multiple orbits of level-1 data. This produces event files, light curves, spectra, and GTI files in both the ASCII and FITS format. Afterwards, the ‘backshiftv3.f’ program is run to apply background correction to the light curve and spectrum files. This also identifies the response files to be used for any particular observation. For each observation, initially we run the program ‘laxpcl1.f’ with a time bin of 1 sec and full range of anodes and channels. The program produces the output file lxp1level2.gti which is moved to the file gti.inp. Once the gti.inp file is prepared, we extract 0.01 sec binned light curve by running the program ‘laxpcl1.f’ again with the full range of anodes and channels. Since there are data gaps in the light curves, we extract 0.01 sec light curves for each of the time range (listed in the gti.inp file) separately. Then using the task powspec we produce power density spectra (PDS) from the 0.01 sec time binned light curves.
Along with spectral fitting with NICER data in the keV energy band, we have also used two observations from LAXPC data to check our spectral fitting in a broad range. We have used combined NICER+LAXPC data for the simultaneous observations of both the satellites/instruments on 2017 October 4 and 2017 October 5. We have also used PHABS(DBB+PL) and PHABS*TCAF models in a range of keV energy range, using a systematic error of and freezing the column density at .
2.3 NuSTAR
To extract NuSTAR data, we have made use of the NuSTARDAS (v1.4.1) software. We first run the nupipeline command to produce stage-II cleaned event files. Then using XSELECT task, we choose region files for the source and background with the help of a circular region of 80 radius. Using those region files, we run the nuproducts command to produce spectrum and light curve files.
For the spectral analysis, we have used only 2 observations on 2017 October 25 (80302304004) and 2017 November 2 (80302304005) respectively.
3 Results
We studied detailed spectral and temporal properties of the 2017-18 outburst of the GX 339-4 using multiple satellite data. We first studied the timing properties of the source using MAXI/GSC, Swift/BAT, NICER/XTI, AstroSat/LAXPC, and NuSTAR data. The variation of the hard and soft band fluxes of BAT and GSC, and their ratio as hardness ratio (HR), allowed us to get a rough idea about the spectral state and flow properties of the source (Fig. 1). NICER and AstroSat data were used to search for the signature of one of the most interesting temporal features i.e., QPO in the PDS (Fig. 2). To infer more about the accretion flow dynamics, the spectral nature of the source was studied, first with the phenomenological models (Fig. 1d), and then with the physical model (Fig. 3 & 4). The spectral analysis is done using NICER, AstroSat/LAXPC, and NuSTAR data respectively. In the following sub-Sections, results obtained from our analysis are discussed in detail.
3.1 Outburst Profile
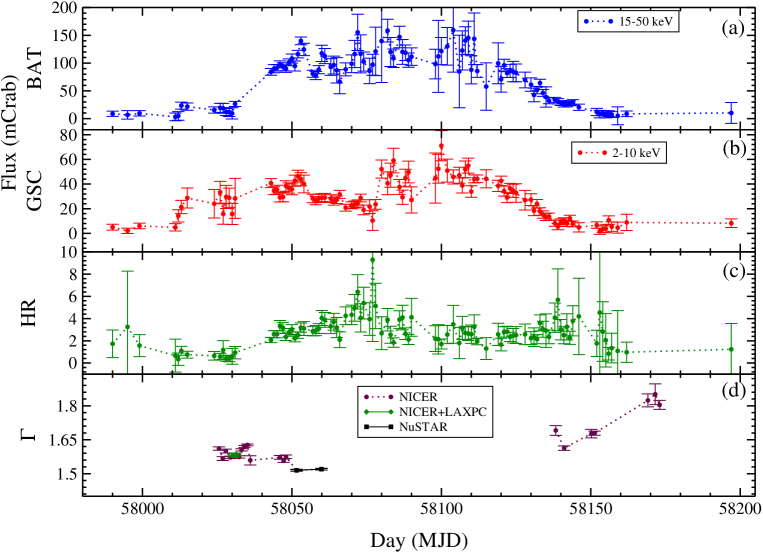
The variation of the Swift/BAT (in 15-50 keV band), MAXI/GSC (in 2-10 keV band) from 2017 August 25 (MJD= 57990) to 2018 March 20 (MJD=58197) are shown in Fig. 1(a-b). Although in the initial rising and late declining phases of the outburst, both soft and hard X-ray fluxes were roughly comparable, hard X-ray flux was more dominating in the middle phase of the outburst. Overall, if we look at the values of the hardness-ratios (HRs) and their variation (Fig. 1c), we see that during the entire period of the outburst, the source was dominated by the higher energy photons. This indicates spectral nature of the source might be hard. To confirm this, we did the spectral analysis.
3.2 Detection of multiple harmonic QPO
We used NICER and AstroSat data for searching QPOs in the PDS, generated with the s lightcurves. We found a prominent signature of QPOs only in one observation of NICER. No QPOs were found in the LAXPC data. The NICER observed QPO is an interesting one as it contains one primary QPO of Hz and its four harmonics. To fit the PDS in XSPEC, we converted the XRONOS package generated PDS data following the method of Ingram & Done (2012). We initially fitted the broadband noise continuum with a powerlaw model and successively added Lorentzian profiles to improve the fit. To confirm the existence of the harmonics and their significance, we used the ‘ftest’ method in XSPEC to check how significantly the fit improved after adding one more Lorentzian profile to the previous model in each step (see, Table 1). An acceptable fit was obtained with a model consisting of a powerlaw plus four Lorentzians with a reduced chi-square (Fig. 2a). After adding one more Lorentzian at Hz, the reduced chi-square becomes better (Fig. 2b). From the results of F-test, as listed in Table 1, the addition of the first two Lorentzians to the original powerlaw model does not seem statistically necessary, but they appear to be prominent as seen in Figure 2. That is because the fitting improvement is not significant enough due to the presence of other possible peaks. The addition of the third and fourth Lorentzian peaks then improved the fitting more significantly. Based on the F-test, the presence of a fifth peak at about 2.1 Hz seems also statistically significant.


3.3 Spectral Properties
Although temporal data of GSC and BAT were available roughly on a daily basis, spectral data of NICER/XTI, Swift/XRT, AstroSat/LAXPC, NuSTAR were available for a limited observational period of the outburst. Since XTI and XRT have similar energy ranges and dates of the observation, here we used NICER data for our detailed spectral analysis. There were roughly one month of observations each in the both rising (from 2017 Sep. 29 to Oct. 22) and declining (from 2018 Jan. 20 to Feb. 24) phases of the outburst. LAXPC continuously observed the source only for two days (4-5 Oct., 2017). During the entire outburst, NuSTAR observed the source only four times.
We first fitted spectra with the phenomenological DBB plus PL models. DBB model was required only in 6 of our studied 21 NICER observations. Both the NuSTAR observations were fitted with the ‘DBB+PL’ model. In Fig. 1(d), we show the variation of the PL model fitted photon index () values. During the entire phase of the outburst, is found to vary in between . These low values indicate a harder spectral nature of the source. This is also evident from the non-requirement of the thermal DBB component in most of the spectra.
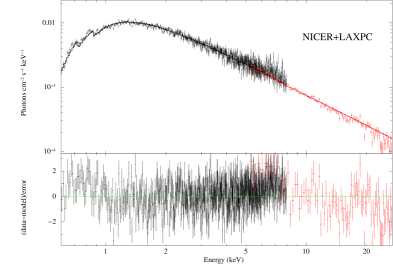
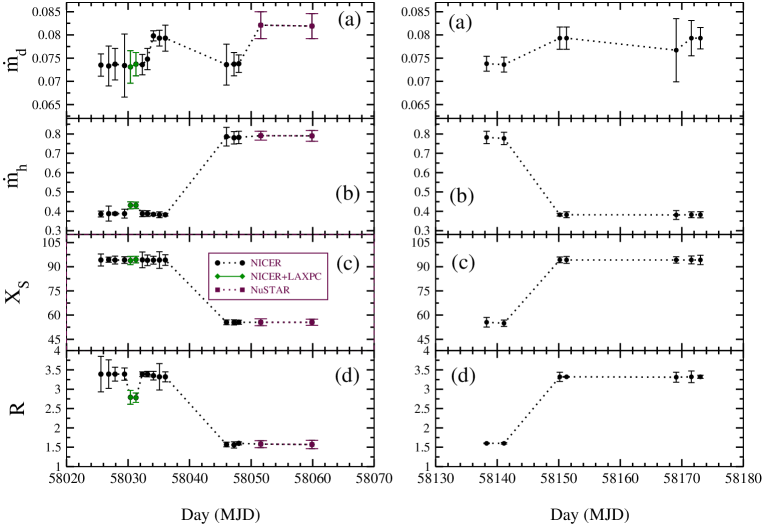
A sample TCAF model fitted spectrum of 2017 Oct. 5 (MJD=58031) using combined NICER and LAXPC data are shown in Fig. 3. While fitting spectra with the physical TCAF model, we also observed high dominance of the sub-Keplerian halo rate () compared to the Keplerian disk rate (). The variations of the TCAF model fitted parameters are shown in Fig. 4. The rising and declining phase results are plotted in left and right panels respectively. Two green points in the left panels show combined NICER and LAXPC spectral analysis results while two magenta points show the same for two NuSTAR observations respectively. We use 5-28 keV LAXPC data of orbits 10916 (UT: 2017-10-04, MJD=58030.39) and 10925 (UT: 2017-10-05, MJD=58031.29) are used to have a combined energy range of 1-28 keV (using NICER data of 1-8 keV) for these observations. We have not considered LAXPC data above 28 keV due to low signal-to-noise ratio in the data. We fitted NuSTAR data in 3-70 keV. Model fitted spectral analysis results are mentioned in Table 2.
Initially, in the rising phase, higher was found to be constant at , then in the last three observations, it increased to . In the declining phase, the halo rate was also observed at for the initial two observations, then it decreased to a lower value same as the start of the outburst, i.e., at . Throughout the outburst, was observed in a narrow range of lower values ( ). In the initial rising phase of the outburst, the shock was found far away () from the black hole with stronger strength (). In the late rising phase, shock moved to near location () with comparatively weak strength (). So, in the rising phase, shock moved inward as outburst progressed. In the declining phase, an opposite scenario was observed. Initially, in the declining phase, shock was found at with compression ratio .
3.4 Estimation of Mass
Mass, which is one of the intrinsic properties of a black hole, has been included as an input parameter in the TCAF model fits file (Debnath et al. 2014, 2015a). While doing a spectral fitting with the TCAF model, we may keep the mass fixed or free, depending on if it has been known from previous measurements or not. For this source, we have kept the mass free to estimate the mass of the BHC. We obtained mass variation in between . Instrumental error plays a major role in this variation as it could be different for different observations. Since mass is dependent on the fourth power of the disk temperature, it is highly sensitive to any small error in the measurement of disk temperature. Thus, this may not be the actual variation of mass rather the variation due to instrumental error during the period of our analysis. Keeping this fact in mind, we have found the most probable mass of the source as during this outburst. Here, is the average value of the model fitted masses.
4 Discussion and Concluding Remarks
GX 339-4 is a recurring Galactic transient BHC. This is a well studied black hole binary by several groups of authors in a wide band of energies from radio to -rays. Recently, Bhowmick et al. (2021) studied outburst profiles of the source to know about the triggering mechanism of the outbursts. A good linear relation between the outbursts and the quiescence phases is found from their analysis. A similar long-term variability of the source was also studied by Aneesha et al. (2019). In the past two and half decades of the post RXTE era, GX 339-4 showed outbursts of both type-I & II. According to Debnath et al. (2017), in type-I or complete outbursts, all four commonly identified spectral states (HS, HIMS, SIMS, SS) are found to form hysteresis loop, while in the type-II or harder spectral states, we do not see any soft spectral state. Sometimes even intermediate states are found to be missing in the type-II outbursts. Our present studied 2017-18 outburst is a ‘failed’ in nature as only HS was found during the entire outburst.
Both the spectral and temporal nature of the source during its 2017-18 outburst was studied using archival data of MAXI, Swift, NICER, AstroSat, and NuSTAR instruments. The variation of hard and soft band photo fluxes using Swift/BAT and MAXI/GSC data and their ratio as HR, we concluded that during the entire phase of the outburst source was in the harder spectral states (Fig. 1). To understand more detail about the accretion flow dynamics of the source during the outburst, we did spectral analysis. Due to the unavailability of the daily observations of Swift/XRT, NICER/XTI, AstroSat/LAXPC, and NuSTAR detailed timing and spectral studies were done for limited period of the rising and declining phases of the outburst.
Low-frequency QPOs are one of the characteristic signatures of the transient BHCs. We used NICER and AstroSat/LAXPC data for searching QPOs in the fast-Fourier transformed PDS. During the entire outburst, in only one observation (ID: 1133010110) of NICER on 2017 Oct. 09 (MJD = 58035.10) we found a prominent QPO of Hz. Most interestingly, this primary QPO showed four of its harmonics (see Fig. 2). The significance of the QPO and its harmonics are tested using ftest method (see Table 1).
The spectral analysis was done with two types of models: i) phenomenological DBB plus PL models, and ii) physical TCAF model. The phenomenological model fit provides us a rough idea about the variation of the thermal and non-thermal component of the photon flux. But the detailed physics of the generation of such photons is missing. The physical model fit gives us more information about the flow dynamics of the source. Since the source was highly dominated with the non-thermal fluxes, PL model was sufficient to fit the spectra, except for 6 observations of the middle phase of the outburst. If there were more observations in this phase of the outburst, we might require the DBB model component in more observations. In Table 2, spectral analysis results are mentioned.
The variation of the PL photon index () in the range of (Fig. 1d) signifies a harder spectral nature of the source during our analysis period. While fitted spectra with the TCAF model, we also noticed high dominance of the sub-Keplerian halo rate. Low values of the Keplerian disk rate (compared to the halo rate) confirm the non-requirement of the DBB model in most of the observations while spectra were fitted with the phenomenological models. These higher halo rates confirm the spectral nature of the source as HS. In the early rising and late declining phase of the outburst, a stronger shock was found at a comparatively large distance from the black hole. In the middle phase, the shock was found to be weaker and nearer.
We also estimated the probable mass of the black hole () from our spectral analysis with the TCAF model. Since in the TCAF model, is an important input parameter. So, if it is not well known and kept as free while fitting spectra, we get one best-fitted value of the . The variation of the during the outburst does not mean the real variation of the during our analysis period. The is highly sensitive to the disk temperature (T). If there is an error in the measurement of , it contributes a large variation in since . We observed the variation of the in a range of or . Here, is the average of the model fitted . This estimated mass of GX 339-4 is consistent with the earlier findings of Parker et al. (2016) and Sreehari et al. (2019).
5 Summary
We have studied the timing and spectral properties of the outburst of GX 339-4 using publicly available archival data from MAXI/GSC, Swift/BAT, NICER/XTI, AstroSat/LAXPC, and NuSTAR/FPMA satellite instruments. Using time binned light curves data from XTI () and LAXPC () instruments, we have searched for quasi periodic oscillations during the entire phase of the outburst. We have also performed spectral analysis using only NICER () data for 19 observations, combined NICER+LAXPC () data for 2 observations and NuSTAR () for 2 more observations. Due to the absence of data in a period of almost months in the middle phase of the outburst, we were unable to define any transition between the spectral states properly. However, based on the variations of HR and dominance of hard flux over soft flux, we have characterized the state of the source as hard. It did not make any transition into the defined softer states during our studied period of the outburst. While fitting the spectra, we have also estimated the mass of this source during this outburst. Based on our temporal and spectral analysis, we conclude that:
(i) The is a failed or harder type of outburst, which does not make any transition into the softer states.
(ii) The source has a mass between , which is in agreement with previous findings.
(iii) We have found QPO only in one day (2017 October 9; MJD=58035) of the entire outburst. The observed QPO is an interesting one as it showed multiple harmonics.
6 Data Availability
We have used archival data of MAXI/GSC, Swift/BAT, NICER, NuSTAR and AstroSat/LAXPC for this work.
Acknowledgements
This research has made use of data and/or software provided by the High Energy Astrophysics Science Archive Research Center (HEASARC), which is a service of the Astrophysics Science Division at NASA/GSFC. This work made use of Swift/BAT data supplied by the UK Swift Science Data Centre at the University of Leicester; MAXI/GSC data provided by RIKEN, JAXA, and the MAXI team; NICER data archived by NASA/GSFC; AstroSat/LAXPC data obtained from the data archive of Indian Space Science Data Centre (ISSDC). We acknowledge the strong support from Indian Space Research Organization (ISRO) for the successful realization and operation of AstroSat mission. The authors also acknowledge the AstroSat team for the distribution. The LaxpcSoft software is used for the analysis. D.D. acknowledges support from DST/GITA sponsored India-Taiwan collaborative project (GITA/DST/TWN/P-76/2017). Research of D.D. is supported in part by the Higher Education Dept. of the Govt. of West Bengal, India. K.C. acknowledges support from DST/INSPIRE (IF170233) fellowship. S.N. and D.D. acknowledge partial support from ISRO sponsored RESPOND project (ISRO/RES/2/418/17-18) fund. R.B. acknowledges support from CSIR-UGC fellowship (June-2018, 527223).
References
- [1] Aneesha, U., Mandal, S., Sreehari, H., 2019, MNRAS, 486, 2705.
- [2] Bhowmick, R., Debnath, D., Chatterjee, K., et al., 2021, ApJ, 910, 138
- [3] Chakrabarti, S. K., Debnath, D., & Nagarkoti, S. 2019, AdSpR, 63, 3749
- [4] Chatterjee, D., Debnath, D., Chakrabarti, S. K., Mondal, S., Jana, A., 2016, ApJ, 827, 88
- [5] Chatterjee, D., Debnath, D., Jana, A., Chakrabarti, S. K., 2019, AP&SS, 364, 14
- [6] Chatterjee, K., Debnath, D., Chatterjee, D., et al. 2020, MNRAS, 493, 2452
- [7] Chatterjee, K., Debnath, D., et al. 2021a, Ap&SS, 366, 63
- [8] Chatterjee, K., Debnath, D., Bhowmick, R, Nath, S. K., Chatterjee, D., 2022, MNRAS, 510, 1128
- [9] Chatterjee, D., Debnath, D., Jana, A., et al., 2021b, Ap&SS, 366, 82
- [10] Debnath, D., Mondal, S., & Chakrabarti, S. K. 2014, MNRAS, 440, L121
- [11] Debnath, D., Molla, A. A., Chakrabarti, S. K., & Mondal, S. 2015a, ApJ, 803, 59
- [12] Debnath, D., Mondal, S., & Chakrabarti, S. K. 2015b, MNRAS, 447, 1984
- [13] Debnath, D., Jana, A., Chakrabarti, S. K., & Chatterjee, D. 2017, ApJ, 850, 92
- [14] Debnath, D., 2018, in Exploring the Universe: From Near Space to Extra-galactic Mukhopadhyay, B & Sasmal, S. (Eds.), ASSP, 53, 229, Springer (Heidelberg)
- [15] Debnath, D., Chatterjee, K., Chatterjee, D., et al. 2021, MNRAS, 504, 4242
- [16] de Haas, S. E. M., Russell, T. D., Degenaar, N., et al. 2020, MNRAS, 502, 521
- [17] Ebisawa, K., Titarchuk, L. G., & Chakrabarti, S. K. 1996, PASJ, 48, 59
- [18] Gandhi, P., Altamirano, D., Russell, D. M., et el., 2017, ATels, 10798, 1
- [19] Garcia, J. A., Tomsick, J. A., Sridhar, N., et al. 2019, ApJ, 885, 48
- [20] Husain, N., Misra, R., & Sen, S., 2021, (in communication; arXiv210808024)
- [21] Hynes R. I., Steeghs D., Casares J., Charles P. A., O’Brien K., 2003, ApJ, 583, L95
- [22] Hynes R. I., Steeghs D., Casares J., Charles P. A., O’Brien K., 2004, ApJ, 609, 317
- [23] Ingram & Done, 2012, MNRAS, 419, 2369
- [24] Jana, A., Debnath, D., Chakrabarti, S. K., Mondal, S., Molla, A. A., 2016, ApJ, 819, 107
- [25] Jana, A., Chakrabarti, S. K., Debnath, D., 2017, ApJ, 850, 91
- [26] Jana, A., Debnath, D., Chatterjee, D., et al. 2020, ApJ, 897, 3
- [27] Jana, A., Jaisawal, G.K., Naik, S., et al. 2021, RAA, 21, 125
- [28] Markert T. H., Canizares C. R., Clark G. W., Lewin W. H. G., Schnopper H. W., Sprott G. F., 1973, ApJ, 184, L67
- [29] Mondal, S., Chakrabarti, S. K., Debnath, D., 2015, ApJ, 798, 57
- [30] Mondal, S., Chakrabarti, S. K., Debnath, D., 2016, Ap&SS, 361, 309
- [31] Nath, S. K., Debnath, D., Chatterjee, K., et al. 2021 (in communication) (arXiv:2108.07456)
- [32] Parker, M. L., Tomsick, J. A., Kennea, J. A., Miller, J. M., et al. 2016, ApJ, 821, L6
- [33] Remillard R. A. & McClintock J. E., 2006, ARA&A, 44, 49
- [34] Russell, D. M., Lewis, F. & Gandhi, P., 2017, ATel, 10797, 1
- [35] Russell, T. D., Tetarenko, A. J., Sivakoff, G. R., et al., 2017, ATel, 10808, 1
- [36] Remillard, R., Gendreau, K., Altamirano, D., et al., 2017, ATel, 10824, 1
- [37] Shang, J. R., et al. 2019, ApJ, 875, 4
- [38] Sreehari, H., Iyer, N., Radhika, D., et al. 2019, AdSpR, 63, 3
- [39] Wang, J., Kara, E., Stiener, J. F., et al. 2020, 899, 44
| Model | PL Index | PL Norm. | Q | rms % | /dof | F-stat | Prob. | ||
| () | (Hz) | (Hz) | () | ||||||
| (1) | (2) | (3) | (4) | (5) | (6) | (7) | (8) | (9) | (10) |
| PL | 218/107 | ||||||||
| PL+LOR | 15.4 | 1.37 | 206/104 | 2.02 | 0.12 | ||||
| PL+LOR | 15.4 | 1.37 | 203/101 | 0.50 | 0.68 | ||||
| +LOR | 4.8 | 2.63 | (1.24) | (0.29) | |||||
| PL+LOR | 15.4 | 1.48 | 181/ 98 | 3.97 | 0.010 | ||||
| +LOR | 5.8 | 1.68 | (2.23) | (0.026) | |||||
| +LOR | 3.8 | 6.29 | |||||||
| PL+LOR | 10.3 | 1.94 | 146/ 95 | 7.59 | 0.00013 | ||||
| +LOR | 5.7 | 2.06 | (3.90) | (0.000073) | |||||
| +LOR | 4.1 | 5.18 | |||||||
| +LOR | 3.8 | 8.26 | |||||||
| PL+LOR | 7.8 | 2.51 | 126/ 92 | 4.87 | 0.0035 | ||||
| +LOR | 5.7 | 2.38 | (4.48) | () | |||||
| +LOR | 4.1 | 5.46 | |||||||
| +LOR | 3.8 | 8.55 | |||||||
| +LOR | 9.8 | 5.45 |
In column (1), PL and LOR mean Powerlaw and Lorentzian models respectively.
In columns (4) and (5), is the QPO frequency and is the full width at half maximum (FWHM).
In columns (9) and (10), F-stat and Prob. mean statistics and random probabilities of the present model with
the previous model. Those in parentheses are of the present model with the PL-only model.
| Obs. ID[1] | UT[1] | MJD[1] | Tin[2] | [2] | /dof[4] | [3] | [3] | [3] | [3] | [3] | /dof[4] |
|---|---|---|---|---|---|---|---|---|---|---|---|
| (1) | (2) | (3) | (4) | (5) | (6) | (7) | (8) | (9) | (10) | (11) | (12) |
| N01 | 2017-09-29 | 58025.58 | |||||||||
| N02 | 2017-09-30 | 58026.85 | |||||||||
| N03 | 2017-10-01 | 58027.88 | |||||||||
| N04 | 2017-10-03 | 58029.43 | |||||||||
| N05∗ | 2017-10-04 | 58030.39 | |||||||||
| N06∗ | 2017-10-05 | 58031.29 | |||||||||
| N07 | 2017-10-06 | 58032.32 | |||||||||
| N08 | 2017-10-07 | 58033.15 | |||||||||
| N09 | 2017-10-08 | 58034.13 | |||||||||
| N10 | 2017-10-09 | 58035.09 | |||||||||
| N11 | 2017-10-10 | 58036.06 | |||||||||
| N12 | 2017-10-20 | 58046.00 | |||||||||
| N13 | 2017-10-21 | 58047.22 | |||||||||
| N14 | 2017-10-22 | 58048.00 | |||||||||
| NS04 | 2017-10-25 | 58051.57 | |||||||||
| NS05 | 2017-11-02 | 58059.89 | |||||||||
| N21 | 2018-01-20 | 58138.27 | |||||||||
| N24 | 2018-01-23 | 58141.10 | |||||||||
| N28 | 2018-02-01 | 58150.17 | |||||||||
| N29 | 2018-02-02 | 58151.26 | |||||||||
| N33 | 2018-02-20 | 58169.09 | |||||||||
| N35 | 2018-02-22 | 58171.54 | |||||||||
| N36 | 2018-02-24 | 58173.02 |
[1] Column 1, 2 and 3 represent the Obs Id., date and MJD respectively. ‘N’ and ‘NS’ in column 1 mark the initial part for the NICER and NuSTAR Obs.
Ids respectively, where ‘N’=11330101 and ‘NS’=803023040.
[2] Column 4 and 5 represent the DBB+PL fitted innerdisk temperature () and photon index of power-law () respectively.
[3] Column 7, 8, 9, 10 and 11 represent the TCAF model fitted parameters: disk rate ( in Eddington rate (), halo rate ( in ),
shock location ( in Schwarzschild radius ), compression ratio () and mass of the black hole ( in solar mass ) respectively.
[4] DBB+PL and TCAF models fitted values are mentioned in columns 6 and 12 respectively as , where ‘dof’ represents degrees of freedom.
‘∗’ sign in Column 1 represents the obs. Ids for which the NICER+LAXPC combined fitting have been done. For both observations, we have taken
LAXPC data with obs. Id = A04-109T01-9000001578. N05 and N06 correspond to AstroSat orbits of 10916 and 10925 respectively.