Structural and magnetic investigation of the interfaces of Fe3O4/MgO(001) with and without NiO interlayer
Abstract
We present an investigation on the structural and magnetic properties of the interfaces of and by extracting cation-selective magnetooptical depth profiles by means of x-ray magnetic reflectivity (XRMR) in combination with charge-transfer multiplet simulations of x-ray magnetic circular dichroism (XMCD) data. For , the magnetooptical depth profiles at the and the resonant energies follow exactly the structural profile, while the magnetooptical depth profile at the resonance is offset by Å from the interface, consistent with a B-site interface termination of with fully intact magnetic order. In contrast, for , the magnetooptical depth profiles at the and the resonances agree with the structural profile, but the interface positions of the magnetooptical depth profiles at the and the resonances are laterally shifted by Å and Å, respectively, not consistent with a magnetically ordered stoichiometric interface. This may be related to an intermixed layer at the interface. The magnetooptical depth profiles at the Ni edge reveal uncompensated magnetic moments throughout the NiO film.
pacs:
Valid PACS appear hereI Introduction
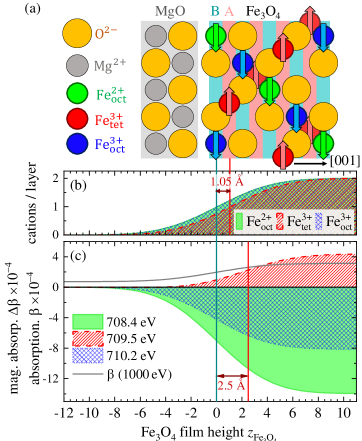
Magnetite () is a half-metallic ferrimagnet in the inverse spinel structure. This structure consists of a cubic close-packed oxygen lattice whose interstitial sites are populated by three different iron species: 1/2 of the octahedral B-sites are occupied randomly by divalent and trivalent cations, and 1/8 of the tetrahedral A-sites are occupied by trivalent cations. The two octahedrally coordinated species and are ferromagnetically coupled by double exchange, while the and cations couple antiferromagnetically via superexchange. Therefore, the magnetic moments of the cations compensate each other and the resulting macroscopic moment of of is determined by the magnetic moments of the cations Weiss and Forrer (1929).
Due to these magnetic properties, magnetite is a long-standing candidate to contribute to all-oxide thin-film spintronic devices, as a source for spin-polarized currents Moussy (2013); Coey and Chien (2003); Bibes and Bartheélemy (2007); Žutić et al. (2004); Moyer et al. (2015); Marnitz et al. (2015). These kinds of devices utilize the fact that many metal oxides with varying electronic and magnetic properties grow in spinel or rock-salt structures, such as the conducting ferrimagnets and -, the insulating ferrimagnets and , the insulating antiferromagnets NiO, CoO and FeO, or the insulating diamagnets MgO and , which all share a cubic close-packed oxygen lattice with very similar lattice constants Moussy (2013). This allows epitaxial growth of film stacks with a large variety of spin electronic functionality but with little strain and thus supposedly well-matching interfaces.
However, a drawback of this concept is that the structural similarity of these metal oxides also means that undesired modifications at their interfaces are difficult to detect, such as interdiffusion of Mg Kim-Ngan et al. (2009), Ni Farrow et al. (2000); Kuschel et al. (2016) or Co Rodewald et al. (2019) into films, or the transformation of the different iron oxides into each other Bertram et al. (2011, 2012). All-oxide spintronic devices with electrodes did indeed not prove to be very successful yet; their shortcomings were speculated to stem from magnetic dead layers at the substrate interface van der Heijden et al. (1996); van der Zaag et al. (2000) or other interface effects Marnitz et al. (2015).
Of particular interest have been the interfaces between Fe3O4 films and the tunnel barrier material MgO Marnitz et al. (2015); van der Zaag et al. (2000); Kado (2008), as well as the interface between Fe3O4 and antiferromagnetic films, e.g. NiO, exhibiting exchange bias Keller et al. (2002); Gatel et al. (2005); Krug et al. (2008); Kuepper et al. (2016). This effect can cause a shift of the coercive fields of the ferrimagnetic Fe3O4 film and be used to pin its magnetization state.
In this study, we investigate the structural and magnetic properties of the and interfaces. We grow single layers and bilayers on MgO(001) by reactive molecular beam epitaxy (RMBE) and investigate the distribution and magnetic order of the three cations , and of and of the cations of NiO by x-ray resonant magnetic reflectivity (XRMR) combined with charge-transfer multiplet analysis of x-ray magnetic circular dichroism (XMCD) spectra. We find that the magnetic structure of on MgO is intact down to the interface, while on the interface the data indicates a disturbed magnetic order. XRMR data on the Ni edge indicate uncompensated magnetic moments in the antiferromagnet NiO.
II Experimental details
The deposition and characterization methods of the samples followed the ones presented in Refs. Kuepper et al. (2016); Kuschel et al. (2016). We prepared and samples in a multichamber ultra-high-vacuum system with a base pressure of mbar. Before deposition, the MgO(001) substrates were annealed at C in an oxygen atmosphere of mbar for 1 hour. Our films were grown by RMBE. For the NiO, we deposited nickel in an oxygen pressure of mbar, and for the , we deposited iron in an oxygen pressure of mbar. We limited the substrate temperature to C in order to avoid interdiffusion of Mg into the films Kim-Ngan et al. (2009). After growth, the electronic structure of the samples were characterized in situ by x-ray photoelectron spectroscopy (XPS) using a Phoibos HSA 150 hemispherical analyzer and an Al K anode, and their surface structure by low-energy electron diffraction (LEED). The Fe XPS spectra show the and the features typical for , and the LEED patterns confirm the characteristic ()R surface structure of Mariotto et al. (2002); Bliem et al. (2014) (both not shown here).
and samples were transported under ambient conditions to BESSY II for x-ray absorption spectroscopy (XAS), XMCD, x-ray reflectivity (XRR) and XRMR on the XUV diffractometer at beamline UE46_PGM-1 Weschke and Schierle (2018). The samples were placed between two permanent magnets in a magnetic field of mT at room temperature. The x-rays had a degree of 90% circular polarization.
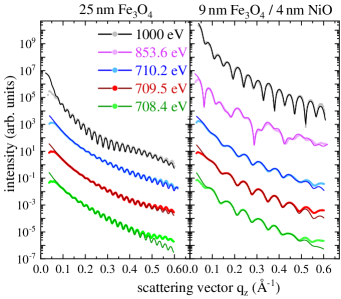
All XAS and XMCD spectra were recorded in total electron yield (TEY) mode with an incidence glancing angle of . XRR and XRMR curves were obtained by - scans in the range at selected resonant photon energies with both right and left circularly polarized x-rays. The structural properties of the samples (thickness , roughness ) obtained by XRR at an off-resonant energy (eV, cf. Fig. 1) are summarized in Tab. 1.
In order to obtain magnetic information with higher depth sensitivity, we measured XAS and XMCD in total fluorescence yield mode (TFY) and reflection mode on a different sample at Diamond Light Source (DLS), on the RASOR diffractometer of beamline I10. The sample was placed in a similar magnet setup, again in a magnetic field of mT and at room temperature. Here, the x-rays had a degree of circular polarization of 99%. The structural properties of this sample can be found in Tab. 1, too.
BESSY II UE46PGM-1
DLS I10
| nm | nm | nm | |
| – | nm | nm | |
| Å | Å | Å | |
| – | Å | Å | |
| Å | Å | Å |
III Data analysis
III.1 XMCD
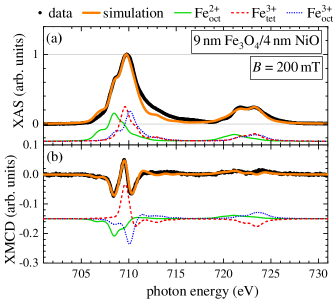
To obtain cation- and lattice-site-selective magnetooptical depth profiles, first the XMCD spectra have to be analyzed. Figures 2(a) and (b) show exemplarily XAS and XMCD spectra, respectively, of the Fe edges of the sample. Charge-transfer multiplet calculations of the three Fe cations of using the Thole code van der Laan (1997) with assistance of CTM4XAS de Groot (2005); Stavitski and de Groot (2010) provide the three individual XAS and XMCD spectra shown below the data. For these calculations, we used Ref. Kuepper et al. (2016) as a starting point: we assumed the three-cation model with crystal field energies of eV in octahedral and eV in tetrahedral coordination. The splittings between the initial and final charge-transfer states were chosen as eV and eV, and for the exchange splitting, meV was used. The multiplet states resulting from these calculations were compared to the experimental data by assuming a Gaussian instrumental broadening of eV and a Lorentzian lifetime broadening of eV at and eV at . Adding the three individual cation spectra with a 1:1:1 ratio, as expected for Fe3O4, results in a total XAS and a total XMCD spectrum (orange lines in Figs. 2(a),(b), respectively), which fit both the XAS and the XMCD data well. The multiplet analysis reveals that at those energies for which the XMCD spectrum has its extrema (eV, eV, eV), most of the XMCD signal originates from one dominant cation species Pohlmann et al. (2020). The individual contributions of each cation species to the XMCD spectrum at these three energies can be found in Tab. 2. Therefore, XRMR measurements on those energies are mostly sensitive to one specific cation species. This allows to disentangle the contributions of the individual cations to the magnetooptical depth profiles.
| Energy | |||
|---|---|---|---|
| eV | |||
| eV | |||
| eV |
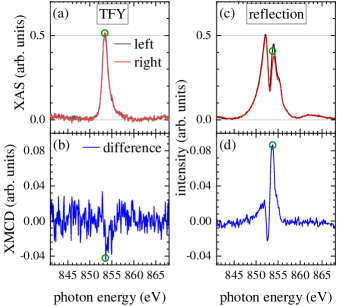
Since the TEY mode has a probing depth of about nm in Gomes et al. (2014), the TEY signal from the buried NiO film was strongly attenuated at the Ni edge. For a clearer signal, we brought a sample to beamline I10 of DLS, and measured XAS and XMCD in TFY mode at a fixed incident angle of , whose probing depth is only limited by the x-ray attenuation length in of about nm Henke et al. (1993) (cf. Figs. 3(a),(b)). Simultaneously, we measured the reflected intensity in order to obtain an estimate of the magnetooptic effects in reflection (cf. Figs. 3(c),(d)).
III.2 XRMR
The XRMR data were recorded by measuring XRR curves at resonant photon energies with extrema in the XMCD signal (maximum at eV, minimum at eV, maximum at eV, see Fig. 2(b)) with both left and right circularly polarized x-rays. Resonant ’non-dichroic’ XRR curves were obtained by averaging the signals from both helicities (right/left)
| (1) |
and the XRMR asymmetry ratios by subtracting and normalizing them:
| (2) |
These curves were then fitted with the Zak matrix formalism using the software ReMagX Macke and Goering (2014) to determine the depth profiles of the complex refractive index
| (3) |
along the film height . The optical dispersion and the optical absorption can be split into non-magnetic components , and magnetooptical components , . In the case of an in-plane magnetic field longitudinal to the x-ray beam as applied here, they can be written as Macke and Goering (2014)
| (4) | |||
| (5) |
for which the magnetooptical contributions depend on the x-ray incidence glancing angle and their sign on the helicity of the x-rays. The optical absorption is proportional to the XAS signal, while the magnetooptical absorption is proportional to the XMCD signal. Thus, is a measure of the magnetization along the film depth. A detailed review of the XRMR method and the software is given in Ref. Macke and Goering (2014), and a conclusive recipe for fitting XRMR data can be found in Refs. Kuschel et al. (2015); Klewe et al. (2016); Krieft et al. (2020).
IV Results
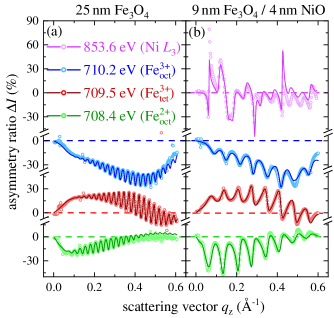
Figure 3(a) shows the XAS spectra at the Ni edge of the sample recorded with left and right circularly polarized x-rays in TFY mode, and Fig. 3(b) shows their difference. The XMCD signal is about 3% of the XAS maximum. In reflection, the magnetooptical effects become even more apparent. Note that the data are recorded at fixed incidence angle of . Therefore the scattering vector changes from to along with the energy in the range displayed in Figs. 3(c),(d). At the Ni resonant energy of eV, the magnetooptically induced change of the reflected intensity ranges up to about 8% demonstrating a strong magnetooptical signal from NiO. This energy was chosen for the XRMR measurements at the Ni resonance and is indicated by the green circles in Fig. 3.
The data and fits of the resonant XRR measurements can be found in Fig. 1 alongside with the off-resonant XRR curves recorded with keV photons. Figures 4(a) and (b) show the XRMR data for the and the samples at the three Fe resonant energies eV, eV and eV, and the Ni resonant energy eV, together with their respective fits, which describe the data very well. The fits in Fig. 4(b) were obtained from the magnetooptical depth profile models which are displayed in Fig. 5(a) for all four resonant energies of the sample. The grey line represents the optical absorption obtained from the off-resonant XRR measurement, and represents the structural depth profiles of the sample. It has three plateaus corresponding to the MgO substrate, the NiO film and finally the film, as illustrated by the sketch on top of the panel. The filled areas are the magnetooptical depth profiles at the resonant energies of the three iron cation species and the Ni energy, obtained from the XRMR asymmetry ratios.
One notable feature of these magnetooptical depth profiles is found at the surface of the films. Here, a thin layer of enhanced magnetooptical absorption is observed at eV and eV, both for the and the samples. This is likely related to a modification of the cation stoichiometry at the surface. This effect is discussed in detail in Ref. Pohlmann et al. (2020) for , and it is interesting to note that it occurs on the sample, too, as exemplified by Fig. 5(a). However, it is not the subject of the current study, which focuses on the and interfaces.

Therefore, Fig. 5(b) focuses upon the interface region of the magnetooptical depth profiles of the sample, according to the fits in Fig. 4(a). Both the interfaces of the magnetooptical depth profile at eV (green) and of the one at eV (blue) are collocated with the structural interface (grey line) at Å. However, the interface of the magnetooptical depth profile at eV (red) is shifted by a distance Å away from the interface into the Fe3O4 film. The roughnesses of magnetooptical depth profiles at both resonances follow the structural depth profile. In contrast, the roughness of the magnetooptical depth profile recorded at the energy, Å, is slightly larger than the structural roughness Å.
For the film, the results are slightly different. Figure 5(c) shows the interface region of the sample. The XRMR data at the Ni edge can be well fitted with a homogeneous magnetization profile throughout the NiO film. The interfaces of the magnetooptical depth profiles at the Ni edge and at the -related resonance at eV are collocated with the structural interface, indicating intact structural and magnetic order for both species. Notably, both their roughnesses are slightly higher, Å, Å, compared to the structural roughness Å.
In contrast to the magnetooptical depth profile at eV, which directly follows the structural profile, the profiles at eV and eV are rising with shifts of Å and Å, respectively, apart from the interface, pointing to a lack of magnetooptical absorption at resonant energies of both and at the interface.
| B-term. | (NM) | (FM) | Chang | |||
|---|---|---|---|---|---|---|
| (Å) | 0 | 0 | 0 | 1.7 | 0 | 0 |
| (Å) | 2.5 | 4.1 | 5.5 | 2.5 | ||
| (Å) | 0 | 0 | 1.7 | 1.1 | -0.5 |
V Discussion
For the Fe3O4/MgO sample, it is shown in Fig. 5(b) that the magnetooptical depth profile recorded at a photon energy of eV is displaced from the interface into the Fe3O4 film by a shift . From the quality of the fits, we can determine this shift to the range Å. Since this resonance is governed by the tetrahedrally coordinated Fe ions, this result is consistent with a B-terminated interface having octahedrally coordinated and -cations in the Fe3O4 interface layer. Figure 6(a) shows the ideal stacking order at a B-terminated interface. The oxygen lattice of the substrate continues as the oxygen lattice of the film. In [001] direction, can be described as a stack of subsequent B layers consisting of anions as well as and cations, and A layers containing cations with a distance of Å between them. The stacking of B- and A-layers is depicted as blue and red shaded areas, respectively, in Fig. 6(a) with the interface layer being a B layer (B-termination). Simulated cation depth profiles following this model are shown in Fig. 6(b). The atomically sharp distributions are smeared out using an interface roughness of Å corresponding to the experimentally determined roughness of the interface. The rising edge of the depth profile is shifted by Å from the interfaces of the and profiles into the Fe3O4 film. Because of the overlap of the individual cation spectra (cf. Fig. 2(b)), the expected magnetooptical depth profiles at the different resonant energies do not follow this behavior exactly.
Taking into account the magnetooptical contributions as derived from the multiplet calculations of each cation at each of the three energies, the expected magnetooptical depth profiles of a B-terminated interface can be calculated. They are shown in Fig. 6(c). The expected shift of the magnetooptical depth profile at eV is Å, consistent with the experimental result of Å. Therefore, the magnetooptical depth profiles indicate a B-terminated interface with no interlayer, and evidently, also no magnetic dead layer.
In this scenario, the magnetic order of all three sublattices has bulk properties down to the interface. The simulations of the B-terminated interface also predict that the apparent roughness of the magnetooptical depth profiles at eV appears to be about Å larger than the structural profile . This offers an explanation for the slight mismatch of these two roughnesses observed in the experiment. However, while the discrepancy between the model distance and the experimental distance is well within the error range, it is still substantial enough to make a discussion of alternative models worthwhile.
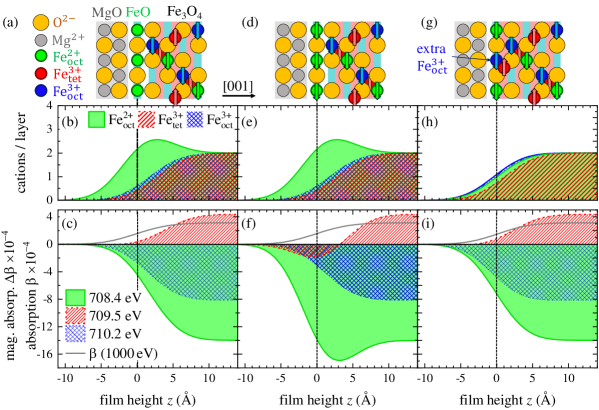
Both the and the interfaces have been studied by various methods. Spintronic devices require interfaces that are structurally, but especially also magnetically sharp. Therefore, focus has been laid on the possible presence of interlayers and intermixing at the interfaces. In the case of directly grown on a substrate, the formation of FeO interlayers has been reported on both metal and oxide substrates Gota et al. (1999); Karunamuni et al. (1999); Schlueter et al. (2011), and particularly on MgO(001) for films deposited at room temperature Bertram et al. (2012). The possibility of a single atomic interlayer is discussed in the following. The corresponding magnetooptical depth profiles are calculated in Figs. 7(a)-(f) for two scenarios.
Therefore, the first reasonable scenario is that the interlayer forms a magnetic dead layer at the interface, presented in Figs. 7(a)-(c). Figure 7(a) shows an illustration of the stacking order, Fig. 7(b) the cation depth profiles simulated with a roughness of Å, and Fig. 7(c) the resulting magnetooptical depth profiles. is paramagnetic at room temperature. Due to the magnetically dead layer, the rising edges of the magnetooptical depth profiles at both 708.4 eV and 710.2 eV are shifted about 2 Å into the Fe3O4 film compared to the structural interface (cf. Tab. 3), not consistent with the observed profiles in Fig. 5(b).
The second scenario assumes that the very thin FeO layer magnetically couples to and the magnetic order of its sublattice is extended into the FeO layer. The resulting magnetooptical depth profiles show non-monotonic behavior and differ even more from the observed ones (cf. Figs. 7(d)-(f) and Tab. 3).
Our data therefore do not indicate any magnetically dead layers, which had been considered to be the cause of the magnetization reduction in ultrathin films van der Heijden et al. (1996); Zhou et al. (2006); Gomes et al. (2014); Chang et al. (2016), nor interlayers of ferromagnetic FeO. Since it has already been shown that the magnetooptical depth profiles can be explained without an interlayer, it is unlikely that a FeO interlayer of more than a single atomic layer is present.
Another interesting model, which was proposed by Chang et al. for the growth dynamics of Chang et al. (2016) shall also briefly be mentioned here. This model suggests the first interface B-layer to contain one additional cation per unit formula [ instead of ]. An illustration can be seen in Fig. 7(g). Both the cation depth profiles and the simulated magnetooptical depth profiles resulting from this model, presented in Figs. 7(h),(i), hardly differ from the B-terminated interface shown in Figs. 6(b),(c). Although XRMR would in principle be an ideal method to test this model, the lacking spatial resolution in our experiments can neither confirm nor reject a faint phenomenon like an additional cation in the interface layer.
For the Fe3O4/NiO/MgO(001) sample, a noteworthy finding is the dichroic signal of the NiO film. Bulk NiO is an antiferromagnet at room temperature and should not show any circular dichroism. However, as demonstrated in Fig. 3, we clearly observe magnetooptical effects in both TFY mode and in reflection at the Ni edge. Interestingly, we can exclude the XMCD signal to stem from uncompensated surface spins, since the magnetooptical depth profiles clearly show a homogeneous magnetization of the entire film. Size-effects of the magnetic properties of NiO, including ferromagnetic behaviour at room temperature, have been frequently reported before, mostly for NiO nanoparticles Kodama et al. (1997); Winkler et al. (2005); Li et al. (2006); Ravikumar et al. (2015); Rinaldi-Montes et al. (2016). For ultrathin films, a spin-flop coupling of NiO to the interface has been reported Krug et al. (2008). In that case, the antiferromagnetic order of NiO aligns perpendicular to the magnetization of , but with a small canting of the moments, resulting in a magnetization component parallel to the ferrimagnet. This reaction of NiO to outer magnetic fields has also been confirmed by spin Hall magnetoresistance measurements Hoogeboom et al. (2017); Fischer et al. (2018), and can explain the presence of the observed XMCD signal.
The interface of has mostly been discussed regarding the presence of a interlayer. In reports by Gatel et al. Gatel et al. (2005) and Pilard et al. Pilard et al. (2007), high-resolution transmission electron microscopy (HRTEM) images show generally sharp interfaces between the rock salt structure of NiO and the spinel structure of . However, this only partly solves the question, because the lack of chemical and magnetic contrast cannot exclude, for instance, the formation of a rock salt phase or a spinel phase. Gatel et al. adressed this issue by performing both HRTEM and electron energy loss spectroscopy (EELS) Gatel et al. (2005). For a sample, for which the NiO film was deposited at a substrate temperature of C, indeed an intermediate phase was observed. For a stack, which had the Fe3O4 film deposited at C, the interface appeared to be chemically sharp with at most minor interdiffusion Gatel et al. (2005). The phase they observe in the stack is likely caused by thermal interdiffusion due to the high deposition temperature Kuschel et al. (2016).
A formation of a well-ordered interlayer does not match our observations. crystallizes in the same inverse spinel structure as Fe3O4, but with cations instead of sharing the B-sites with . Analogous to Fe3O4, the magnetic moments of the and cations on the B-sites align antiferromagnetically to the magnetic moments of the cations on the A-sites. For the magnetooptical depth profiles, this would imply a decrease of cations close to the interface and thus of the magnetooptical absorption at eV, while the magnetooptical absorption depth profiles for eV and eV should stay constant in a layer. Instead, we observe a reduction of the magnetooptical absorption at eV and eV as compared to the case of the interface. This behavior, together with the increased roughnesses of the magnetooptical depth profiles at the and the energies, might indicate a slight interdiffusion of into the rock salt structure of . However, this effect may not extend farther than a single atomic layer. Notably, the ferromagnetic coupling between the cations is retained down to the interface regardless of the intermixing.
VI Conclusion
We have prepared ultrathin and films by RMBE and performed XMCD and XRMR measurements to extract magnetooptical depth profiles for the individual cation species , and as well as for . These magnetooptical depth profiles show that for , the magnetic order of all three cation species is stable for the entire film with no interlayer or magnetic dead layer at the interface. For films, we observe a magnetooptical absorption at the Ni edge in the NiO film corresponding to uncompensated magnetic moments throughout the entire NiO film. The magnetooptical profiles of the iron cations reveal an intact magnetic order for the cation species down to the interface, while the magnetooptical depth profiles at the and the resonances are shifted about Å into the Fe3O4 film, possibly indicating a single intermixed layer containing both and cations.
VII Acknowledgements
Financial support from the Bundesministerium für Bildung und Forschung (FKZ 05K16MP1) is gratefully acknowledged. We are also grateful for the kind support from the Deutsche Forschungsgemeinschaft (DFG under No. KU2321/6-1, and No. WO533/20-1). The authors would like to thank Diamond Light Source for beamtime (proposal SI19173-1), and the staff of beamline I10 for assistance with data collection. We thank HZB for the allocation of synchrotron beamtime at beamline -1 (181/06266ST/R) where we recorded the XRMR and XMCD measurements.
References
- Weiss and Forrer (1929) P. Weiss and R. Forrer, Ann. Phys. 10, 279 (1929).
- Moussy (2013) J.-B. Moussy, J. Phys. D Appl. Phys. 46, 143001 (2013).
- Coey and Chien (2003) J. M. D. Coey and C. L. Chien, MRS Bulletin 28, 720 (2003).
- Bibes and Bartheélemy (2007) M. Bibes and A. Bartheélemy, IEEE Trans. Electron Devices 54, 1003 (2007).
- Žutić et al. (2004) I. Žutić, J. Fabian, and S. D. Sarma, Rev. Mod. Phys. 76, 323 (2004).
- Moyer et al. (2015) J. A. Moyer, R. Gao, P. Schiffer, and L. W. Martin, Sci. Rep. 5, 10363 (2015).
- Marnitz et al. (2015) L. Marnitz, K. Rott, S. Niehörster, C. Klewe, D. Meier, S. Fabretti, M. Witziok, A. Krampf, O. Kuschel, T. Schemme, K. Kuepper, J. Wollschläger, A. Thomas, G. Reiss, and T. Kuschel, AIP Adv. 5, 047103 (2015).
- Kim-Ngan et al. (2009) N.-T. Kim-Ngan, A. Balogh, J. Meyer, J. Brötz, M. Zajac, T. Ślezak, and J. Korecki, Surf. Sci. 603, 1175 (2009).
- Farrow et al. (2000) R. F. C. Farrow, M. J. Carey, R. F. Marks, P. M. Rice, and D. J. Smith, Appl. Phys. Lett. 77, 1191 (2000).
- Kuschel et al. (2016) O. Kuschel, R. Buß, W. Spiess, T. Schemme, J. Wöllermann, K. Balinski, A. T. N’Diaye, T. Kuschel, J. Wollschläger, and K. Kuepper, Phys. Rev. B 94, 094423 (2016).
- Rodewald et al. (2019) J. Rodewald, J. Thien, T. Pohlmann, M. Hoppe, F. Timmer, F. Bertram, K. Kuepper, and J. Wollschläger, Phys. Rev. B 100, 155418 (2019).
- Bertram et al. (2011) F. Bertram, C. Deiter, K. Pflaum, M. Suendorf, C. Otte, and J. Wollschläger, J. Appl. Phys 110, 102208 (2011).
- Bertram et al. (2012) F. Bertram, C. Deiter, O. Hoefert, T. Schemme, F. Timmer, M. Suendorf, B. Zimmermann, and J. Wollschläger, J. Phys. D Appl. Phys. 45, 395302 (2012).
- van der Heijden et al. (1996) P. van der Heijden, P. Bloemen, J. Gaines, J. van Eemeren, R. Wolf, P. van der Zaag, and W. de Jonge, J. Magn. Magn. Mater. 159, L293 (1996).
- van der Zaag et al. (2000) P. van der Zaag, P. Bloemen, J. Gaines, R. Wolf, P. van der Heijden, R. van de Veerdonk, and W. de Jonge, J. Magn. Magn. Mater. 211, 301 (2000).
- Kado (2008) T. Kado, Appl. Phys. Lett. 92, 092502 (2008).
- Keller et al. (2002) J. Keller, P. Miltényi, B. Beschoten, G. Güntherodt, U. Nowak, and K. D. Usadel, Phys. Rev. B 66, 014431 (2002).
- Gatel et al. (2005) C. Gatel, E. Snoeck, V. Serin, and A. Fert, Eur. Phys. J. B 45, 157 (2005).
- Krug et al. (2008) I. P. Krug, F. U. Hillebrecht, M. W. Haverkort, A. Tanaka, L. H. Tjeng, H. Gomonay, A. Fraile-Rodríguez, F. Nolting, S. Cramm, and C. M. Schneider, Phys. Rev. B 78, 064427 (2008).
- Kuepper et al. (2016) K. Kuepper, O. Kuschel, N. Pathé, T. Schemme, J. Schmalhorst, A. Thomas, E. Arenholz, M. Gorgoi, R. Ovsyannikov, S. Bartkowski, G. Reiss, and J. Wollschläger, Phys. Rev. B 94, 024401 (2016).
- Mariotto et al. (2002) G. Mariotto, S. Murphy, and I. V. Shvets, Phys. Rev. B 66, 245426 (2002).
- Bliem et al. (2014) R. Bliem, E. McDermott, P. Ferstl, M. Setvin, O. Gamba, J. Pavelec, M. A. Schneider, M. Schmid, U. Diebold, P. Blaha, L. Hammer, and G. S. Parkinson, Science 346, 1215 (2014).
- Weschke and Schierle (2018) E. Weschke and E. Schierle, Journal of large-scale research facilities 4, A127 (2018).
- van der Laan (1997) G. van der Laan, J. Electron Spectros. Relat. Phenomena 86, 41 (1997).
- de Groot (2005) F. de Groot, Coord. Chem. Rev. 249, 31 (2005).
- Stavitski and de Groot (2010) E. Stavitski and F. M. de Groot, Micron 41, 687 (2010).
- Pohlmann et al. (2020) T. Pohlmann, T. Kuschel, J. Rodewald, J. Thien, K. Ruwisch, F. Bertram, E. Weschke, P. Shafer, J. Wollschläger, and K. Küpper, Phys. Rev. B 102, 220411 (2020).
- Gomes et al. (2014) G. F. M. Gomes, T. E. P. Bueno, D. E. Parreiras, G. J. P. Abreu, A. de Siervo, J. C. Cezar, H.-D. Pfannes, and R. Paniago, Phys. Rev. B 90, 134422 (2014).
- Henke et al. (1993) B. Henke, E. Gullikson, and J. Davis, At. Data Nucl. Data Tables 54, 181 (1993).
- Macke and Goering (2014) S. Macke and E. Goering, J. Phys. Condens. Matter 26, 363201 (2014).
- Kuschel et al. (2015) T. Kuschel, C. Klewe, J.-M. Schmalhorst, F. Bertram, O. Kuschel, T. Schemme, J. Wollschläger, S. Francoual, J. Strempfer, A. Gupta, M. Meinert, G. Götz, D. Meier, and G. Reiss, Phys. Rev. Lett. 115, 097401 (2015).
- Klewe et al. (2016) C. Klewe, T. Kuschel, J.-M. Schmalhorst, F. Bertram, O. Kuschel, J. Wollschläger, J. Strempfer, M. Meinert, and G. Reiss, Phys. Rev. B 93, 214440 (2016).
- Krieft et al. (2020) J. Krieft, D. Graulich, A. Moskaltsova, L. Bouchenoire, S. Francoual, and T. Kuschel, J. Phys. D Appl. Phys. 53, 375004 (2020).
- Chang et al. (2016) C. F. Chang, Z. Hu, S. Klein, X. H. Liu, R. Sutarto, A. Tanaka, J. C. Cezar, N. B. Brookes, H.-J. Lin, H. H. Hsieh, C. T. Chen, A. D. Rata, and L. H. Tjeng, Phys. Rev. X 6, 041011 (2016).
- Gota et al. (1999) S. Gota, E. Guiot, M. Henriot, and M. Gautier-Soyer, Phys. Rev. B 60, 14387 (1999).
- Karunamuni et al. (1999) J. Karunamuni, R. L. Kurtz, and R. L. Stockbauer, Surf. Sci. 442, 223 (1999).
- Schlueter et al. (2011) C. Schlueter, M. Lübbe, A. Gigler, and W. Moritz, Surf. Sci. 605, 1986 (2011).
- Zhou et al. (2006) Y. Zhou, C. McEvoy, R. Ramos, and I. V. Shvets, J. Appl. Phys 99, 08J111 (2006).
- Kodama et al. (1997) R. H. Kodama, S. A. Makhlouf, and A. E. Berkowitz, Phys. Rev. Lett. 79, 1393 (1997).
- Winkler et al. (2005) E. Winkler, R. D. Zysler, M. V. Mansilla, and D. Fiorani, Phys. Rev. B 72, 132409 (2005).
- Li et al. (2006) L. Li, L. Chen, R. Qihe, and G. Li, Appl. Phys. Lett. 89, 134102 (2006).
- Ravikumar et al. (2015) P. Ravikumar, B. Kisan, and A. Perumal, AIP Adv. 5, 087116 (2015).
- Rinaldi-Montes et al. (2016) N. Rinaldi-Montes, P. Gorria, D. Martínez-Blanco, A. B. Fuertes, I. Puente-Orench, L. Olivi, and J. A. Blanco, AIP Adv. 6, 056104 (2016).
- Hoogeboom et al. (2017) G. R. Hoogeboom, A. Aqeel, T. Kuschel, T. T. M. Palstra, and B. J. van Wees, Appl. Phys. Lett. 111, 052409 (2017).
- Fischer et al. (2018) J. Fischer, O. Gomonay, R. Schlitz, K. Ganzhorn, N. Vlietstra, M. Althammer, H. Huebl, M. Opel, R. Gross, S. T. B. Goennenwein, and S. Geprägs, Phys. Rev. B 97, 014417 (2018).
- Pilard et al. (2007) M. Pilard, O. Ersen, S. Cherifi, B. Carvello, L. Roiban, B. Muller, F. Scheurer, L. Ranno, and C. Boeglin, Phys. Rev. B 76, 214436 (2007).