Mid-InfraRed Outbursts in Nearby Galaxies (MIRONG). II. Optical Spectroscopic Follow-up
Abstract
Infrared echo has proven to be an effective means to discover transient accretion events of supermassive black holes (SMBHs), such as tidal disruption events (TDEs) and changing-look active galactic nuclei (AGNs), in dusty circumnuclear environments. To explore the dusty populations of SMBH transient events, we have constructed a large sample of Mid-infrared Outbursts in Nearby Galaxies (MIRONG) and performed multiwavelength observations. Here we present the results of multiepoch spectroscopic follow-up observations of a subsample of 54 objects spanning a time scale of 4 yr. Emission-line variability was detected in 22 of them with either emergence or enhancement of broad Balmer emission lines in comparison with pre-outburst spectra. Coronal lines, and Bowen line appeared in the spectra of nine,seven and two sources, respectively. These results suggest that MIRONG is a mixed bag of different transient sources. We have tentatively classified them into different subclass according to their spectral evolution and light curves. Two sources have been in a steady high broad H flux up to the latest observation and might be turn-on AGNs. Broad lines faded out in the remaining sources, indicating a transient ionizing source ignited by TDE or sporadic gas accretion. Thirty-one sources do not show noticeable spectral change with respect to their pre-outburst spectra. They have a statistically redder MIR color and lower MIR luminosity of the outbursts,which are consistent with heavily obscured events.
1 Introduction
Time-domain astronomy, which is promoted by wide-field, deep and fast surveys, has experienced great progress recently and resulted in the explosive growth of the discovery speed of various transients. Among them, the nuclear transients associated with supermassive black holes (SMBHs) have gradually become a regular class of targets in the past decade though their nature remains to be explored in many cases (e.g., Kankare et. 2017; Trakhtenbrot et al. 2019; Hinkle et al. 2021; Malyali et al. 2021).
SMBHs are ubiquitous in the centers of massive galaxies. Most of them are inactive in the local universe (Kormendy & Ho 2013). Occasionally, a dormant SMBH undergoes a temporary accretion phase when a star in the nucleus wanders within the tidal radius and gets torn apart. Part of the stellar debris will be accreted by the SMBH, producing a luminous flash of electromagnetic radiation peaked at soft X-ray to ultraviolet (UV) bands. The process is called a tidal disruption event (TDE; Rees 1988; Evans & Kochanek 1989; Phinney 1989).
Though predicted in the 1970s, the discovery of TDEs was not realized until the late 1990s (Bade et al. 1996) because their rarity makes the discovery rather challenging. First, the duration of a TDE is short, which normally rises to a peak in one month and then decays in months to years. Second, the event rate is as low as /galaxy/year (Wang & Merritt 2004; Stone & Metzger 2016). The accumulated number of TDEs to date remains in two digits. Nevertheless large optical surveys, such as the Zwicky Transient Facility (ZTF), have greatly advanced the searching efficiency in the past few years (see review by Gezari 2021), and will eventually bring the field into the era of population study (van Velzen et al. 2021a). TDEs offer us a unique opportunity to probe SMBHs in normal galaxies (Lu et al. 2017; Mockler et al. 2019; Pasham et al. 2019) and the life cycle of accretion disks (e.g., Wevers et al. 2019) as well as jets (e.g., Bloom et al. 2011; Burrows et al. 2011; Mattila et al. 2018; Alexander et al. 2020).
In addition to TDEs, SMBHs may also experience sporadic gas accretion due to instability of the accretion flow or stochastic infall of cold gas clouds, such as G1/2 in the Galactic center. In some active galactic nuclei (AGNs), broad emission lines appear/disappear in response to the dramatic change of the central ionizing continuum on time scales from a few months to a few years. They are dubbed as ”changing-look” AGNs (e.g., Shappee et al. 2014; LaMassa et al. 2015; MacLeod et al. 2016; Yang et al. 2018; Guo et al. 2019; Sheng et al. 2020). In the most extreme cases, a quiescent galaxy is transformed to an AGN or vice versa, called ”turn-on” (Gezari et al. 2017; Frederick et al. 2019; Yan et al. 2019) or ”turn-off” AGNs (e.g., Runnoe et al. 2016). The dramatic change of their accretion rate has already posed a serious challenge to canonical accretion disk theories. Moreover, the event rate statistics of changing-look AGNs may advance our knowledge of the AGN duty cycle, which might impact the evolution of their host galaxies via feedback.
Given the importance of TDEs and changing-look AGNs, a systematic search for them is a pressing need. The search hitherto has mainly focused on the optical band and yielded a mounting number of TDEs (e.g., van Velzen et al. 2020, 2021a) and turn-on AGNs (e.g., Frederick et al. 2019) discovered in real time, which allows prompt follow-up observations. However, the optical search is unavoidably affected by dust extinction and thus may overlook events in dusty environments. For instance, the low dust-covering factor of optical TDEs suggests that the optical band might be merely effective in unveiling TDEs in very dust-poor environments (Jiang et al. 2021b). Fortunately, obscured events may expose themselves as reprocessed infrared (IR) emission by dust in the vicinity of SMBHs (Lu et al. 2016), namely IR echoes of TDEs (Dou et al. 2016; Jiang et al. 2016; van Velzen et al. 2016, 2021b) and changing-look AGNs (Sheng et al. 2017), which are relatively transparent in the mid-infrared (MIR) to a moderately thick obscurer. Systematic searches in the IR have already led to successful discoveries of completely obscured TDEs (e.g., Mattila et al. 2018; Kool et al. 2020). The other potential use of an IR search is its ability to reveal transients that are optically weak but luminous in higher-energy bands (e.g., UV and X-rays). Actually, classic TDE models predict emissions from accretion exactly in such wavelength regimes.
Encouraged by the powerful IR echoes (e.g., Wang et al. 2018a; Sheng et al. 2020), we have recently carried out a systematic search of ongoing outbursts in the MIR band using archival Wide-field Infrared Survey Explorer (WISE) light curves. We obtained a sample of 137 MIR outbursts in nearby galaxies (MIRONG) at , which showed a sudden brightening of mag in at least one WISE band (Jiang et al. 2021a, hereafter Paper I). The Majority of these MIRONG do not have any known corresponding optical flares, indicating dust extinction or intrinsic weakness in the optical band. Their MIR luminosities are markedly brighter than those of known supernovae (SNe) and their physical locations are very close to the galactic center (median ), suggesting strongly that they are dust echoes of transient accretion events onto SMBHs. Multiwavelength follow-up observations have been undertaken since 2017 to investigate the nature of the newly unveiled MIRONG. In particular, their optical spectroscopic observations are a key part of the monitoring and can provide the most direct imprint of the outburst by probing the variability of characteristic emission lines.
This paper is the second one in the series of MIRONG and is dedicated specifically to the spectral evolution of MIRONG. We assume a cosmology with km s-1 Mpc-1, , and .
2 Sample Description and Observation Strategy
The spectroscopic sample was drawn from the parent MIRONG sample as described in Paper I. In order to capture potential spectral signals in a timely manner for rapidly evolving transients, such as TDEs, we select targets that are still in the early stage of the outburst for spectroscopic observations. . Our observing campaign started in 2017 April, and a total of 54 objects have been observed up to 2021 March. The median redshift is 0.09, which is similar to the parent sample.
The observations were carried out with either the Double spectrograph (DBSP) mounted on the Hale 200 inch telescope at Palomar observatory (Oke & Gunn 1982) or the Kast DBSP on the Shane telescope at Lick observatory (Miller & Stone 1993). We adopt the D55 dichroic for Hale 200 inch telescope, which splits the incoming light into separate red and blue channels at Å for two different gratings, with a blue grism of 600 lines per mm blazed at 3780 Å and a red grism of 316 lines per mm blazed at 7150 Å . The slit width of 1″, 1.″5 or 2″ was used depending on the weather. Such setup achieves a resolution of 5.23-10.46 Å in the red channel and 2.76-5.32 Å in the blue channel with a full spectral wavelength coverage of about 3100-10500 Å. With a proper exposure time chosen for each source, the median signal-to-noise ratios (S/N) are 14.2 and 25.6 , respectively, for the blue- and red-end DBSP spectra. The Shane telescope was configured with a D57 dichroic, blue grism of 600 lines per mm blazed at 4130 Å, red grating of 600 lines per mm blazed at 7500 Å and slit widths of 1″ or 1.″5 , which result in a resolution of 2.4-3.6 Å on the blue end and 3.0-4.5 Å on the red end and a full spectral wavelength coverage of about 3000-10000 Å . Slightly lower median S/N of 6.1 (blue) and 11.8 (red) were approached. Besides, there are also two spectra acquired for J1115+0544 from Keck and LAMOST (Yan et al. 2019). Details on the exposure time and slit selection for every single observation could be found in the Appendix A.
All spectra were reduced according to the standard reduction procedures for a long-slit spectrum. They were flux calibrated with the standard stars observed in the same night.
3 Data Analysis and Results
The main goal of this work is to identify the spectral features accompanying the MIR outburst by comparing the spectra taken before and after the MIR outburst, and their subsequent evolution. Although variations of prominent emission lines are obvious in many cases, a thorough analysis is essential to acquire robust detection and measurements of weak emission lines and for the entire sample.
3.1 Subtraction of the Continuum
Aiming at detecting potential characteristic emission-line variation, we began our analysis with subtraction of continuum. These spectra are first corrected for Galactic extinction using the extinction map of Schlegel et al. (1998) and the extinction curve of Fitzpatrick (1999).
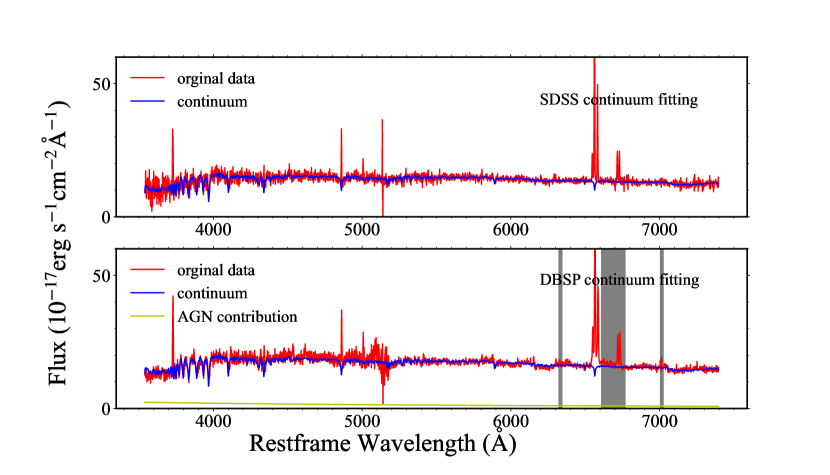
Because the SDSS spectra are dominated by starlight, we fit them using the procedure PPXF (Cappellari & Emsellem 2004; Cappellari 2017) and MILES spectral library (Vazdekis et al. 2010). Nevertheless, the AGN continuum is likely not negligible for eight broad-line objects (§ 3.2), while the PPXF is a pure starlight component fitting code. So for these eight sources, we used the spectral decomposition results of Paper I instead. The fitting of J1647+3843 is shown as an example in Figure 1.
For the DBSP spectra observed after the MIR flare, an additional continuum component associated with the MIR outburst is possible. We thus also placed a reddened power-law continuum assuming an extinction curve of the Galactic dust (Fitzpatrick 1999), as normally appears in broad-line AGNs, in the fitting. On the other hand, the shape of the starlight component remains exactly the same as that of the SDSS spectrum. Accordingly, we fit the continuum of DBSP spectra using the following formula:
is the starlight component of the same source obtained by applying the PPXF procedure to the spectrum, and the power-law index was set to be in the range between -2 and -1. The is the extinction curve and varies from 0 to 2.5.
The fitting was done by Python code MPFIT 111http://code.google.com/p/astrolibpy/source/browse/trunk/ and the errors of the parameters were estimated from Monte Carlo simulations. We show an example in the bottom panel of Figure 1.
3.2 Emission-line Fitting and Detection Criteria
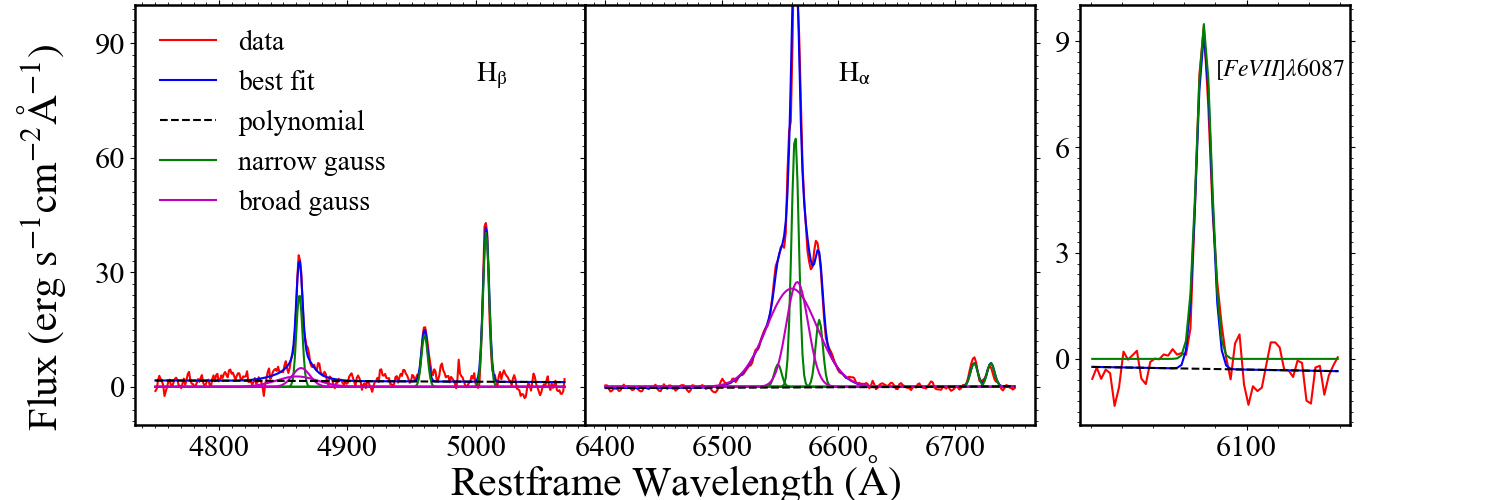
After subtracting the continuum, the emission-line spectrum is modeled with a combination of Gaussian functions in several segments to measure the line fluxes of various broad and narrow lines. The broad lines include , , He II and Bowen line N iii. The narrow lines contain [O III] ,[N II] ,[S II] , [Ne iii]. Each narrow line is modeled with one or two Gaussians, while broad and are fitted simultaneously with Gaussians of the same width and centroid in velocity. The number of Gaussians is determined according to the 95% threshold of improvement with the F-test by adding one more Gaussian to the fit. We show an example of and fitting results in the Figure 2.
However, a reliable detection of broad H requires not only at least one broad component as suggested by the F-test but a criterion was also demanded. Accordingly, eight sources in our sample have reliable broad H detection in the SDSS spectra, which are taken before the MIR flare (see appendix A). For DBSP spectra, usually with multiple epochs, we have fitted and tried to detect broad H in each of them. If there is no broad component detected in , we take the flux at the 90% confidence level as the upper limit which is derived from (Avni 1976). We will adopt broad H, which is usually the strongest, if exists, to represent the evolution of broad components.
We consider seven common coronal lines, namely , , , , , and . Each is fitted with one Gaussian of FWHM1500 while a linear function has also been added to represent the local residual continuum (see Figure 2 for an example). An F-test is employed to assess whether the Gaussian component is necessary or not. A line is detected if its flux is above the 3 level. The presence of coronal lines is defined as the detection of three coronal lines or two lines with one above the level in the same epoch, or a coronal line in multiple epochs. According to the above rule, no coronal lines were present in all our SDSS spectra but they show up in the post-outburst spectra of nine objects.
3.3 Emission-Line Variations
Next we begin to check the emission-line variability between DBSP and SDSS spectra. Obviously, if broad H is reliably detected in the SDSS spectrum, one has to measure the line flux to assess whether it is variable or not. This requires a reliable flux calibration. Although our spectra were already flux calibrated using a standard star, due to changes in weather conditions over the night, significant uncertainty could be introduced. With a reliable broad H indicating significant nuclei activity, recalibration was done based on the normalization of the flux, which is assumed to be constant for the Seyfert galaxy over the monitoring timescale (Peterson et al. 2013). The variability of broad H then was acquired by checking whether its flux at any epoch during the follow-up observations has changed by relative to the SDSS one or not. However, recalibration could not be implemented for J2215-0107, one of the eight sources with reliable broad H detection in SDSS spectra , due to the too-low spectra quality, and we just removed it without further discussion (hence, 53 left). Significant variation of broad H was found in the left seven. Counting those with newly emerged broad H , 22 in our samples display variation of broad H and the appearance of coronal lines was in 9 of them. According to whether or not the variability of H or coronal lines is detected, our sample can be classified into three subclass (see Table 1). It is interesting to note that there is no object in our sample that shows only variation in coronal lines.
Additionally, as the flux of the seven with reliable broad H in SDSS spectra and other Seyfert 2 galaxies was expected to be constant in our multiple DBSP follow-up spectra and the same as that of SDSS, the scatter of the flux normalized by the SDSS ones could thus be used to estimate the accuracy of the original flux calibration. The median value of the scatter is about 0.17 dex. When we focused on the long-term evolution (see Section 3.3.2), such uncertainty would be taken into consideration for MIRONG starting from normal galaxies without a reliable broad H detection in SDSS and only when the variation amplitude exceeds 0.17 dex do we think there is an upward or downward trend.
| Class | Number | H | H-CL | None | Percentage |
|---|---|---|---|---|---|
| (1) | (2) | (3) | (4) | (5) | (6) |
| Starforming | 15 | 4 | 1 | 10 | 33.3% |
| Composite | 20 | 3 | 4 | 12 | 35.0% |
| Seyfert 1 | 4 | 2 | 2 | 0 | 100% |
| Seyfert 2 | 5 | 2 | 1 | 2 | 60.0% |
| LINER | 9 | 2 | 1 | 6 | 33.3% |
| Total | 53 | 13 | 9 | 31 | 41.5% |
Note. — The spectroscopically observed sample has been classified into three types (columns 3-5) based on the variability of broad H and coronal lines, noting that there is none with only coronal line variability. Column (1): BPT class from SDSS spectra, which was collected from Paper I. Column (2): the number of objects in each class. Column (3): the number of objects with variations in broad H but not coronal lines. Column (4): the number of objects with variations in both broad H and coronal lines. Column (5): the number of objects with neither broad H nor coronal line variations. Column (6): the percentage of sources that show emission-line variability (H or H-CL) in the given class.
3.3.1 The Variability in Different Galaxy Types
First, the percentage of objects that display emission-line variability differs greatly in different spectral types (see Table 1). It is remarkable yet not surprising to note that Seyfert galaxies possess the highest fraction given that AGNs display ubiquitous variability in both continuum and emission lines. In particular, all four Seyfert 1 galaxies show obvious H variations, with coronal lines being detected in two of them. Though obvious variability is not expected for normal Seyfert 2 galaxies (e.g.,Yip et al. 2009), the line variability found for the Seyfert 2 galaxies in our sample is understandable, because there is a high possibility for them to be changing-look AGNs considering the selection criteria. In contrast to Seyfert galaxies, the star-forming (SF) and composite galaxies present significantly lower portion of variability (33.3% and 35%, respectively), with the former dominated by H while the latter is dominated by H-CL variations. Low-ionization nuclear emission-line regions (LINERs), which are usually considered to be photoionized by a weak AGN (Ferland & Netzer 1983; Halpern & Steiner 1983), hold the ratio same as star-forming galaxies though.
| Name | BPT | Time Coverage | Behavior | Iron CLs | Interpretation | ||
|---|---|---|---|---|---|---|---|
| (1) | (2) | (3) | (4) | (5) | (6) | (7) | (8) |
| J0205+0004 | SF | 2017-2021 | Restored | TDE | |||
| J0859+0922 | SF | 2018-2021 | Declining | TDE | |||
| J1549+3327 | SF | 2017-2020 | Restored | TDE | |||
| J1620+2407 | SF | 2019-2021 | Declining | TDE | |||
| J1647+3843 | SF | 2018-2021 | Declining | TDE | |||
| J1043+2716 | Composite | 2017-2021 | Declining | TDE | |||
| J1111+5923 | Composite | 2018-2020 | Declining | TDE | |||
| J1442+5558 | Composite | 2017-2021 | Maintain | Turn-on | |||
| J1513+3111 | Composite | 2017-2021 | Declining | TDE | |||
| J2203+1124 | Composite | 2017-2019 | Declining | TDE | |||
| J1315+0727 | Composite(b) | 2017-2017 | Rising | AGN Flare33“AGN flare” means we stopped at the result that these MIRONG were caused by AGN activity, without further preference for detailed physical processes behind (see 4.3) | |||
| J1332+2036 | Composite(b) | 2017-2021 | Declining | AGN Flare | |||
| J1133+6701 | LINER(b) | 2018-2021 | Restored | AGN Flare | |||
| J1115+0544 | LINER | 2016-2021 | Restored | TDE | |||
| J1632+4416 | LINER | 2017-2018 | Restored | TDE | |||
| J1003+0202 | Seyfert 2 | 2018-2021 | Maintain | Turn-on | |||
| J1238+0815 | Seyfert 2 | 2017-2017 | Declining | AGN Flare | |||
| J1657+2345 | Seyfert 2 | 2017-2021 | Declining | TDE | |||
| J0120-0829 | Seyfert 1(b) | 2017-2018 | Restored22The H had already declined to a level lower than in the SDSS spectrum after 5 months since brightening at the first epoch, yet it shows a rising trend again later, that is consistent with rebrightening in the MIR. | AGN Flare | |||
| J1105+5941 | Seyfert 1(b) | 2017-2021 | Declining | TDE | |||
| J1402+3922 | Seyfert 1(b) | 2017-2021 | Restored11The H in the two Seyfert I galaxies returned to the pre-outburst level about 1 yr after the first spectroscopic follow-up, continued to fade out and almost disappeared completely in the last epoch. | TDE | |||
| J1537+5814 | Seyfert 1(b) | 2017-2021 | Restored11The H in the two Seyfert I galaxies returned to the pre-outburst level about 1 yr after the first spectroscopic follow-up, continued to fade out and almost disappeared completely in the last epoch. | AGN Flare |
Note. — This is a summary table of the 22 sources with emission-line variation. Column (2): BPT class from SDSS spectra. The galaxy types followed by a “b” in parentheses indicate that apparent broad Balmer lines were detected in their SDSS spectra according to the criteria in Section 3.2. Column (3): the first and last years of the follow-up observation. Column (4): all of the 22 sources show enhancement or emergence of broad H, but their subsequent evolution behaviors are somewhat different, which could be generally divided into the following four types.(i)“Rising”: the H rises up continuously to the end of observations. (ii) “Declining”: the H apparently fades after enhancement but it is still at a level higher than in the SDSS spectra in the latest observation. (iii) “Restored”: the H shows a declining trend after the enhancement and it has almost returned back to the same level as SDSS now; (iv) “Maintain”, the H stays at a high level without a notable declining trend after the enhancement. Column (5):“” means iron coronal lines were detected in the DBSP spectra while “” means not. Column (6):same as column (5) but gives the detection of . Column (7):detection of or not. Column (8):preliminary interpretation of the MIRONG based on the spectral evolution.
3.3.2 Long-term Evolution of Broad H and Coronal Lines
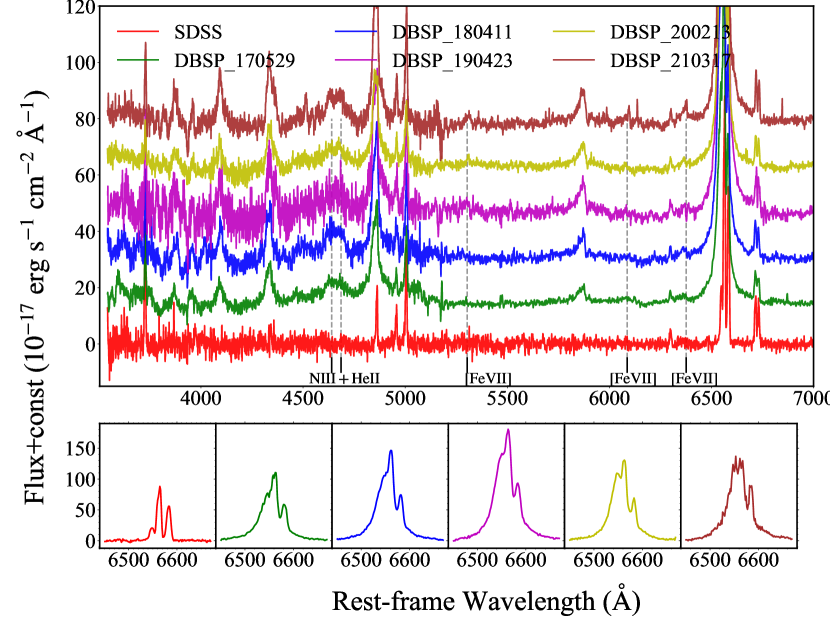
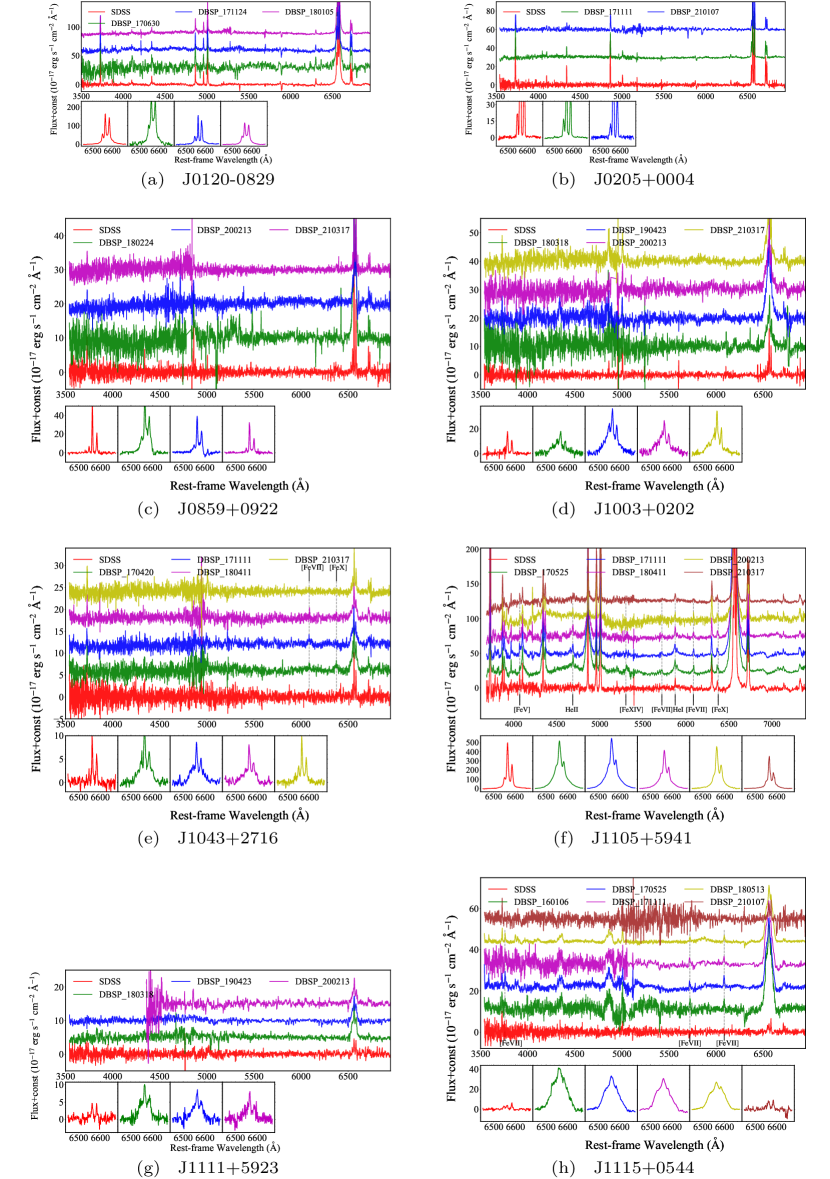
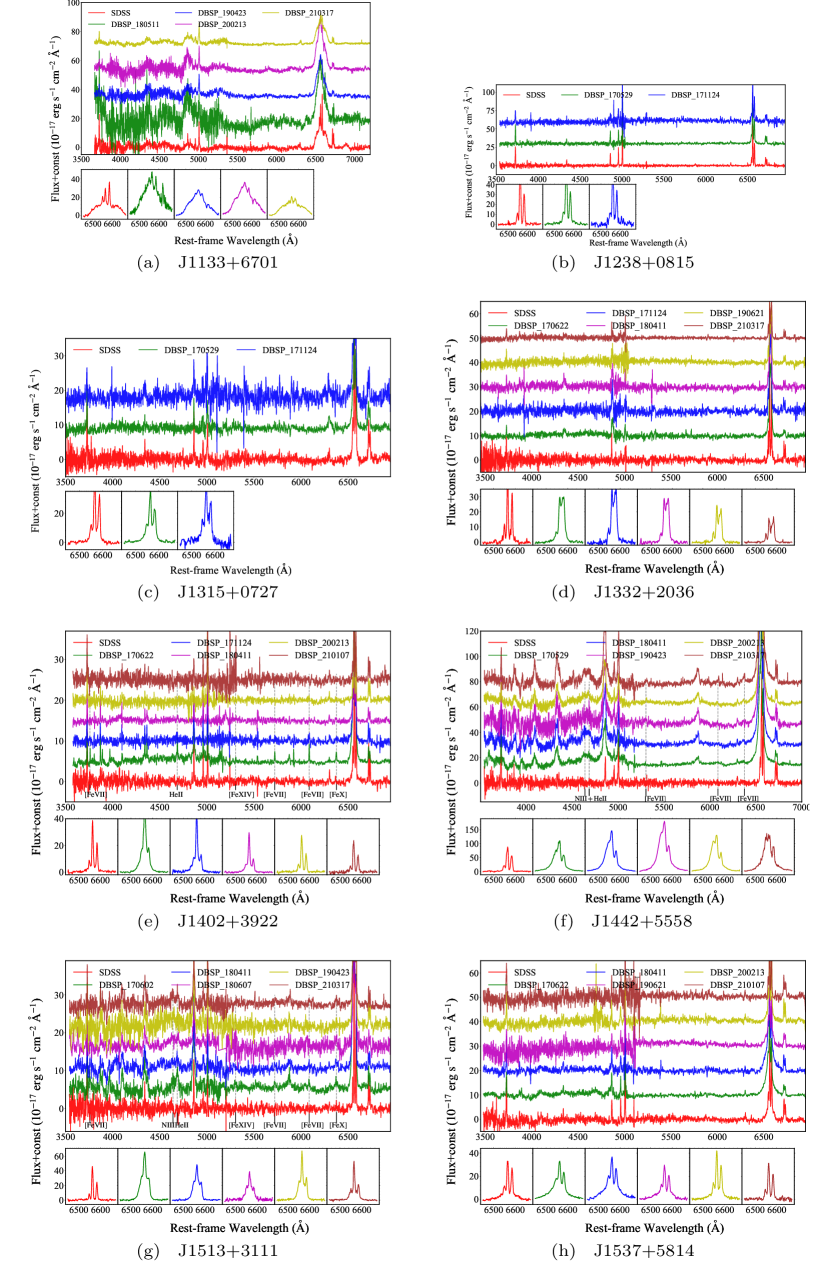
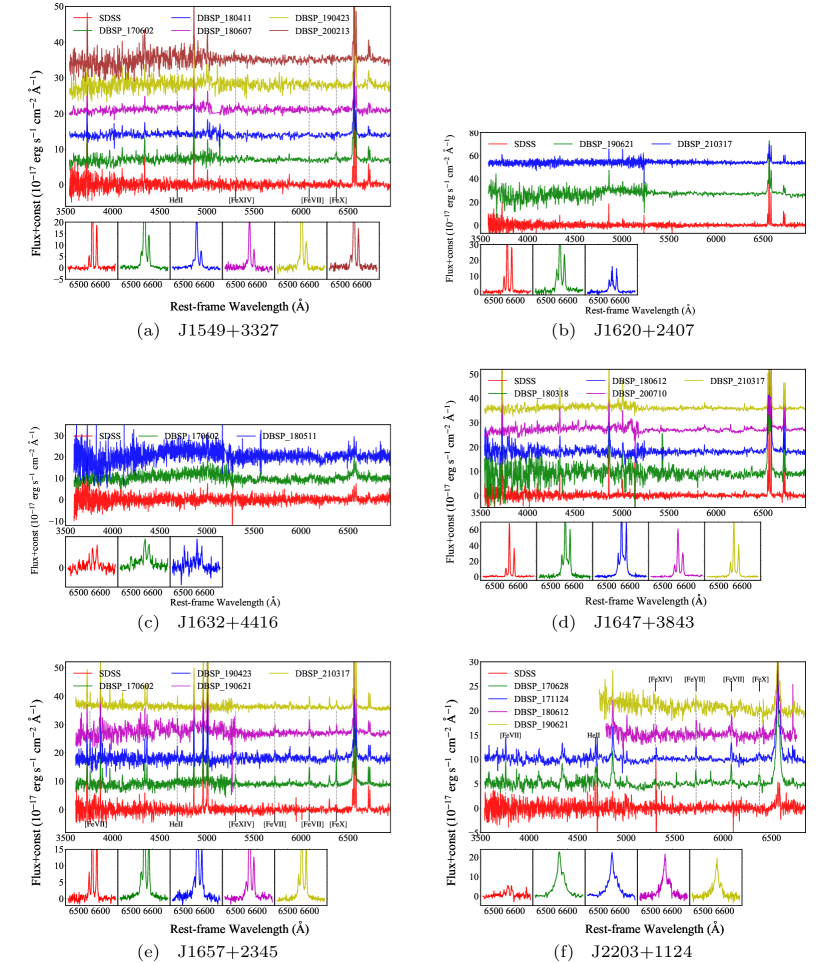
All 22 objects with detection of emission-line variability with respect to SDSS spectra show an apparent increase in broad H emission while only a small fraction of them show coronal-line variations. Except for J1442+5558 and J1003+0202, the strength of H declines again in the subsequent observations although most of them have not returned back to the flux level of SDSS as of the latest epoch. It indicates that the H emission fades slowly and a minority of them may sustain for a long time. Despite of their weakness, coronal lines clearly fade out after the first follow-up observation except for J1442+5558, whose coronal lines have just emerged in recent DBSP spectra while H has been detected in the first DBSP. We show the spectral evolution of J1442+5558 in Figure 3, and all 22 sources with emission line variation in Appendix B.
3.3.3 and
During our spectroscopic analysis, we have noticed that some of them also show variations of and Bowen line apart from broad Balmer lines and iron coronal lines. Particularly, 7 of the 10 H-CL sources present , with two of them (J1442+5558 and J1513+3111) even with emission. Both and lines are frequently detected in TDEs (van Velzen et al. 2021a).
3.4 Sources without a Visible Spectral Change
Among the 53 useful sources, 22 show obvious emission variability in at least broad H, while the other 31 appear unchanged in optical spectra according to our observations. It is necessary to explore whether the nondetection is intrinsic or simply caused by selection effects. First, we have examined the S/N of the spectroscopic data of the variable and nonvariable subsamples as the higher-quality data are undoubtedly more helpful for the detection of weak emission lines embedded in the continuum. However, no obvious difference is found.
As we have shown in section 3.3.2, the H and iron coronal lines of most objects show apparent decreasing trends after brightening. Some of them have even disappeared rapidly, demanding quick spectral follow-ups to capture the variations. For this reason, if the spectroscopic observations were conducted too late, we might miss the fleeting emissions . We have calculated the time separation between the spectroscopic observational date and the first MIR brightening epoch ( brightening in either the or band; see details in Paper I). There is no significant difference between the spectral variable and nonvariable subclass according to a Kolmogorov–Smirnov (K-S) test. It seems that the nondetection of spectral variability should not be a consequence of too-late observations if the two subclasses share comparable decay timescales.
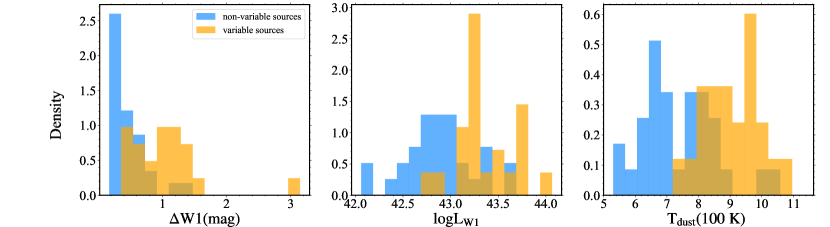
Dust is ubiquitous in galaxies from galactic disks to galactic centers. It is especially considerable for our MIRONG sample because they were selected by IR echoes radiated by the circumnuclear dust around SMBHs. The dust along the light of sight can obscure the optical photons, making them undetectable in both continuum and emission lines. Figure 4 shows the band variability amplitude , peak luminosity , dust temperature (data drawn from Paper I, also a significant difference in and ). All three parameters show a significant difference between the variable and nonvariable subclass based on a K-S test with the value being , and , respectively. In detail, the nonvariable sources have lower , and , which can be explained by the self-obscuration of dust emission. We have checked the narrow-line Balmer decrements of the two populations and found no difference, indicating a similarity in galactic-scale dust. The dust discrepancy between them might be in the galactic nucleus.
We have also looked into the distributions of other parameters, including and the rising and decay timescales of MIR light curves. All show negligible differences.
4 Discussion
Optical spectra usually carry vital information for deciphering the nature of unknown transients. Aiming to explore the nature of the MIRONG sample, we have conducted extensive follow-up observations. Prominent emission-line variability has been detected in 22 out of the 53 objects (see details in Table 2). By means of the spectral results, we will show that the SN scenario is further proved to be the less likely case, corroborating the associations with SMBHs as proposed in paper I. Specifically, we will try to understand the MIR outburst under the context of diverse transient accretion events of SMBHs, such as TDEs, turn-on AGNs, or sporadic gas accretion. Even for those without a visible spectral change, some clues can also be acquired.
4.1 SN Scenario Is Further Disfavored
In fact, the SN scenario has been largely excluded (paper I) based on MIRONG’s high MIR luminosity (see also Wang et al. 2018a) and their proximity to the galaxy center. Spectroscopic evolution further supports this conclusion.
First, the varying components in the optical spectra overwhelmingly feature emission but without notable absorption lines that are atypical for conventional SNe (Filippenko 1997). Further, the broad H lasts typically 2-4 yr or more from their first detection in our sample, which is also in sharp contrast with the fast decline for a typical Type II SN (e.g., Uomoto & Kirshner 1986; Sahu et al. 2006). Only a subclass of SNe (Type IIn), which shows the signatures of the interaction between the SN ejecta and the circumstellar medium and exhibits obvious Balmer emissions, most notably H, with a weak or absent broad absorption component (Schlegel 1990; Filippenko 1997), bears some similarities with our sample. And some objects ,such as SN2010jl (Fransson et al. 2014; Moriya et al. 2020), SN2015da (Tartaglia et al. 2020), SN2005ip (Stritzinger et al. 2012; Fox et al. 2020), and SN2006jd (Stritzinger et al. 2012), displayed a long-lasting broad H with similar line luminosity to our sample and could be accompanied by coronal lines. However, their late-time spectra usually show prominent low-ionization emission lines such as near-infrared triplets and , which are completely absent in our spectra. Hence, our spectroscopic results argue against an SN origin.
4.2 MIRONG Occurring in Normal or Weak-AGN Galaxies
The final sample of the 22 spectroscopically variable sources consists of 7 Seyfert galaxies according to their SDSS BPT classification. In addition, we note that there are three more galaxies in other classes, that is J1315+0727, J1332+2036 (composite), and J1133+6701 (LINER), that show evident broad H in their SDSS spectrum. Therefore, we grouped the 10 sources (Seyferts or with a broad-line) into a subsample of unambiguous AGNs before the MIR outburst and the remaining 12 into a subsample without or with very weak AGNs. We begin our discussion with the latter subsample.
4.2.1 One Bona Fide Turn-on AGN Candidate
The sudden and drastic brightening in the centers of normal galaxies is usually attributed to TDEs or turn-on AGNs once the SN scenario is ruled out. Although in the literature the term ‘turn-on AGN’ was also used by some authors to refer to changing-look AGN which transits from Seyfert 2 or 1.8 to type 1.5 or 1 (e.g., MacLeod et al. 2016; Yang et al. 2018; Wang et al. 2018b), we will strictly use the term to mean the transition from normal galaxies to Seyfert 1 galaxies or quasars. Gezari et al. (2017) reported the first case of a turn-on quasar, which transits from an absorption-line galaxy to a quasar in a surprisingly short time scale of a few months. Yan et al. (2019) presented a case of a transit from a LINER to a Seyfert 1 galaxy within a few years in SDSS 1115 discovered in the spectroscopic follow-up of the MIRONG sample. Both of these objects showed a plateau in the optical light curve following an initial brightening. Note that both objects displayed also strong IR echoes and are included in the MIRONG sample. Subsequently, six more transients from LINERs to broad-lined AGN-like spectra were discovered by ZTF (Frederick et al., 2019). Note that three of them also displayed weak broad emission lines in their pre-outburst spectra, which is similar to J1133+6701 in our sample. Nevertheless, most sources fade out in about a year, but with some fluctuations (Frederick et al., 2019, see Figure 5), different from those of known optical TDEs. Together with large black hole masses, which are derived from the correlations between and galactic properties, they appear more likely to be associated with nuclear activity than with TDEs, although the nature of these sources remains to be unraveled.
However, as we have mentioned above, the appearing broad H in most objects fades immediately in the subsequent observations, indicating a short-lived accretion. Only J1442+5558 enters a long plateau phase in the light curve of H, which has lasted for at least four years, and thus is a good candidate of a bona fide turn-on AGN. However, the integrated radiative energy to now for J1442+5558 is erg, well within the range expected for TDEs. Thus, further monitoring was also necessary to determine whether the H continues to stay at the high state or is going to decrease soon. In fact, J1115+0544, another object in our sample, has been thought of as a reliable bona fide turn-on AGN because its H has steadily been there for at least two years (2016-2018; Yan et al. 2019). However, the latest observation performed at UT 2021-01-07 shows that its H has almost disappeared, to our surprise.
4.2.2 Most are Good TDE Candidates
Therefore, the bona fide turn-on AGNs should be minorities in our sample since only one shows persistent H emission after the appearance. The remaining 11 are formally consistent with TDE-like transients. In particular, the H of J0205+0004, J1549+3327, and J1632+2345 has vanished rapidly within one year and J1115+0544 has also returned back to the flux level of SDSS though the strong broad H has remained for at least 2 yr. Further monitoring of the other seven objects in the declining phase will inform us whether their H would also fade away completely. We need to emphasize that the behavior of the H evolution is certainly not sufficient for concluding the nature of MIRONG although it can reflect the energy and timescale of the primary emission to some extent. Actually, our knowledge of the spectral characteristics accompanied by various SMBH transients is still in the accumulation stage and awaiting in-depth understanding.
Besides the above-mentioned H emission, it is notable that iron coronal lines have been detected in 5 of the 11 sources, with 3 also being detected with and 1 being detected with . All of these emission lines are previously found and used to claim a TDE. Remarkably, the ZTF group has recently classified their uniformly selected TDE sample into three categories based on whether or not the hydrogen Balmer lines, and are present (van Velzen et al. 2021a), although the physics that drives the diversity is still poorly understood. Aside from the TDEs found by optical photometric surveys, the spectroscopic selection by extreme iron coronal lines in normal galaxies has also been proven to be a valid approach (Komossa et al. 2008; Wang et al. 2011, 2012), theoretically supported by the anticipation that TDEs can nicely provide the soft X-ray-ionizing photons. Their transient nature has been further confirmed by the long-term spectral evolution (Yang et al. 2013), dust IR echoes (Dou et al. 2016), and soft X-ray radiation (He et al. 2021). In terms of the similarity of prominent IR echoes and high detection rate of coronal lines, our sample could be most likely to be analogous to the coronal-line selected TDEs.
In brief, the appearance and fading of H, iron coronal lines, and are all nice evidence for TDEs although the real benchmark of the TDE spectrum is still poorly known.
4.2.3 The Possibility of Sporadic Gas Accretion
Our MIRONG sample is very different from optical TDEs in IR echoes. A systematic investigation of the MIR light curves of optical TDEs suggest that their echoes are very weak or negligible, yielding a very low dust-covering factor () of those SMBHs (Jiang et al. 2021b; van Velzen et al. 2016, 2021b). On the contrary, the high MIR luminosity of MIRONG definitely gives a much higher (Jiang et al. 2021a). The locally gas-rich environment means that the SMBH will not likely starve due to lack of gas supply permanently. Is it possible that the sporadic gas accretion or instability in the accretion flow triggers the transient accretion?
First, the instability of the gas reservoir in the outer disk may result in sporadic feeding to the central black hole. Such a process is invoked to explain changing-look AGNs. Radiation pressure instability in the inner accretion disk with a very low accretion rate is exceedingly longer than the observed timescale (Gezari et al., 2017). While standard limit-cycle instability, as in cataclysmic variables, in the outer disk can be ruled out because of its very long timescale (Lin & Shields, 1986), a modified version of the limit-cycle instability model was proposed for changing-look AGNs (Sniegowska et al., 2020). In the quiescent state, the accretion rate is low, and the system consists of a truncated outer thin disk and an inner hot advection-dominated flow. The instability takes place in a narrow ring of the thin disk on the boundary of two accretion flows at a few tens of the Schwarzschild radius. Although the model is still under development, initial analysis of the stability of a narrow ring does suggest it is able to reproduce the short transit timescale of months to years observed in changing-look AGN as well as in our objects. The duty cycle increases with increasing steady accretion rate, viscosity, and width of the ring. A low steady accretion rate, and thus low duty cycle, may explain the lack of a prominent AGN signature in the narrow-line spectra, although further detailed modeling is required to confirm this.
Second, stochastic feeding by a cold gas cloud, such as G1/2 clouds in the Galactic center, may eventually lead to an outburst. The presence of thick dust components on subparsec to parsec scales as revealed by IR echoes indicates the presence of a rich cold gas environment, analogously with a circumnuclear molecular disk at the Galactic center, in which the G2 cloud originated (Schartmann et al., 2015). Although the encounter of G2 with the supermassive black hole did not significantly increase the accretion rate from both observations and numerical simulations (Morsony et al., 2017), strong mass feeding may be expected if a dense thin disk is present. In that case, the collision between the cloud and dense gas in the disk may result in significant dissipation, likely ending in gas accretion. For a high plunged cloud, tidal disruption will further increase the cross section of collision, enhancing such fueling process. However, as the encounter of a cloud takes place at , and the accretion time is expected long if the disk remains cold. Nevertheless, the encounters with clouds are random. If the directions of angular momentum of the disk and the cloud are opposite, the collision may leave a significant fraction of very low-angular-momentum gas, which can be quickly accreted.
4.3 MIRONG Occurring in AGNs
The real physics behind MIRONG in active galaxies could be complicated and diverse, with turn-on AGNs, unusual AGN variability, and TDEs all possible. Distinguishing between them is quite challenging to our current knowledge. We will try to give our initial impression of them here, leaving a detailed analysis to our subsequent works.
The amplitude of stochastic variability, which is a defining characteristic of AGNs, is generally not higher than tenths of a magnitude within months to years although it increases toward longer timescales (e.g.,Vanden Berk et al. 2004; MacLeod et al. 2010). Only the most extreme tail of AGN variability distribution may show an amplitude comparable with TDEs over a short period of time (e.g., MacLeod et al. 2012; Rumbaugh et al. 2018). Moreover, conventional AGN variability does not show regular and smooth patterns, such as the power-law decay seen in TDEs. Nevertheless, there indeed exists a population of AGNs displaying major flares at timescales of years, which resembles TDEs more, in their light curves, (e.g., Graham et al. 2017; Kankare et. 2017; Trakhtenbrot et al. 2019). The nature of these AGN flares remains very elusive even with spectroscopic observations as we still lack adequate information to distinguish each scheme from impostors at the benchmark level (Zabludoff et al. 2021), as we emphasized in the last section.
Exploration of our MIRONG sample becomes even difficult without direct variability information of their original emission. Luckily, emission-line variability, which can be considered as an alternative tracer, has been detected in most objects (see Table 1). The detection of H variation itself is not a surprise for AGNs, yet their rapid evolution may shed light on the central ionizing sources. Characteristic emissions other than H, namely iron coronal lines and , might give further clues to the outburst. Only three objects (J1105+5941, J1402+3922, and J1657+2345) show these emissions, and their H has either been restored or is steadily declining. We thus take the three as tentative TDEs in AGNs for the time being as both iron coronal and are representative features of TDE spectra, although not decisive.
For the remaining sources, only H variability has been found and their physics are even harder to constrain. To be consistent with prior definitions, we categorize J1003+0202, which was a Seyfert 2 and presented stable H after the brightening, as a turn-on subclass while the rest sources as AGN flares. We note that J1315+0727 only has two observations in 2017 and its H was still rising. More recent spectra will confirm whether it has faded away now. It should be emphasized again that the flares here may be caused by distinct processes in different sources, such as TDE, sporadic gas accretion, or special accretion disk instability.
4.4 MIRONG without Spectral Variation
The nature of the other 31 objects without clear spectral variations is still mysterious, yet might be even more fascinating. One possibility is that they belong to a new population of fast transients, which evolve much faster than variable sources. The high-cadence surveys over the past decade have indeed revealed a population of transients with timescales obviously shorter than those of SNe and TDEs, and are simply called ”Rapidly Evolving Transients” or ”Fast-Blue Optical Transients” (FBOTs) in literature (e.g., Drout et al. 2014; Pursiainen et al. 2018) as their physical origin remains a puzzle. For instance, the nearest and most well-studied case, AT 2018cow, shows a rise-to-peak timescale of only three days and faded away within a couple of months (Margutti et al. 2019; Perley et al. 2019). The reprocessed MIR light curves cannot reflect the intrinsic outburst timescales unambiguously due to their coupling with dust distributions. Moreover, the optical surveys that overlapped with the outbursting period of our MIRONG sample have either poor cadence (e.g., PanSTARRS, PTF) or depth (e.g., ASASSN), thus they cannot put effective constraints on their optical emission. For likely the same reason, most of them have been missed by optical surveys. Future selection of more recent MIRONG, such as the outbursts after 2018 with both excellent WISE and ZTF light curves, may help test the fast transient hypothesis as the ZTF survey has a much higher cadence and depth compared with previous surveys.
The discrepancy in the dust properties (see Section 3.4) suggests that the dust obscuration may play a vital role and those spectral nonvariable sources correspond to more seriously obscured ones. In this scenario, they are good candidates of obscured TDEs, turn-on AGNs, or any other types of SMBH transients that are undetectable in optical bands. The discrepancy in IR emission can be also partly accounted for by the possibility that the outburst energy of the nonvariable sources is systematically lower than that of variable sources if their dust contents (covering factor) are identical. Further investigations with the aid of multiwavelength observations (e.g., radio; Mattila et al. 2018) are needed to make a conclusion about whether they are real dust-obscured events or an intrinsically distinct population.
5 Conclusions
As the first and essential step to identifying the nature of MIRONG, which are selected by a blind search, spectroscopic observations yield much valuable information of the outbursts. The main results and conclusions are summarized as below.
-
1.
We have obtained optical spectra for 54 objects (53 useful) in the MIRONG sample since 2017. Among them, 22 show the appearance or significant brightening of the broad H (H) emission, corroborating the primary conclusion drawn from Paper I, that is the MIR outbursts are mainly connected with dust echoes of transient SMBH accretion events. Regarding the difference types of galaxies, Seyferts have the highest ratio of H variability while a third of the other types (SF, composite, and LINER) also show an obvious change in H.
-
2.
Multiepoch spectroscopic observations have been continuously carried out for targets with the detection of H variability until the broad H component has disappeared or been restored. Most of them display a declining trend immediately after the brightening, suggesting short-lived transients, such as TDEs, sporadic gas accretion, or special AGN variability. Only two show long-term stable H emission, which is more in agreement with the turn-on AGN scenario. Particularly, the composite galaxy J1442+5558 is an excellent candidate to be a bona fide turn-on AGN, which is hitherto extremely rarely found.
-
3.
The characteristic iron coronal lines, and have also been detected in quite a fraction of these objects, which could provide further clues to their nature. We have naively classified the sources with multiple transient emissions as TDE candidates, particularly for those occurring in inactive galaxies. The real origin of outbursts in AGNs could be diverse and challenging to distinguish from each other as they still lack an accepted benchmark in spectra to our knowledge.
-
4.
Sources without spectral variations do not behave differently in most distributions. The lower MIR luminosity and dust temperature of the nonvariable sources could be a result of self-obscuration although intrinsic weakness is also possible. If those objects are indeed more obscured TDEs, turn-on AGNs, or any other types of SMBH transients, they are worthy of further studies with the aid of observations from other bands (e.g., radio). Another explanation could be that they belong to a new population of fast transients yet without compelling evidence currently.
The nature of MIRONG has been further joined with SMBH transient accretion events based on spectral results while their specific physics remains ambiguous. Actually, the community is still vague as to how to distinguish between different types of nuclear transients accurately. A more detailed analysis of individual sources or subsets will be presented in our subsequent papers. Regardless of what is the true case eventually, MIRONG must be be an indispensable part of mounting SMBH transient events, i.e., as a substantial supplement for the optical sample. The NEOWISE survey is still in commission and should yield out more MIRONG after our primary selection (Jiang et al. 2021a). The more recent MIRONG sample nicely meets the golden era of time-domain surveys at multiple wavelengths, such as ZTF (Bellm et al. 2019), LSST (Ivezić et al. 2019), and WFST in the optical band and eROSITA (Merloni et al. 2012) and the Einstein Probe (Yuan et al. 2015) in the X-ray band. We have the opportunity to perform a more comprehensive study with the new MIRONG sample and to move forward in understanding the mysterious events conclusively.
Appendix A Summary of spectroscopic follow-up observations
We show the spectroscopic follw-up osbervations and some basic information in the Table 3 at this appendix. \startlongtable
| name | redshift | Type | telescope | observation date | exposure time | slit width |
|---|---|---|---|---|---|---|
| YYMMDD | s | arcsec | ||||
| SDSSJ010320.42+140149.8 | 0.0418 | StarForming | P200 | 171216 | 1200 | 1.5 |
| SDSSJ012047.99-082918.4 | 0.0347 | Seyfert 1(b) | P200 | 170630 | 600 | 1.5 |
| P200 | 171124 | 1500 | 1 | |||
| P200 | 180105 | 1200 | 1 | |||
| SDSSJ020552.16+000411.8 | 0.0765 | StarForming | P200 | 171111 | 1200 | 1.5 |
| P200 | 171124 | 600 | 1 | |||
| P200 | 210107 | 900 | 1.5 | |||
| SDSSJ081403.78+261144.3 | 0.0757 | StarForming | P200 | 171026 | 1200 | 1.5 |
| P200 | 171124 | 900s | 1 | |||
| SDSSJ083536.49+493542.7 | 0.0424 | Composite | P200 | 200213 | 1200 | 1.5 |
| SDSSJ085959.46+092225.6 | 0.1519 | StarForming | P200 | 180224 | 1800 | 1.5 |
| P200 | 200213 | 1800 | 1.5 | |||
| P200 | 210317 | 1800 | 1 | |||
| SDSSJ090924.55+192004.8 | 0.1072 | Composite | P200 | 170420 | 900 | 1.5 |
| P200 | 170529 | 900 | 1.5 | |||
| P200 | 171124 | 900 | 1 | |||
| SDSSJ094303.26+595809.3 | 0.0749 | LINER | P200 | 180224 | 1200 | 1.5 |
| SDSSJ094456.56+310552.2 | 0.0346 | Composite | P200 | 200213 | 1200 | 1.5 |
| SDSSJ100350.97+020227.6 | 0.1247 | Seyfert 2 | Lick/Shane | 180318 | 1200 | 1.5 |
| P200 | 190423 | 1200 | 1.5 | |||
| P200 | 200213 | 1200 | 2 | |||
| P200 | 210317 | 1800 | 1 | |||
| SDSSJ103753.68+391249.6 | 0.1068 | StarForming | P200 | 200213 | 1800 | 1.5 |
| SDSSJ104306.56+271602.1 | 0.1281 | Composite | P200 | 170420 | 900 | 1.5 |
| P200 | 170525 | 1560 | 1.5 | |||
| P200 | 171111 | 2100 | 1.5 | |||
| P200 | 171124 | 900 | 1 | |||
| P200 | 180224 | 1800 | 1.5+2.0 | |||
| P200 | 180411 | 1500 | 1 | |||
| P200 | 210317 | 1800 | 1 | |||
| SDSSJ105801.52+544437.0 | 0.1306 | StarForming | P200 | 200213 | 1200 | 1.5 |
| SDSSJ110501.98+594103.5 | 0.0337 | Seyfert 1(b) | P200 | 170525 | 900 | 1.5 |
| P200 | 171111 | 1200 | 1.5 | |||
| P200 | 171124 | 800 | 1 | |||
| P200 | 180224 | 1200 | 1.5 | |||
| P200 | 180411 | 800,700 | 1 | |||
| P200 | 200213 | 1200 | 2 | |||
| P200 | 210317 | 1200 | 1 | |||
| SDSSJ110958.34+370809.6 | 0.026 | LINER | P200 | 170525 | 900 | 1.5 |
| P200 | 171124 | 600 | 1 | |||
| P200 | 210317 | 1200 | 1 | |||
| SDSSJ111122.44+592334.3 | 0.1697 | Composite | Lick/Shane | 180318 | 1800 | 1.5 |
| P200 | 190423 | 1200 | 2 | |||
| P200 | 200213 | 1200 | 1.5 | |||
| SDSSJ111536.57+054449.7 | 0.09 | LINER | LAMOST | 160106 | 5400 | 3aaThe given here for the LAMOST spectrum is the spectral fiber diameter. |
| P200 | 170525 | 1500 | 1.5 | |||
| P200 | 171111 | 1200 | 1.5 | |||
| P200 | 171124 | 1200 | 1 | |||
| P200 | 180114 | 1200 | 1.5 | |||
| P200 | 180408 | 1200 | 1.5 | |||
| P200 | 180411 | 1800 | 1 | |||
| Keck | 180513 | 600 | 1 | |||
| P200 | 210107 | 1200 | 1.5 | |||
| SDSSJ112018.31+193345.8 | 0.1279 | Composite | P200 | 170525 | 1200 | 1.5 |
| P200 | 171124 | 900 | 1 | |||
| SDSSJ112446.21+045525.4 | 0.074 | Composite | P200 | 180224 | 1200 | 1 |
| P200 | 180408 | 1800 | 1.5 | |||
| SDSSJ112916.12+513123.5 | 0.0329 | Composite | P200 | 170529 | 900 | 1.5 |
| P200 | 171124 | 900 | 1 | |||
| SDSSJ113355.93+670107.0 | 0.0397 | LINER(b) | Lick/Shane | 180511 | 1800 | 1.5 |
| P200 | 190423 | 1200 | 2 | |||
| P200 | 200213 | 1200 | 1.5 | |||
| P200 | 210317 | 1800 | 1 | |||
| SDSSJ113901.27+613408.5 | 0.1346 | StarForming | Lick/Shane | 180318 | 1800 | 1.5 |
| P200 | 180408 | 1200 | 1.5 | |||
| SDSSJ120338.31+585911.8 | 0.0469 | StarForming | Lick/Shane | 180612 | 1800 | 1 |
| SDSSJ121907.89+051645.6 | 0.0825 | Composite | Lick/Shane | 180318 | 1200 | 1.5 |
| SDSSJ123852.87+081512.0 | 0.1138 | Seyfert 2 | P200 | 170529 | 900 | 1.5 |
| P200 | 171124 | 600 | 1 | |||
| SDSSJ124521.42-014735.4 | 0.2154 | LINER | P200 | 180408 | 1200 | 1.5 |
| SDSSJ130532.91+395337.9 | 0.0725 | LINER | Lick/Shane | 180318 | 1200 | 1.5 |
| SDSSJ130815.57+042909.6 | 0.0483 | Seyfert 2 | P200 | 180224 | 600 | 1 |
| SDSSJ131509.34+072737.6 | 0.0918 | Composite(b) | P200 | 170529 | 900 | 1.5 |
| P200 | 171124 | 600 | 1 | |||
| SDSSJ132259.94+330121.9 | 0.1269 | LINER | P200 | 180408 | 1200 | 1.5 |
| SDSSJ132902.05+234108.4 | 0.0717 | Composite | Lick/Shane | 180318 | 1800 | 1.5 |
| Lick/Shane | 180613 | 1800 | 1.5 | |||
| SDSSJ133212.62+203637.9 | 0.1125 | Composite(b) | P200 | 170622 | 600 | 1.5 |
| P200 | 171124 | 600 | 1 | |||
| P200 | 180411 | 800,850 | 1 | |||
| P200 | 190423 | 1200 | 2 | |||
| P200 | 190621 | 1200 | 1.5 | |||
| P200 | 210317 | 1200 | 1 | |||
| SDSSJ140221.26+392212.3 | 0.0637 | Seyfert 1(b) | P200 | 170622 | 600 | 1.5 |
| P200 | 171124 | 600 | 1 | |||
| P200 | 180408 | 1200 | 1.5 | |||
| P200 | 180411 | 1200 | 1 | |||
| Lick/Shane | 180612 | 1800 | 1 | |||
| P200 | 200213 | 1800 | 1.5 | |||
| P200 | 210107 | 1200 | 1.5 | |||
| SDSSJ140648.43+062834.8 | 0.0845 | StarForming | P200 | 170525 | 1200 | 1.5 |
| P200 | 190423 | 1200 | 2 | |||
| SDSSJ141235.89+411458.5 | 0.1025 | Composite | P200 | 180408 | 1200 | 1.5 |
| SDSSJ144227.57+555846.3 | 0.0769 | Composite | P200 | 170529 | 900 | 1.5 |
| P200 | 180224 | 1200 | 1 | |||
| P200 | 180411 | 1200,1220 | 1 | |||
| P200 | 180607 | 1200 | 1 | |||
| P200 | 190423 | 1200 | 2 | |||
| P200 | 190621 | 1800 | 1.5 | |||
| P200 | 200213 | 1200 | 1 | |||
| P200 | 210317 | 1200 | 1 | |||
| SDSSJ150844.22+260249.1 | 0.0826 | Composite | Lick/Shane | 180613 | 1800 | 1.5 |
| SDSSJ151257.18+280937.5 | 0.1155 | LINER | P200 | 180224 | 600 | 1 |
| Lick/Shane | 180613 | 1800 | 1.5 | |||
| SDSSJ151345.76+311125.0 | 0.0718 | Composite | P200 | 170602 | 1500 | 1.5 |
| P200 | 180411 | 1200,1230 | 1 | |||
| P200 | 180607 | 1200 | 1 | |||
| P200 | 190423 | 1200 | 2 | |||
| P200 | 210317 | 1200 | 1 | |||
| SDSSJ153711.29+581420.2 | 0.0936 | Seyfert 1(b) | P200 | 170622 | 600 | 1.5 |
| P200 | 180411 | 1200,1230 | 1 | |||
| Lick/Shane | 180612 | 1800 | 1 | |||
| P200 | 190621 | 1600 | 1.5 | |||
| P200 | 200213 | 1800 | 1.5 | |||
| P200 | 210107 | 1500 | 1.5 | |||
| SDSSJ154955.19+332752.0 | 0.0857 | StarForming | P200 | 170602 | 900 | 1.5 |
| P200 | 180411 | 1200,1230 | 1 | |||
| P200 | 180607 | 1200 | 1 | |||
| P200 | 190423 | 1200 | 2 | |||
| P200 | 200213 | 1800 | 1.5 | |||
| SDSSJ155437.26+525526.4 | 0.0664 | Composite | Lick/Shane | 180613 | 1800 | 1.5 |
| SDSSJ155539.95+212005.7 | 0.0709 | Composite | Lick/Shane | 180318 | 1800 | 1.5 |
| Lick/Shane | 180613 | 1800 | 1 | |||
| SDSSJ155743.52+272753.0 | 0.0316 | Composite | Lick/Shane | 180318 | 1800 | 1.5 |
| SDSSJ160052.26+461242.9 | 0.1974 | StarForming | P200 | 190621 | 1200 | 1.5 |
| SDSSJ162034.99+240726.5 | 0.0655 | StarForming | P200 | 190621 | 1200 | 1.5 |
| P200 | 210317 | 900 | 1 | |||
| SDSSJ162810.03+481047.7 | 0.1245 | StarForming | Lick/Shane | 180612 | 1800 | 1 |
| SDSSJ163246.84+441618.5 | 0.0579 | LINER | P200 | 170602 | 900 | 1.5 |
| Lick/Shane | 180511 | 1800 | 1.5 | |||
| SDSSJ164754.38+384342.0 | 0.0855 | StarForming | Lick/Shane | 180318 | 1800 | 1.5 |
| Lick/Shane | 180612 | 1800 | 1 | |||
| P200 | 210317 | 1200 | 1 | |||
| SDSSJ165726.81+234528.1 | 0.0591 | Seyfert 2 | P200 | 170602 | 900 | 1.5 |
| P200 | 180607 | 1200 | 1.5 | |||
| P200 | 190423 | 1800 | 1.5 | |||
| P200 | 190621 | 1800 | 1.5 | |||
| P200 | 210317 | 1800 | 1 | |||
| SDSSJ165922.65+204947.4 | 0.0451 | Seyfert 2 | Lick/Shane | 180318 | 1200 | 1.5 |
| Lick/Shane | 180511 | 1800 | 1.5 | |||
| SDSSJ214603.88+104128.6 | 0.1636 | StarForming | P200 | 190621 | 1200 | 1.5 |
| SDSSJ220349.23+112433.0 | 0.1863 | Composite | P200 | 170628 | 1200 | 1.5 |
| P200 | 171111 | 2400 | 1.5 | |||
| P200 | 171124 | 1500 | 1 | |||
| Lick/Shane | 180612 | 1800 | 1 | |||
| P200 | 190621 | 1200 | 1.5 | |||
| SDSSJ221541.60-010721.0 | 0.0477 | Composite(b) | Lick/Shane | 180612 | 1200 | 1 |
Note. — The host galaxy spectral type in the third column was collected from Paper I, and the galaxy types followed “b” in bracket indicated that apparent broad balmer lines were detected in their SDSS according to the criteria in 3.2. At the most time, the exposure time displayed in the sixth column was the same with each other for red and blue end observation ,but sometimes their may be a little difference, for which in the table the left one represented the blue end exposure time
Appendix B Spectral evolution of the 21 sources with emission lines variation
References
- Avni (1976) Avni, Y. 1976, ApJ, 210, 642
- Alexander et al. (2020) Alexander, K. D., van Velzen, S., Horesh, A., et al. 2020, Space Sci. Rev., 216, 81
- Bade et al. (1996) Bade, N., Komossa, S., & Dahlem, M. 1996, A&A, 309, L35
- Bellm et al. (2019) Bellm, E. C., Kulkarni, S. R., Graham, M. J., et al. 2019, PASP, 131, 018002
- Bloom et al. (2011) Bloom, J. S., Giannios, D., Metzger, B. D., et al. 2011, Science, 333, 203
- Burrows et al. (2011) Burrows, D. N., Kennea, J. A., Ghisellini, G., et al. 2011, Nature, 476, 421
- Cappellari (2017) Cappellari, M. 2017, MNRAS, 466, 798
- Cappellari & Emsellem (2004) Cappellari, M. & Emsellem, E. 2004, PASP, 116, 138
- Dou et al. (2016) Dou, L., Wang, T., Jiang, N., et al. 2016, ApJ, 832, 188
- Drout et al. (2014) Drout, M. R., Chornock, R., Soderberg, A. M., et al. 2014, ApJ, 794, 23.
- Evans & Kochanek (1989) Evans, C. R., & Kochanek, C. S. 1989, ApJ, 346, L13
- Ferland & Netzer (1983) Ferland, G. J. & Netzer, H. 1983, ApJ, 264, 105.
- Filippenko (1997) Filippenko, A. V. 1997, ARA&A, 35, 309
- Fitzpatrick (1999) Fitzpatrick, E. L. 1999, PASP, 111, 63
- Fox et al. (2020) Fox, O. D., Fransson, C., Smith, N., et al. 2020, MNRAS, 498, 517
- Fransson et al. (2014) Fransson, C., Ergon, M., Challis, P. J., et al. 2014, ApJ, 797, 118
- Frederick et al. (2019) Frederick, S., Gezari, S., Graham, M. J., et al. 2019, ApJ, 833, 31
- Gezari et al. (2017) Gezari, S., Hung, T., Cenko, S. B., et al. 2017, ApJ, 835, 144
- Gezari (2021) Gezari, S. 2021, arXiv:2104.14580
- Graham et al. (2017) Graham, M. J., Djorgovski, S. G., Drake, A. J., et al. 2017, MNRAS, 470, 4112
- Guo et al. (2019) Guo, H., Sun, M., Liu, X., et al. 2019, ApJ, 883, L44
- Halpern & Steiner (1983) Halpern, J. P. & Steiner, J. E. 1983, ApJ, 269, L37
- He et al. (2021) He, J. S., Dou, L. M., Ai, Y. L., et al. 2021, A&A, 652, A15
- Hinkle et al. (2021) Hinkle, J. T., Holoien, T. W.-S., Shappee, B. J., et al. 2021, arXiv:2108.03245
- Ivezić et al. (2019) Ivezić, Ž., Kahn, S. M., Tyson, J. A., et al. 2019, ApJ, 873, 111
- Jiang et al. (2016) Jiang, N., Dou, L., Wang, T., et al. 2016, ApJ, 828, L14
- Jiang et al. (2021a) Jiang, N., Wang, T., Dou, L., et al. 2021a, ApJS, 252, 32
- Jiang et al. (2021b) Jiang, N., Wang, T., Hu, X., et al. 2021b, ApJ, 911, 31
- Kankare et. (2017) Kankare, E., Kotak, R., Mattila, S., et al. 2017, Nature Astronomy, 1, 865
- Komossa et al. (2008) Komossa, S., Zhou, H., Wang, T., et al. 2008, ApJ, 678, L13
- Kool et al. (2020) Kool, E. C., Reynolds, T. M., Mattila, S., et al. 2020, MNRAS, 498, 2167
- Kormendy & Ho (2013) Kormendy, J., & Ho, L. C. 2013, ARA&A, 51, 511
- LaMassa et al. (2015) LaMassa, S. M., Cales, S., Moran, E. C., et al. 2015, ApJ, 800, 144
- Lin & Shields (1986) Lin, D. N. C. & Shields, G. A. 1986, ApJ, 305, 28
- Lu et al. (2016) Lu, W., Kumar, P., & Evans, N. J. 2016, MNRAS, 458, 575
- Lu et al. (2017) Lu, W., Kumar, P., & Narayan, R. 2017, MNRAS, 468, 910
- MacLeod et al. (2010) MacLeod, C. L., Ivezić, Ž., Kochanek, C. S., et al. 2010, ApJ, 721, 1014
- MacLeod et al. (2012) MacLeod, C. L., Ivezić, Ž., Sesar, B., et al. 2012, ApJ, 753, 106
- MacLeod et al. (2016) MacLeod, C. L., Ross, N. P., Lawrence, A., et al. 2016, MNRAS, 457, 389
- Malyali et al. (2021) Malyali, A., Rau, A., Merloni, A., et al. 2021, A&A, 647, A9
- Margutti et al. (2019) Margutti, R., Metzger, B. D., Chornock, R., et al. 2019, ApJ, 872, 18
- Merloni et al. (2012) Merloni, A., Predehl, P., Becker, W., et al. 2012, arXiv:1209.3114
- Miller & Stone (1993) Miller, J. S., & Stone, R. P. S., 1993, Lick Obs. Tech. Rep., No. 66
- Moriya et al. (2020) Moriya, T. J., Stritzinger, M. D., Taddia, F., et al. 2020, A&A, 641, A148
- Morsony et al. (2017) Morsony, B. J., Gracey, B. T., Workman, J. C., et al. 2017, ApJ, 843, 29
- Mattila et al. (2018) Mattila, S., Pérez-Torres, M., Efstathiou, A., et al. 2018, Science, 361, 482
- Mockler et al. (2019) Mockler, B., Guillochon, J., & Ramirez-Ruiz, E. 2019, ApJ, 872, 151
- Oke & Gunn (1982) Oke, J. B. & Gunn, J. E. 1982, PASP, 94, 586
- Pasham et al. (2019) Pasham, D. R., Remillard, R. A., Fragile, P. C., et al. 2019, Science, 363, 531
- Perley et al. (2019) Perley, D. A., Mazzali, P. A., Yan, L., et al. 2019, MNRAS, 484, 1031
- Peterson et al. (2013) Peterson, B. M., Denney, K. D., De Rosa, G., et al. 2013, ApJ, 779, 109
- Phinney (1989) Phinney, E. S. 1989, The Center of the Galaxy, 136, 543
- Pursiainen et al. (2018) Pursiainen, M., Childress, M., Smith, M., et al. 2018, MNRAS, 481, 894.
- Rees (1988) Rees, M. J. 1988, Nature, 333, 523
- Rumbaugh et al. (2018) Rumbaugh, N., Shen, Y., Morganson, E., et al. 2018, ApJ, 854, 160
- Runnoe et al. (2016) Runnoe, J. C., Cales, S., Ruan, J. J., et al. 2016, MNRAS, 455, 1691
- Sahu et al. (2006) Sahu, D. K., Anupama, G. C., Srividya, S., et al. 2006, MNRAS, 372, 1315
- Schartmann et al. (2015) Schartmann, M., Ballone, A., Burkert, A., et al. 2015, ApJ, 811, 155
- Schlegel (1990) Schlegel, E. M. 1990, MNRAS, 244, 269
- Schlegel et al. (1998) Schlegel, D. J., Finkbeiner, D. P., & Davis, M. 1998, ApJ, 500, 525
- Shappee et al. (2014) Shappee, B. J., Prieto, J. L., Grupe, D., et al. 2014, ApJ, 788, 48
- Sheng et al. (2017) Sheng, Z., Wang, T., Jiang, N., et al. 2017, ApJ, 846, L7
- Sheng et al. (2020) Sheng, Z., Wang, T., Jiang, N., et al. 2020, ApJ, 889, 46
- Sniegowska et al. (2020) Sniegowska, M., Czerny, B., Bon, E., et al. 2020, A&A, 641, A167
- Stone & Metzger (2016) Stone, N. C., & Metzger, B. D. 2016, MNRAS, 455, 859
- Stritzinger et al. (2012) Stritzinger, M., Taddia, F., Fransson, C., et al. 2012, ApJ, 756, 173
- Tartaglia et al. (2020) Tartaglia, L., Pastorello, A., Sollerman, J., et al. 2020, A&A, 635, A39
- Trakhtenbrot et al. (2019) Trakhtenbrot, B., Arcavi, I., Ricci, C., et al. 2019, Nature Astronomy, 3, 242
- Uomoto & Kirshner (1986) Uomoto, A. & Kirshner, R. P. 1986, ApJ, 308, 685
- Vanden Berk et al. (2004) Vanden Berk, D. E., Wilhite, B. C., Kron, R. G., et al. 2004, ApJ, 601, 692
- van Velzen et al. (2016) van Velzen, S., Mendez, A. J., Krolik, J. H., & Gorjian, V. 2016, ApJ, 829, 19
- van Velzen et al. (2020) van Velzen, S., Holoien, T. W.-S., Onori, F., et al. 2020, Space Sci. Rev., 216, 124
- van Velzen et al. (2021a) van Velzen, S., Gezari, S., Hammerstein, E., et al. 2021, ApJ, 908, 4
- van Velzen et al. (2021b) van Velzen, S., Pasham, D. R., Komossa, S., et al. 2021, Space Sci. Rev., 217, 63.
- Vazdekis et al. (2010) Vazdekis, A., Sánchez-Blázquez, P., Falcón-Barroso, J., et al. 2010, MNRAS, 404, 1639
- Wang & Merritt (2004) Wang, J., & Merritt, D. 2004, ApJ, 600, 149
- Wang et al. (2011) Wang, T.-G., Zhou, H.-Y., Wang, L.-F., et al. 2011, ApJ, 740, 85
- Wang et al. (2012) Wang, T.-G., Zhou, H.-Y., Komossa, S., et al. 2012, ApJ, 749, 115
- Wang et al. (2018a) Wang, T., Yan, L., Dou, L., et al. 2018, MNRAS, 477, 2943
- Wang et al. (2018b) Wang, J., Xu, D. W., & Wei, J. Y. 2018, ApJ, 858, 49
- Wevers et al. (2019) Wevers, T., Pasham, D. R., van Velzen, S., et al. 2019, MNRAS, 488, 4816
- Yan et al. (2019) Yan, L., Wang, T., Jiang, N., et al. 2019, ApJ, 874, 44
- Yang et al. (2013) Yang, C.-W., Wang, T.-G., Ferland, G., et al. 2013, ApJ, 774, 46
- Yip et al. (2009) Yip, C. W., Connolly, A. J., Vanden Berk, D. E., et al. 2009, AJ, 137, 5120
- Yang et al. (2018) Yang, Q., Wu, X.-B., Fan, X., et al. 2018, ApJ, 862, 109
- Yuan et al. (2015) Yuan, W., Zhang, C., Feng, H., et al. 2015, arXiv:1506.07735
- Zabludoff et al. (2021) Zabludoff, A., Arcavi, I., La Massa, S., et al. 2021, Space Sci. Rev., 217, 54