On planet formation around supermassive black holes and the grain disruption barriers by radiative torques
Abstract
It has recently been suggested that planets can form by dust coagulation in the torus of active galactic nuclei (AGN) with low luminosity of , constituting a new class of exoplanets orbiting the supermassive black hole called blanets. However, large dust grains in the AGN torus may be rotationally disrupted by the Radiative Torque Disruption (RATD) mechanism due to AGN radiation feedback, which would prevent the blanet formation. To test this scenario, we adopt the simple smooth and clumpy dust/gas distribution inside the torus region to study the effect of RATD on the evolution of composite dust grains in the midplane of the torus. We found that grain growth and then blanet formation are possible in the smooth torus model. However, in the clumpy torus model, grain growth will be strongly constrained by RATD, assuming the gas density distribution as adopted in Wada et al. We also found that icy grain mantles inside clumps are quickly detached from the grain core by rotational desorption, reducing the sticking coefficient between icy grains and coagulation efficiency. The grain rotational disruption and ice desorption occur on timescales much shorter than the growth time up to a factor of , which are the new barriers that grain growth must overcome to form blanets. Further studies with more realistic AGN models are required to better constrain the effect of RATD on grain growth and blanet formation hypothesis around low luminosity AGN.
1 Introduction
Planets are thought to form from dust grains in the protoplanetary disk (PPD) around young stars. Although the precise mechanism of planet formation remains elusive, one of the leading theories is core-accretion which is induced by dust coagulation and gravitational instability (Goldreich & Ward 1973, Kokubo & Ida 2012). According to the core-accretion theory, small dust grains covered by ice mantles collide and stick together to form the large dust aggregates, followed by the formation of planetesimals of km-size (Kataoka et al. 2013, Okuzumi et al. 2012). Subsequently, gravity acts on planetesimals to form planets (see Chiang et al. 2010 for a review). Recently, Wada et al. (2019, 2021) studied the possibility of planet formation in the dusty torus around supermassive black holes (SMBHs) and suggested that planets can be formed by coagulation of icy grain mantles beyond the snow line, provided that the luminosity of Active Galactic Nuclei (AGN) is relatively low of . Such a proposed scenario is expected to present a new class of exoplanets orbiting SMBHs, termed as blanets.
While dust grains in the midplane of PPDs are significantly shielded from the stellar radiation due to the high gas density, dust grains in the torus around SMBHs are subject to intense radiation feedback from AGN. Thus, dust grains can be spun up to extremely fast rotation by RAdiative Torques (RATs) such that the centrifugal force can disrupt micron-sized grains to smaller fragments (Hoang et al. 2019b). This Radiative Torque Disruption (RATD) mechanism is an essential dynamical constraint for the grain size distribution in the interstellar medium (Hoang et al. 2019b), which would be a critical barrier for blanet formation around SMBHs because large aggregates have a lower tensile strength (Tatsuuma et al. 2019; Kimura et al. 2020) and will be disrupted more easily than small ones.
The effect of RATD on grain growth and planet formation in protoplanetary disks (PPDs) is studied in detail by Tung & Hoang (2020). The authors found that the RATD effect is inefficient in the disk interior thanks to the shielded stellar radiation and very high gas density of . Compared to PPDs, the environment condition for blanet formation around SMBHs is radically different, with a lower gas density of at pc in the midplane of torus (Wada et al. 2016, 2019, 2021) and an intense radiation field of . Recently, Giang & Hoang (2021) studied the influence of RATD on composite grains around high AGN luminosity of . They found that large grains of are significantly disrupted to smaller sizes up to distance pc in the polar cone and pc in the midplane of the torus. Therefore, it is important to study the strength of RATD around low-luminosity AGN to understand whether RATD suppresses grain growth via coagulation or not.
On the other hand, Wada et al. (2019) studied grain growth beyond the snow line of the torus where ice can form on the surface of the solid grain core. The presence of ice mantles increases the sticking collision between icy monomers and reduces the fragmentation due to the dust collision (Chokshi et al. 1993, Gundlach et al. 2011). Large icy dust aggregates with highly porous structures thus can grow quickly and overcome the “radial drift barrier” to form the planetesimals of size (Okuzumi et al. 2012). However, Hoang & Tram (2020) showed that the fast rotating icy grain mantles by RATs could cause the separation between two components following the fragmentation of detaching ice mantles and then the quick sublimation of icy fragments to the gas phase. This mechanism is named rotational desorption. Considering this effect on PPDs, Tung & Hoang (2020) found the significant removal of micron-sized icy grain mantle beyond the “original” snow line on the dense midplane region. The formation of thick ice mantles is more strongly suppressed due to efficient rotational desorption, that icy dust with size only can be formed at the outer boundary of the disc of au. Therefore, we expect a similar effect on the evolution of icy grain mantles in the midplane of low-luminosity AGN and rotational desorption may be another barrier that prevents the blanet formation.
To model the effect of rotational disruption and desorption around low AGN luminosity, one needs to know in detail the morphology and the distribution of gas and dust grains within the torus region. However, this problem has not yet been well answered now. Numerical studies of the circumnuclear region showed that both the smooth torus model, in which dust and gas distributes smoothly in the flared or tapered geometry of the torus (Fritz et al. 2006, Schartmann et al. 2008), and the clumpy torus model, in which dust and gas concentrate into the dense clumps that distribute randomly inside the diffuse torus region (Nenkova et al. 2002, Nenkova et al. 2008, Hönig & Kishimoto 2010), generally can reproduce the observed properties of the spectral energy distribution (SED) in infrared (IR) range, the feature of the line emission/absorption, and also the broad X-ray spectrum observed from AGN (Buchner et al. 2015). However, the high resolution observations toward the circumnuclear region tend to reveal the inhomogeneous distributions of gas and dust grains instead of the homogeneous or discrete gas/dust distribution as proposed in the smooth and clumpy torus model (Shi et al. 2006, Hicks et al. 2009, Izumi et al. 2018). This picture is consistent with the multi-gas phase structure driven by the radiation-driven fountain model proposed by Wada et al. (2009) (Schartmann et al. 2014, Wada et al. 2016). This model also can reproduce many photometric observations and spectroscopy observed from AGN (Buchner et al. 2021. However, since the main purpose of our paper is to give the first insight of the effect of rotational disruption and desorption on grain growth around low luminosity AGN, we adopt two simple models of the smooth torus model and the clumpy model and solve the radiative transfer only in one dimension. We first perform numerical calculations of the disruption size of dust grains with composite structures and the desorption size of icy grain mantles for the low-luminosity AGN with . Next, we will compare the timescale between grain growth via coagulation and rotational destruction and desorption to understand how spinning dust affects grain evolution.
The structure of the paper is as follows. The spectral energy distribution of AGN and the model of the torus are described in Section 2. In Section 3, we briefly describe the mechanism of RATD, the radiative transfer model, and numerical calculations of the grain disruption size by RATD for a smooth and a clumpy gas/dust density model in the torus. We then study the destruction of icy grain mantles beyond the snow line under the effect of rotational desorption in Section 4. We next compare the disruption and desorption timescale with the growth time by dust coagulation in Section 5. The discussion of the rotational effect on the blanet formation around SMBHs will be presented in Sections 6, and a summary of our main findings is presented in Section 7.
2 Model of AGN radiation field and dusty torus
2.1 Spectral energy distribution
We adopt the spectral energy distribution of an unobscured AGN from the study of Nenkova et al. (2008a) and Stalevski et al. (2012), which follows:
| (5) |
where is a normalization constant determined by the bolometric luminosity of AGN. For convenience, we consider that AGN is a time-invariant source.
In order to model the effect of RATD, we only focus on the main radiation spectrum emitting from the accretion disk from to at which the lower limit is determined by the Lyman absorption of neutral hydrogen atoms. To describe the strength of the radiation field, we use the dimensionless parameter where is the radiation energy density of the local radiation field and is the energy density of the average interstellar radiation field (ISRF) in the solar neighborhood (Mathis et al., 1983).
2.2 Physical model of the AGN torus
2.2.1 Smooth torus model
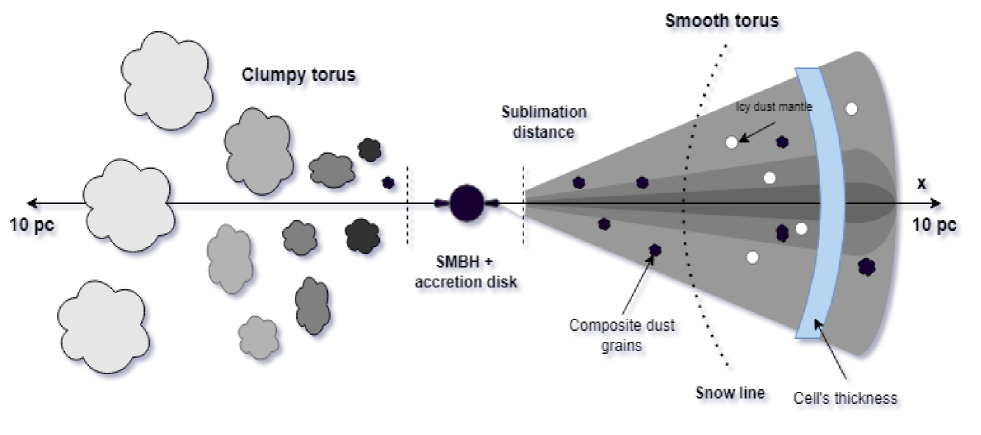
The right part of Figure 1 shows the two-dimensional illustration of an AGN with the smooth distribution of dust and gas in the torus (hereafter smooth torus model). In the dense environment as the midplane of torus region, dust and gas are likely in thermal equilibrium, so that the gas temperature can be inferred from the dust temperature (i.e., ) determined by the balance between grain heating by UV-optical radiation from the central AGN and grain cooling by IR re-emission. The equilibrium temperature of large grains of size can be approximately given by (Draine, 2011):
| (6) |
Dust grains near the center region exposed to higher have higher temperatures and can be sublimated when its temperature exceeds the sublimation threshold, . The distance where dust starts to survive from the thermal sublimation is called the sublimation distance and denoted as . Here, we assume that carbonaceous grains have the same sublimation temperature of K as silicate grains. Therefore, the sublimation distance of grain size can be found by setting , yielding (Draine 2011):
| (7) | |||||
We consider the sublimation distance of small grains of is the inner boundary of dusty torus region, which yields pc for , assuming .
We assume the simple flared disk geometry for the torus from Fritz et al. (2006) and the gas density profile from Wada et al. (2021) which is given by
| (10) |
where and are the gas density at pc and pc, respectively.
In our study, we only focus on studying the RATD effect on dust in the midplane of the torus where most of dust is present and the blanet formation is suggested to occur (Wada et al. 2019).
2.2.2 Clumpy torus model
Dust and gas are also suggested to concentrate into dense clumps within the diffuse circumnuclear region (left part of Figure 1). This clumpy torus model was first proposed by Krolik & Begelman (1988) as a way to reduce dust destruction by intense UV-optical AGN radiation. It is then widely studied (e.g., Nenkova et al. 2002, 2008, Netzer 2015, Dullemond & van Bemmel 2005) and supported by observations (e.g., Alonso-Herrero et al. 2016). For this configuration, small and dense clumps (dark color) are likely located near the AGN center, while large and dilute clumps (light color) are located in the middle and outer boundary of the torus (see also three-dimension (3D) structure of the clumpy torus model in Schartmann et al. 2008). The variation of the clump size with distance can be assumed as (Hönig & Kishimoto 2010):
| (11) |
where is the clump radius of at the sublimation front , and is the power-law index of the distribution. We assume . To simplify the model, we consider that the near side of the clump (closer to the AGN) is directly illuminated by AGN radiation and only consider the radiation attenuation inside the clump.
3 Rotational Disruption of Composite grains
We first describe the main points of the RATD mechanism in Section 3.1 and the radiative transfer modeling in Section 3.2. The numerical calculations of the disruption size of composite grains for the smooth and clumpy torus models are described in Section 3.3.
3.1 The RATD Mechanism
Following the principle of RATD (Hoang et al. 2019b), a fast rotating irregular dust grain spun up by radiative torques (Draine & Weingartner 1996, Lazarian & Hoang 2007) can be destroyed to smaller pieces if the induced tensile stress exceeds the maximum tensile strength of the dust grain. Assuming the constant AGN radiation field, the time-evolution of the grain angular velocity driven by RATs is given by
| (12) |
where is the gas damping timescale, which is:
| (13) |
with is the typical timescale for the rotational damping by gas collisions, and is the coefficient presenting for the rotational damping caused by re-IR emission (see Hoang et al. 2019b for details). is the maximum angular velocity that the dust grain can reach after a long time. For an irregular grain of effective size which is defined as the radius of a spherical grain with the same volume, the formula for is described by (Hoang et al. 2019b and Giang & Hoang 2021)
| (14) | |||||
for grain of size , and
| (15) | |||||
for grain of size . In these equations, , with the mean wavelength of the radiation spectrum from , is the radiation strength, , and is the gas temperature given by Equation (6). Also, is the anisotropic degree of the radiation field (), and we adopt for the unidirectional radiation field of AGN. The last term of is the dimensionless coefficient of rotational damping due to thermal dust emission (see Hoang et al. 2019b for details). The change of at is due to the change of RAT efficiency with the mean wavelength and the grain size (see Hoang & Lazarian 2008, Hoang & Lazarian 2014, Hoang et al. 2019b, Giang & Hoang 2021 for details).
The rotating dust grain will be disrupted to smaller sizes if its tensile stress, , exceeds the maximum tensile strength of the grain material, . The value of depends on the grain material, grain structure, and grain size, but have not yet well constrained. Ideal material can have high maximum tensile strength, such as diamond with (Draine & Salpeter 1979, Burke & Silk 1974), or polycrystalline bulk material with (Hoang et al. 2019b), while composite dust grains which are formed via sticking collisions between sub-micron grains in cold and dense environments such as molecular clouds and protoplanetary disks (Tatsuuma et al. 2019, Kimura et al. 2020) are expected to be porous with low maximum tensile strength of (Hoang 2019a).
The critical angular velocity for rotational disruption can be found by setting the centrifugal stress , which is given by:
| (16) | |||||
where , and with the grain mass density. The disruption threshold decreases with decreasing maximum tensile strengths and increasing grain sizes, implying the strong effect of RATD on large composite grains.
Comparing Equation (14) with Equation (16) for grains of , one can see that large grains are easier to be destroyed by RATD due to the increase of and the decrease of with increasing grain sizes. The first intersection between and determines the grain disruption size, denoted by , above which dust will be disrupted by RATD. By comparing Equation (15) with Equation (16) for grains of , grains with larger size are hard to be destroyed due to the decrease of with increasing grain sizes. Thus, the second intersection between and determines the maximum size that dust still be affected by RATD, denoted by . The range of disrupted grains of will be extended for stronger radiation field and weaker maximum tensile strength .
3.2 Radiative transfer model
UV-optical radiation passing through the dusty torus will be attenuated due to scattering and absorption by dust grains. The spectral energy density at distance from the central source thus will be given by:
| (17) |
where is the intrinsic energy density with the specific luminosity given by Equation (5), and is the optical depth at wavelength .
We adopt the popular interstellar dust model consisting of separate astronomical silicate and carbonaceous grains (see Li & Draine 2001, Weingartner & Draine 2001, Draine & Li 2007) with the grain size spanning from the minimum size of to the maximum size of . We assume that dust grains initially follow the MRN distribution of (Mathis et al. 1977) with the normalization constant determined by the dust-to-gas mass ratio (Laor & Draine 1993). We consider the presence of micron-sized grains in the torus, thus, in order to keep the typical dust-to-gas mass ratio found in the interstellar medium , the normalization constant must be reduced by a factor of 3 from the values of Mathis et al. (1977), to and , respectively.
Without RATD, AGN radiation is attenuated by all grains from to . With RATD, grains of size from to are disrupted to smaller sizes, resulting in two separate populations of the grain size distribution. The first population includes grains of size from to , which are enhanced by the disruption of large grains by RATD. The second population includes large grains from to which are not affected by RATD and still follow the MRN distribution. Due to the lack of information about the redistribution of disrupted grains, we assume that small grains of size between still follow the power-law distribution with a steeper slope, denoted as , implying the enhancement of very small grains. Assuming the constant values of and , the new slope can be found from the mass conservation of dust from to (see Giang & Hoang 2021 for details). Consequently, the optical depth at wavelength produced by all dust grains from the sublimation front to distance from the AGN center is given by
| (18) | |||||
where , , , and are the grain disruption size, maximum grain disruption size, new power-index of the distribution of grain size of , and the gas density at distance given by Equation (10), respectively. Above, is the extinction cross section of grain size with wavelength with the extinction efficiency. The values of are adopted from Hoang et al. (2013) for sub-micron sized grains and calculated from the public Discrete Dipole Scattering code (DDSCAT) (Draine et al. 1994) for micron-sized grains (Giang & Hoang 2021), assuming an oblate spheroidal shape with an axial ratio of 2.
Wada et al. (2019) suggested that micron-sized grains beyond the snow line can grow and form blanet in the midplane of the torus region around low luminousity AGN. Therefore, we focus to study the effect of RATD and rotational desorption in this region, and consider the radiative transfer of AGN radiation in one dimension, i.e., along x-direction (Figure 1). 111This choice neglects the angle-dependence of the UV-optical radiation emitting from the accretion disk around AGN.
To numerically model the attenuation of AGN radiation by dust along x-direction, we divide the midplane of the flared disk (in case of the smooth torus model) and the clump (in case of the clumpy torus model) into thin cells of the same thickness pc, respectively. The dust size distribution is considered uniform in each cell (see the thin blue cell in Figure 1). The total optical depth produced by dust from the sublimation front to distance can be written as:
| (19) |
where is the optical depth produced by dust in the cell (by using Equation 18 with replaced by ) and is the order of the cell. We denote be the first cell at the sublimation front (in case of the smooth torus model) and the near side (closer to the AGN) of the clump (in case of the clumpy torus model) and be the last cell at distance on x-direction.
3.3 Grain disruption size
To study the effect of RATD on composite dust grains in the midplane of torus, we first solve the radiative transfer equation (Equation 17) to get the radiation strength with distances, then calculate the terminal angular velocity of all grain sizes from to (Equations 14 and 15). By comparing with the critical angular velocity (Equation 16), we can determine the range in which grains are destroyed by RATD. We consider the evolution of dust grains under the RATD effect for the typical case of luminosity of in which blanet is suggested to form (Wada et al. 2019, 2021).
3.3.1 Smooth torus model
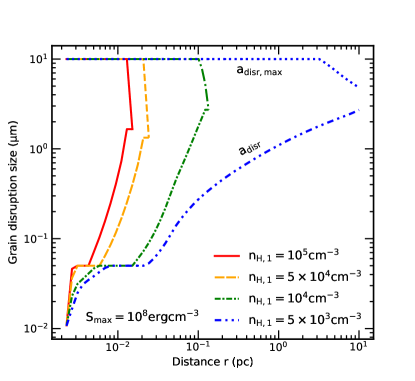
The left panel of Figure 2 shows the variation of the disruption size of composite dust grains as the function of distances, assuming different gas density profiles with varying from to . To account for the dependence of the maximum tensile strength on grain sizes, we adopt for small grain of size and for larger grains. Dust grains are strongly disrupted near the sublimation front due to strong radiation and are less affected by RATD at larger distances, as illustrated by the rise of and the decline of . The intersection between and determines the distance where RATD ceases. We call this boundary the active region of RATD. The disruption of composite dust grains is stronger for lower gas densities due to smaller rotational damping and dust reddening effect. For example, micron-sized grains of can be disrupted by RATD up to pc if the gas density at pc decreases below .
The right panel of Figure 2 shows the similar results as the left panel, but assuming large grains of have . By decreasing the maximum tensile strength, large grains are easier to be destroyed by RATD due to lower disruption threshold (Equation 16), resulting in the expansion of the active region of RATD. For example, with low gas density of , all large grains of with can be destroyed by RATD up to the outer boundary of torus at pc. However, for low-luminosity AGN of with the sublimation distance at pc, the smooth distribution of dust density in torus region produces very high dust reddening effect that significantly suppresses the RATD effect at the parsec scale. Dust grains at this distance are not affected by rotational disruption if .
3.3.2 Clumpy torus model
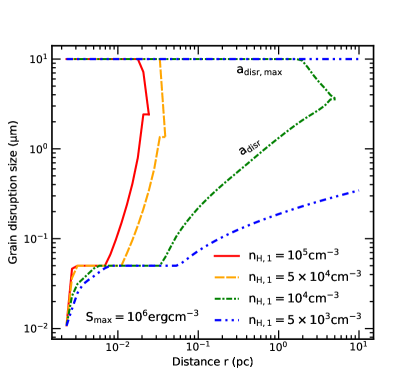
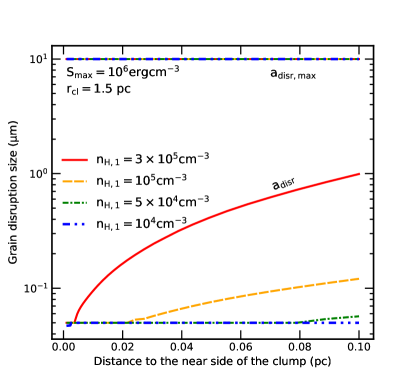
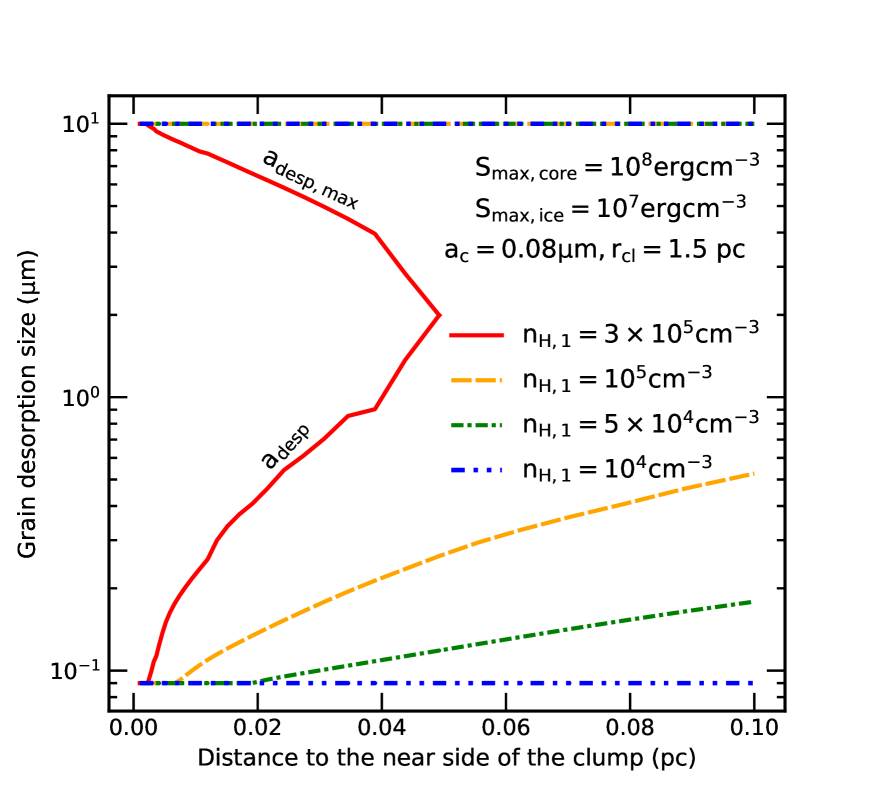
The left panel of Figure 3 shows the variation of grain disruption size with the distance to the near side of the clump (i.e., closest to the AGN) for the clump of radius pc located at distance pc, assuming different values of , and . Dust is destroyed stronger toward the near side, while weaker in the middle and far side of the clump. In contrast to the inefficient RATD at the parsec scale in the smooth torus model (see Figure 2), this mechanism now is strong enough to destroy all large grains of in the whole clump located at pc with . The higher efficiency of RATD comes from the configuration of the clumpy torus model such that dust near the front face of clumps is directly illuminated by the strong UV-optical AGN radiation and thus can be destroyed by RATD stronger. However, for a higher gas density of , RATD is only efficient to disrupt large grains in the first half of the clumps near the AGN.
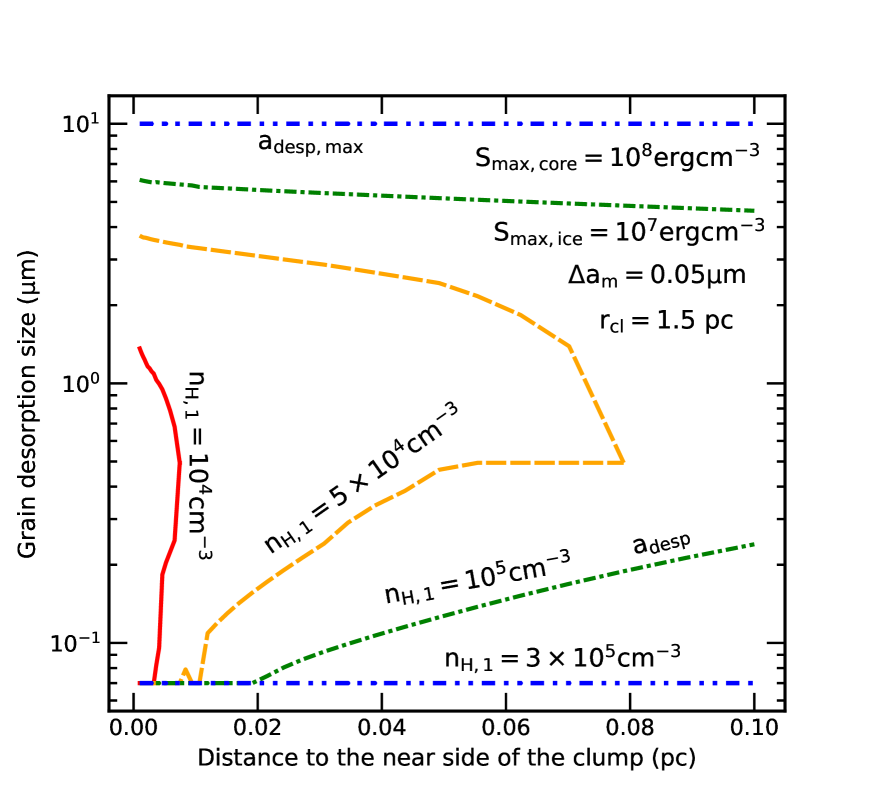
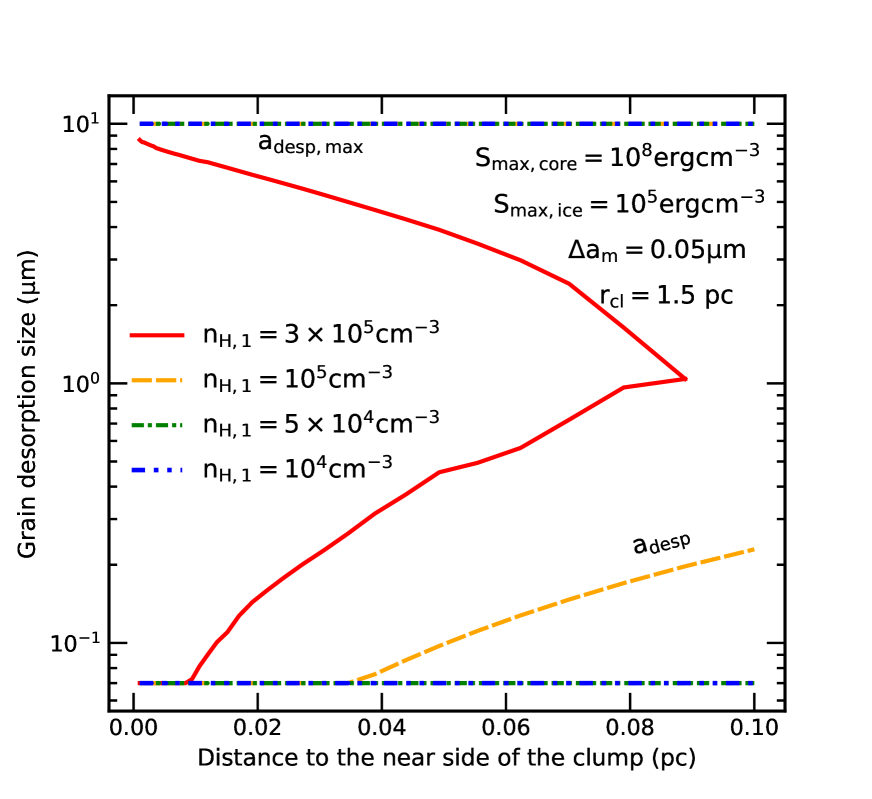
The right panel of Figure 3 shows the similar results as the left one but for . The RATD effect becomes stronger (i.e, smaller ) due to the smaller . For instance, micron-sized grains of with low will be totally removed by RATD even if the clumps at pc are optically thick with .
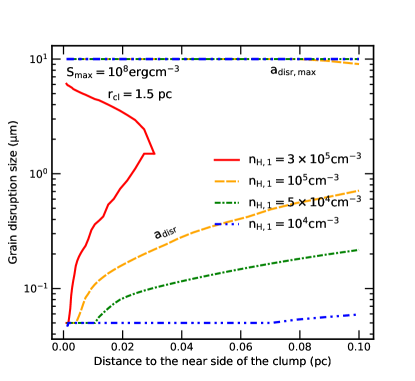
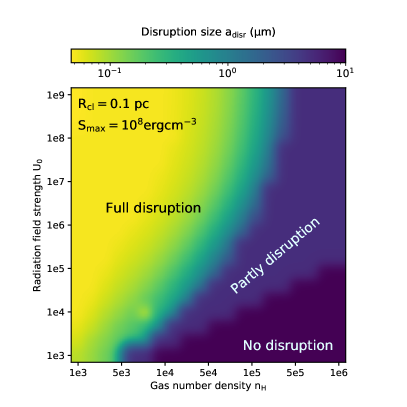
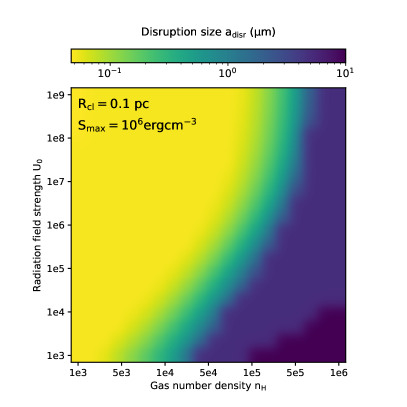
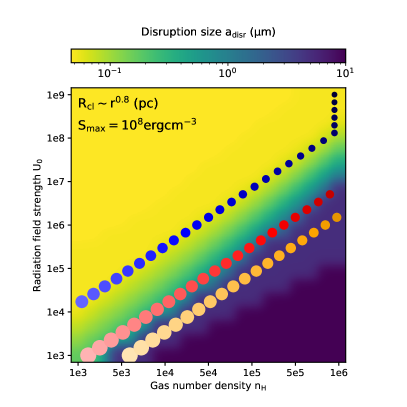
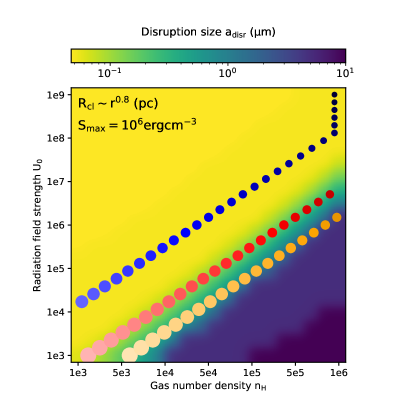
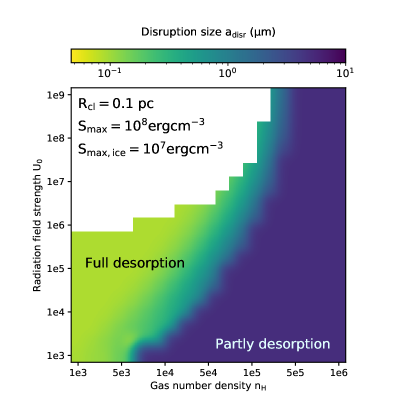
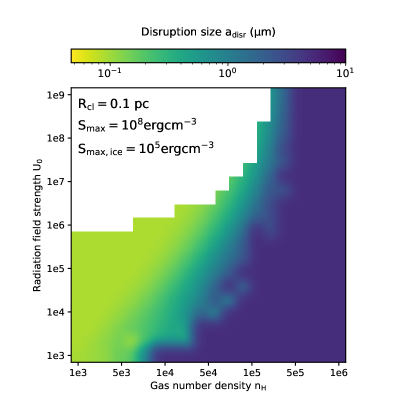
We now study the effect of RATD for a given clump of pc, assuming the different radiation strength () and density () at the near side of the clump. The results for and are shown in the upper left and right panel of Figure 4, respectively. The color from yellow to blue indicates the total disruption of large grains by RATD inside the clump (e.g., the right panel of Figure 3), while the darkblue indicates the disruption in the front half of the clump (e.g., the curve with in the left panel of Figure 3). The black (e.g., ) indicates no disruption effect.
For compact grains with (left panel), they will be efficiently destroyed by RATD in the region of strong radiation field and/or low gas density (yellow region) and are less affected by RATD in the weak radiation field and/or high density region (darkblue and black region). The constrains of the maximum grain size by RATD is stronger, i.e., smaller , for grains with lower maximum tensile strength (right panel for grains with ). For example, with and , RATD only can remove large grains with in the front half of the clump of size pc (darkblue region), while it can destroy all grains larger than in the entire clump if grains have .
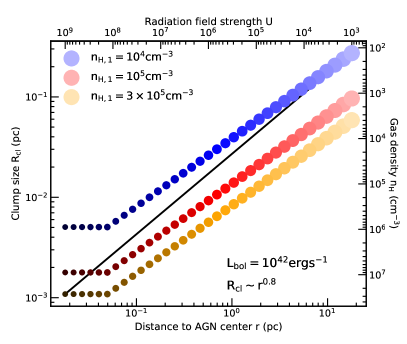
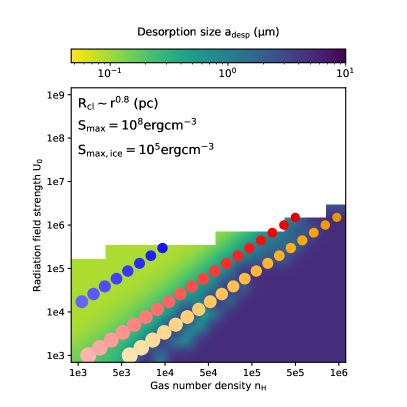
The upper left panel of Figure 5 shows the variation of gas densities given by Equation (10) and cloud sizes given by Equation (11) with as the function of distances to the AGN center (or radiation field strength ). From the relation (black line), we sample 35 points from to pc to study the effect of RATD inside clumps. Blue, red, and orange colors present for different gas density profiles with the gas density at 1 pc of , and , respectively. Small, dark circles present for small, dense clumps near the AGN center while large, faint clumps present for large, less dense clumps near the outer region of the circumnuclear region (see the left part of Figure 1).
The upper right and lower left panels of Figure 5 show the similar disruption size map as the function of and as Figure 4, but accounting for the variation of clump size with distances from the upper left panel. RATD is more efficient in destroying composite dust grains inside the dense and compact clumps near the center region, but less efficient in the dilute and large clumps far from the center. Putting the sample of studied cases (red, blue, and orange circles) from the upper left panel to the map, one can see that with low gas density of , RATD is efficient enough to suppress the presence of large grains of inside the torus. For a higher gas density of , grains of with at the far side of clumps can survive against RATD and grow to micron-sizes. However, the growth of micron-sized grains is likely coupled with the reduction of the material’s strength (Dominik & Tielens 1997, Wada et al. 2008, Suyama et al. 2012). For newly formed large grains with (the lower left panel), they will be quickly disrupted again to smaller sizes. In other words, the maximum grain size inside clumps will be constrained by the strength of RATD.
If clumps inside the torus are bigger and denser than our considered case, dust aggregates have more chance for growing around AGN. This sets the boundary region of RATD that should be taken into account when studying the formation of large grains inside the dusty torus.
4 Rotational desorption of icy grain mantles
In this section, we study the evolution of icy grain mantles beyond the snow line under the effect of rotational desorption (Hoang & Tram 2020). The rotational desorption mechanism is described in Section 4.1 and the results are shown in Section 4.2.
4.1 Rotational desorption mechanism
Similar to rotational disruption of composite dust grains in the intense radiation field described in Section 3.3, an ice mantle can be separated from a solid grain core if the tensile stress produced by the spinning icy grain exceeds the adhesive energy that holds the mantle and the core together (Hoang & Tram 2020).
Let be the effective radius of a spherical grain that has the same volume as the irregular compact grain core, and is the average thickness of the ice mantle. The effective radius of the icy grain can be considered as . The average tensile stress produced by the centrifugal force of all ice layers applying on the interface of core-mantle is (Hoang & Tram 2020):
| (20) |
where is the mass density of ice.
The detachment of the ice mantle from the grain surface will occur when exceeds the adhesive energy of the mantle. The adhesive energy depends on the surface properties of the solid core, i.e., rough surfaces induce larger adhesive strength up to (Work & Lian 2018) while smoother surfaces induce lower values. The tensile strength of ice depends on the temperature, that higher temperature, i.e., K, induces lower value of (Litwin et al. 2012). In this paper, we consider that the adhesive strength has the same value as the maximum tensile strength of ice mantles.
The critical angular velocity for rotational desorption of the ice mantle can be obtained by setting (Hoang & Tram 2020), which follows:
| (21) | |||||
where .
4.2 Grain desorption size


Our numerical calculations of the gas temperature (see Equation 6) show that ice can exist on the composite dust grains beyond pc. We will next study the evolution of icy grains under the rotational desorption effect, assuming that the grain core has .
4.2.1 Smooth torus model
The left panel of Figure 6 shows the dependence of grain desorption size of icy grain mantles with the fixed grain core of on distances, assuming different gas density profiles. The maximum tensile strength of ice mantles is (thick lines), and (thin lines). One can see the overlap between and at beyond pc for , indicating no effect of rotational desorption at the parsec scale of torus region. Ice mantles are only detached from the grain core only if the gas density at 1 pc declines below .
The right panel of Figure 6 shows the space-varying desorption size for icy dust with the fixed thickness of ice mantles of . Similar to the left panel, rotational desorption only can affect icy grains at the parsec scale if . The desorption happens stronger for lower tensile strengths of ice mantles. In addition, one can see that thin ice mantles are hard to be detached from the core, i.e., higher and lower , that belongs to the lower tensile stress applying on the contact region between the solid core and the ice mantle (see Equation 20).
4.2.2 Clumpy torus model
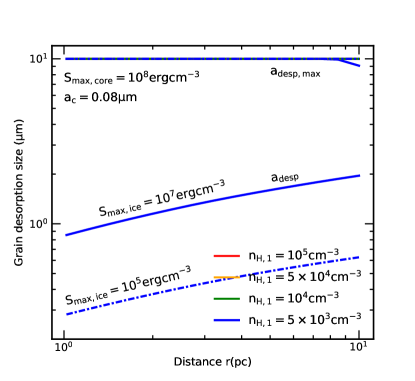
The upper panel of Figure 8 shows the variation of within the clump of radius pc at pc with different gas density profiles, assuming the fixed grain core of , and . Icy grain mantles are desorbed stronger near the front side of clumps and weaker in the middle and back side. Interestingly, one can see that rotational desorption now can affect into the presence of icy grain mantles at the parsec scale of torus region thanks to the direct illumination of UV-optical photons from the center region. The detachment happens stronger for the clumps with a lower gas density (i.e., lower ). For instance, at the far side of clumps, the desorption size decreases from (no rotation desorption effect) for to and for and , respectively.
The lower panel of Figure 8 shows the similar results as the upper panel, but for . For lower maximum tensile strength of ice mantles, i.e., smaller desorption threshold, rotational desorption can detach all icy grains with size greater than even in the dense clumps with at 1.5 pc.
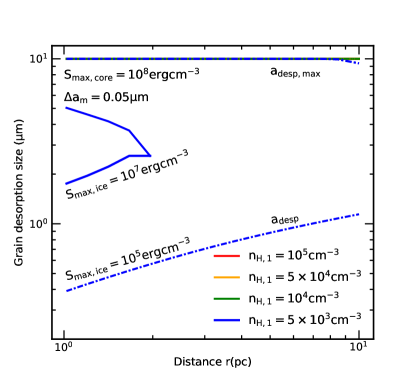
Figure 8 shows the variation of grain desorption size inside the clump of pc located at 1.5 pc for the different gas density profiles, assuming the fixed thickness of ice mantles of . Similar to the case of fixed grain core, ice mantles can be detached from the core due to rotational desorption effect. The detachment is stronger for dilute clumps and porous structure of ice mantles. However, the thin ice mantle is less separated from the core due to lower induced tensile stress at the contact region, i.e, higher compared with the results in Figure 8. For example, with , ice mantles with thickness never be desorbed from the core in dense clumps with .
Upper panels of Figure 9 shows the dependence of the grain desorption size inside the clump of pc with the radiation strength () and gas density () at the front (near) side of the clump. The results are for icy grains with a fixed and icy mantles with (left panel) and (right panel). Empty parts present for the region where water vapour cannot condense into ice, i.e., K. Similar effect as RATD, icy grain mantle inside clumps with low gas density and one with lower maximum tensile strength are detached by rotational desorption stronger.
Lower panels show the similar results as the upper panels but accounting for the variation of clump size with distances given by the upper left panel of Figure 5. The sample of our studied cases (upper left panel of Figure 5) are also marked in the map. One can see that if , large icy grain mantle with will be strongly separated from the core even if they locate in large clumps at pc (). If the clumpy torus is denser with , thick ice mantles up to micron-sized can remain on the grain surface at the far side of clumps due to inefficient rotational desorption. Ice mantle with composite structure can be easier to be detached from the core by rotational desorption, but the difference is not clear (see the right panel). In this case, ice mantles increases the sticking coefficient and facilitate the sticky collisions between icy grains to form larger dust aggregates. However, the increase in the size of composite grains induces the decrease of the tensile strength. Consequently, newly formed large dust aggregate can be disrupted by RATD, which prevents grain growth and blanet formation (see the lower left panel of Figure 5). However, the formation of large grains and further evolution can happen if clumps are denser and bigger than our consider cases.
4.3 Disruption and desorption timescale
Dust grains in the AGN torus may experience strong rotational damping due to IR re-emission, i.e., (see Hoang et al. 2020 for the explanation). Thus, the moment when composite grains of size are disrupted by RATD can be found by setting given by Equation (12) to equal given by Equation (16). The disruption time is given by:
| (22) |
Similarly, the moment when the ice mantle detaches from the solid grain core by rotational desorption can be found by setting (Equation 21). The desorption time is then:
| (23) |
5 Grain Growth vs. Disruption times
In Sections 3.3 and 4.2, we study the effect of rotation disruption and desorption on composite and icy grains in the midplane of the torus and find that grain growth and blanet formation can occur in the torus the idealized smooth torus model. However, large composite grains and icy grain mantle of size are efficiently disrupted by RATs for the clumpy torus model, assuming the same gas density distribution adopted in Wada et al. (2019, 2021). Thus, to check whether grain growth can occur in the clumpy torus, we will calculate the timescale of grain growth in the hit-and-stick stage and compare it with the timescale of dust destruction and ice desorption in Sections 5.1 and 5.2.
5.1 Grain Growth Timescale
Wada et al. (2019) considered the possibility that icy grain mantles (of initial size ) in the torus can grow to larger ones via coagulation, assuming that grain growth follows the ballistic cluster-cluster aggregation (BCCA) model. The mass growth rate during the hit-and-stick stage via the BCCA route is given by (Wada et al. 2019, 2021):
| (24) |
where is the surface mass density, is the relative velocity between dust aggregates, and is the scale height of the dust disk.
The growth rate of grain size of can be written as
| (25) |
where is the gas-to-dust mass ratio, is the dimensionless parameter to determine the kinematic viscosity in the turbulent disk (Shakura & Sunyaev 1973), is the Reynolds number, is the mass of SMBH, and is the distance from the AGN center.
The time required to form a dust aggregate of size is given by (see Appendix A for a detailed derivation):
| (26) | |||||
where is the radius of icy monomers and is the sound velocity.

5.2 Comparison of grain growth to rotational disruption and desorption timescales
5.2.1 Growth and disruption timescales
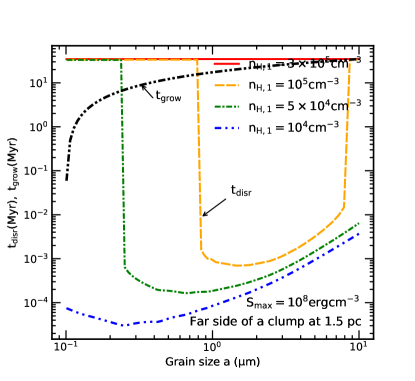
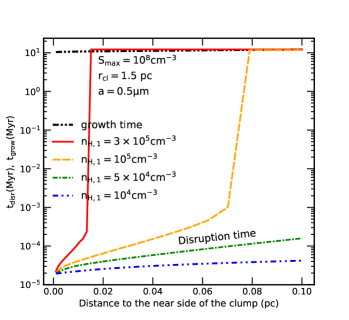
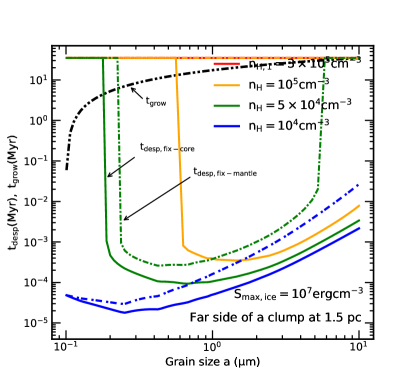
The left panel of Figure 10 shows the growth (gray lines) and disruption timescales (color lines) of different grain sizes varying from to at the far side of the clump of radius pc at pc, assuming different gas density profiles and . For , dust aggregates in the far side of the clump can freely grow to micron-sized grains of due to inefficient RATD (see the left panel of Figure 3), i.e., . By decreasing the gas density, sub-micron grains of can survive, but larger grains will be quickly disrupted by RATD just after kyr, much faster than grain growth of this size by a factor of . The disruption time slightly increases for micron-sized grains, but it is still smaller than the growth time by a factor of . By decreasing the gas density, dust grains of size become more difficult to form due to efficient RATD, i.e., smaller . The big gap between growth and disruption timescale for grains within disrupted range of implies the significant suppress of grain growth via coagulation for the clumpy torus model.
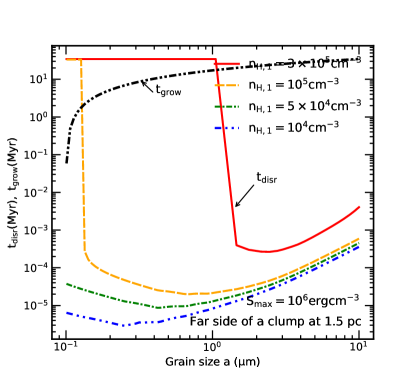
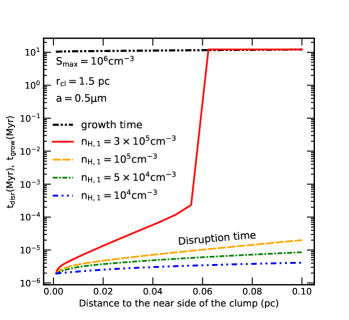
The right panel of Figure 10 shows the similar results as the left panel but for dust grains with a lower strength of . For the same density , composite dust grains can freely grow to , but further growth will be prevented by the RATD effect, i.e., by a factor of . The dust disruption inside clumps happens stronger (i.e., smaller ) and quicker (i.e., smaller ) for more dilute clumps. This feature implies the difficulty for large dust aggregates to survive in the clumpy torus model.
The upper panel of Figure 11 shows the space-varying growth (faint lines) and disruption (dark lines) timescale for different grain sizes inside the clump at pc, assuming . One can see that the disruption timescale is different for different grain sizes and different locations inside clumps. But generally, composite dust grains within the disrupted range (the left panel of Figure 3) will be destroyed by RATD before it can grow to larger sizes (i.e., a factor of ). Otherwise, they are not affected by RATD and can collide with another to form larger ones (i.e., the presence of grain of sizes and ) at the far side of clumps (the yellow curve in the left panel of Figure 12).
The center panel of Figure 11 compares with for composite grains of size with inside the clumps at pc, assuming different gas density profiles, . By reducing the gas density, grains of size will be destroyed by RATD quicker (i.e., smaller years) and stronger (i.e., RATD happens to the far face of the clump). Similarly, the timescale for dust disruption by RATD is shorter for dust grains with the lower tensile strength (e.g., porous structures) (see the lower panel with ).
5.2.2 Growth and desorption timescales
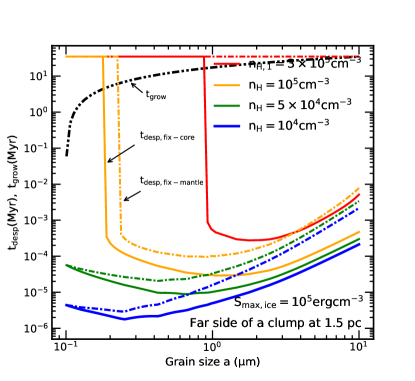
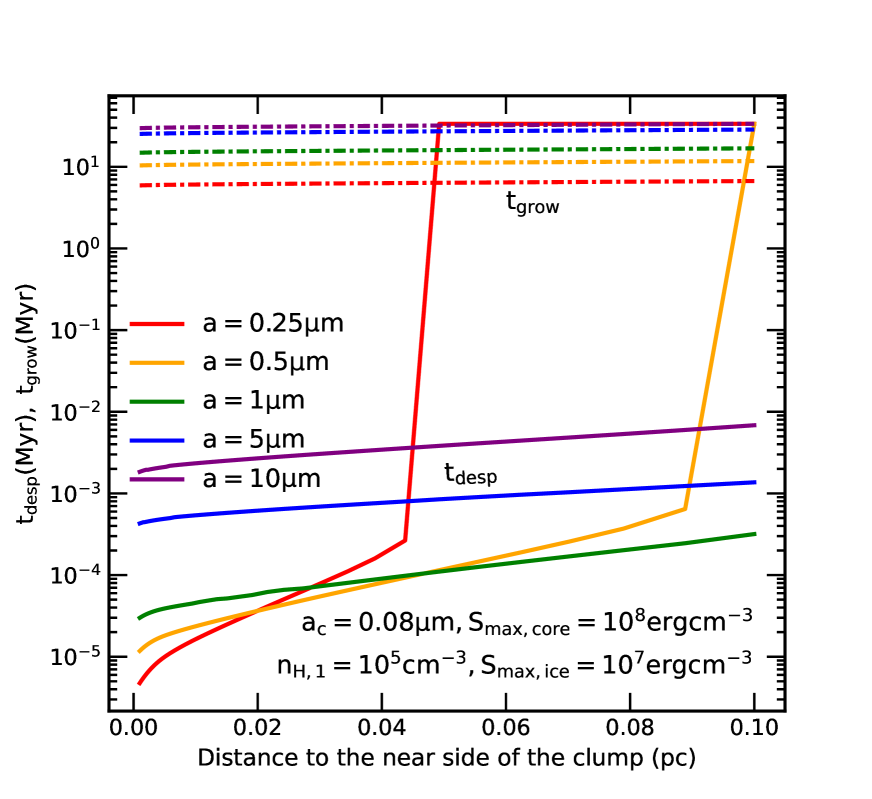
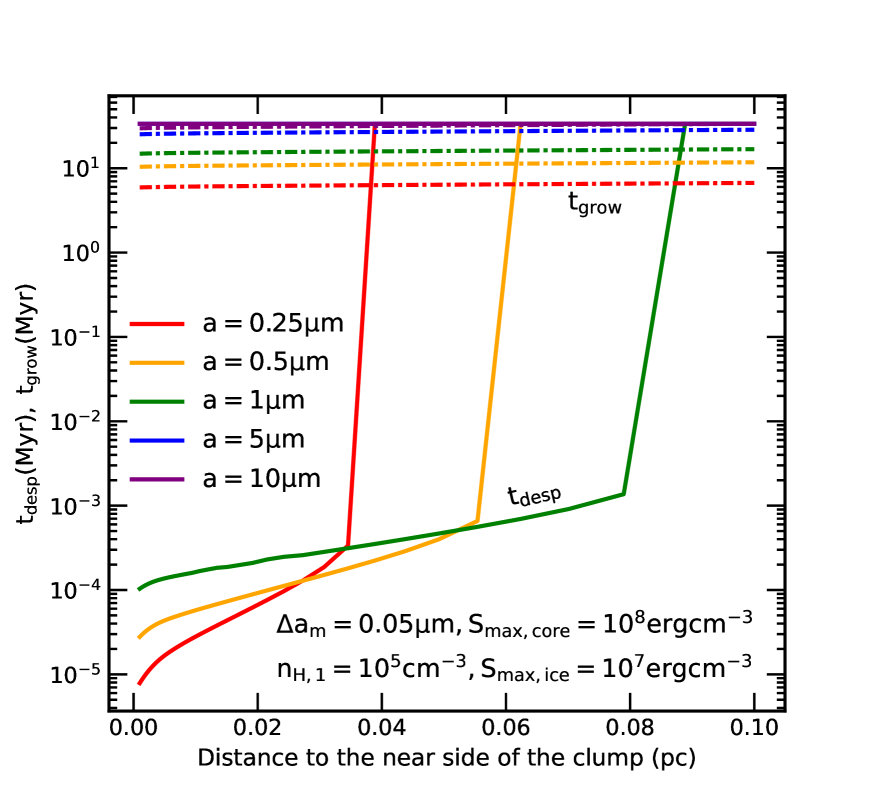
Figure 12 shows grain growth (gray line) and desorption (color lines) timescales for different sizes of icy grain mantles located at the far side of clumps at pc, assuming and for the left and right panel, respectively. The dark and faint lines present for the case of fixed grain core and fix ice mantle’s thickness. For the dense clump with , ice can form and freely cover on all grain sizes without separating due to inefficient rotation desorption. For clumps with , ice can cover around solid grain core up to the size of , but thicker ice mantles (larger size of icy grains) will be quickly detached (i.e., ), just after few kyr. By decreasing the gas density and , more grain core-ice mantle structure will be destroyed (i.e., extended ) in shorter timescales (i.e., smaller ). However, thin ice mantles are desorbed by rotational desorption weaker, resulting in the longer desorption timescale and thus, maybe not affected even if reducing (i.e., the curve with ).
The upper panel of Figure 14 shows the space-varying of growth (faint lines) and desorption (dark lines) timescale for different sizes of icy grain mantles inside the clump of size pc at pc, assuming the fixed grain core and . Similar to the disruption timescale properties, icy grain mantles inside the desorption range (the left panel of Figure 3) will be detached by rotational desorption before they can grow to larger sizes. Otherwise, ice still can cover around the grain core and supports the grain growth process. For example, ice can cover around the grain core of with the thickness of at the backside of clumps due to inefficient rotational desorption on removing thin ice mantles.
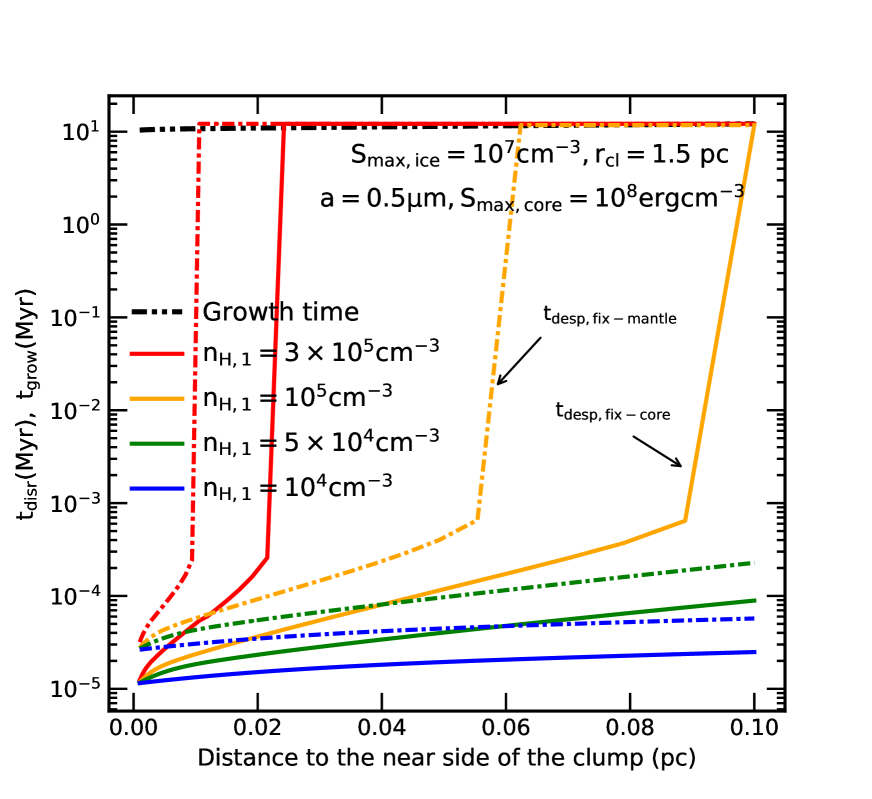
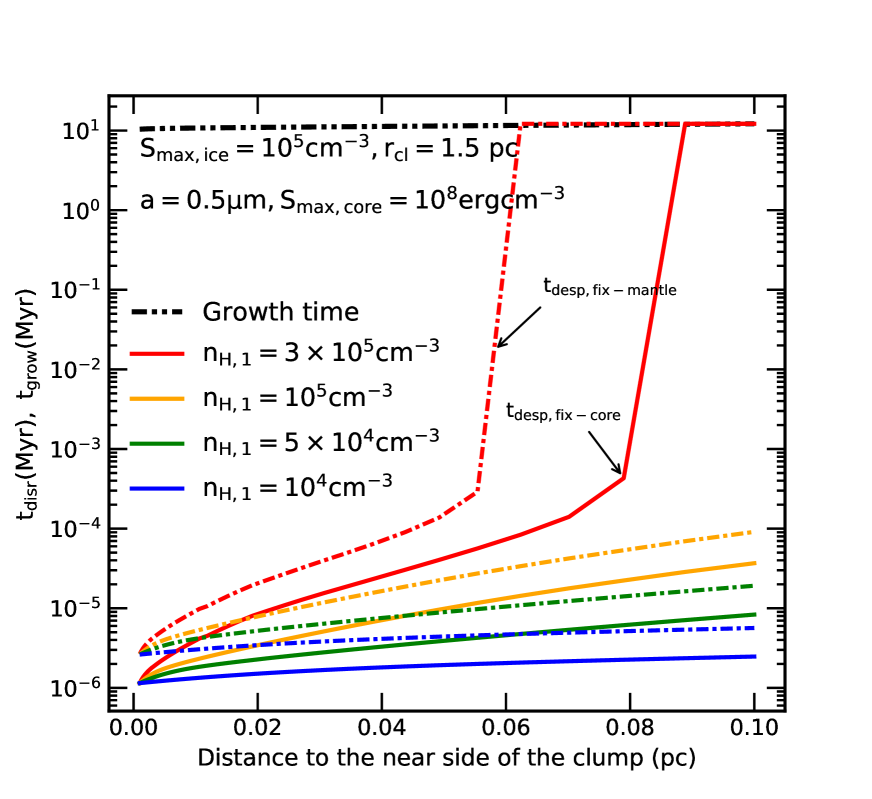
Figure 14 shows the space-dependence of growth (gray line) and desorption (color lines) timescale of icy grain mantles of size inside the clump at pc. We consider different gas density profiles and the maximum tensile strength of ice mantles of (upper panel) and (lower panel). The dark and faint lines present the case of fixed grain core and fixed thickness of ice mantles, respectively. One can see that rotational desorption destroy the grain core-ice mantle structure stronger and quicker in the near face of clumps due to higher radiation flux. In addition, this effect will occur stronger, i.e., lower and larger influenced partions of clumps, with decreasing the gas density, decreasing the maximum tensile strength, and increasing the thickness of ice mantles.
In conclusion, in the active region of rotational disruption and desorption, large composite/icy dust grains only take about a few thousand years to rotationally disrupted/desorbed. The timescale is longer for the optically thick regions and for grains with compact structures, but generally be shorter than the growth time of the same size by a factor of . This implies that RATD is a strong constraint for dust properties and evolution, which cannot be neglected when studying grain growth.
6 Discussion
6.1 Dust and ice evolution under AGN radiation feedback
Dust in the torus is the key component in the unified model of AGN (Antonucci 1993; Urry & Padovani 1995) and responsible for the ’infrared bump’ feature in the observed spectral energy distribution (Barvainis 1987; Urry & Padovani 1995; Fritz et al. 2006, Nenkova et al. 2008; Stalevski et al. 2012). In addition, dust polarization induced by aligned dust grains is an important tool to study magnetic fields in AGN tori. Understanding dust properties and its interactions with AGN radiation field is the key for constraining the feeding and feedback of AGN to the surrounding environment and probing the origin of the central engine. However, detailed knowledge about dust properties subject to AGN radiation feedback is still poor constrain.
Previously, dust destruction due to AGN radiative feedback was studied by Barvainis (1987) via thermal sublimation and by Tazaki et al. (2020) for Coulomb explosions. However, these mechanisms only work in a small region near the AGN and effectively for small grains of , and the Coulomb explosion effect is ineffective in the optically thick torus (Tazaki et al. 2020). Thus, dust grains beyond the sublimation front are hardly affected by AGN radiation feedback because of the high attenuation of X-rays and UV photons.
Nevertheless, Hoang et al. (2019b) realized that dust grains subject to strong radiation field can be rotationally disrupted by the RATD effect. Applying this mechanism for the smooth torus model of AGN with a high luminosity of , Giang & Hoang (2021) found the significant removal of large grains of up to the boundary region of pc, for the wide range of maximum tensile strength of and gas density distribution of . The reduction of the maximum grain size to by RATD is more effective in the higher latitude region due to its lower gas density. However, for AGN with a low luminosity of , RATD is not efficient for the smooth torus model with a high gas density (Section 3.3.1). As a result, dust properties at the parsec scale in the midplane will not be affected by RATD for the gas density at 1 pc is high of .
In contrast, if dust and gas are concentrated into dense clumps (i.e., clumpy torus model), the attenuation of AGN radiation is reduced, and dust grains can still be spun-up to disruption limit by RATs. Consequently, RATD is strong enough to destroy composite dust grains in both dense clumps near the AGN center and large, dilute clumps at large distance of pc (Section 3.3.2). The significant influence of RATD in the parsec scale of the torus arises from the fact that RATD can work with the optical-NIR photons that can propagate to a longer distance compared to X-rays and UV photons required for sublimation and Coulomb explosions. Moreover, RATD depends sensitively on the grain structure and can disrupt large grains of composite structures in just a few thousand years. The dust properties modified by RATD would have important effects on the observational properties (emission and polarization), dust dynamics and radiation pressure feedback from AGN (e.g., Hoang:2021). A detailed study of these effects will be presented in a followup paper.
On the other hand, icy grain mantles are expected to exist in the torus beyond the sublimation front (i.e., “original” snow line. However, rapidly rotating icy grain mantles induced by RATs may be rotationally desorbed by centrifugal force (Hoang & Tram 2020, Tung & Hoang 2020). For the low-luminosity AGN, we find that rotational desorption on icy grain mantles is inefficient for the smooth torus model (Section 4.2.1). However, for the clumpy torus model, ice mantles can be desorbed from the grain core beyond the “original” snow line, and the amount of icy grain mantles will decrease inside the clumps (Section 4.2.2). Similar to RATD, rotational desorption works with optical-NIR and only takes a few thousand years to detach icy grain mantles, shorter than the growth time by a factor of (see Section 5.2.2). These effects have important implications for accurately constrain the bundance of water and complex molecules and the efficiency of grain coagulation in the torus.
It is worth noting that, in Section 4.2, we studied the effect of rotational desorption and found that this mechanism only can remove thick ice mantles of . Icy dust aggregates with thin ice mantles still survive beyond the “original” snow line. However, thin ice mantles can be detached from the grain core when accounting for reducing the binding energy between icy particles due to the spinning effect, which is termed as ro-thermal desorption mechanism (Hoang & Tung 2019).
6.2 Dynamical barriers of planet formation around a SMBH
Wada et al. (2019, 2021) studied the formation of blanets beyond the snow line of the midplane of torus region around SMBHs from the hit-and-stick stage to the gravitational instability phase. The authors found that blanets can form if the AGN luminosity is low of and the gas density is high of . The authors also studied whether grain shattering due to high-velocity collisions could be a critical barrier for blanet formation in the AGN torus. They found that grain fragmentation is not efficient due to the low relative velocity between icy dust aggregates. Particularly, the grain relative velocity, , is found to span from during the hit-and-stick stage to the maximum velocity of at the end of gas compression stage, which is much lower than the critical velocity of shattering of . The value of increases with increasing turbulence, that higher viscosity of gas of results in the fragmentation of dust aggregates at km-size (Wada et al. 2021). However, during the hit-and-stick stage considered in this paper, the value of is much smaller than the shattering threshold, implying that grain shattering is not an important barrier for blanet formation.
In this paper, we study the influence of rotation disruption on composite grains in the circumnuclear region with the same conditions adopted in Wada et al. (2019, 2021). We found that, for the smooth torus model with a high density adopted from Wada et al. (2019), high attenuation of AGN radiation will reduce the efficiency of RATD (Section 3.3.1) at the parsec scale. Thus, RATD is not the major barrier for grain growth and blanet formation around low-luminosity AGN. However, the RATD mechanism is still a critical barrier of blanet formation around standard AGN.
In contrast, for the clumpy torus model, the presence of dust aggregates of inside clumps is almost prohibited by RATD, up to pc (Section 3.3.2). Inside big clumps of pc with a high density , grain growth can occur at the far side of clumps due to inefficient RATD (the left panel of Figure 3, and upper left panel of Figure 4). However, the growth of dust aggregates is accompanied by the decrease of internal density due to the increase of voids between monomers ( Dominik & Tielens 1997, Wada et al. 2008, Suyama et al. 2012, Shen et al. 2008). The increase of porosity of large dust aggregates thus implies the significant reduction of the maximum tensile strength of with the size of monomer (Greenberg et al. 1995, Li & Greenberg 1997, Hoang 2019a), and the enhancement of dust disruption by RATD (see the right panel of Figure 3 and the upper right panel of Figure 4). Newly formed dust aggregates are destroyed and the maximum size decreases to the size before growing. Moreover, the clear difference between disruption timescale (few thousand years) and growth timescale (few million years) (Section 5.2.1) sets the first barrier that dust must overcome to continue the blanet formation.
On the other hand, grain growth is expected to occur more efficiently beyond the snow line where the presence of ice mantles increases the sticking coefficient and prevents the fragmentation during the collision between sub-micron composite dust grains, which facilitates the formation of large, highly porous dust aggregates (Chokshi et al. 1993, Gundlach et al. 2011). In Section 4.2.1, we show that rotational desorption is not a major barrier for grain growth at the parsec scales if gas and dust distribute smoothly in space. However, if they concentrate into dense clumps within the diffuse torus, ice mantles will be quickly separated from the grain core (Section 4.2.2). The removal of ice mantles thus may cause the dust grains to bounce off each other rather than sticking together or grain shattering (see Chiang et al. 2010), which would reduce the efficiency of grain growth to large aggregates of size. Therefore, rotational desorption of ice mantles becomes the second barrier for blanet formation due to the short timescale (Section 5.2.2) and the large active region of rotational desorption (Section 4.2.2).
6.3 Effects of torus models on rotational disruption and desorption
Indeed, the real morphology and distribution of dust and gas inside the circumnuclear region is still debated. The smooth torus model generally can reproduce the observed IR spectral energy distribution (SED) of the large sample of AGN and the absorption feature of SiO at toward type II Seyfert galaxies (Fritz et al. 2006, Schartmann et al. 2008). However, Schartmann et al. (2008) showed that the width of SED produced by the smooth torus model is narrower than observations (Granato & Danese 1994, Granato et al. 1997), and this model cannot explain the weak emission/absence of the SiO emission at in Type 1 Seyfert galaxies (Hao et al. 2007, Siebenmorgen et al. 2005). The clumpy torus model proposed by Nenkova et al. (2002) can successfully explain these puzzles, it also can explain the detection of multi temperature components at the same distance in the circumnuclear region (Nenkova et al. (2008a), Nenkova et al. (2008)), Dullemond & van Bemmel 2005, Hönig et al. 2006, Stalevski et al. 2012). However, interferometric observations toward the torus region do not clearly show the discrete distribution of clumps inside the diffuse medium as illustrated in the clumpy torus model. They reveal the complex, geometrically thick, inhomogeneous gas and dust density distribution (Tristram et al. 2009, Shi et al. 2006, Hicks et al. 2009, (Markowitz et al. 2014, Izumi et al. 2018), that matches with the multi gas-phase picture driven by the ”radiation-driven fountain” model proposed by Wada et al. (2009) (Wada et al. 2016, Schartmann et al. 2014). This model also can reproduce the dependence of the observed properties of type 1 and 2 Seyfert galaxies on luminosity (Burlon et al. 2011, Buchner et al. 2015, and also the X-ray continuum observed toward AGN (Buchner et al. 2021).
In addition to the simple adopted model of the torus region, we also only solve the radiative transfer of AGN radiation in one dimension, that basically neglects the asymmetric geometry of AGN radiation emitting from the accretion disk, and the detailed dust scattering and thermal dust emission in three dimensions. Thus, a detailed study with a more realistic model of AGN radiation field and dust/gas distribution in the torus region is required to better constrain the effect of RATD and rotational desorption in the torus region. This is the key for answering the question of blanet formation in low luminosity AGN.
6.4 Upper limit of RATD for the clumpy torus model
From Figure 4, one can see the decrease of RATD efficiency inside clumps with decreasing the radiation strength and increasing the gas density. With the gas profile adopted from Wada et al. (2016, 2019) and the clump size distribution adopted in the lower panel of Figure 4, one can see that rotational disruption and desorption are the main barriers for grain growth and blanet formation.
However, if the clumps are bigger (i.e., higher in Equation 11) and have a higher gas density of , the RATD efficiency will be similar as in the smooth torus model. Large grains in the near face of clumps can be destroyed by RATD due to higher radiation flux, but they can freely grow and form highly porous dust aggregates, i.e., size, if they are located in the far side of clumps. For example, at pc (corresponds to ), with , grain growth via coagulation will be prevented by RATD inside the clumps of size pc (the upper panels of Figure 4), but it can occur normally and form blanets if the clumps are larger with pc or . On the other hand, lower radiation field strength (i.e., lower AGN luminosity) also reduces the RATD effect and support for blanet formation inside the circumnuclear region.
The presence of more than one clump along the same radial direction is another factor that reduces the RATD efficiency, especially if the line of sight passes through many small but very dense clumps near the center region. Accounting for this effect will narrow the configurations supporting the global effect of RATD inside the torus but broaden the conditions that support grain growth and blanet formation.
6.5 RATD by IR emission from hot dust grains
In contrast to other dust destruction mechanisms (i.e., thermal sublimation and Coulomb explosion) that require X-ray and extreme UV radiation (Barvainis 1987, Tazaki et al. 2020), RATD can work with low energy photons at optical-IR (Hoang et al., 2020), resulting in the significant effect of RATD in the parsec scale inside torus regions. However, in Sections 3.3 and 4.2, we only consider the disruption effect by optical-MIR radiation produced by the accretion disk and neglect the IR emission from the hot dust near the sublimation front.
NIR-submillimeter can penetrate deeply in dense environments, that the additional contribution from thermal dust emission basically extends the active region of rotational disruption and desorption in the circumnuclear region. In particular, large micron-sized grains are mainly spun up by NIR-submillimeter radiation, that the enhanced IR radiation by thermal dust grains will strengthen the RATD effect on destroying large micron-sized composite grains and the rotational desorption effect on removing large icy grain mantles. Consequently, rotational disruption and desorption can be the main barrier for the blanet formation, even in the smooth torus region or in the large clumps near the outer part of the torus. The detailed modeling accounting for the thermal emission of dust grains should be performed to precisely quantify when rotational disruption and desorption prohibit the blanet formation around low-luminosity AGN.
6.6 Efficiency of RATD and blanet formation
The efficiency of RATD depends on the fraction of grains on high-J attractors, denoted by , which in general depends on the grain properties (shape, size, and magnetic properties), and (Hoang 2020; Lazarian & Hoang 2021). An extensive study for numerous grain shapes and compositions by Herranen et al. (2021) found , depending on the grain shapes, sizes, and radiation field. The presence of iron inclusions is found to increase to unity (Hoang & Lazarian, 2016), whereas carbonaceous grains have a lower fraction of . Therefore, the RATD mechanism prohibits the formation of blanets out of composite grains with iron inclusions, but it does not completely rule out the formation of blanets made of purely carbonaceous material. However, dust grains in the dense torus are presumably present in the composite dust instead of two separate silicate and carbonaceous grain materials. Therefore, the efficiency of blanet formation via dust coagulation around SMBHs is reduced by the RATD effect, especially in the standard AGN with .
7 Summary
Previous studies suggest that planets can form in the torus of low-luminosity AGN around SMBHs. Here we have studied the effect of rotational disruption and desorption of dust and ice by radiative torques due to AGN radiation feedback and discussed their implications for grain growth and planet formation around SMBHs. Our main findings are summarized as follows:
-
1.
For the simplified smooth model of the torus with the gas density profile of and the gas density at 1 pc , as adopted from Wada et al. (2019), rotational disruption and desorption are only efficient at distances of pc for low-luminosity AGN of . However, these rotational effects are not efficient for disrupting large grains at large distances of pc due to the high extinction of stellar radiation by intervening dust. Therefore, grain growth and blanet formation can occur around low-luminosity AGN as suggested by Wada et al. (2019).
-
2.
For the more model that gas and dust concentrate into dense clumps that distributes diffusely inside the circumnuclear region, the attenuation of the AGN radiation is reduced, which enhances the spinning rate of dust grains. As a result, the efficiency of rotational disruption of composite grains and the desorption ice mantles is increased. The sticking coefficient between monomers during the collisions would be reduced due to the removal of ice mantles around the grain core, and the increase in size of dust aggregates is suppressed by RATD to even in the large clumps of pc at pc, assuming the same gas density distribution adopted from Wada et al. (2019). The timescale of rotational disruption and desorption is shorter than the growth time a factor of , such that rotational disruption and desorption become a major barrier for grain growth and blanet formation in the AGN torus.
-
3.
Grain growth and blanet formation may occur inside large clumps of pc with higher gas density than ones adopted for our modeling. In addition, since the observations support the inhomogeneous, multi-gas phase structure of torus region driven by the ”radiation-driven fountain” model, the detailed calculations with more realistic AGN source and torus model, and the additional contribution of IR dust radiation are required to determine whether grain growth and blanet formation can occur in the presence of grain rotational disruption/desorption.
Appendix A Hit-and-stick timescale of BCCA model
In the blanet formation picture suggested by Wada et al. (2019), icy grain mantles in the midplane of torus first collide and stick together via Ballistic Cluster-Cluster Aggregation (BCCA) model to form larger dust aggregates (Okuzumi et al. 2012). The maximum size at the end of this stage is about cm-sized (Wada et al. 2019). Then, cm-sized grains continue to grow further via 2) gas pressure compression, 3) gravitational compression, and form blanets of the Earth-size after 4) gravitational instability phase (Goldreich & Ward 1973).
During the hit-and-stick stage, the radius of a BCCA cluster with icy monomers and grain mass is described as (Wada et al. 2008, 2009, 2019):
| (A1) |
where is the size of icy monomer at which Wada et al. (2019) starts to track grain growth and is the mass of monomer with the mass density of ice.
The rapid increase in size of newly form dust aggregates is accompanied with the significant decrease of its mass density, which is:
| (A2) |
where is the fractal dimension for dust aggregates formed via BCCA model (Mukai et al. 1992, Okuzumi et al. 2009).
The growth rate of dust aggregates during the hit-and-stick stage is (Wada et al. 2021):
| (A5) |
where is the dust mass surface density with the gas mass surface density and the gas column density; the typical dust-to-gas mass ratio in ISM. The second term is the collision velocity between dust aggregates with the kinematic viscosity of gas due to the turbulence (Shakura & Sunyaev 1973). In our study, we adopt the similar value of as in the Blanet paper of Wada et al. (2021). is the sound velocity:
| (A6) |
with the Boltzmann constant, the gas temperature in the torus given by Equation (6), and . is the Reynolds numbers, that presents the ratio between the turbulent and the kinematic viscosities of gas in the torus:
| (A7) |
where is the orbital frequency of dust in the midplane of torus,
| (A8) |
with the mass of the supermassive black hole and the distance toward AGN center. Assuming the Eddington ratio of 0.01, one gets for AGN with .
The last term in the equation of is the normalized stopping time, i.e, Stoke number, at which dust particle is coupling with ambient gas, i.e., velocity of dust particle reaches the maximum values due to the gas drag, which is:
| (A9) |
Lastly, the term in Equation (A5) is the scale height of the dust disk, which is:
| (A10) |
where is the scale height of the gas disk, which is:
| (A11) |
In the hit-and-stick stage, and nearly be a constant with the growth of dust grains (see Wada et al. 2019, 2021). Thus, we can adopt .
Then, substituting Equation (A4) to Equation (A5), the increase of grain size with time can be described as:
| (A12) |
or:
| (A13) |
The growth timescale of size a thus is numerically calculated as:
| (A14) | |||||
We note that we derive the timescale of the size growth above from Equation (A5), not taking the timescale from Wada et al. (2021). From Equation (A5) and (A1), the mass growth rate is:
| (A15) |
which is smaller than one in paper of Wada et al. by a factor of 4, and the timescale of grain size growth is longer than their results a factor of 4.
References
- Alonso-Herrero et al. (2016) Alonso-Herrero, A., Esquej, P., Roche, P. F., et al. 2016, MNRAS, 455, 563, doi: 10.1093/mnras/stv2342
- Antonucci (1993) Antonucci, R. 1993, ARA& A, 31, 473, doi: 10.1146/annurev.aa.31.090193.002353
- Barvainis (1987) Barvainis, R. 1987, ApJ, 320, 537, doi: 10.1086/165571
- Buchner et al. (2021) Buchner, J., Brightman, M., Baloković, M., et al. 2021, A&A, 651, A58, doi: 10.1051/0004-6361/201834963
- Buchner et al. (2015) Buchner, J., Georgakakis, A., Nandra, K., et al. 2015, ApJ, 802, 89, doi: 10.1088/0004-637X/802/2/89
- Burke & Silk (1974) Burke, J. R., & Silk, J. 1974, ApJ, 190, 1, doi: 10.1086/152840
- Burlon et al. (2011) Burlon, D., Ajello, M., Greiner, J., et al. 2011, ApJ, 728, 58, doi: 10.1088/0004-637X/728/1/58
- Chiang et al. (2010) Chiang, E., Chiang, E., Youdin, A. N., & Youdin, A. N. 2010, Annual Review of Earth and Planetary Sciences, 38, 493 , doi: 10.1146/annurev-earth-040809-152513
- Chokshi et al. (1993) Chokshi, A., Tielens, A. G. G. M., & Hollenbach, D. 1993, ApJ, 407, 806, doi: 10.1086/172562
- Dominik & Tielens (1997) Dominik, C., & Tielens, A. G. G. M. 1997, ApJ, 480, 647, doi: 10.1086/303996
- Draine (2011) Draine, B. T. 2011, Physics of the Interstellar and Intergalactic Medium
- Draine et al. (1994) Draine, B. T., Draine, B. T., Flatau, P. J., & Flatau, P. J. 1994, Journal of the Optical Society of America A: Optic s and Image Science (ISSN 0740-3232), 11, 1491
- Draine & Li (2007) Draine, B. T., & Li, A. 2007, ApJ, 657, 810, doi: 10.1086/511055
- Draine & Salpeter (1979) Draine, B. T., & Salpeter, E. E. 1979, ApJ, 231, 77, doi: 10.1086/157165
- Draine & Weingartner (1996) Draine, B. T., & Weingartner, J. C. 1996, ApJ, 470, 551, doi: 10.1086/177887
- Dullemond & van Bemmel (2005) Dullemond, C. P., & van Bemmel, I. M. 2005, A&A, 436, 47, doi: 10.1051/0004-6361:20041763
- Fritz et al. (2006) Fritz, J., Franceschini, A., & Hatziminaoglou, E. 2006, MNRAS, 366, 767, doi: 10.1111/j.1365-2966.2006.09866.x
- Giang & Hoang (2021) Giang, N. C., & Hoang, T. 2021, The Astrophysical Journal, 922, 47, doi: 10.3847/1538-4357/ac1116
- Goldreich & Ward (1973) Goldreich, P., & Ward, W. R. 1973, ApJ, 183, 1051, doi: 10.1086/152291
- Granato & Danese (1994) Granato, G. L., & Danese, L. 1994, MNRAS, 268, 235, doi: 10.1093/mnras/268.1.235
- Granato et al. (1997) Granato, G. L., Danese, L., & Franceschini, A. 1997, ApJ, 486, 147, doi: 10.1086/304502
- Greenberg et al. (1995) Greenberg, J. M., Mizutani, H., & Yamamoto, T. 1995, A&A, 295, L35
- Gundlach et al. (2011) Gundlach, B., Kilias, S., Beitz, E., & Blum, J. 2011, Icarus, 214, 717, doi: 10.1016/j.icarus.2011.05.005
- Hao et al. (2007) Hao, L., Weedman, D. W., Spoon, H. W. W., et al. 2007, ApJL, 655, L77, doi: 10.1086/511973
- Herranen et al. (2021) Herranen, J., Lazarian, A., & Hoang, T. 2021, The Astrophysical Journal, 913, 63, doi: 10.3847/1538-4357/abf096
- Hicks et al. (2009) Hicks, E. K. S., Davies, R. I., Malkan, M. A., et al. 2009, ApJ, 696, 448, doi: 10.1088/0004-637X/696/1/448
- Hoang (2019a) Hoang, T. 2019a, ApJ, 876, 13, doi: 10.3847/1538-4357/ab1075
- Hoang (2020) —. 2020, Galaxies, 8, 52, doi: 10.3390/galaxies8030052
- Hoang et al. (2020) Hoang, T., Giang, N. C., & Tram, L. N. 2020, The Astrophysical Journal, 895, 16, doi: 10.3847/1538-4357/ab8ae1
- Hoang & Lazarian (2008) Hoang, T., & Lazarian, A. 2008, MNRAS, 388, 117, doi: 10.1111/j.1365-2966.2008.13249.x
- Hoang & Lazarian (2014) —. 2014, MNRAS, 438, 680, doi: 10.1093/mnras/stt2240
- Hoang & Lazarian (2016) —. 2016, ApJ, 831, 159, doi: 10.3847/0004-637X/831/2/159
- Hoang et al. (2013) Hoang, T., Lazarian, A., & Martin, P. G. 2013, ApJ, 779, 152, doi: 10.1088/0004-637X/779/2/152
- Hoang & Tram (2020) Hoang, T., & Tram, L. N. 2020, ApJ, 891, 38, doi: 10.3847/1538-4357/ab6eff
- Hoang et al. (2019b) Hoang, T., Tram, L. N., Lee, H., & Ahn, S.-H. 2019b, Nature, 3, 766–775, doi: 10.1038/s41550-019-0763-6
- Hoang & Tung (2019) Hoang, T., & Tung, N.-D. 2019, ApJ, 885, 125, doi: 10.3847/1538-4357/ab4810
- Hönig et al. (2006) Hönig, S. F., Beckert, T., Ohnaka, K., & Weigelt, G. 2006, A&A, 452, 459, doi: 10.1051/0004-6361:20054622
- Hönig & Kishimoto (2010) Hönig, S. F., & Kishimoto, M. 2010, A&A, 523, A27, doi: 10.1051/0004-6361/200912676
- Izumi et al. (2018) Izumi, T., Wada, K., Fukushige, R., Hamamura, S., & Kohno, K. 2018, The Astrophysical Journal, 867, 48, doi: 10.3847/1538-4357/aae20b
- Kataoka et al. (2013) Kataoka, A., Tanaka, H., Okuzumi, S., & Wada, K. 2013, A&A, 557, L4, doi: 10.1051/0004-6361/201322151
- Kimura et al. (2020) Kimura, H., Wada, K., Yoshida, F., et al. 2020, MNRAS, 496, 1667, doi: 10.1093/mnras/staa1641
- Kokubo & Ida (2012) Kokubo, E., & Ida, S. 2012, Progress of Theoretical and Experimental Physics, 2012, 01A308, doi: 10.1093/ptep/pts032
- Krolik & Begelman (1988) Krolik, J. H., & Begelman, M. C. 1988, ApJ, 329, 702, doi: 10.1086/166414
- Laor & Draine (1993) Laor, A., & Draine, B. T. 1993, ApJ, 402, 441, doi: 10.1086/172149
- Lazarian & Hoang (2007) Lazarian, A., & Hoang, T. 2007, MNRAS, 378, 910, doi: 10.1111/j.1365-2966.2007.11817.x
- Lazarian & Hoang (2021) —. 2021, ApJ, 908, 12, doi: 10.3847/1538-4357/abd02c
- Li & Draine (2001) Li, A., & Draine, B. T. 2001, ApJ, 554, 778–802, doi: 10.1086/323147
- Li & Greenberg (1997) Li, A., & Greenberg, J. M. 1997, A&A, 323, 566
- Litwin et al. (2012) Litwin, K. L., Zygielbaum, B. R., Polito, P. J., Sklar, L. S., & Collins, G. C. 2012, Journal of Geophysical Research: Planets, 117, doi: https://doi.org/10.1029/2012JE004101
- Markowitz et al. (2014) Markowitz, A. G., Krumpe, M., & Nikutta, R. 2014, MNRAS, 439, 1403, doi: 10.1093/mnras/stt2492
- Mathis et al. (1983) Mathis, J. S., Mezger, P. G., & Panagia, N. 1983, A&A, 500, 259
- Mathis et al. (1977) Mathis, J. S., Rumpl, W., & Nordsieck, K. H. 1977, Astrophysical Journal, 217, 425 , doi: 10.1086/155591
- Mukai et al. (1992) Mukai, T., Ishimoto, H., Kozasa, T., Blum, J., & Greenberg, J. M. 1992, A&A, 262, 315
- Nenkova et al. (2002) Nenkova, M., Ivezić, Ž., & Elitzur, M. 2002, ApJL, 570, L9, doi: 10.1086/340857
- Nenkova et al. (2008a) Nenkova, M., Sirocky, M. M., Ivezić, Ž., & Elitzur, M. 2008a, ApJ, 685, 147, doi: 10.1086/590482
- Nenkova et al. (2008) Nenkova, M., Sirocky, M. M., Nikutta, R., Ivezić, Ž., & Elitzur, M. 2008, ApJ, 685, 160, doi: 10.1086/590483
- Netzer (2015) Netzer, H. 2015, ARA& A, 53, 365, doi: 10.1146/annurev-astro-082214-122302
- Okuzumi et al. (2009) Okuzumi, S., Tanaka, H., & aki Sakagami, M. 2009, The Astrophysical Journal, 707, 1247, doi: 10.1088/0004-637x/707/2/1247
- Okuzumi et al. (2012) Okuzumi, S., Tanaka, H., Kobayashi, H., & Wada, K. 2012, ApJ, 752, 106, doi: 10.1088/0004-637X/752/2/106
- Schartmann et al. (2008) Schartmann, M., Meisenheimer, K., Camenzind, M., et al. 2008, A&A, 482, 67, doi: 10.1051/0004-6361:20078907
- Schartmann et al. (2014) Schartmann, M., Wada, K., Prieto, M. A., Burkert, A., & Tristram, K. R. W. 2014, Monthly Notices of the Royal Astronomical Society, 445, 3878, doi: 10.1093/mnras/stu2020
- Shakura & Sunyaev (1973) Shakura, N. I., & Sunyaev, R. A. 1973, A&A, 500, 33
- Shen et al. (2008) Shen, Y., Draine, B. T., & Johnson, E. T. 2008, ApJ, 689, 260, doi: 10.1086/592765
- Shi et al. (2006) Shi, Y., Rieke, G. H., Hines, D. C., et al. 2006, ApJ, 653, 127, doi: 10.1086/508737
- Siebenmorgen et al. (2005) Siebenmorgen, R., Haas, M., Krügel, E., & Schulz, B. 2005, A&A, 436, L5, doi: 10.1051/0004-6361:200500109
- Stalevski et al. (2012) Stalevski, M., Fritz, J., Baes, M., Nakos, T., & Popović, L. Č. 2012, MNRAS, 420, 2756, doi: 10.1111/j.1365-2966.2011.19775.x
- Suyama et al. (2012) Suyama, T., Wada, K., Tanaka, H., & Okuzumi, S. 2012, The Astrophysical Journal, 753, 115, doi: 10.1088/0004-637x/753/2/115
- Tatsuuma et al. (2019) Tatsuuma, M., Kataoka, A., & Tanaka, H. 2019, ApJ, 874, 159, doi: 10.3847/1538-4357/ab09f7
- Tazaki et al. (2020) Tazaki, R., Ichikawa, K., & Kokubo, M. 2020, ApJ, 892, 84, doi: 10.3847/1538-4357/ab7822
- Tristram et al. (2009) Tristram, K. R. W., Raban, D., Meisenheimer, K., et al. 2009, A&A, 502, 67, doi: 10.1051/0004-6361/200811607
- Tung & Hoang (2020) Tung, N.-D., & Hoang, T. 2020, ApJ, 901, 6, doi: 10.3847/1538-4357/abacbf
- Urry & Padovani (1995) Urry, C. M., & Padovani, P. 1995, PASP, 107, 803, doi: 10.1086/133630
- Wada et al. (2009) Wada, K., Papadopoulos, P. P., & Spaans, M. 2009, ApJ, 702, 63, doi: 10.1088/0004-637X/702/1/63
- Wada et al. (2016) Wada, K., Schartmann, M., & Meijerink, R. 2016, ApJL, 828, L19, doi: 10.3847/2041-8205/828/2/L19
- Wada et al. (2016) Wada, K., Schartmann, M., & Meijerink, R. 2016, The Astrophysical Journal, 828, L19, doi: 10.3847/2041-8205/828/2/l19
- Wada et al. (2008) Wada, K., Tanaka, H., Suyama, T., Kimura, H., & Yamamoto, T. 2008, ApJ, 677, 1296, doi: 10.1086/529511
- Wada et al. (2019) Wada, K., Tsukamoto, Y., & Kokubo, E. 2019, ApJ, 886, 107, doi: 10.3847/1538-4357/ab4cf0
- Wada et al. (2021) —. 2021, ApJ, 909, 96, doi: 10.3847/1538-4357/abd40a
- Weingartner & Draine (2001) Weingartner, J. C., & Draine, B. T. 2001, ApJ, 548, 296, doi: 10.1086/318651
- Work & Lian (2018) Work, A., & Lian, Y. 2018, Progress in Aerospace Sciences, 98, 1, doi: https://doi.org/10.1016/j.paerosci.2018.03.001