Enhancement of functional properties of V0.6Ti0.4 alloy superconductor by the addition of yttrium
Abstract
We show here that the yttrium is immiscible and precipitates with various sizes in the body centred cubic V0.6Ti0.4 alloy superconductor. The number and size of the precipitates are found to depend on the amount of yttrium added. Precipitates with various sizes up to 30 m are found in the V0.6Ti0.4 alloy containing 5 at.% yttrium. The large amount of line disorders generated by the addition of yttrium in this alloy are found to be effective in pinning the magnetic flux lines. While the superconducting transition temperature increases with the increasing amount of yttrium in the V0.6Ti0.4 alloy, the critical current density is maximum for the alloy containing 2 at. % yttrium, where it is more than 7.5 times the parent alloy in fields higher than 1 T. We found that the effectiveness of each type of defect in pinning the flux lines is dependent on the temperature and the applied magnetic filed.
I Introduction
The V1-xTix alloys are promising materials as an alternate to the Nb based superconductors for high field applications tai2007superconducting ; matin2015critical ; matin2013magnetic ; paul2021grain ; paul21 especially in the neutron radiation environment. ivanov1992structural ; sekula1978effect ; higashiguchi1985microstructure ; weber1982neutron ; audi2003nubase Moreover, the V1-xTix alloys are highly machinable and ductile. tai2007superconducting ; takeuchi2008multifilamentary ; bellin1970critical However, the critical current density (JC) of the V1-xTix alloys is about at 4 K, which is two orders of magnitude less than the commercially available Nb-based superconductors. matin2015critical Previous attempts to increase the of these alloys by the introduction of defects through the addition of transition and non-transition elements were ineffective. efimov1970superconducting Recently, we have shown that the poly-crystalline V1-xTix alloys form with large grains having sizes ranging from few m to few millimetres. matin2015critical ; matin2013magnetic We have established that the low grain boundary density and the presence of flux flow channels in the V1-xTix alloys are the main reasons for the low JC of these alloys. matin2015critical ; matin2013magnetic
The rare-earth elements are found to be immiscible in vanadium and titanium. Immiscible ; komjathy ; yre ; smi88 ; bus77 ; cha10 ; collin59 ; peng2017formation Buschow showed by estimating the energy of formation that no binary compound containing rare earth and titanium or vanadium will form. bus77 The solubility of rare earths in the liquid vanadium or titanium is limited to very low concentrations (< 1 %). yre ; smi88 ; cha10 ; collin59 We have used this property to introduce a large number of pinning centres by adding gadolinium in the V0.6Ti0.4 alloy, which resulted in the enhancement of the JC by about 20 times. paul2021grain However, the gadolinium precipitates order ferromagnetically paul21 , which seem to hinder the attempts to improve the further.
In this direction, here we present a detailed study on the yttrium (non-magnetic) containing V0.6Ti0.4 alloys and establish a correlation between the microstructure and the physical properties in the normal and superconducting states. We show that there is an enhancement of JC of V0.6Ti0.4 by about 7.5 times in fields higher than 1 T when 2 at.% yttrium is added. Our analysis shows how different defects contribute to the enhancement of JC of the (V0.6Ti0.4)-Y alloys at different temperatures and field regimes.
| Name of the Sample | at.% of elements | ||
|---|---|---|---|
| V | Ti | Y | |
| Y0 | 60 | 40 | - |
| Y1 | 59 | 40 | 1 |
| Y2 | 58 | 40 | 2 |
| Y3 | 57 | 40 | 3 |
| Y5 | 55 | 40 | 5 |
II Experimental
A series of samples were synthesized by arc melting paul2021grain ; matin2013magnetic ; matin2014influence the constituent elements (purity better than 99.9%) in 99.999% pure Ar atmosphere. The elemental compositions (in at.%) of the samples are presented in table 1. The samples were cut using diamond saw. The details of metallography experiments can be found elsewhere. matin2015critical ; matin2015high Images of the etched samples were taken using a high power optical microscope (Leica DMI 5000M). The elemental analysis was done using the energy dispersive analysis of x-rays (EDAX) setup attached to the scanning electron microscope (SEM, Carl Zeiss, Germany). X-Ray diffraction (XRD) measurements were performed using = 0.817 Å radiation from the BL12 beamline of the Indus-2 synchrotron facility sin00 . The resistivity and heat capacity of the samples were measured using the 9 T Physical Property Measurement System (PPMS, Quantum Design, USA). For resistivity measurements, the sample sizes were about 8 mm 1 mm 0.5 mm. The magnetization was measured using Superconducting Quantum Interference Device based Vibrating Sample Magnetometer (MPMS-3 SQUID-VSM, Quantum Design, USA). The samples used for heat capacity and magnetization measurements have sizes about 3 mm 1 mm 1 mm.
III Results and Discussion
III.1 Microstructural characterization
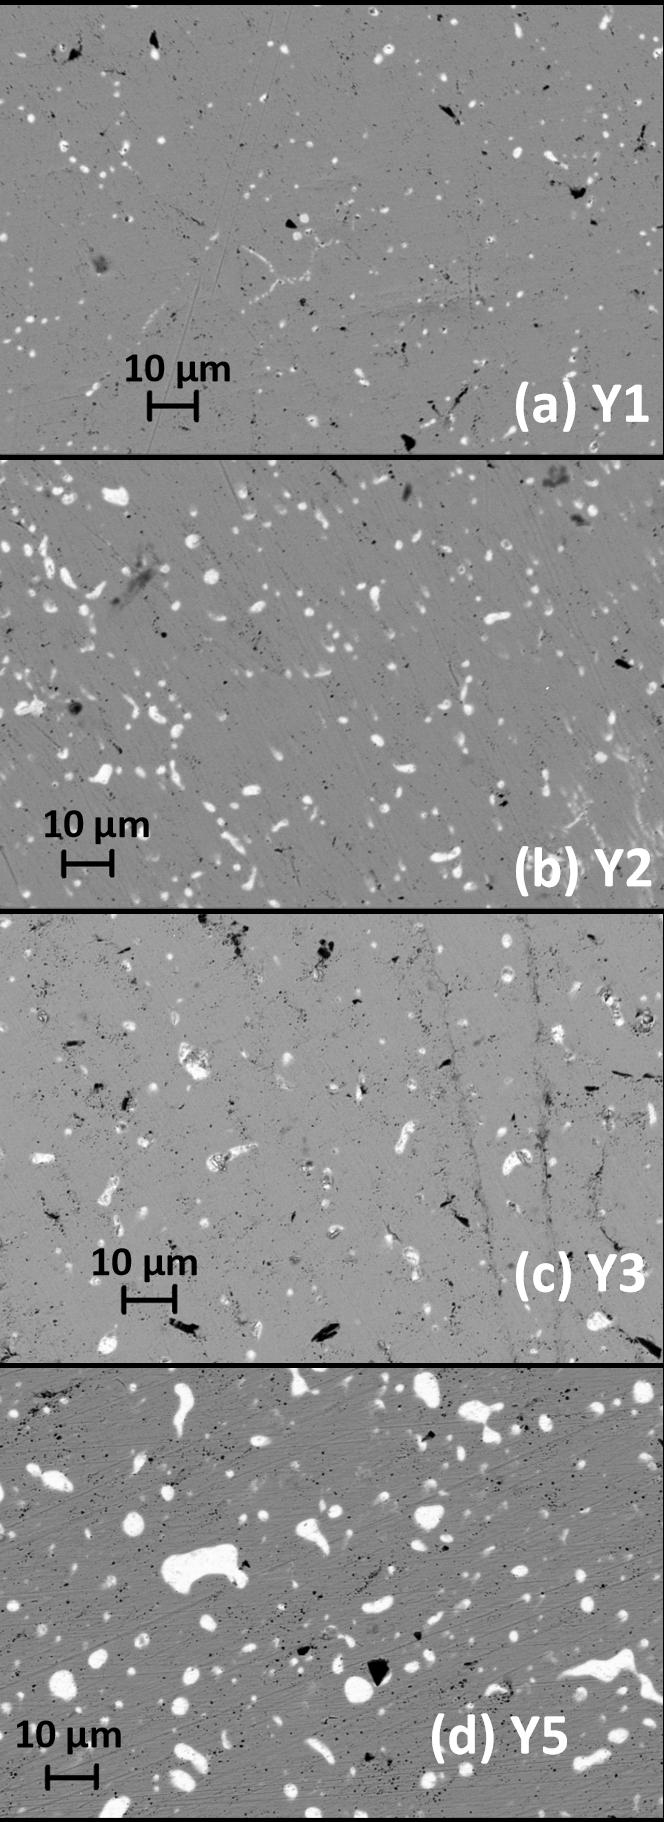
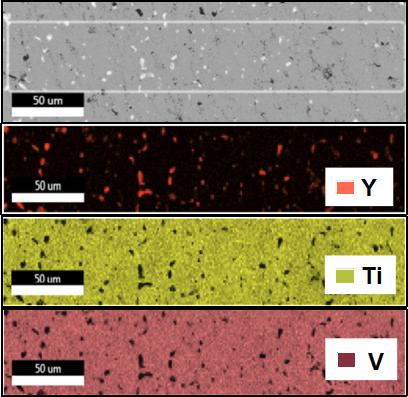
Figure 1 shows the SEM images of the (V0.6Ti0.4)-Y alloys up to 5 at.% of yttrium. These images were taken before etching the samples. Precipitation of secondary phase (white patches) were observed in all the yttrium containing samples. Studies by Love yre as well as by Komjathy and coworkers komjathy on the vanadium-rare earth and titanium-rare earth binaries reveal that the rare earth elements precipitate in the vanadium or titanium matrix. The elemental analysis of a portion of Y3 is shown in Fig. 2. The white precipitates in Fig.1 are rich in yttrium. The titanium and vanadium are uniformly distributed as a matrix. From Fig.1, we see that the precipitation follows certain pattern in the Y1 and Y2 samples. This pattern is partially lost in the Y3 sample, whereas the precipitates are more uniformly distributed in the Y5 sample. The size of the precipitates are presented in table 2. While, the precipitate size in the Y1 and Y2 samples are more or less uniform, there is a distribution of precipitate sizes in the Y3 and Y5 samples. Few precipitates in Y5 are found to be bigger than 30 m in size.
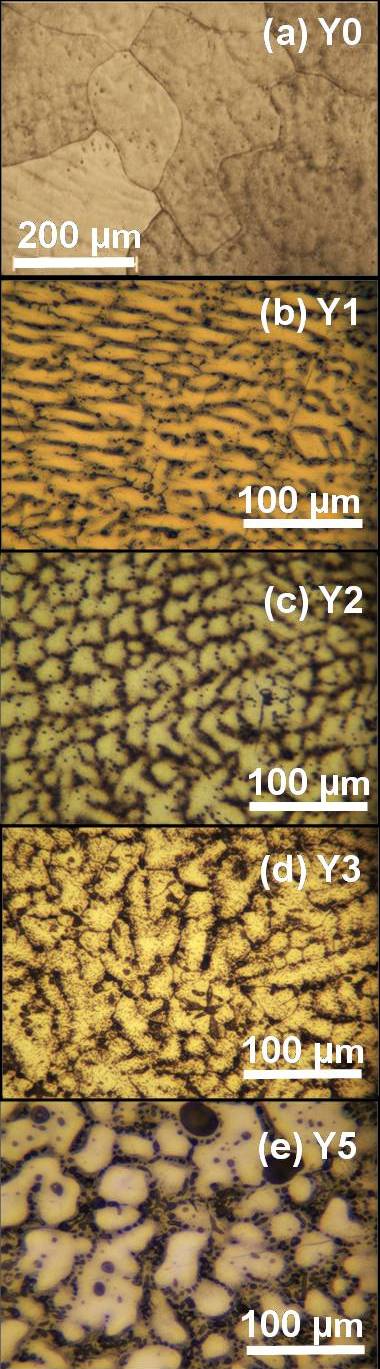
The optical metallography images in Fig. 3 of the (V0.6Ti0.4)-Y alloys reveal the microstructure. These images were taken after etching the polished sample surfaces by a solution containing water, HF and HNO3 in the 98:1:1 volume ratio. Dendritic growth is observed in all the alloys containing yttrium indicating a spacial compositional variation. The grain size of the V0.6Ti0.4 alloy is about 200-300 m. The dendritic cell size in Y1, Y2, Y3 and Y5 are 319, 247, 3210 and 4313 microns respectively. Further studies are required to establish whether these cells are different grains. Nevertheless, thin layers of an alloy which has the lowest melting point, solidifies in between these cells. The cell size reduces initially with increasing yttrium content. This indicates that these yttrium-rich precipitate hinders the cell growth due to the presence of strain field. Thus, there is an enhancement of cell boundary density in the (V0.6Ti0.4)-Y alloys up to 2 at.% yttrium addition and yttrium is precipitated only along the cell boundaries. The cell size is found to increase with further addition of yttrium. The precipitates in these alloys are of larger size and this reduces the number density of precipitates and the strain field in these alloy compositions.
| Sample | Precipitate size |
| (m) | |
| Y1 | 1.30.6 |
| Y2 | 2.31 |
| Y3 | 2.81.8 |
| Y5 | 4.73.3 |
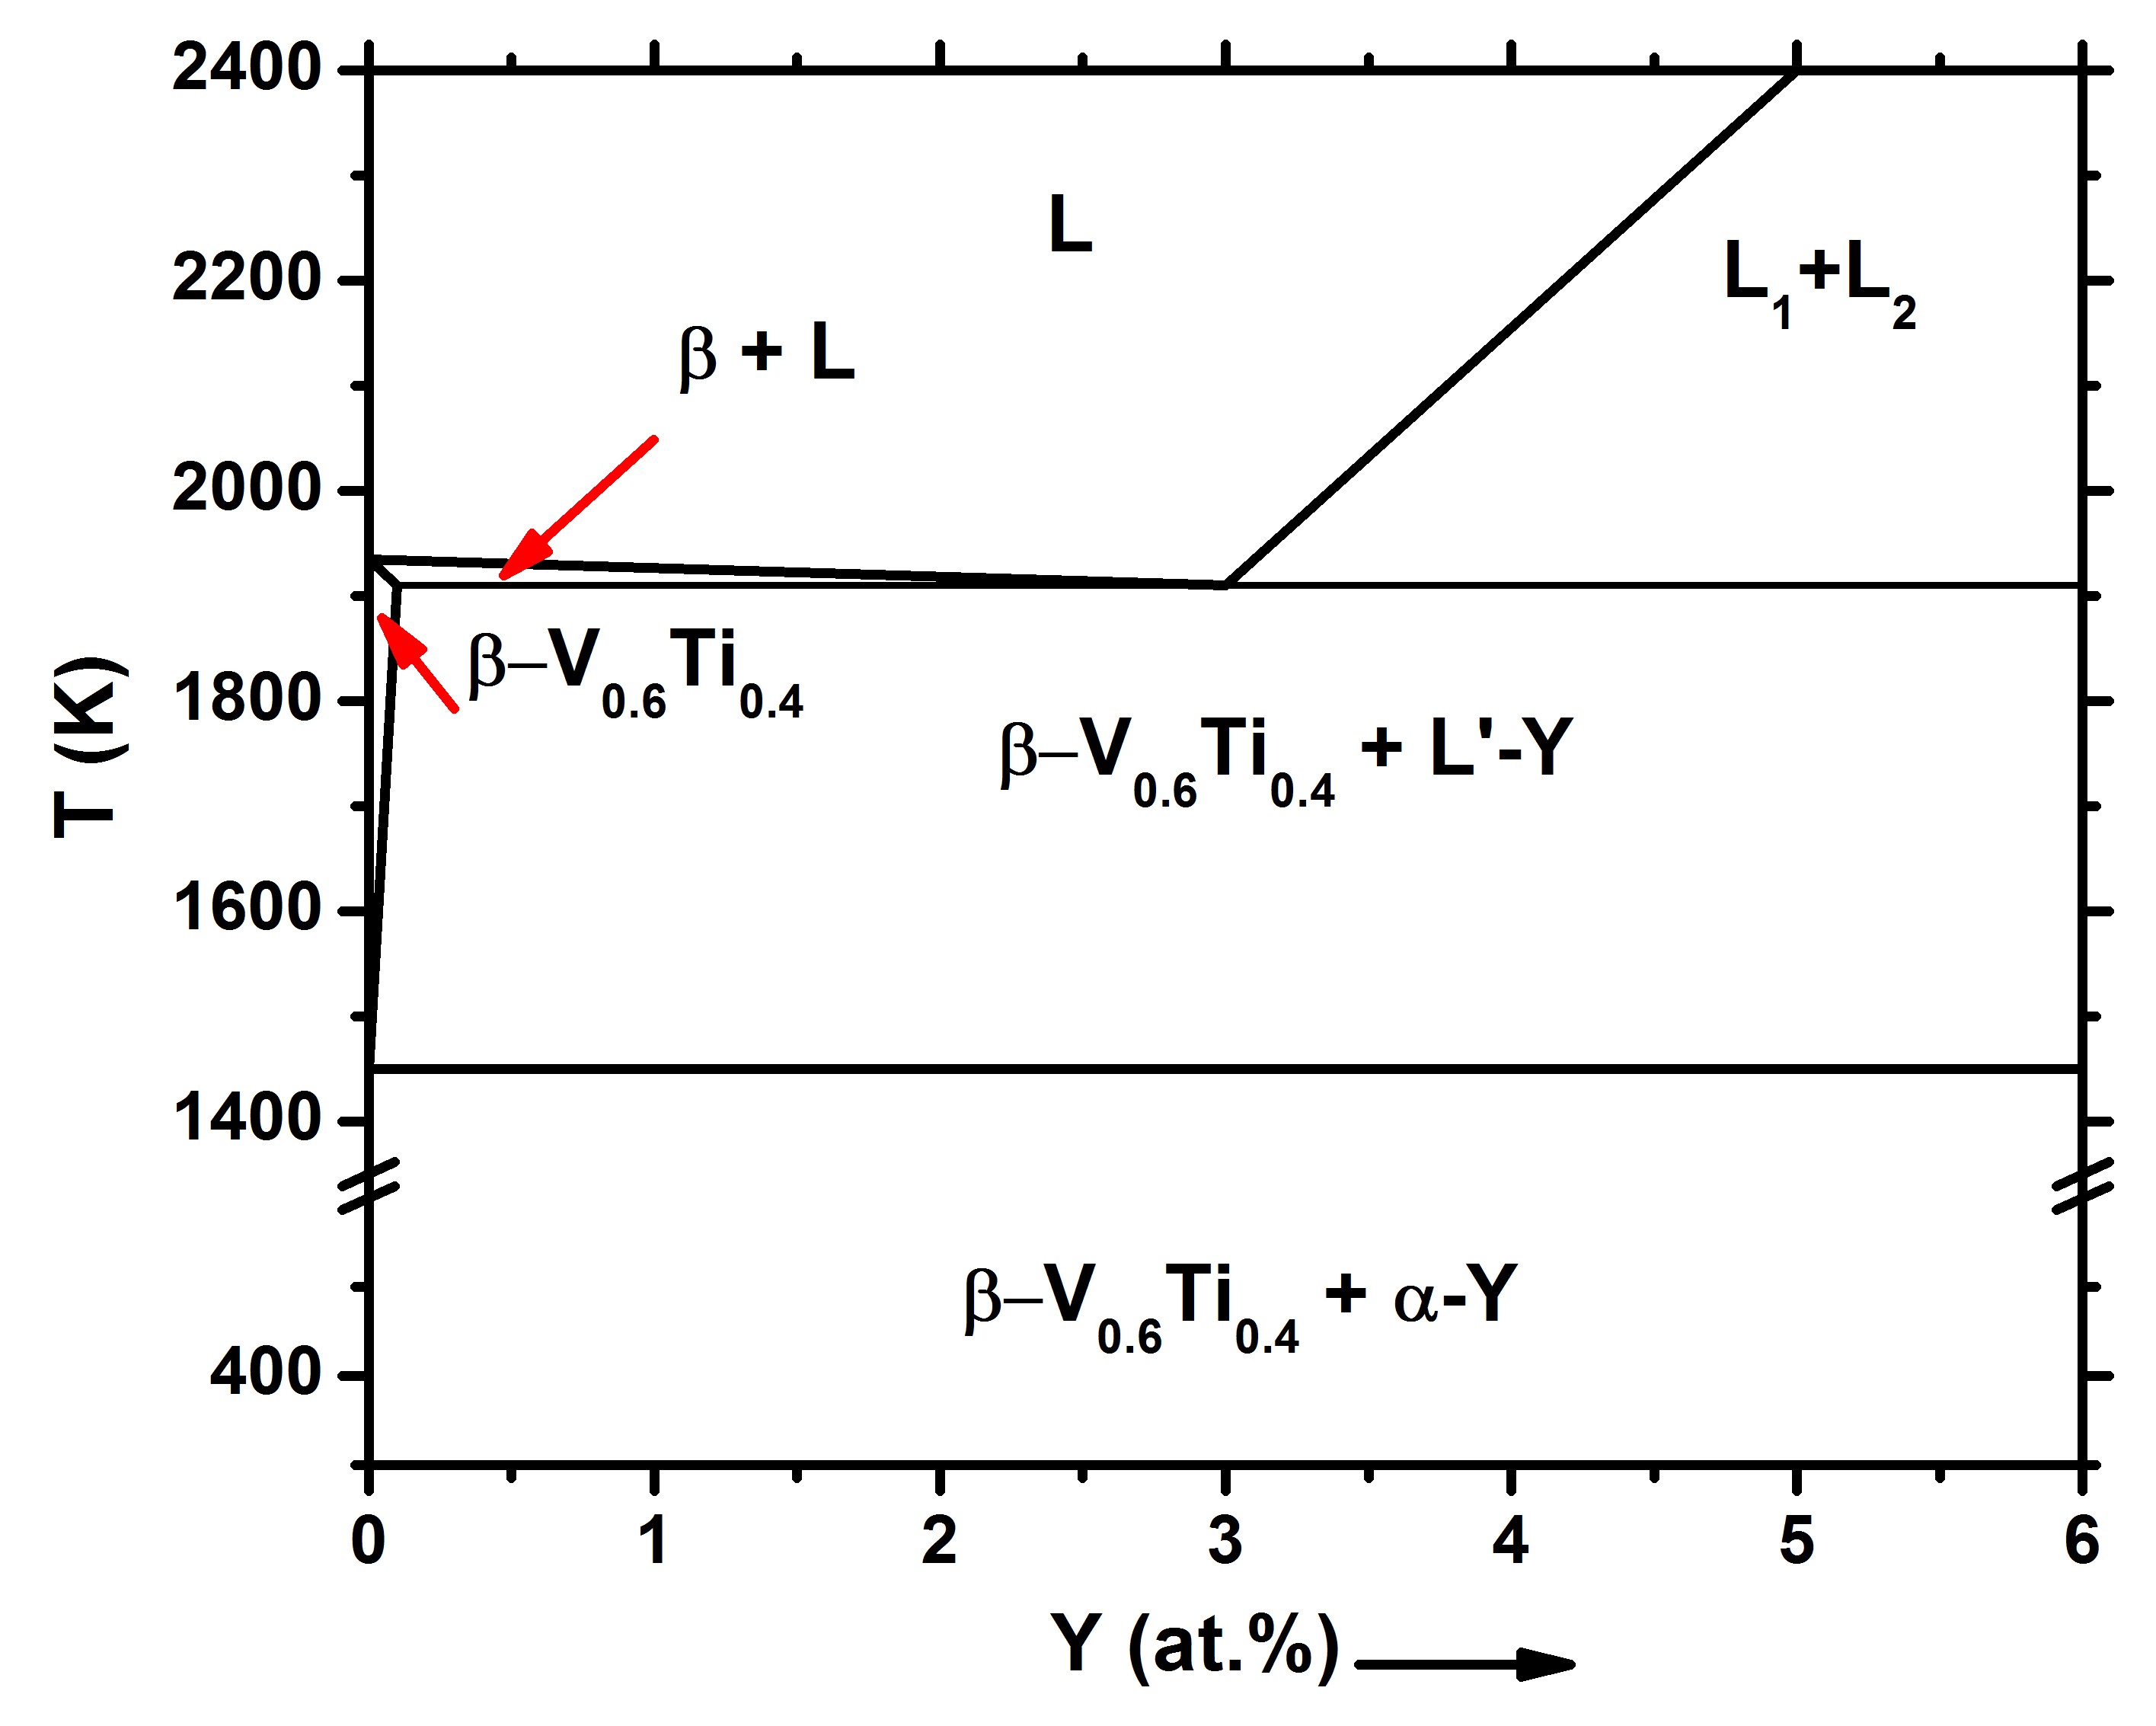
The vanadium alloys containing small amount of yttrium ( 0.5 at.%) undergo monotectic transition at about = 2173 K (1900 0C) from homogeneous liquid above to solid -vanadium phase and a yttrium-rich liquid below . cha10 The enrichment of yttrium in this liquid leads to phase separation of yttrium-rich and vanadium-rich liquids. If the enrichment of yttrium in the yttrium-rich liquid reaches 96 at.%, an eutectic transition at about 1730 K ( 1460 0C) occurs within this phase. cha10 On the other hand, the titanium alloys containing small amount of yttrium ( 20 at.%) undergoes eutectic transition at about = 1673 K (1400 0C). sav62 The melting point () of yttrium is about 1793 K (1520 0C). cha10
The V0.6Ti0.4 alloy has a of about 1933 K (1660 0C) and the -phase (body centred cubic) is stabilized below . melting point Our metallography results match closely with those of the V-Y alloys indicating that the phase diagram of the (V0.6Ti0.4)-Y alloys must be similar to the V-Y phase diagram. On comparing the literature available on the vanadium/titanium-rare earth binary phase diagrams yre ; komjathy and our experimental observations, we present a schematic phase diagram for the dilute (V0.6Ti0.4)-Y alloys in Fig. 4.
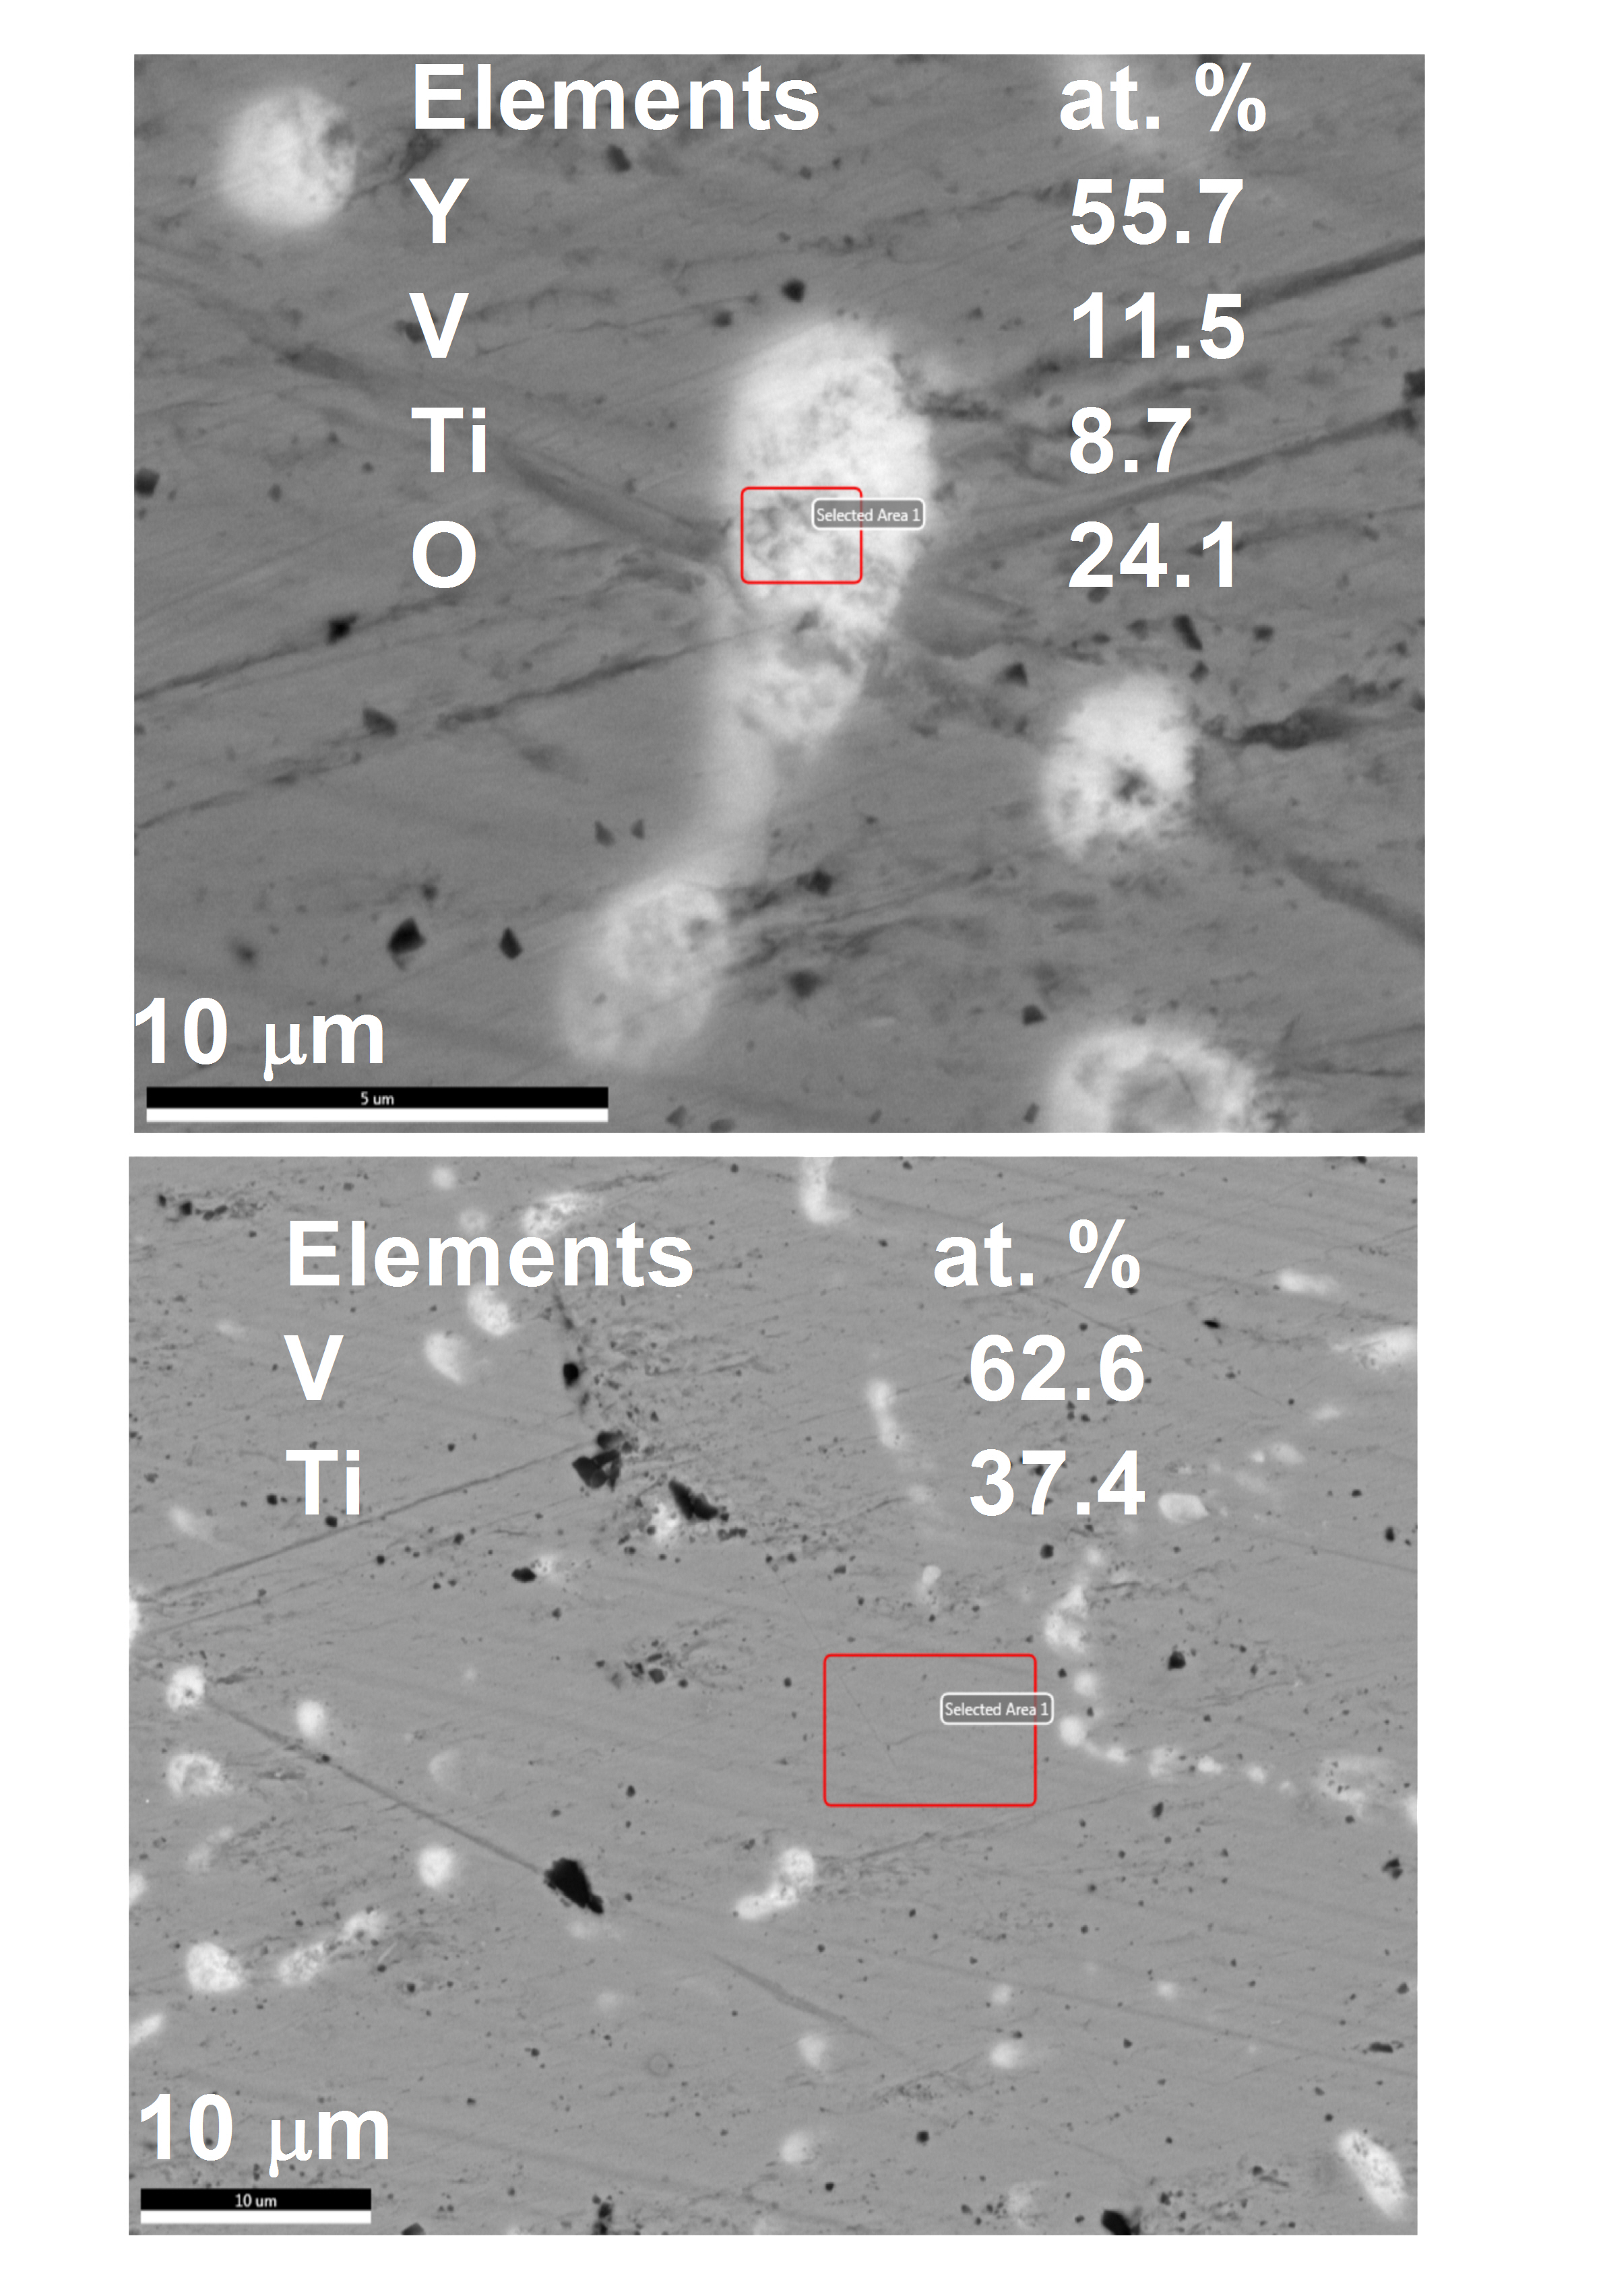
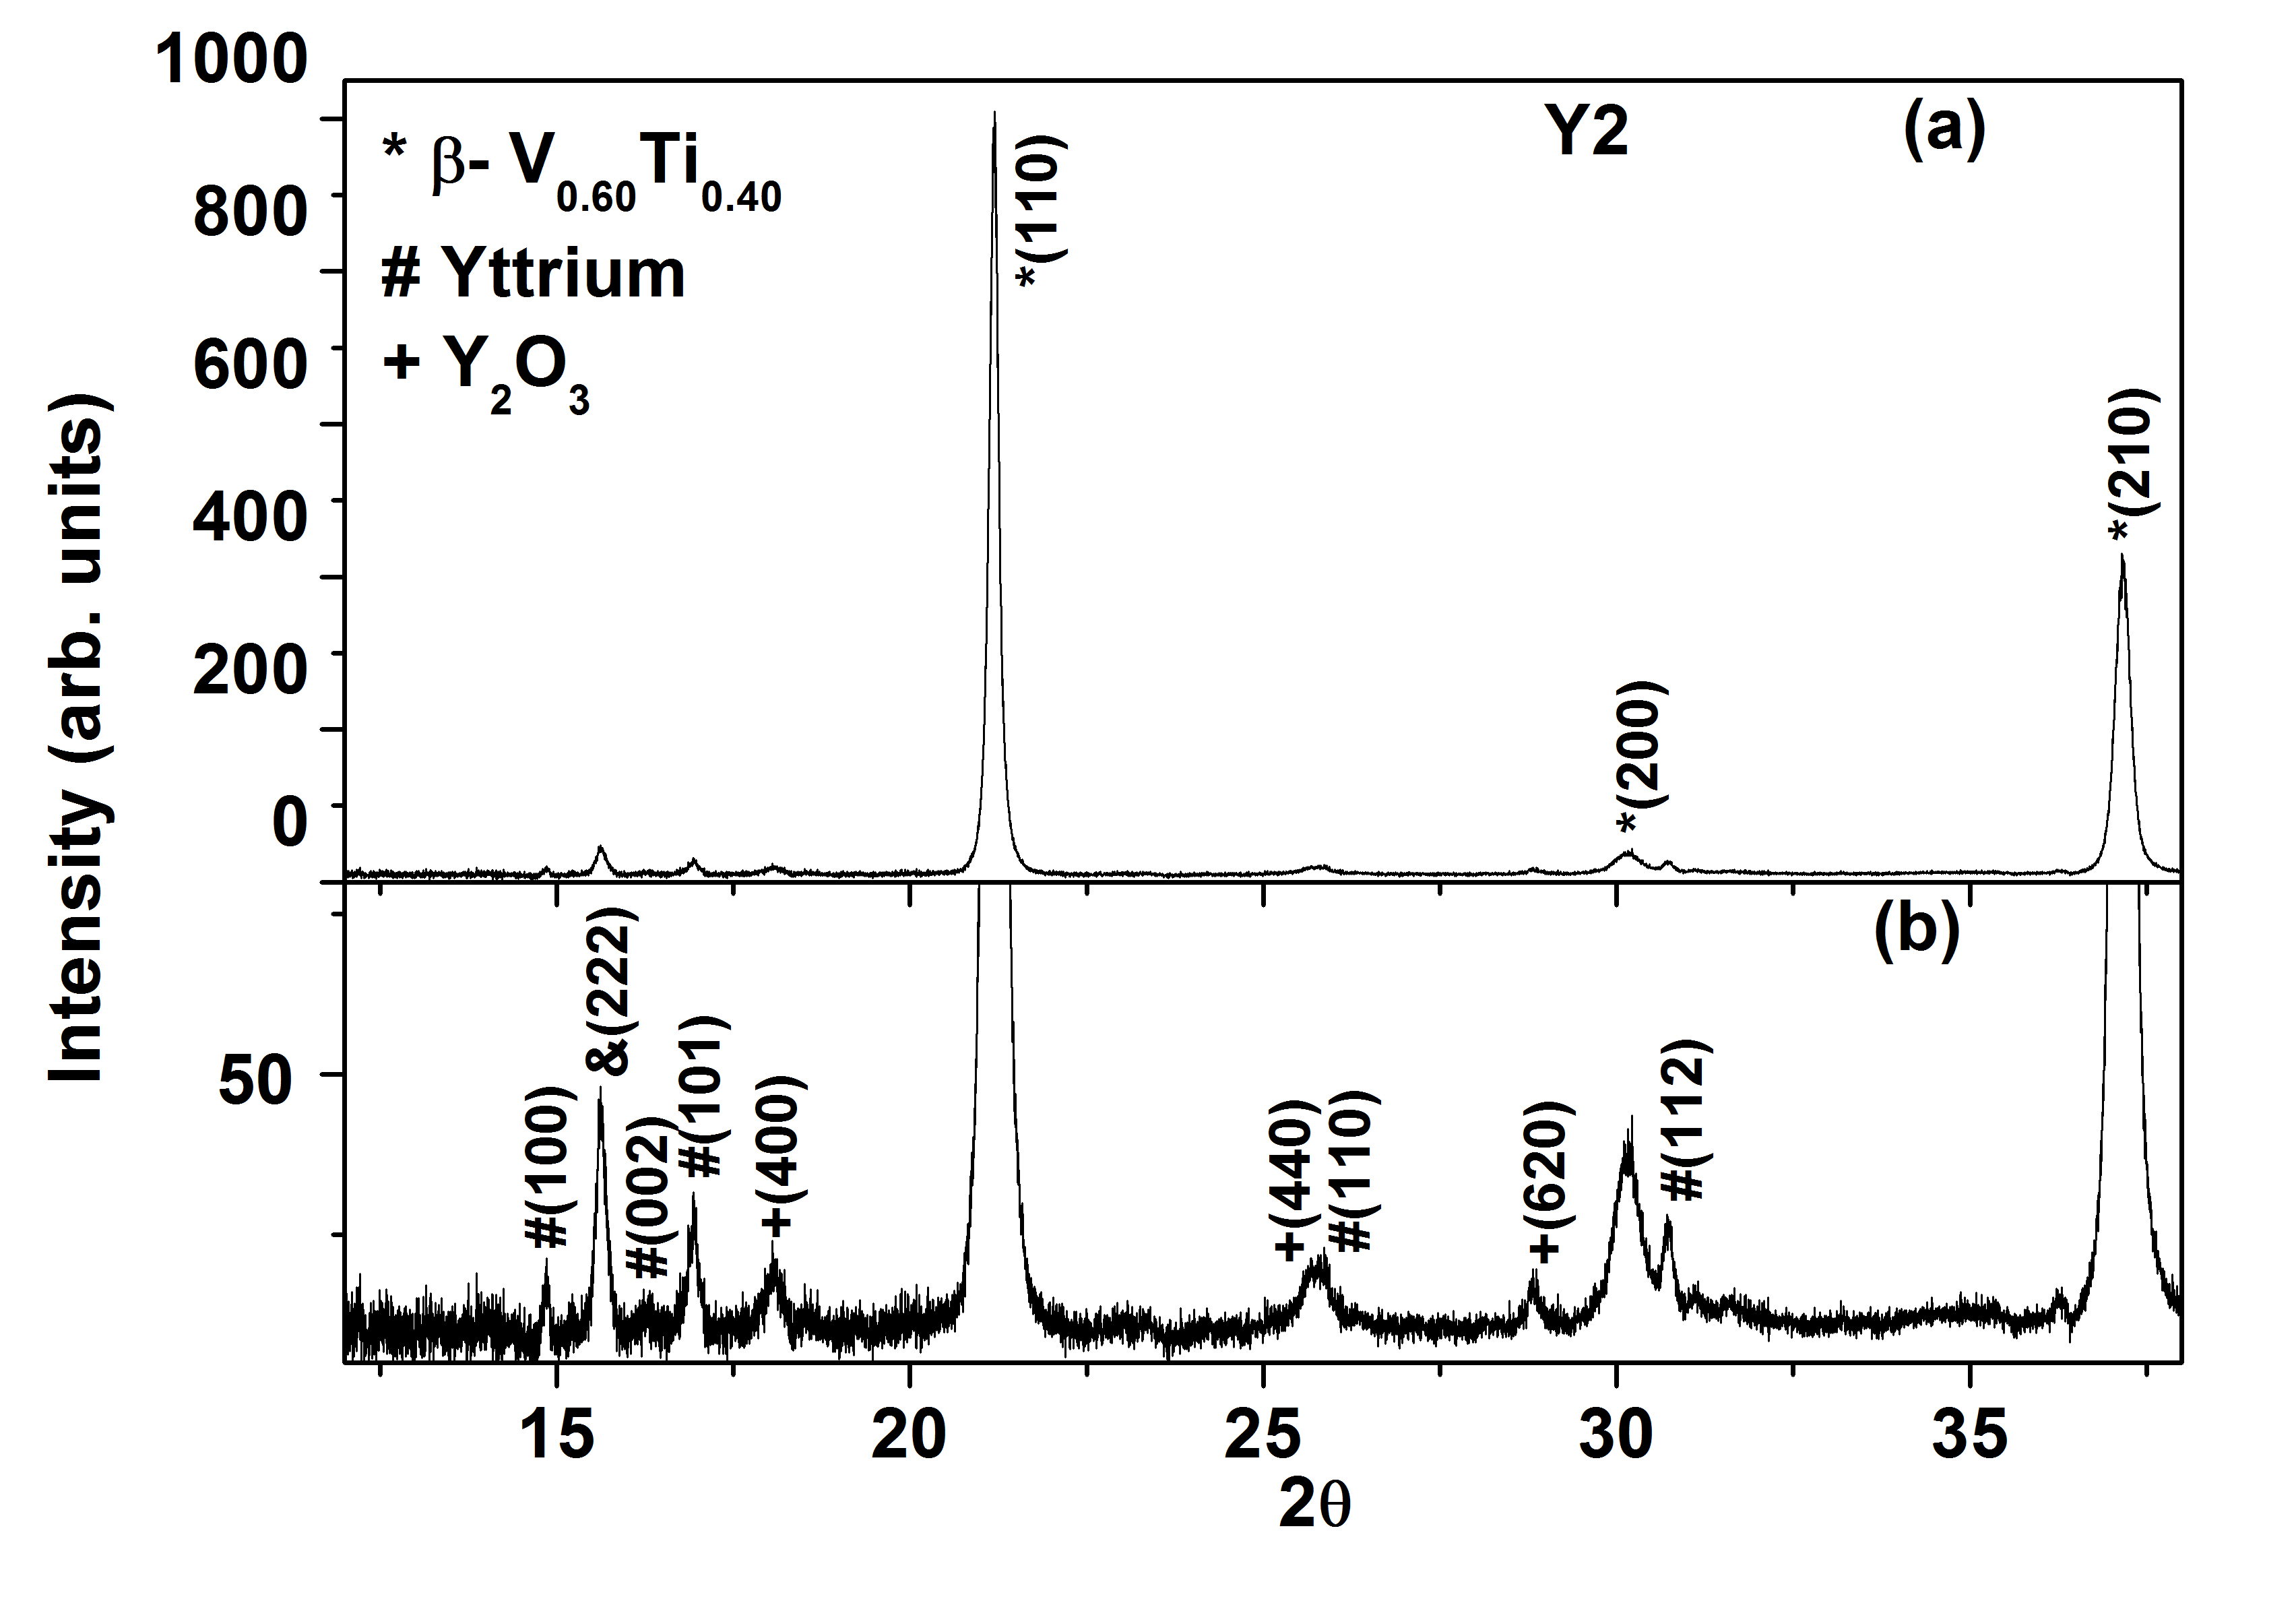
The small size of the precipitates in the alloys containing 3 at.% or less yttrium indicates that these alloys, while cooling from the melt undergo monotectic transition from the homogeneous V-Ti-Y liquid to solid -V-Ti alloy and a yttrium-rich liquid. Figure 5 shows the typical compositions of the precipitates and matrix of the Y2 alloy. The composition of the matrix is about V0.626Ti0.374 with a minor local variation of the composition. The oxygen content within a precipitate varies substantially among the precipitates. We found that higher the oxygen content, higher is the amount of titanium and vanadium present in the precipitate. In the cases where oxygen is absent in the precipitates, the composition is close to 95 at. % of yttrium. This indicates that eutectic microstructure may be present within the yttrium-rich precipitates. cha10 In order to get a clear picture of the different phases present in the samples, we show in Fig. 6, the x-ray diffraction (XRD) pattern of the Y2 alloy. The symbols ’’, ’’ and ’+’ represent reflections from the -V0.60Ti0.40, yttrium precipitates and Y2O3 phases respectively. The lattice parameter of -V0.60Ti0.40 is about 3.1412 Å while that of Y2O3 is about 10.4 Å. The lattice parameters of the yttrium precipitates are about = 3.647 Å and = 5.728 Å. The lattice parameters of -V0.60Ti0.40 and yttrium precipitates are in agreement with literature. spe56 ; paul21 On the other hand, the lattice parameter of Y2O3 is slightly less than that of bulk which may be due to oxygen off-stiochiometry. han84 Thus, the reduction of the cell size in these compositions is related to the formation of fine yttrium-rich precipitates during the phase separation of the homogeneous liquid into solid -V0.6Ti0.4 and L′-Y phases (Fig. 4). On the other hand, a two phase microstructure seen in between the large V-Ti cells in the Y5 sample (Fig.3.(e)) is caused by the liquid immiscibility.
Earlier, we have shown that the V1-xTix alloys have large grain sizes of the the order of few microns to few millimetres. Our microstructural studies reveal that the yttrium can introduce large amount of defects in the V1-xTix alloys which is helpful in improving the critical current density in the mixed state of these superconducting alloys. Therefore, we characterize the present alloys in the superconducting as well as normal states.
III.2 Electrical and thermal properties of the (V0.6Ti0.4)-Y alloys and the superconducting transition temperature ()
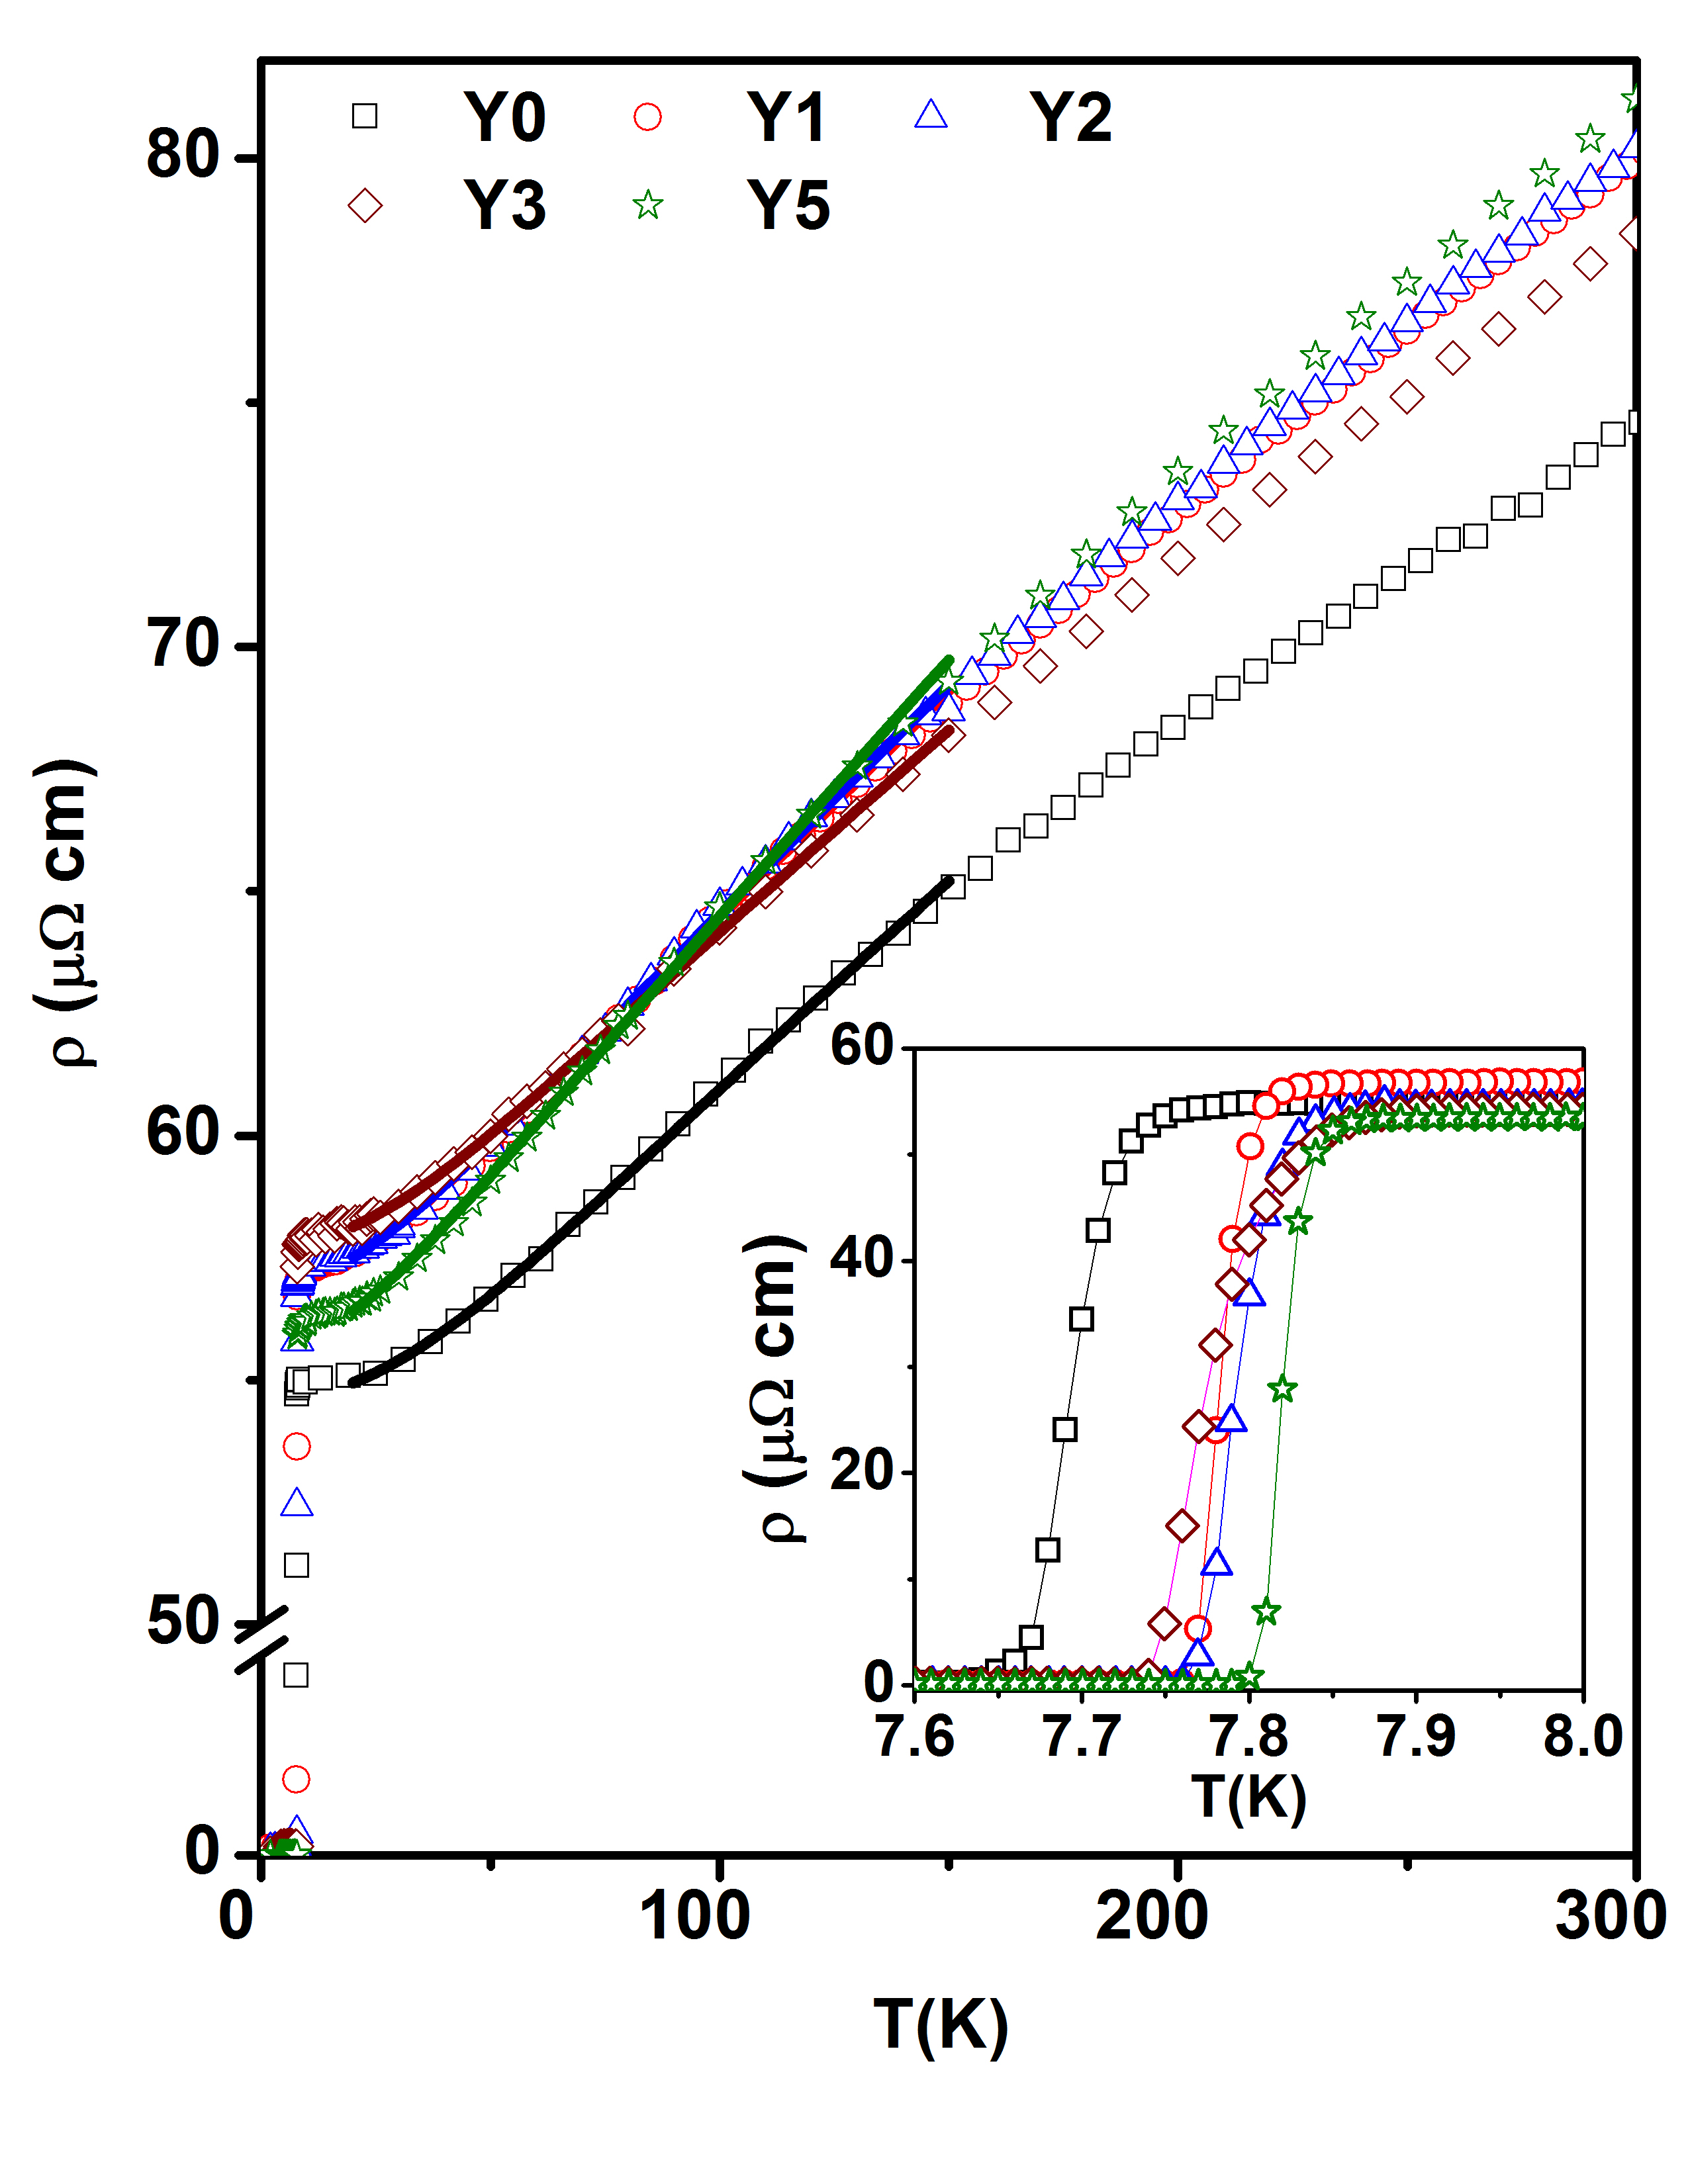
Figure 7 shows the temperature dependence of electrical resistivity (()) of the (V0.6Ti0.4)-Y alloys in the range 2-300 K. The yttrium containing alloys have higher () in comparison with that of the parent V0.6Ti0.4 alloy. Residual resistivity () increases up to 3 at.% yttrium due to the increased static defects (precipitates, grain/cell boundaries, dislocations and point defects). The reduced number density of defects in the Y5 alloy due to the larger size of the precipitates results in the lower as compared to the other yttrium containing alloys. The inset to Fig. 7 shows the expanded view of resistivity around the TC. The TC is obtained as that temperature at which the temperature derivative of resistivity shows a peak. The TC increases from 7.68 K for the V0.6Ti0.4 alloy to 7.85 K for the Y5 sample.
Normally, the is expected to decrease with increasing disorder. aoki1967non ; aoki1969non However, the increase in the in the present alloys can be due to (i) suppression of spin fluctuations by the disorder, matin2014influence ; stritzker1979superconductivity ; bose1990effect (ii) increase in the electron-phonon coupling due to phonon softening by the defects, shy15 and/or (iii) removal of the trace oxygen by yttrium from the V-Ti matrix. peng2017formation ; collin59
The TC of the V1-yTiy alloys is limited by the spin fluctuations matin2014influence and increases from 5.4 K for = 0 to about 7.68 K for the = 0.4 alloy. We have argued that the suppression of spin fluctuation by the disorder introduced when vanadium is alloyed with titanium increases the of the V1-yTiy alloys. matin2014influence Palladium is also found to be superconducting when certain type of disorder is introduced to suppress the spin fluctuations. stritzker1979superconductivity ; bose1990effect Thus, the increase in the TC of the yttrium containing alloys can be attributed to the suppression of spin fluctuations with increase in disorder. However, this should result in the reduction of the normal state (), paul21 which is contrary to the observed result that the yttrium containing alloys have higher normal state () as compared to the parent V0.6Ti0.4 alloy. The normal state () in the range 20-120 K is fitted using the equationrice67 ; shy15 :
| (1) | |||||
where is residual resistivity, is the coefficient of resistivity for spin-fluctuation, is the coefficient of resistivity corresponding to interband scattering, is the spin fluctuation temperature, is the Debye temperature and () is the Fermi-integral given by
| (2) |
The fitting is shown in Fig. 7 and coefficients obtained by the fitting are presented in the table 3. The errors in the estimation of parameters are within 10%. We found that increases with increasing yttrium content. The large and small for Y3 and Y5 alloys indicate a negligible contribution from the interband scattering to resistivity in these alloys. The also increases with yttrium content up to 3 at. %. Therefore, the enhancement of in the yttrium containing alloys is not due to the suppression of spin fluctuations.
| Sample | |||||
|---|---|---|---|---|---|
| ( cm) | ( cm) | ( cm) | (K) | (K) | |
| Y0 | 54.6 | 9.1 | 25.8 | 196 | 300 |
| Y1 | 56.9 | 18.0 | 14.0 | 198 | 366 |
| Y2 | 56.9 | 19.6 | 12.3 | 204 | 382 |
| Y3 | 57.7 | 30.4 | 3.4 | 308 | 561 |
| Y5 | 55.7 | 26.1 | 7.9 | 217 | 433 |
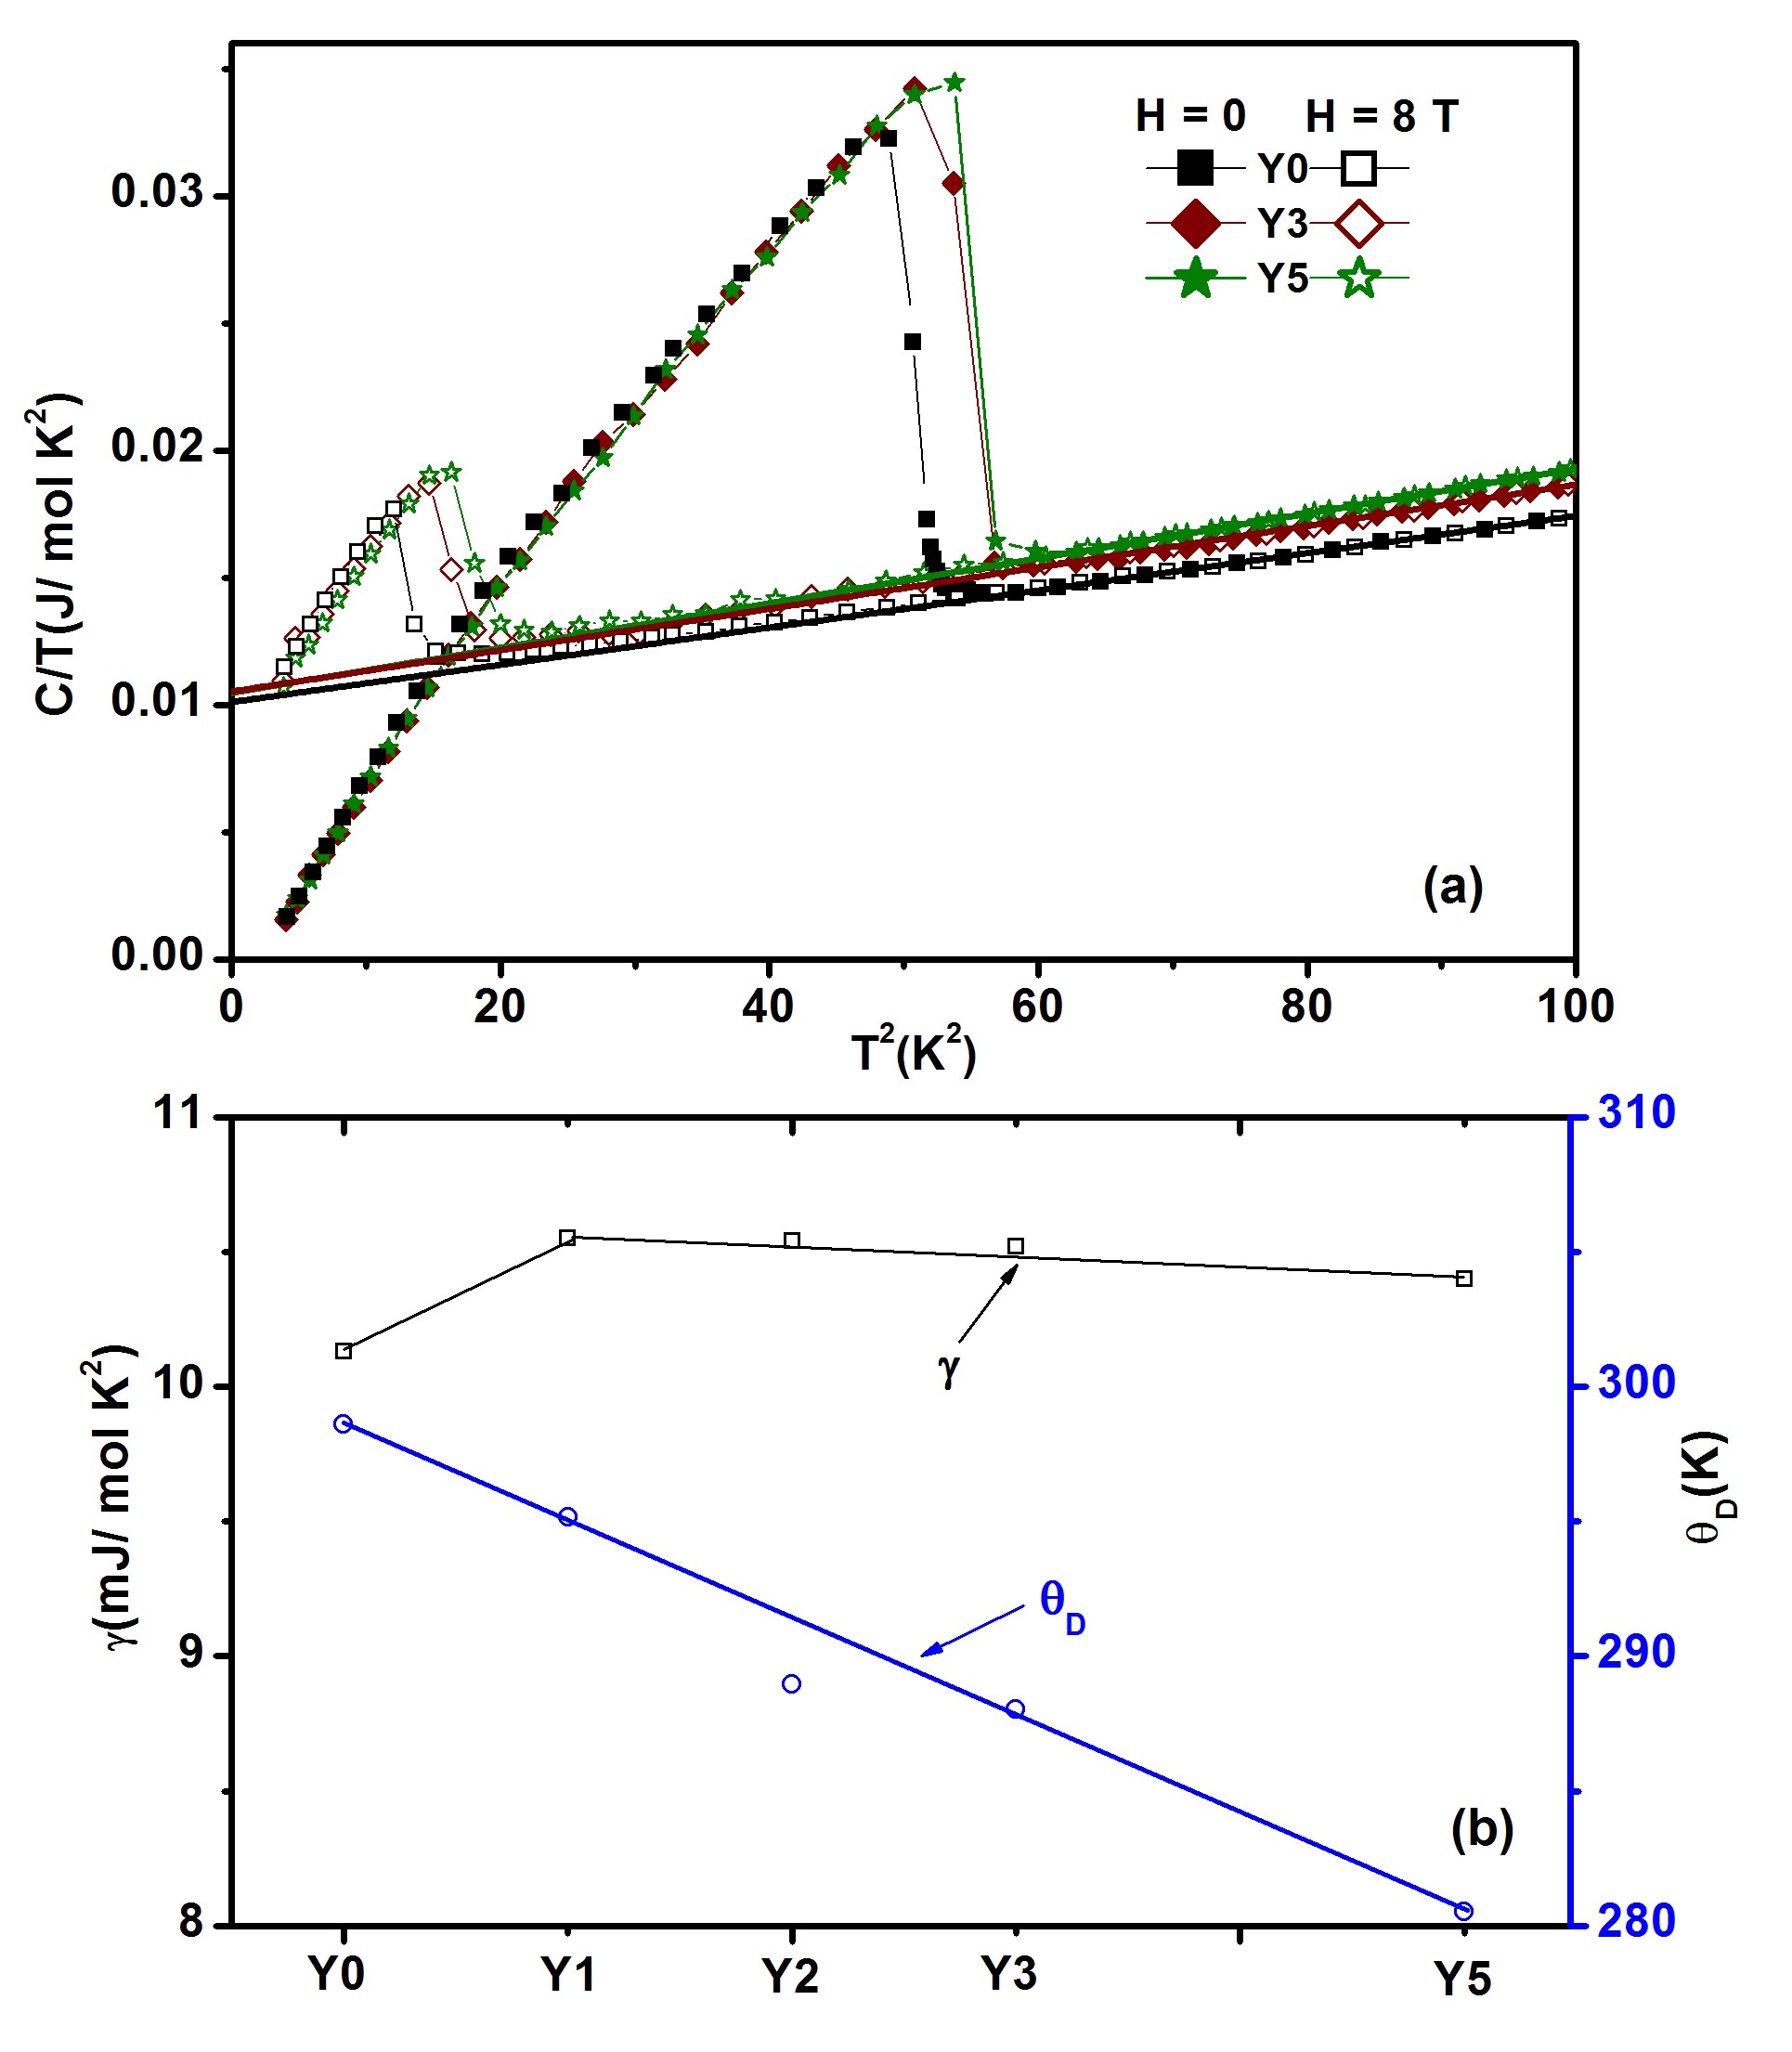
The higher () with a different curvature for the yttrium containing alloys as compared to that of the parent V0.6Ti0.4 alloy hints at the enhancement of electron-phonon coupling due to the softening of phonon modes by disorder. To verify the correlation between the and phonon softening, we have measured the heat capacity of the yttrium containing alloys in zero and 8 T fields (Fig. 8(a)). The normal state v/s data in 8 T in the range 5-10 K is used to fit a straight line to obtain the Sommerfeld coefficient of electronic heat capacity () and the Debye temperature () using the relation where . matin2014influence The maximum change in the , (Fig. 8(b)) and with the yttrium content are about 6.5%, 4%, and 2.3% respectively. Since, change in is quite smaller in comparison with the other two variables, it is unlikely that the enhancement of the is due to changes in the electron-phonon coupling by the addition of yttrium.
The of vanadium is about 5.4 K. tcv The presence of oxygen suppresses the of vanadium. wexler1952superconductivity It is well known that the addition of 0.5-2 at.% yttrium in titanium or vanadium improves the ductility. collin59 This improvement is caused by the scavenger effect of yttrium in removing oxygen from the grain boundaries of vanadium and titanium. collin59 Therefore, we infer that the addition of yttrium to the V1-xTix alloys improves the by removing oxygen from the matrix. Our studies on the (V0.6Ti0.4)50Y50 alloy showed that the superconductivity is induced in yttrium-rich phase by the proximity effect ram21hfpme . Therefore, we infer that the region of yttrium-rich precipitates where the oxygen is absent become superconducting below due to proximity effect and the boundaries between the precipitates and the matrix can act as effective pinning centres.
III.3 Magnetic properties of the (V0.6Ti0.4)-Y alloys: Role of microstructure on the enhancement of critical current density
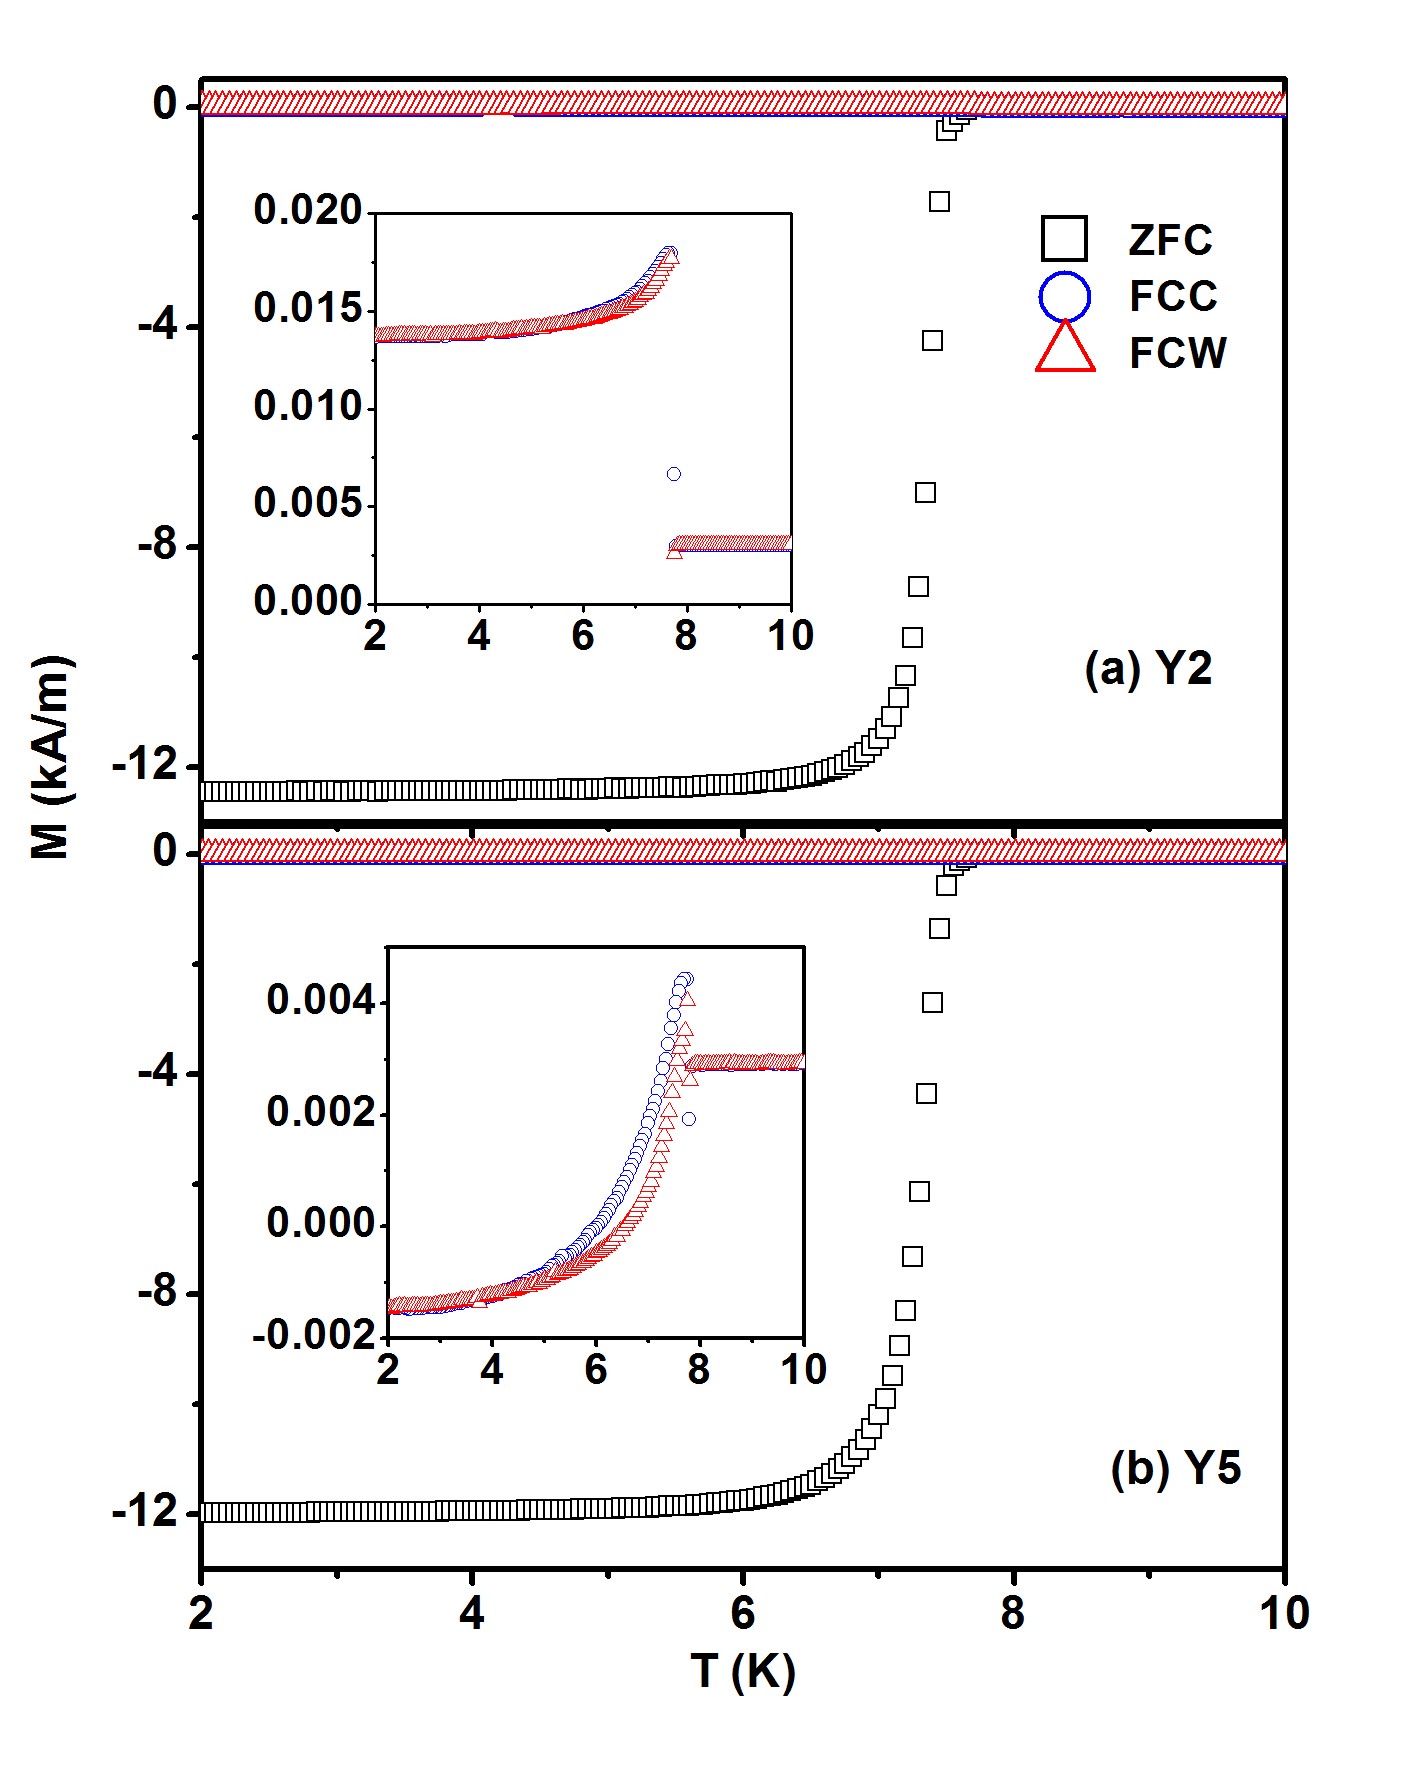
The temperature dependence of magnetization (()) of the Y2 and Y5 alloys are shown in Fig. 9. The () is measured in the presence of 10 mT field while warming up after cooling down the sample from to 2 K in zero field (ZFC), while cooling down in the same field after warming above (FCC), and then again while warming up in the same field (FCW). The TC is estimated as that temperature at which the () starts to decrease towards negative values when the temperature is decreased from 10 K. The TC estimated from () is in agreement with that estimated from the resistivity measurements. The insets to the Fig. 9 show the expanded view of () measured during FCC and FCW cycles. The Meissner fraction () is estimated as the ratio / at 2 K. The is about 0.095% for the V0.6Ti0.4 alloy which decreases with increasing amount of yttrium in this alloy. The / is about 0.032% for the Y3 alloy indicating that the magnetic flux line pinning improves when yttrium is added to the V0.6Ti0.4 alloy. This indicates that the yttrium containing alloys have higher than the parent V0.6Ti0.4 alloy.
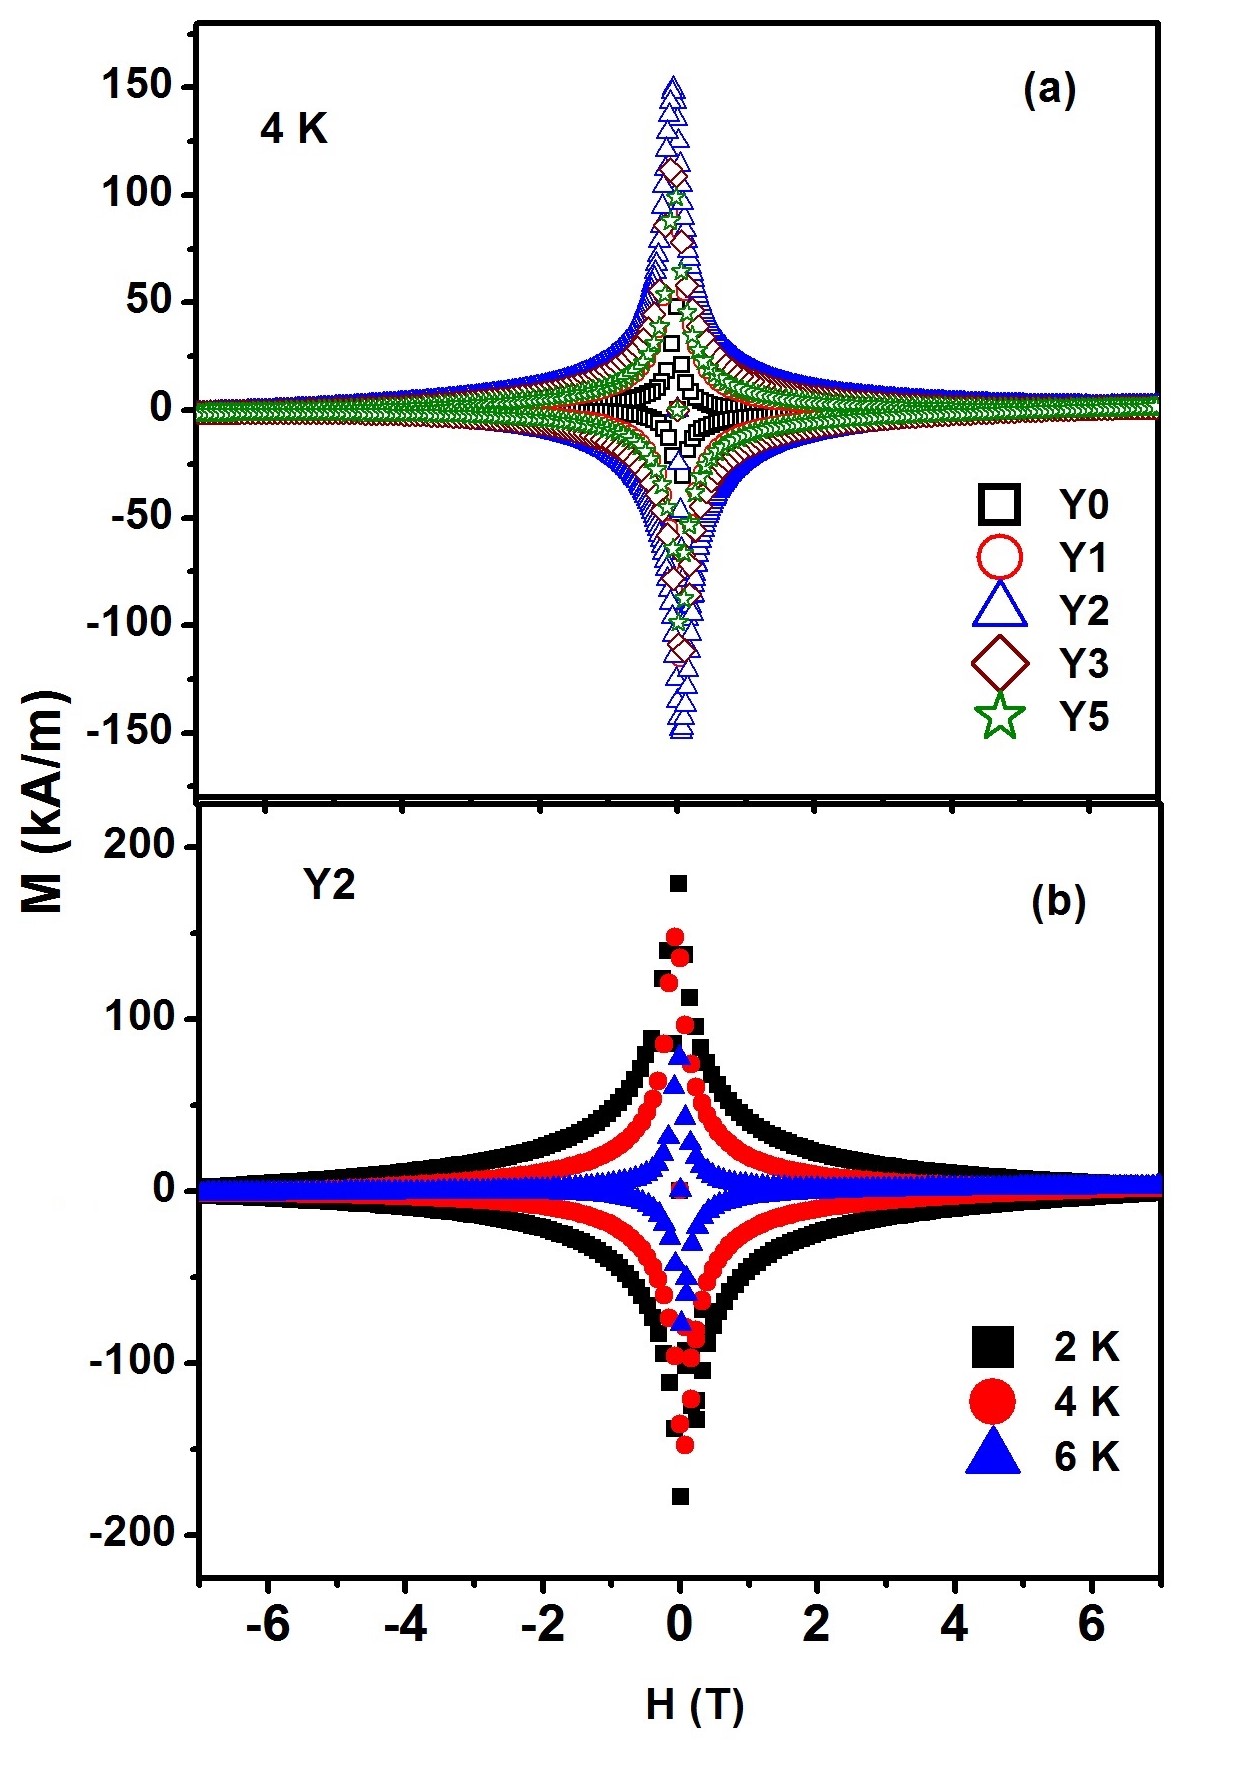
In order to quantify the the enhancement of in the yttrium containing alloys, we have measured the field dependence of magnetisation (()) for all the alloys at different temperatures. The Fig. 10(a) shows the () at 4 K for all the alloys. The size of the hysteresis increases with increasing yttrium content in the V0.6Ti0.4 alloy up to 2 at.%, and then it starts shrinking. Figure 10(b) shows the () of the Y2 alloy at different temperatures. The hysteresis in the () is symmetric along the axis indicating that the Bean-Livingston surface barrier effect bean1964surface is negligible in Y2 alloy. The upper critical field () and magnetic irreversibility field () at various temperatures below are estimated from the isothermal magnetisation curves. The magnetic field at which () deviates from its behaviour in the normal state is taken as the . The magnetic field at which the () for increasing bifurcates from that during the decreasing cycle is taken as the .
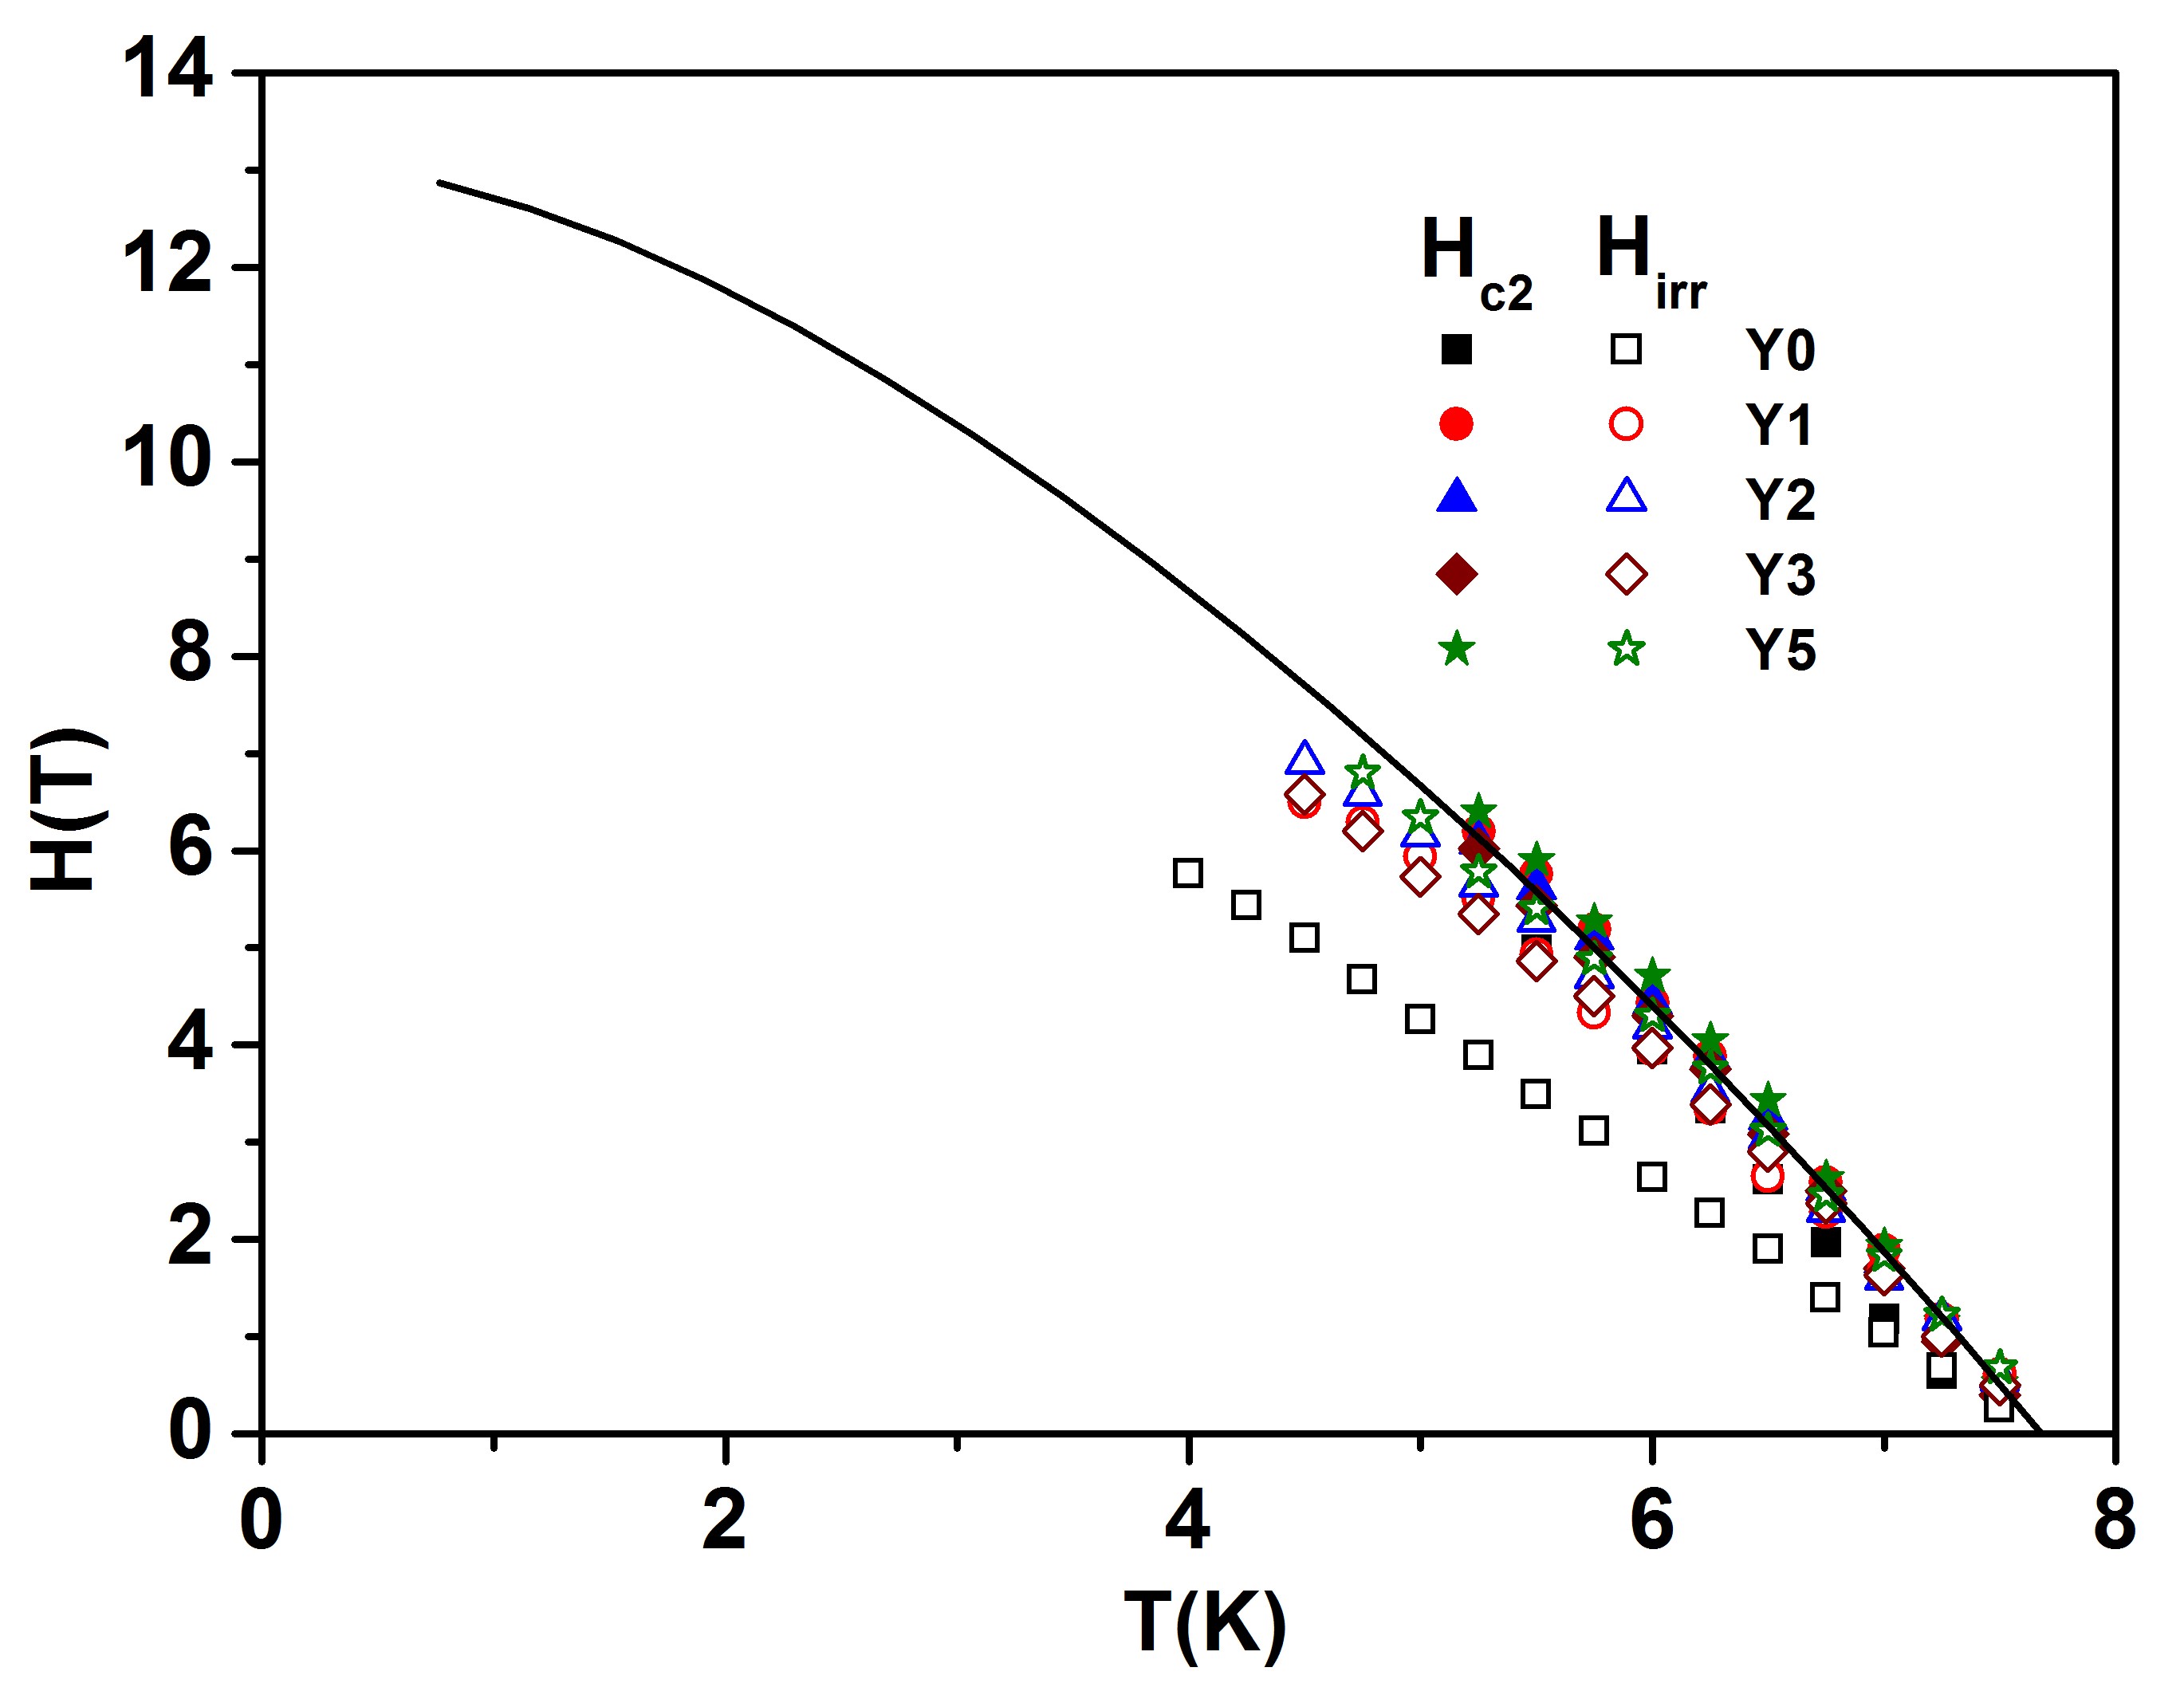
The and as a function of temperature for all the alloys are plotted in Fig. 11. The () is almost the same for all the yttrium containing alloys and . Addition of yttrium to V0.6Ti0.4 alloy increases the . The solid line in Fig. 11 represents the fit to the () using the Werthamer-Helfand-Hohenberg (WHH) formalism for dirty limit superconductors. werthamer1966temperature From the fitting, the parameters (corresponding to the Pauli paramagnetic effect) and (which is the measure of strength of spin-orbit interaction) are found to 1.49 and 2.5 respectively. The HC2 in the limit of absolute zero (H) is found to be about 13.2 T which is comparable to the Nb-Ti alloys. poo00
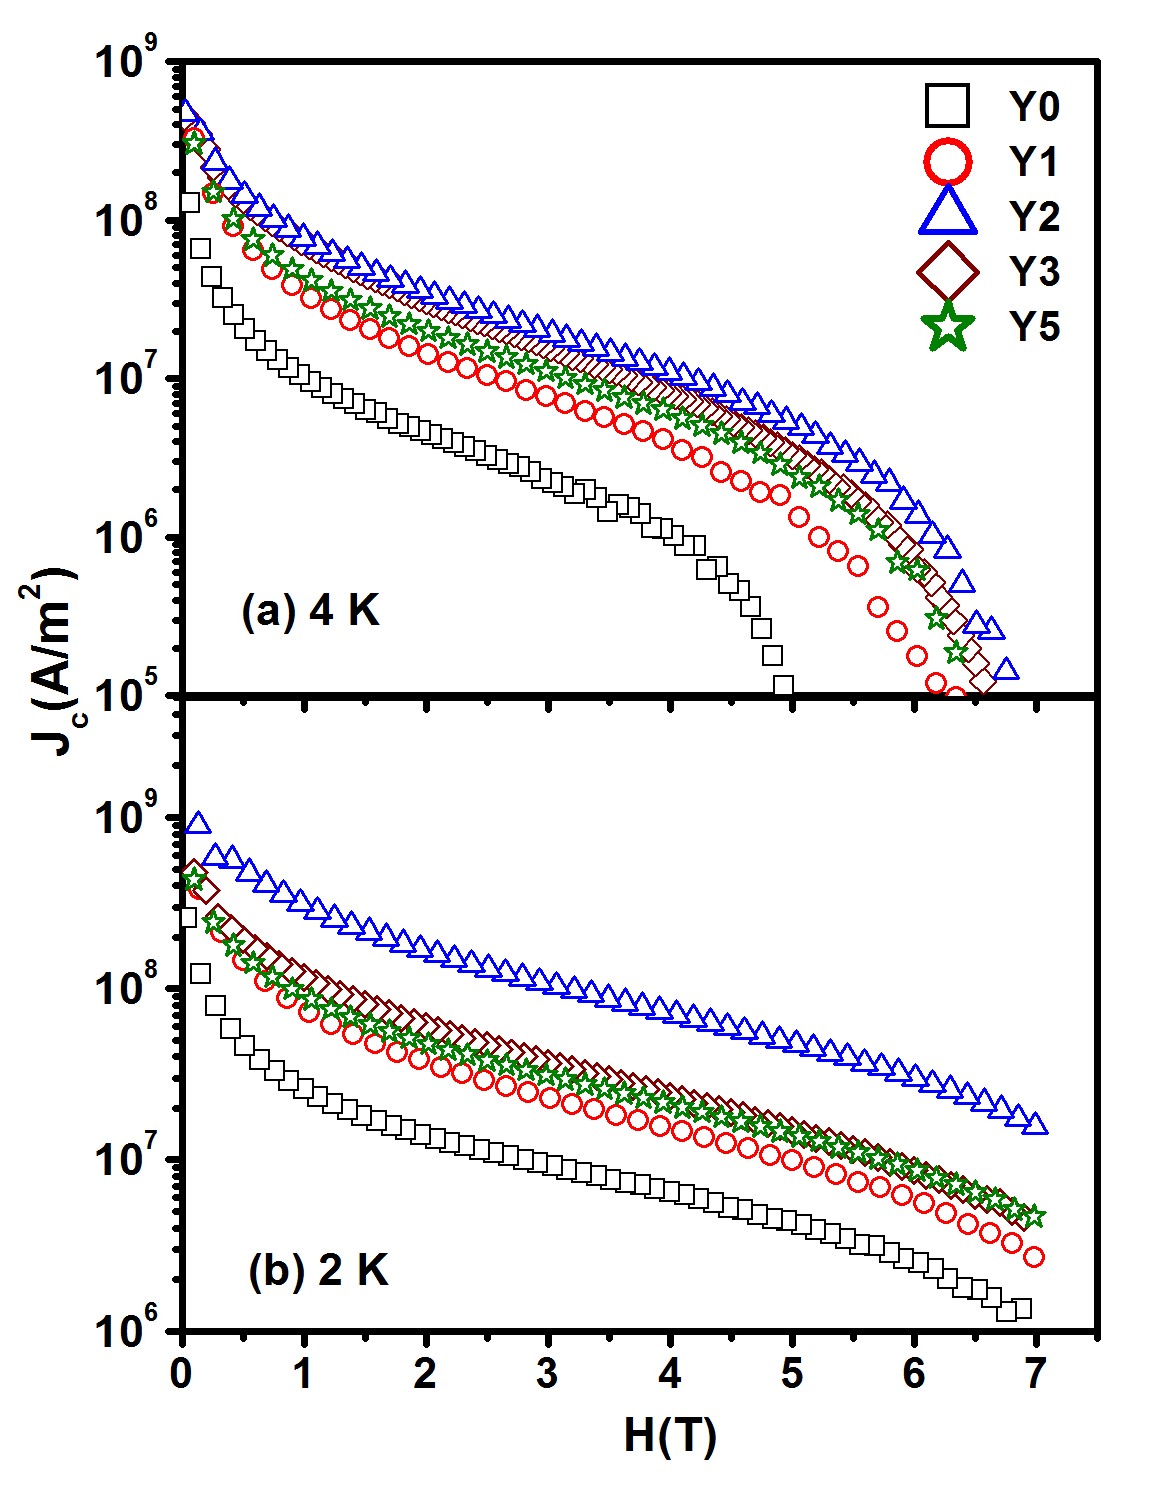
The critical current density (JC) of the (V0.6Ti0.4)-Y alloys estimated from the () is shown in Fig.12. The JC is estimated using the Bean’s critical state model as zheng1995reversible ; martinez2007flux ; sundar2015magnetic ; bean1964magnetization
| (3) |
Here, the at every , is the difference between the measured during increasing and decreasing cycles. The parameters a and b () are the dimensions of the rectangular cross section of the sample in the direction normal to the applied magnetic field.
The zero field JC value at 2 K for the V0.6Ti0.4 alloy is estimated to be A/m2, which is in close agreement with the literature. matin2015critical The JC increases significantly with the addition of yttrium up to 2 at.%, and then it decreases with further addition. The Y2 alloy has a JC of at 4 K and 1 T field, which is an order of magnitude higher than that of the V0.6Ti0.4 alloy. The drop in JC with the application of low magnetic fields is found to be less steep for all the yttrium containing alloys in comparison with the parent V0.6Ti0.4 alloy. The of the parent V0.6Ti0.4 alloy exists only up to 5 T at 4 K. On the other hand, the yttrium containing alloys have significant above 5 T at 4 K. The value of as well as the range over which a significant is present increase with the increasing yttrium content up to 2 at.%. The at 2 K (Fig.12) exceeds 2107 Am-2 at 7 T for the Y2 alloy. The increase in the defects when yttrium is added to the V0.6Ti0.4 alloy (section 3.1) results in the enhancement of flux line pinning, which in turn increases the . Though the enhancement of by adding yttrium in V0.6Ti0.4 alloy is significant, the is still considerably lower than that of commercial Nb-Ti alloys sha19 ; end73 ; che91 ; bou06 ; miy06 ; lin15 ; mou17 .
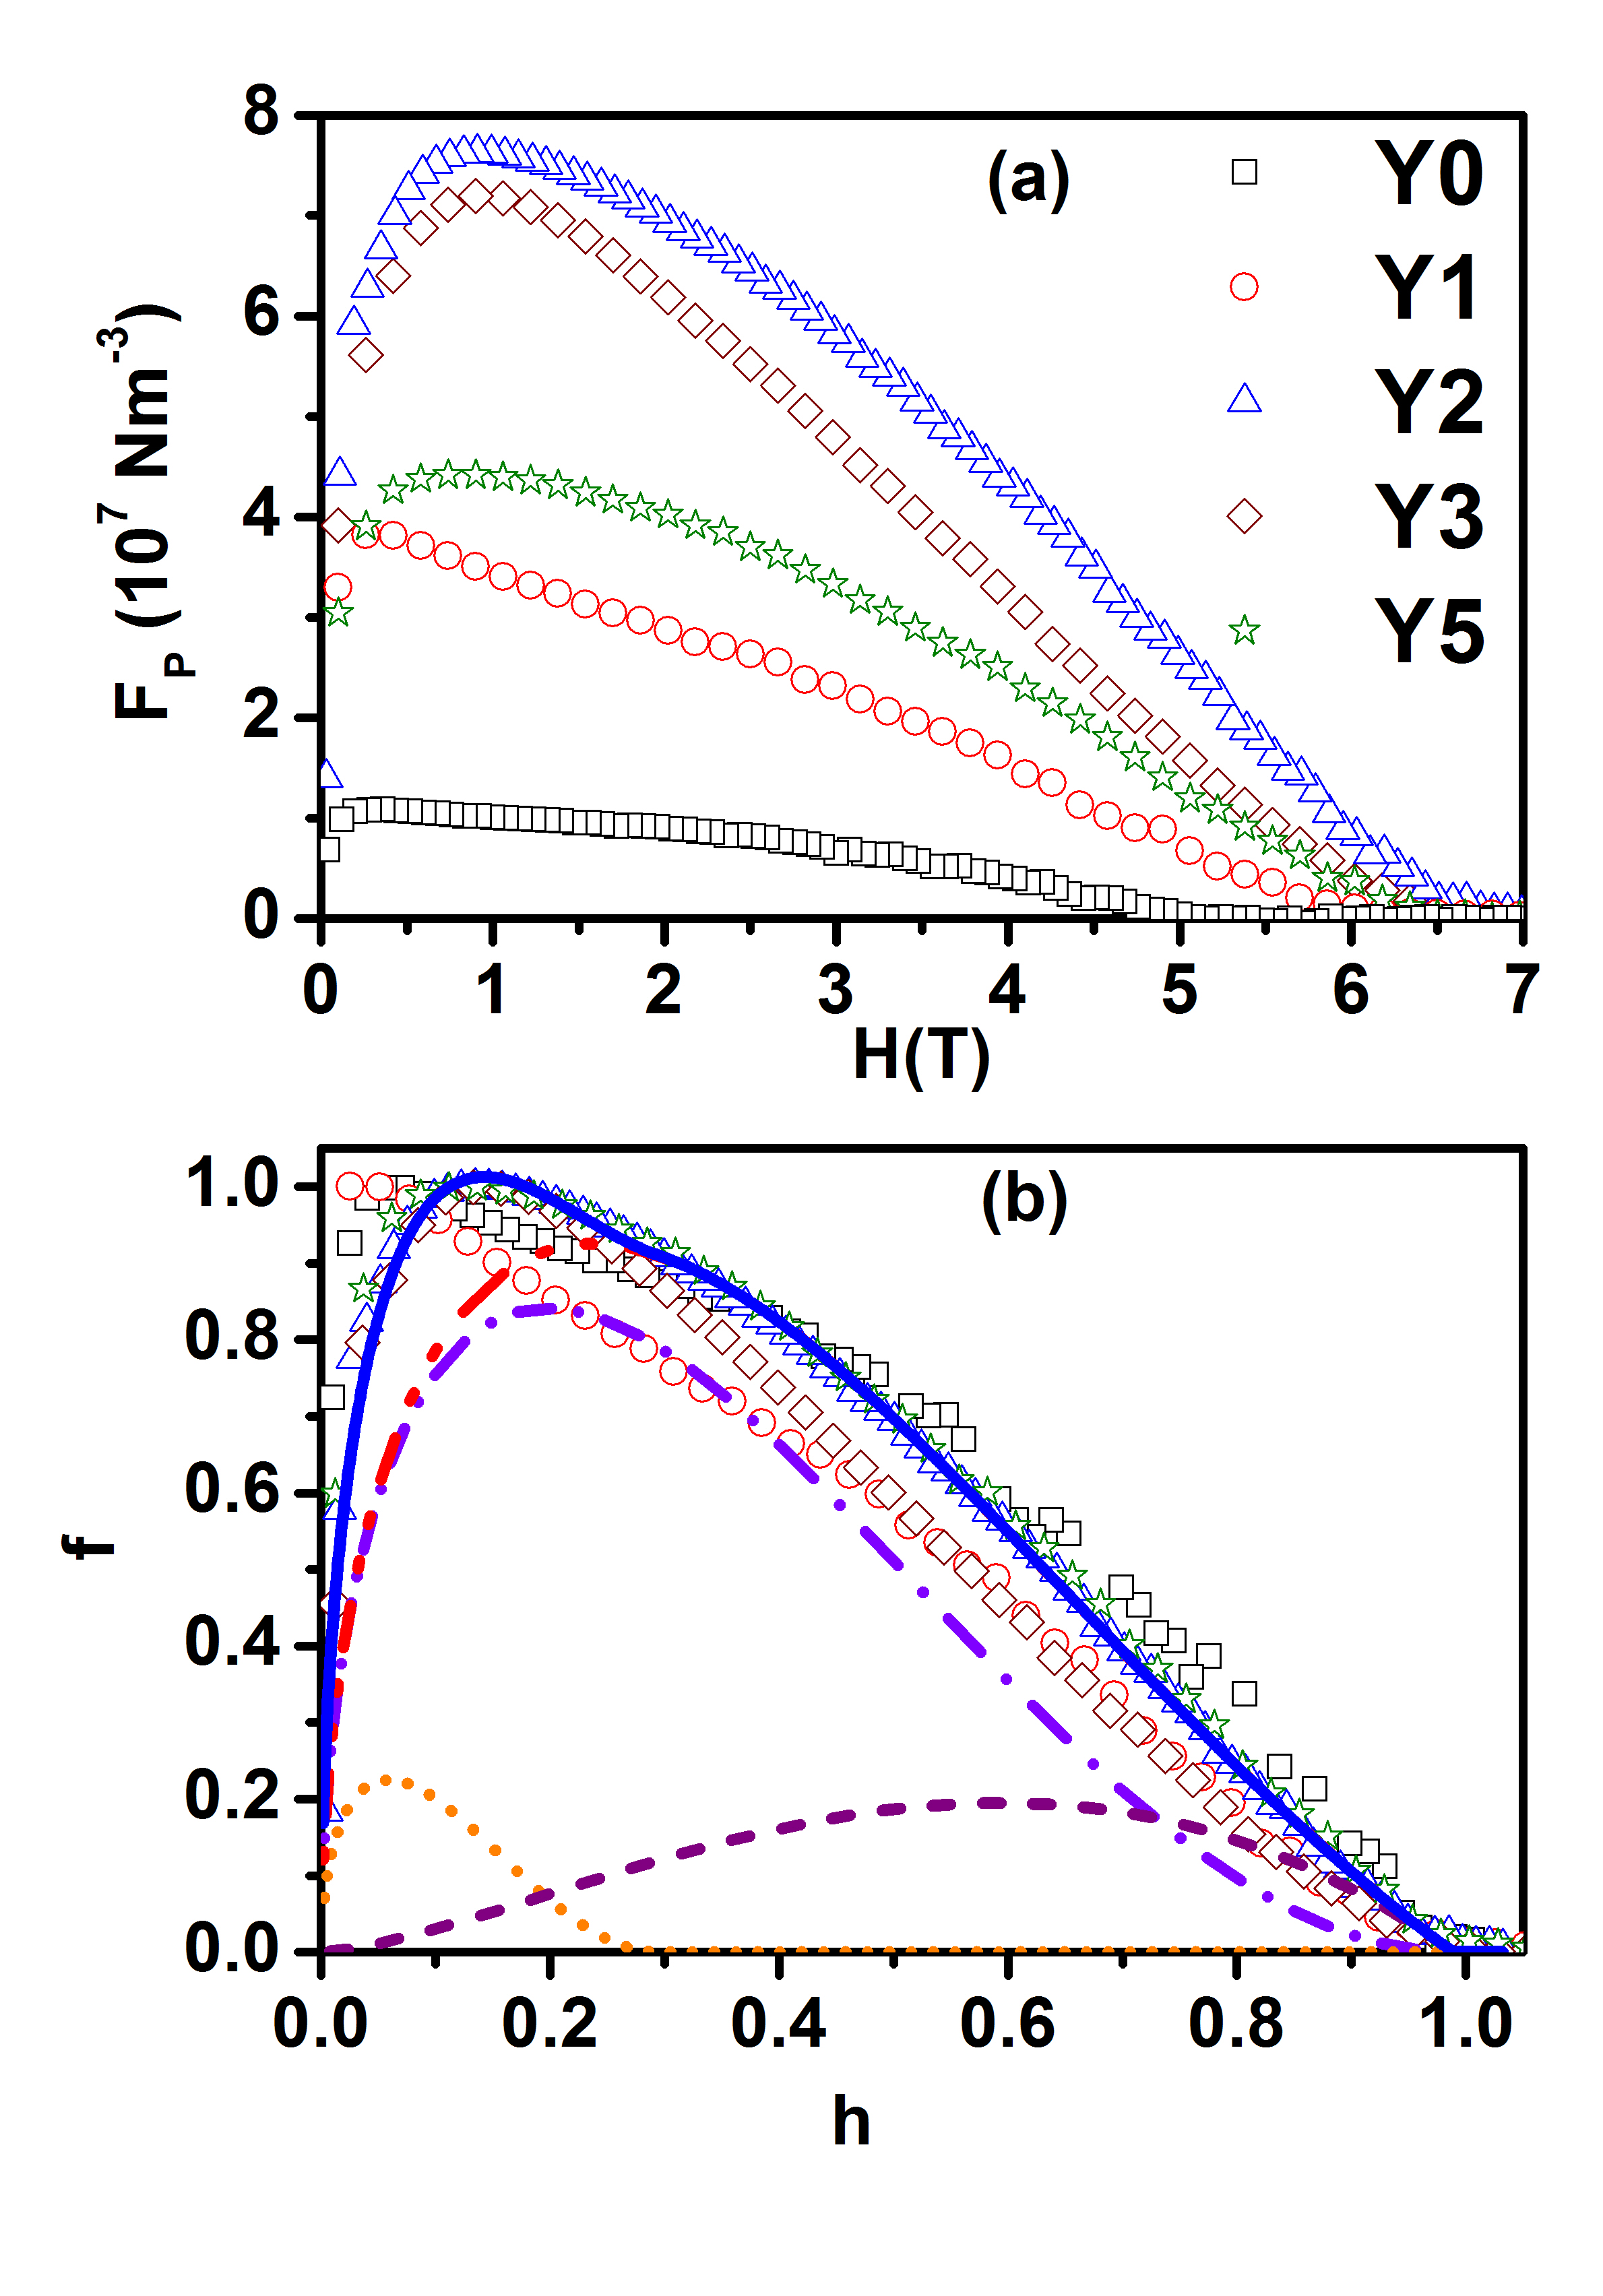
In order to establish a correlation between the nature of the defects and the enhancement of , we have estimated the pinning force density () at 4 K as and the same is plotted in Fig. 13(a). In the V1-yTiy alloys, the grain boundaries are the major pinning centres in the low-field regime, whereas the point defects and dislocations are the effective pinning centres in the high-field regime. matin2015critical ; matin2013magnetic The maximum of the V0.6Ti0.4 alloy at 4 K is in the range of 107 Nm-3. Addition of yttrium increases this value up to 2 at.%. The maximum of the Y2 alloy at 4 K is about 7.6107 Nm-3 which is about 7.6 times that of the parent V0.6Ti0.4 alloy. Significant pinning strength above 5 T is found in the yttrium containing alloys. In all the samples at 4 K, the increases sharply in very low fields and falls of gradually in high magnetic fields.
The Fig. 13(b) presents the plot of reduced pinning force density () of all the alloys as a function of reduced field . According to Dew-Hughes dewhughes , the depends on the spacing, size and nature of the pinning centres and is proportional to . Each type of pinning centre yields an unique set of p and q values ekin2010unified and a maximum of at . The values of , and provides information on the nature of the pinning centres responsible for the . All the curves in Fig. 13(b) tend to scale on the falling edge, while significant variation of among the alloys is observed for 0.1. This indicates that the pinning mechanism at high magnetic fields is same for all the alloys. The experimental value of at which becomes maximum () for the V0.6Ti0.4 alloy is about 0.06. The increases with the addition of yttrium and is about 0.14 for the Y2, Y3 and Y5 alloys at 4 K. The comparison of the curvature of the different pinning mechanisms for close to unity dewhughes with the curvature of of the present alloys indicates that the pinning at high fields is due to the regions with large change in the superconducting properties (large change in the Ginsburg-Landau parameter or large ). dewhughes ; ekin2010unified The known mechanisms of flux pinning have 0.2. The 0.2 for all the alloys indicates that the pinning that exists at low magnetic fields may not be effective at high fields.
In such cases where multiple types of pinning centres become available for pinning at different magnetic fields, can be expressed as,muz11 ; li06
| (4) |
where, is the pinning force density of individual pinning centres. The solid blue line in Fig. 13(b) shows the fit to the by considering three types of pinning centres viz.,
(i) normal surface pinning () by grain/cell boundaries (violet dot-dashed line)
(ii) surface pinning () by dislocations (purple dashed line) and
(iii) normal surface pinning with (orange dotted line).
One can see that pinning centres of type (i) and (ii) combined (red dash-dot-dotted line in Fig. 13(b)) can account for pinning in the high field range 0.35. The variation of with the composition follows the cell boundary and dislocation density in these alloys. The is maximum for the Y2 alloy which has the smallest cell size. The number of precipitates is largest for Y2 alloy which hints that the dislocation density may be maximum for this alloy. Thus, the grain/cell boundaries and dislocations are the effective pinning centres in all the present alloys. Therefore, the versus plots for all the alloys at 4 K scale at high fields. To explain the pinning in the low field region, one needs to consider pinning mechanism of type (iii) with a very low irreversibility field which is about 0.22. We have observed a positive magnetization signal just below () of all the (V0.6Ti0.4)-Y alloys in low magnetic fields. ram21hfpme This is an effect what is known as ’High Field Paramagnetic Effect (HFPME)’ where the positive magnetization arises from the flux compression as well as creeping of flux lines from weak pinning-centres to strong pinning-centres leading to anisotropic distribution in flux line pinning. matinHFPME ; shyamHFPME ; Dias The flux compression is found to be due to the yttrium-rich precipitates become superconducting by the proximity effect. ram21hfpme We believe that the pinning mechanism of type (iii) is related to the pinning centres that contributes to HFPME.
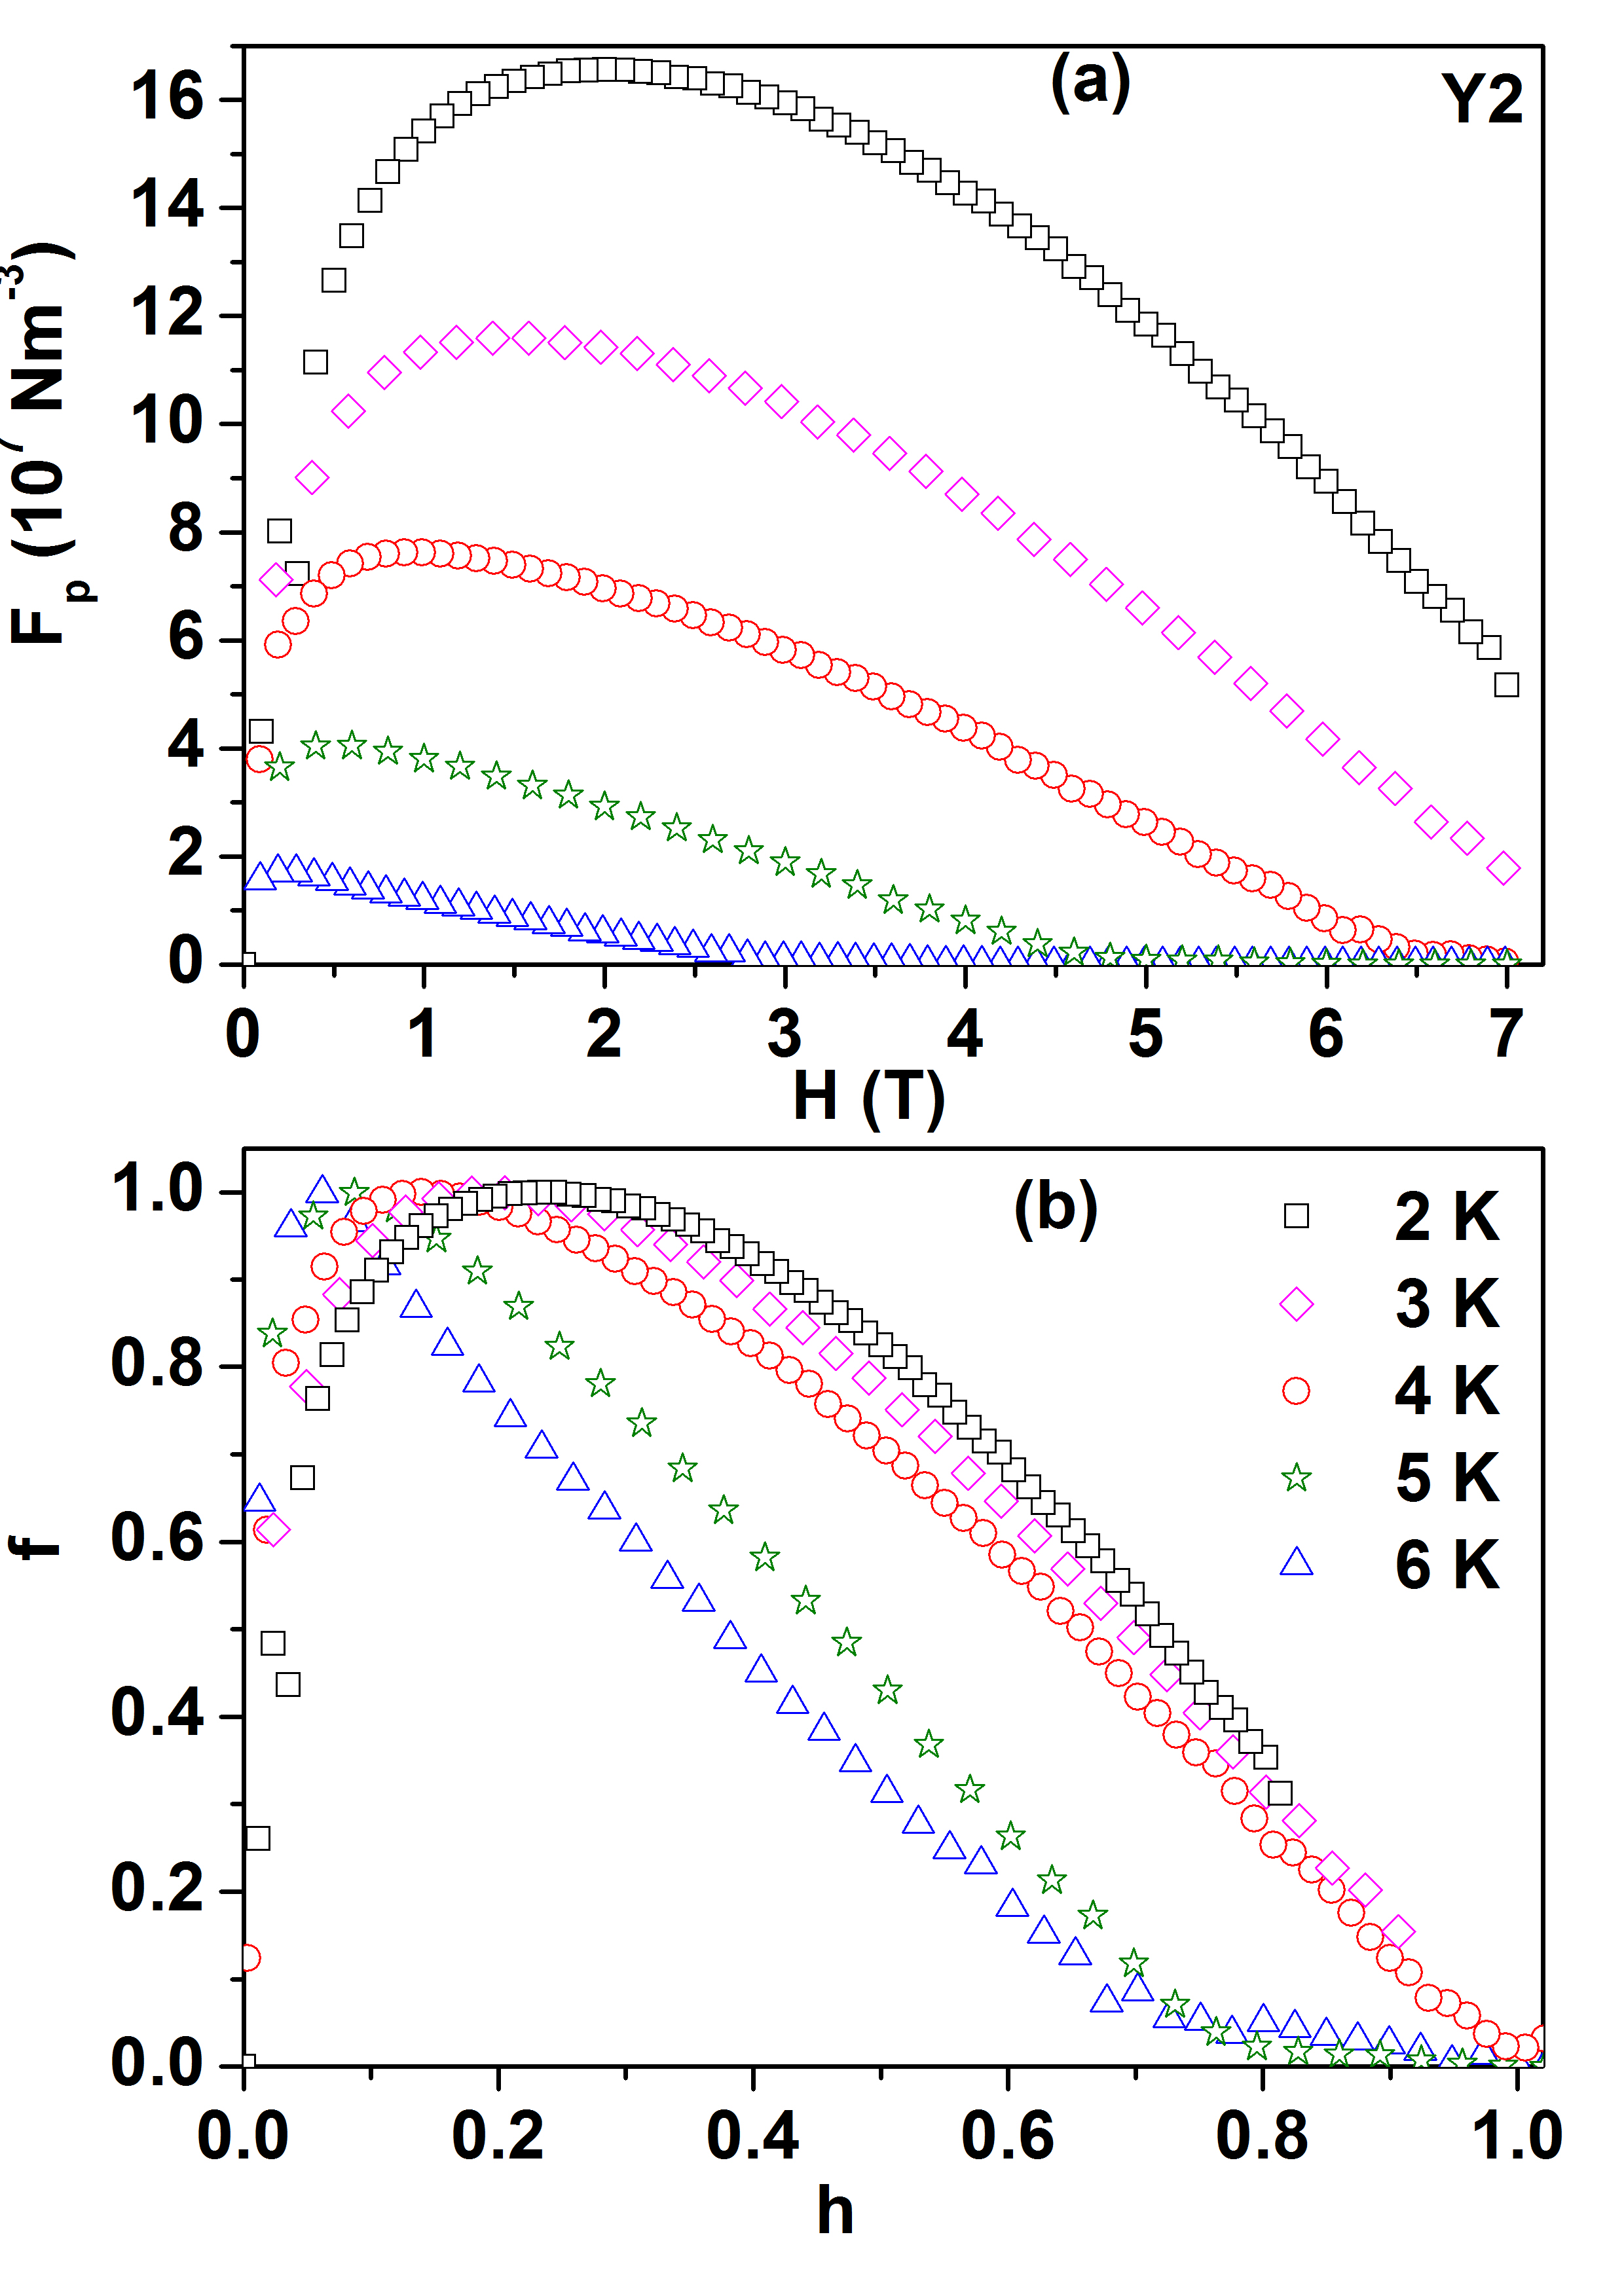
The shape of the curve and its peak position change with temperature (Fig. 14(a)). The position of the maximum changes from = 0.08 at 6 K to about 0.23 at 2 K (Fig. 14(b)). The curves are extrapolated linearly to get () at temperature 3 K and 2 K. The sharpness of the peak reduces and the curvature of the falling edge changes with decreasing temperature. This behaviour is an indication of different pinning centres becoming effective at different temperatures. The Fig. 14(b) shows that the pinning mechanism present in high fields and low temperatures is absent at temperatures close to . The thermal conductivity studies on (V0.6Ti0.4)-Gd alloys indicated that the dislocations become effective in scattering the phonons at low temperatures and high magnetic fields which in turn renormalizes the electron-phonon coupling. paul21 We infer that the dislocation become effective in pinning flux lines in high magnetic fields at low temperatures which is inline with the analysis related to Fig. 13(b).
IV Conclusion
We have shown that the yttrium is immiscible and precipitates with various sizes in the V0.60Ti0.40 alloy. Dendritic microstructure is observed in all the yttrium containing alloys. For 2 at.% yttrium in the V0.60Ti0.40 alloy, fine yttrium-rich precipitates are generated because of phase separation of the homogeneous V-Ti-Y liquid into a solid -V0.60Ti0.40 alloy and a yttrium-rich liquid. The size of the yttrium-rich precipitates increases for higher yttrium content due to liquid immiscibility. The dendritic cell size reduces with increasing yttrium content up to 2 at.% in the V0.60Ti0.40 alloy which results in the generation of a large number of line defects. Yttrium removes oxygen from the V0.60Ti0.40 alloy matrix due to which the of the yttrium containing alloys is enhanced. The defects generated by the addition of yttrium are found to be effective in pinning the flux lines and also increase the . The critical current density is increased by more than 7.5 times in fields higher than 1 T for the V0.58Ti0.40Y0.02 alloy at 4 K.
V Data availability statement
The data that support the findings of this study are available from the corresponding author upon reasonable request.
VI References
References
- (1) M. Tai, K. Inoue, A. Kikuchi, T. Takeuchi, T. Kiyoshi, Y. Hishinuma, IEEE. Trans. Appl. Supercond. 17, 2542 (2007).
- (2) Md. Matin, L. S. Sharath Chandra, M. K. Chattopadhyay, R. K. Meena, R. Kaul, M. N. Singh, A. K. Sinha and S. B. Roy, Physica C 512, 32 (2015).
- (3) Md. Matin, L. S. Sharath Chandra, M. K. Chattopadhyay, R. K. Meena, R. Kaul, M. N. Singh, A. K. Sinha and S. B. Roy, J. Appl. Phys. 113, 163903 (2013).
- (4) S. Paul, SK. Ramjan, R. Venkatesh, L. S. Sharath Chandra and M. K. Chattopadhyay, IEEE. Trans. Appl. Supercond. 31, 8000104 (2021).
- (5) S. Paul, SK. Ramjan, L. S. Sharath Chandra, M. K. Chattopadhyay, Mater. Sci. Eng. B (accepted) [arXiv preprint arXiv:2103.13601 (2021)].
- (6) L. I. Ivanov, V. V. Ivanov, V. M. Lazorenko, Y. M. Platov and V. I. Tovtin, J. Nucl. Mater. 191, 928 (1992).
- (7) S. T. Sekula, J. Nucl. Mate. 72 91 (1978)
- (8) Y. Higashiguchi, H. Kayano and S. Morozumi, J. Nucl. Mater. 133, 662 (1985).
- (9) W. H. Weber, Jour. Nucl. Mate. 108, 572 (1982).
- (10) G. Audi, O. Bersillon, J. Blachot and A. D. Wapstra, Nucl. Phys. A 624, 1 (2003).
- (11) T. Takeuchi, H. Takigawa, M. Nakagawa, N. Banno, K. Inoue, Y. Iijima and A. Kikuchi, Supercond. Sci. Technol. 21, 025004 (2008).
- (12) P. H. Bellin, H. C. Gatos and V. Sadagopan, J. Appl. Phys. 41, 2057 (1970).
- (13) Y. V. Efimov, V. V. Baron and E. M. Savitskii, Physics and Metallurgy of Superconductors (Springer, 1970, pp-98-101).
- (14) K. A. Gschneidner, Jr., Structural and physical properties of alloys and intermetallic compounds, in: L. Eyring (Ed.), Progress in the science and technology of rare earths, 1, 1964, Pergamon, New York pp. 222-258.
- (15) A. S. Komjathy, R. H. Read and W. Rostoker, WADD Technical report no. 59-483, Wright-Patterson Airforce base, Ohio (1960). Permanent Online link: https://catalog.hathitrust.org/Record/009230761.
- (16) B. Love, WADD Technical report no. 60-74, part I, Wright-Patterson Airforce base, Ohio (1960). Permanent Online link: https://catalog.hathitrust.org/Record/009206837.
- (17) J. F. Smith, K. J. Lee, and D. M. Martin, Binary rare earth-vanadium systems, CALPHAD 12 (1988) 89-96.
- (18) K. H. J. Buschow, Intermetallic compounds of rare-earth and 3d transition metals, Rep. Prog. Phys. 40 (1977) 1179-1256.
- (19) W. Chan, M. C. Gao, O. N. Dogan, and P. King, Thermodynamic assessment of V-rare earth systems, J. Phase Equilib. Diffus. 31 (2010) 425-432.
- (20) J. F. Collins, V. P. Calkins, and J. A. Mc Gurty, Applications of rare earths to ferrous and non-ferrous alloys. United States: N. p., (1959). Web. doi:10.2172/4215576.
- (21) L. Peng, C. Jiang, X. Li, P. Zhou, Y. Li, and X. Lai, J. Alloy. Compd. 694 1165 (2017).
- (22) Md. Matin, L. S. Sharath Chandra, S. K. Pandey, M. K. Chattopadhyay and S. B. Roy, Eur. J. Phys. B 87, 131 (2014).
- (23) Md. Matin, M. K. Chattopadhyay, L. S. Sharath Chandra, and S. B. Roy, Supercond. Sci. Technol. 29, 025003 (2015).
- (24) A. K. Sinha, A. Sagdeo, P. Gupta, A. Kumar, M. N. Sing, R. K. Gupta, S. R. Kane, S. K. Deb, AIP Conf. Proc. 1349, 503 (2011).
- (25) E. M. Savitskii and G. S. Burkhanov, J. Less-Common Metals 4, 301 (1962).
- (26) A. Kostov, D. Zivkovic and B. Friedrich, J. Min. Metall. B 42 57 (2006).
- (27) R. Aoki and T. Ohtsuka, J. Phys. Soc. Japan 23, 955 (1967).
- (28) R. Aoki and T. Ohtsuka, J. Phys. Soc. Japan 26, 651 (1969).
- (29) B. Stritzker, Phys. Rev. Lett. 42, 1769 (1979).
- (30) S. K. Bose, J. Kudrnovsky, I. I. Mazin and O. K. Andersen, Phys. Rev. B 41, 7988 (1990).
- (31) Shyam Sundar, L. S. Sharath Chandra, M. K. Chattopadhyay S. K. Pandey, D. Venkateshwarlu, R. Rawat, V. Ganesan, and S. B. Roy, New J. Phys. 17, 053003 (2015).
- (32) S. Paul, L. S. Sharath Chandra, and M. K. Chattopadhyay, J. Phys.: Condens. Matter 31 475801 (2019).
- (33) A. Wexler and S. W. Corak, Phys. Rev. 85, 85 (1952).
- (34) C. P. Bean and J. D. Livingston, Phys. Rev. Lett. 12, 14 (1964).
- (35) N. R. Werthamer, E. F. Helfand and P. C. Hohenberg, Phys. Rev. 147, 295 (1966).
- (36) eg., C. P. Poole, Jr. Handbook of superconductivity (Academic Press, San Diego, (2000)).
- (37) D. N. Zheng, H. D. Ramsbottom and D. P. Hampshire, Phys. Rev. B 52, 12931 (1995).
- (38) E. Martínez, P. Mikheenko, M. Martínez-López, A. Millán, A. Bevan, and J. S. Abell, Phys. Rev. B 75, 134515 (2007).
- (39) Shyam Sundar, M. K. Chattopadhyay, L. S. Sharath Chandra and S. B. Roy, Physica C 519, 13 (2015).
- (40) C. P. Bean, Rev. Mod. Phys. 36, 31 (1964).
- (41) D. Dew-Hughes, Phil. Mag. 30, 293 (1974).
- (42) J. W. Ekin, Supercond. Sci. Technol. 23, 083001 (2010).
- (43) SK. Ramjan, L. S. Sharath Chandra and M. K. Chattopadhyay, arXiv:2110.05921
- (44) L. Muzzi, G. De Marzi, C. F. Zignani, U. B. Vetrella, V. Corato, A. Rufoloni, and A. della Corte, IEEE Trans. Appl. Supercond. 21, 3132 (2011).
- (45) P. J. Li, Z. H. Wang, A. M. Hu, Z. Bai, L. Qiu, and J Gao, Supercond. Sci. Technol. 19, 825 (2006).
- (46) Md. Matin, L. S. Sharath Chandra, M. K. Chattopadhyay, M. N. Singh, A. K. Sinha, and S. B. Roy, Supercond. Sci. Technol. 26, 115005 (2013).
- (47) S. Sundar, M. K. Chattopadhyay, L. S. Sharath Chandra, and S. B. Roy, Supercond. Sci. Technol. 28, 075011 (2015).
- (48) F. T. Dias, P. Pureur, P. Rodrigues Jr. and X. Obradors, Phys. Rev. B 70, 224519 (2004).
- (49) A. I. Schindler, and M. J. Rice, Phys. Rev. 164, 759 (1967).
- (50) F. H. Spedding, A. H. Daane, and K. W. Herrmann, Acta Cryst. 9, 559 (1956).
- (51) F. Hanic, M. Hartmanova, G. G. Knab, A. A. Urusovskaya and K. S. Bagdasarov, Acta Cryst. B 40, 76 (1984).
- (52) L. S. Sharath Chandra, Sabyasachi Paul, Ashish Khandewlwal, Vinay Kaushik, Archna Sagdeo, R. Venkatesh, Kranti Kumar, A. Banerjee, M. K. Chattopadhyay, J. Appl. Phys. 126, 183905 (2019).
- (53) G. Enderlein, A. Handstein, F. Lange, and P. Verges, Cryogenics 13, 426 (1973).
- (54) O. V. Chernyj, G. F. Tikhinskij, G. E. Storozhilov, M. B. Lazareva, L. A. Kornienko, N. F. Andrlevskaya, V. V. Slezov, V. V. Sagalovich, Ya D. Starodubov, and S. I. Savchenko, Supercond. Sci. Technol. 4, 318 (1991).
- (55) T. Boutboul, S. Le Naour, D. Leroy, L. Oberli, and V. Previtali, IEEE Trans. Appl. Supercond. 16, 1184 (2006).
- (56) K. Miyashita, H. Sato, M. Arika, and R. Takahashi, Electr. Eng. Jpn. 156, 24 (2006).
- (57) H. Lin, C. Yao, H. Zhang, X. Zhang, Q. Zhang, C. Dong, D. Wang, and Y. Ma, Sci. Rep. 5, 11506 (2015).
- (58) T. Mousavi, Z. Hong, A. Morrison, A. London, P. S. Grant, C. Grovenor and S. C. Speller, Supercond. Sci. Technol. 30, 094001 (2017).