Measurement Based Non-Line-Of-Sight
Vehicular Visible Light Communication Channel Characterization
Abstract
Vehicular visible light communication (V-VLC) aims to provide secure complementary vehicle to everything communications (V2X) to increase road safety and traffic efficiency. V-VLC provides directional transmissions, mainly enabling line-of-sight (LoS) communications. However, reflections due to nearby objects enable non-line-of-sight (NLoS) transmissions, extending the usage scenarios beyond LoS. In this paper, we propose wide-band measurement based NLoS channel characterization, and evaluate the performance of direct current biased optical orthogonal frequency division multiplexing (DCO-OFDM) V-VLC scheme for NLoS channel. We propose a distance based NLoS V-VLC channel path loss model considering reflection surface characteristics and NLoS V-VLC channel impulse response (CIR) incorporating the temporal broadening effect due to vehicle reflections through weighted double gamma function. The proposed path loss model yields higher accuracy up to 14 dB when compared to single order reflection model whereas CIR model estimates the full width at half maximum up to 2 ns accuracy. We further demonstrate that the target bit-error-rate of can be achieved up to 7.86 m, 9.79 m and 17.62 m distances for black, orange and white vehicle reflection induced measured NLoS V-VLC channels for DCO-OFDM transmissions.
Index Terms:
Visible light communication channel, DCO-OFDM, NLoS channel model.I Introduction
Vehicular communications enable exchange of traffic, road and vehicle information between vehicles, infrastructure and other road users through vehicle to vehicle (V2V), vehicle to infrastructure (V2I) and vehicle to pedestrian (V2P) communications. Currently, radio frequency (RF) based cellular vehicle to everything (C-V2X) [1] and IEEE 802.11p [2] technologies are standardized to support V2X applications. On the other hand, omnipresence of light emitting diodes (LEDs) in the vehicle lighting paves the way for vehicular visible light communications (V-VLC) as a complementary technology to the existing schemes. Since V-VLC provides RF interference, jam and spoof free directional optical communications, it is foreseen to be a strong candidate to enable secure vehicular communications [3].
V-VLC is mainly considered to be a line-of-sight (LoS) technology due to its directional propagation characteristics. However, non-line-of-sight (NLoS) V-VLC transmissions are also demonstrated to increase received signal strength (RSS) of LoS V-VLC link through object reflections [4]. Therefore, NLoS V-VLC can be considered to support close proximity V2V safety applications such as blind spot warning, lane change warning and intention sharing by taking advantage of nearby vehicle reflected optical signals.
V-VLC system performance mainly depends on the V-VLC propagation channel characteristics, which distort the optical signals through attenuation, scattering and reflection. Thus, V-VLC channel modeling is extensively studied in the literature, based on the LoS transmission assumptions [5, 6, 7]. [5] proposes a ray tracing simulation based LoS path loss model incorporating headlight radiation pattern, [6] presents taillight measurement based path loss model and [7] provides a statistical path loss distribution model with the consideration of asymmetric headlight radiation pattern. On the other hand, only a few studies investigate the NLoS V-VLC channel [4, 8], where [4] demonstrates the incremental effect of highly reflective road surface on V-VLC RSS and [8] shows the bit-error-rate (BER) performance degradation of V-VLC due to road surface specular reflections. However, the current literature lacks the characterization of NLoS V-VLC channel due to vehicle reflections, where the vehicle surface mainly determines the path loss and signal distortions. On the other hand, channel impulse response (CIR) temporal broadening due to NLoS scattering, which determines the achievable data rate and bandwidth of the V-VLC systems has not yet been investigated for V-VLC channels. Moreover, empirical channel models based on the low bandwidth optical power measurements by optical power meters [6] and RSS measurements at single tone frequencies [4] fail to address the channel behavior for a wide range of LED modulation frequencies.
In this paper, we propose wide-band frequency sweep measurement based CIR and path loss characterization for NLoS V-VLC channels due to vehicle body reflections. Moreover, we investigate the BER performance of direct current biased optical orthogonal frequency division multiplexing (DCO-OFDM) based V-VLC system for NLoS channels for different modulation order and background noise levels. We demonstrate that the proposed NLoS V-VLC channel path loss model provides higher accuracy than the widely considered single order reflection based NLoS channel model [9] for indoor visible light communications (VLC), since NLoS channel model for V-VLC has not yet been proposed in the literature. The original contributions of this paper are threefold:
-
•
We provide a distance based NLoS V-VLC channel path loss model with the consideration of pure vehicle surface reflections, for the first time in the literature.
-
•
We characterize CIR of the NLoS V-VLC through weighted double gamma function (WDGF) by using measurement data from different vehicle reflection induced channels. Thus, for the first time in the literature, we investigate the temporal broadening effect of V-VLC CIR due to vehicle reflections.
-
•
We provide attainable NLoS V-VLC distance for the target BER performance of DCO-OFDM scheme under the consideration of measured channel gains for a wide range of LED modulation frequencies.
The rest of the paper is organized as follows. Section II describes the considered DCO-OFDM transmission system model. Section III provides the methodology for measurement based NLoS channel modeling. Section IV presents the proposed path model and WDGF based NLoS CIR characterization. Section V presents simulation results for DCO-OFDM V-VLC for the empirical NLoS V-VLC channel. Finally, Section VI concludes the paper.
II System Model
In this section, DCO-OFDM based transmission model is provided, where the performance of DCO-OFDM based V-VLC system is evaluated for the proposed NLoS channels.
In DCO-OFDM, binary information is first mapped to complex symbols based on the deployed constellation scheme, such as order quadrature amplitude modulation (QAM), where is the number of subcarriers. To ensure that the output of inverse fast Fourier transform (IFFT) is real-valued, Hermitian symmetry is imposed on the transmitted signal as,
| (1) |
where and denote complex conjugate and transpose operations, respectively. After point IFFT operation where the output is denoted by , a cyclic prefix with length , which is greater than or equal to the delay spread of the channel, is appended to the beginning of each DCO-OFDM frame and parallel streams are converted to serial. The resulting DCO-OFDM signal is
| (2) |
where is the sampling interval and has the average electrical transmit signal power of . The modulated signal is direct current (DC) biased and transmitted via LED. The time domain received signal at the photodetector (PD) is
| (3) |
where is the responsivity of PD (A/W), is the optical channel response obtained by the measurements, and is additive white Gaussian noise (AWGN) with zero mean and variance, where is noise power spectral density (PSD) and denotes the system bandwidth. In (3), denotes the convolution operation.
At the receiver, the captured optical signals are converted to parallel streams and cyclic prefix is removed. Then, the point fast Fourier transform (FFT) is applied on the output.
III Measurement Based NLoS Channel Modeling
Vehicle surfaces are made up of different materials and follow various geometries, where V-VLC signal reflection characteristics vary between vehicles. To incorporate the vehicle surface dependent reflection characteristics, a measurement based approach is employed with the following steps: (i) characterize the LED modulation bandwidth and ambient noise to determine measurement parameters of maximum sweep frequency and intermediate frequency bandwidth , (ii) measure the LoS channel frequency response to obtain channel gain values as a benchmark to evaluate NLoS channel, (iii) measure NLoS channel gains for path loss and CIR characterization, (iv) post-process measurement data to obtain NLoS channel path loss and CIR.
The LED modulation bandwidth determines the maximum measurable frequency of the channel, whereas vector network analyzer (VNA) intermediate frequency bandwidth selection determines the noise floor of the measurements. The LoS channel gain () values constitute reflection free, non-distorted channel frequency response measurements, which are used to evaluate reflection induced NLoS measurements. The NLoS measurements are post processed to extract distance and reflection surface dependent path loss with CIR temporal characteristics.
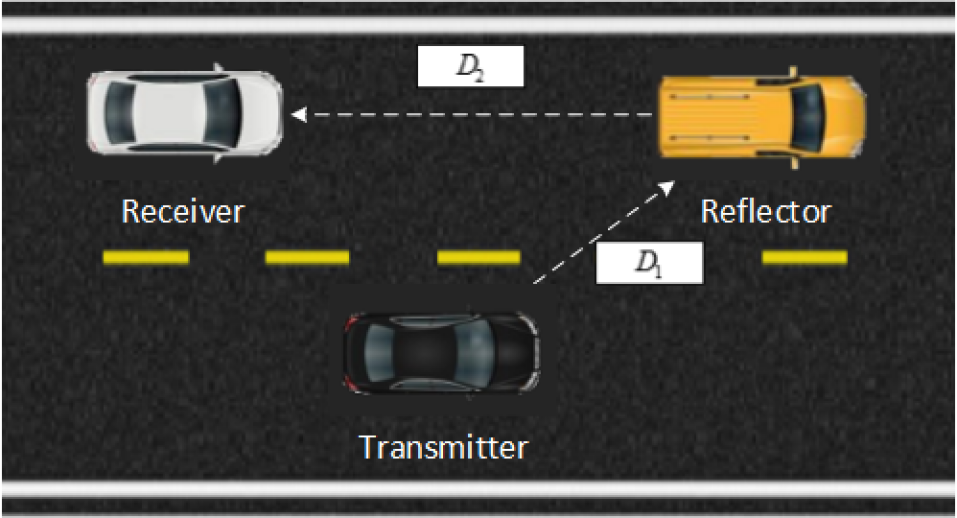
To capture NLoS components from vehicle reflections, a vehicle LED day time running light (DRL) in the nearby lane is directed towards the rear of the reflector vehicle. The receiver vehicle is positioned behind the reflector vehicle in the same lane, where LoS link does not exist between the transmitter and receiver vehicle. The transmitter-reflector vehicle distance () is fixed, whereas the distance between reflector and receiver vehicle () is varied. Three different reflection surfaces, orange light commercial vehicle (Ford Courier 2019), white (BMW 320i 2014) and black passenger vehicle (Fiat Tipo Station Wagon 2018) bodies are considered as reflection surfaces to model the NLoS channel. The measurement scenario is depicted in Fig. 1.
The LoS channel path loss of the measurement setup is obtained with the limitation of PD’s field of view (FoV) with a tube similar to the work in [4], at the same transmitter-receiver height. Then, NLoS channel measurements are conducted to obtain LED modulation frequency dependent channel gains. The path loss and CIR are calculated at the post-processing stage. To minimize random variations of the received signal due to measurement equipment, all measured frequency responses are averaged over 10 realizations per measurement location.
At the transmitter side, the sounding signals are fed into the driver block from Port 1 of the VNA. The driver block amplifies the sounding signals and adds DC bias before feeding to the LED. At the receiver side, PD captures the signals and feed into the Port 2 of the VNA, yielding frequency dependent values.
Path Loss Characterization
The path loss is derived as the ratio of the received electrical power to the transmitted electrical power over the measurement bandwidth. The path loss from the measurement data is obtained by [10]
| (4) |
where is the total number of values from minimum measurement frequency, , to maximum measurement frequency, , due to LED modulation bandwidth limitations, and is the step frequency.
The reflection coefficient () of the considered surfaces is calculated by the ratio of the measured NLoS reflected surface channel gain to pure LoS channel gain at the reference distance of 2 m. The reflection coefficient demonstrates the reflectivity of the surface, where higher values indicate more reflective surfaces (i.e., brighter color).
| Surface | Parameters | ||||
|---|---|---|---|---|---|
| n |
|
||||
| White Car | 0.9185 | 4.703 | 0.7189 | 0.0774 | |
| Orange Car | 0.7871 | 5.477 | 0.9998 | 0.0243 | |
| Black Car | 0.7516 | 5.384 | 0.9238 | 0.0156 | |
NLoS V-VLC CIR Characterization
The NLoS CIR is characterized to evaluate the temporal distortion effects of reflections on V-VLC signals. To obtain CIRs of the channels under consideration, non-measured frequency interval of 0-200 kHz due to VNA limitations, are zero padded and Hermitian symmetry is imposed on the measured parameters.
The IFFT of the zero padded and Hermitian symmetry imposed samples yields CIR of the NLoS channel. To increase the time resolution of the CIR, frequency domain measurement data are zero padded for the frequencies between , and the target frequency (), the bandwidth is given by and time resolution is given by .
The measurement parameters are selected as kHz, MHz, Hz, Hz, noise floor dBm, whereas ns is selected with the padding of measurement samples.
IV Empirical CIR and Path Loss Model
In this section, we provide CIR tail characterization together with the least-squares fitting based channel path loss model for NLoS V-VLC channel.
IV-A Channel Impulse Response
The increasing transmitter-receiver for LoS and reflector-receiver distances for NLoS channels result in longer CIR tails due to increased photons scattering (See Fig. 2). We characterize CIR temporal broadening as a function of transmitter-receiver distance for LoS and reflector-receiver distance for NLoS channels. We adopt full width at half maximum (FWHM) metric to quantify CIR broadening [11] and NLoS V-VLC CIR is approximated by WDGF as [12]
| (5) |
where , , , , , and are model coefficients to be found by least-squares fitting to the measurement data. denotes the time scale starting from the CIR peak, since the tail determines the CIR broadening.
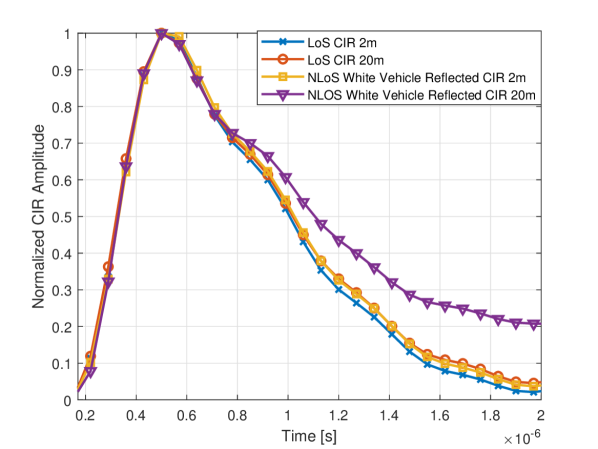
Fig. 2 demonstrates the CIR temporal broadening of LoS and NLoS channels with the increasing distance. For LoS transmissions at 2 m and 20 m transmitter-receiver distances, 671 ns and 690 ns FWHM is measured, respectively. On the other hand, white vehicle reflected NLoS transmissions yield 696 ns and 778 ns FWHM at 2 m and 20 m distances, respecively. Thus, CIR broadening due to NLoS transmissions can be considered substantial when compared to LoS transmissions since delay spread at 2 m NLoS channel is almost equivalent to 20 m LoS channel.
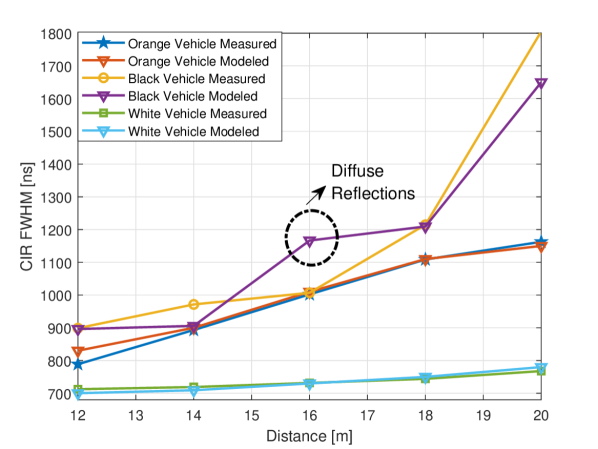
Fig. 3 shows the distance dependent measured and WDGF modeled FWHM of the LoS and NLoS channels under consideration. For orange and white vehicle reflected NLoS channels, WDGF model well approximates the CIR FWHM, whereas for black vehicle reflected NLoS channels, the model accuracy decreases for diffuse reflections, where model overestimates the measured CIR FWHM by 160 ns. At 16 m distance, black vehicle body diffuse reflections help to preserve CIR FWHM with 29 ns elongation, whereas the model estimates 261 ns broadening. However, providing 2 ns and 5 ns FWHM estimation accuracy at 12 m and 18 m distances, respectively, for specular reflections of black vehicle induced NLoS channel, the WDGF model can be considered to approximate the NLoS V-VLC CIR for different distances and reflection surfaces.
IV-B Path Loss Model
The least-squares fitting based empirical NLoS channel path loss model is obtained as
| (6) |
where is the path loss at the reference distance , is the reflection surface to receiver distance, , and are the reflection surface dependent model coefficients. The proposed equation incorporates reflection surface dependent parameters into the path loss at reference distance, since each reflection surface inherits varying distance dependent reflection characteristics.
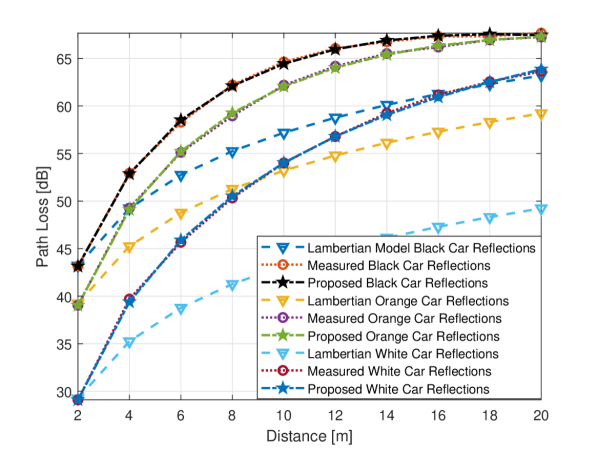
Fig. 4 shows measured path loss along with the single order reflection model detailed in Appendix, and proposed empirical NLoS channel path loss models for three different vehicle reflection surfaces. The proposed path loss expression provides 0.18 dB, 0.19 dB, and 0.22 dB root mean square error (RMSE) to the measurement data. On the other hand, single surface reflection model underestimates the path loss by 14 dB, 8 dB, and 4 dB at 20 m reflector-receiver distance for white, orange and black cars, respectively. The proposed model, incorporating wide range of modulation frequencies of the LED, yields accurate path loss estimations to evaluate the performance of multi-carrier based optical communication schemes such as DCO-OFDM.
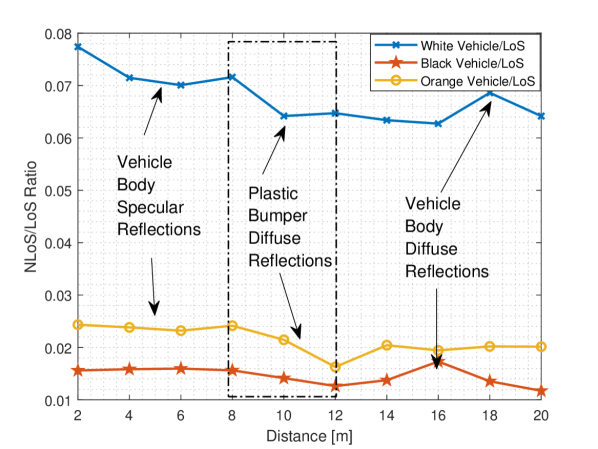
Fig. 5 shows the normalized NLoS channel gain for varying transmitter-receiver distances, to evaluate the effects of various surface and colors on NLoS channel path loss. The ratio mainly depends on the reflection surface properties, where the receiver captures reflections from various parts of the vehicle surface, such as bumper, trunk lid and vehicle body, depending on the type of the vehicle. Considering the PD’s FoV, mainly specular reflections from vehicle body is captured up to 8 m. Then, reflections from bumpers, partially made up of rough plastic, yield diffuse reflections between m. Moreover, depending on the trunk lid design, flat surface of the orange vehicle yields specular reflections whereas the edges and curvatures of the black and white vehicle trunk lids lead to diffuse reflections between 12 m to 20 m.
V DCO-OFDM V-VLC Performance Analysis
The aim of this section is to investigate the BER performance of the DCO-OFDM V-VLC scheme for NLoS channel at varying distances with Monte Carlo simulations. Since V-VLC performance highly depends on the ambient noise levels, we investigate day and night performance of the DCO-OFDM scheme with two different noise levels and modulation orders. The NLoS V-VLC measured channel gain values are considered with the simulation parameters set including dBm, , , -QAM for day, 16-QAM for night, noise power of dBm for day and dBm for night scenarios.
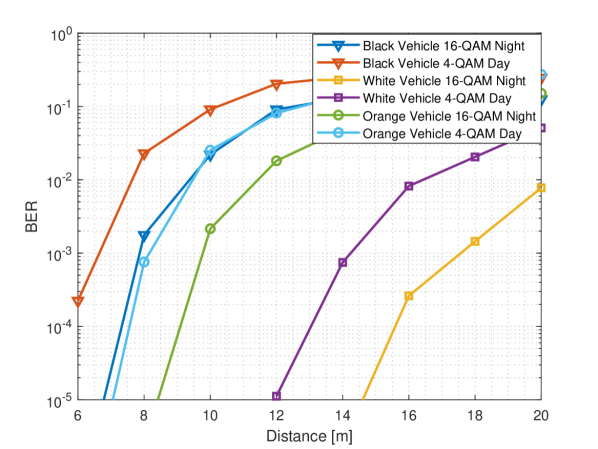
Fig. 6 depicts the Monte Carlo simulation results for distance based BER performance of the DCO-OFDM scheme with the consideration of measured channel gain values. For black vehicle induced NLoS channel, achievable reflector-receiver distances for target BER of are 6.67 m and 7.86 m for day and night conditions, respectively. Considering orange vehicle reflected NLoS channel, the achievable distances for target BER of are 8.22 m and 9.79 m, whereas for white vehicle NLoS channel, target BER is attained at 14.26 m and 17.62 m distances at day and night conditions, respectively. The achievable distance performance of the white vehicle reflected NLoS channel is substantially better than black and orange vehicle reflected channels, due to stronger reflections. Moreover, considering day and night performance of the NLoS channels under consideration, the achievable distance difference between two scenarios (i.e., day 4-QAM and night 16-QAM) increases with stronger reflections, where the difference is 1.19 m, 1.57 m and 3.36 m for black, orange and white vehicle reflected NLoS channels, respectively.
VI Conclusion
In this paper, we investigate the NLoS V-VLC channel path loss, CIR and BER performance for DCO-OFDM based transmissions. NLoS channel path loss expression is proposed by using the channel measurement data obtained through three different reflection surfaces, where it is demonstrated to well approximate the measurement data. Moreover, CIR of the NLoS V-VLC channel is demonstrated to broaden with the increasing distance due to scattering of photons. Therefore, WDGF model is adopted to approximate the CIR of NLoS channel, where it provides higher accuracy for specular reflections induced NLoS channels. The diffuse reflections due to vehicle tailgate design is demonstrated to yield channel gain and CIR FWHM fluctuations, where the approximation accuracy of the WDGF CIR model decreases. The BER performance of DCO-OFDM V-VLC scheme demonstrates that, white vehicle reflections yield substantially better achievable distance for target BER, whereas NLoS channel through the black and orange vehicle reflections are able to provide 6.64 m and 8.20 m link distance under day conditions, which can be practical for close proximity V2V safety applications. The proposed path loss model along with the WDGF CIR models can be employed for system simulations.
[Lambertian Single Order Reflection Model]
In this appendix, widely used single order reflection model is provided to evaluate the path loss and time domain parameters of NLoS VLC channels. The single order reflection model is considered as a benchmark to evaluate the NLoS V-VLC channel path loss. For single order reflection model, the NLoS component is obtained through the summation of the single order reflected components from each reflection surface.
The channel gain of the single order reflection NLoS VLC channel is given by [13]
| (7) | ||||
| (8) |
where is the active area of the PD; is the distance between the transmitter and reflector vehicle; is the distance between the receiver and reflector vehicle; is the angle of incidence at the receiver; is the field of view (FOV); and are the angle of irradiance to the reflector vehicle and incidence to the receiver, respectively; and are the reflection coefficient and small differential area of the reflector surface, respectively; is the gain of an optical filter; is the gain of a non imaging optical concentrator with refractive index given by
| (9) |
Single order reflection model generally assumes uniform distribution of the reflection points throughout the reflection area, which is applicable for large surface areas such as walls. Thus, single order reflection model is based on the assumption of perfect diffuse surface, which equally scatters incident illumination in all directions.
References
- [1] R. Molina-Masegosa and J. Gozalvez, “Lte-v for sidelink 5g v2x vehicular communications: A new 5g technology for short-range vehicle-to-everything communications,” IEEE Vehicular Technology Magazine, vol. 12, no. 4, pp. 30–39, 2017.
- [2] F. Arena, G. Pau, and A. Severino, “A review on ieee 802.11 p for intelligent transportation systems,” Journal of Sensor and Actuator Networks, vol. 9, no. 2, p. 22, 2020.
- [3] A. Memedi and F. Dressler, “Vehicular visible light communications: A survey,” IEEE Communications Surveys & Tutorials, 2020.
- [4] C. Tebruegge, A. Memedi, and F. Dressler, “Empirical characterization of the nlos component for vehicular visible light communication,” in 2019 IEEE Vehicular Networking Conference (VNC), pp. 1–4, IEEE, 2019.
- [5] M. Karbalayghareh, F. Miramirkhani, H. B. Eldeeb, R. C. Kizilirmak, S. M. Sait, and M. Uysal, “Channel modelling and performance limits of vehicular visible light communication systems,” IEEE Transactions on Vehicular Technology, vol. 69, no. 7, pp. 6891–6901, 2020.
- [6] H. B. Eldeeb, E. Eso, E. A. Jarchlo, S. Zvanovec, M. Uysal, Z. Ghassemlooy, and J. Sathian, “Vehicular vlc: A ray tracing study based on measured radiation patterns of commercial taillights,” IEEE Photonics Technology Letters, 2021.
- [7] F. Al-Sallami, N. Aigoro, A. A. Mahmoud, Z. U. Ahmad, P. Haigh, O. Haas, and S. Rajbhandari, “Impact of vehicle headlights radiation pattern on dynamic vehicular vlc channel,” Journal of Lightwave Technology, 2021.
- [8] P. Luo, Z. Ghassemlooy, H. Le Minh, E. Bentley, A. Burton, and X. Tang, “Performance analysis of a car-to-car visible light communication system,” Applied Optics, vol. 54, no. 7, pp. 1696–1706, 2015.
- [9] T. Komine and M. Nakagawa, “Fundamental analysis for visible-light communication system using led lights,” IEEE transactions on Consumer Electronics, vol. 50, no. 1, pp. 100–107, 2004.
- [10] M.-T. Martinez-Ingles, D. P. Gaillot, J. Pascual-Garcia, J.-M. Molina-Garcia-Pardo, J.-V. Rodríguez, L. Rubio, and L. Juan-Llácer, “Channel sounding and indoor radio channel characteristics in the w-band,” EURASIP Journal on Wireless Communications and Networking, vol. 2016, no. 1, pp. 1–8, 2016.
- [11] G. Chen, Z. Xu, and B. M. Sadler, “Experimental demonstration of ultraviolet pulse broadening in short-range non-line-of-sight communication channels,” Optics express, vol. 18, no. 10, pp. 10500–10509, 2010.
- [12] Y. Dong, H. Zhang, and X. Zhang, “On impulse response modeling for underwater wireless optical mimo links,” in 2014 IEEE/CIC International Conference on Communications in China (ICCC), pp. 151–155, IEEE, 2014.
- [13] V. Dixit and A. Kumar, “Performance analysis of non-line of sight visible light communication systems,” Optics Communications, vol. 459, p. 125008, 2020.