Origin of high thermal conductivity in disentangled ultra-high molecular weight polyethylene films: ballistic phonons within enlarged crystals
Abstract
The thermal transport properties of oriented polymers are of fundamental and practical interest. High thermal conductivities ( Wm-1K-1) have recently been reported in disentangled ultra-high molecular weight polyethylene (UHMWPE) films, considerably exceeding prior reported values for oriented films. However, conflicting explanations have been proposed for the microscopic origin of the high thermal conductivity. Here, we report a characterization of the thermal conductivity and mean free path accumulation function of disentangled UHMWPE films (draw ratio ) using cryogenic steady-state thermal conductivity measurements and transient grating spectroscopy. We observe a marked dependence of the thermal conductivity on grating period over temperatures from 30 – 300 K. Considering this observation, cryogenic bulk thermal conductivity measurements, and analysis using an anisotropic Debye model, we conclude that longitudinal atomic vibrations with mean free paths around 400 nanometers are the primary heat carriers and that the high thermal conductivity for draw ratio arises from the enlargement of extended crystals with drawing. The mean free paths appear to remain limited by the extended crystal dimensions, suggesting that the upper limit of thermal conductivity of disentangled UHMWPE films has not yet been realized.
I Introduction
Thermally conductive polymers are of interest for fundamental materials science as well as applications such as thermal management Chen et al. (2016a); Mark (2007); Chen et al. (2016b); Prasher (2006); Wei et al. (2021); Huang et al. (2018). Although the thermal conductivity of unoriented polymers is generally less than 1 Wm-1K-1 Mark (2007), early works reported orders of magnitude increase in uniaxial thermal conductivity of oriented samples, including polyethylene (PE) Hansen and Bernier (1972); Burgess and Greig (1975), polyacetylene Piraux et al. (1989), and polypropylene Choy and Greig (1977); Choy et al. (1980). In particular, the reported thermal conductivity of oriented polyethylene ranged from 14 Wm-1K-1 Choy et al. (1978) for draw ratio up to 40 Wm-1K-1 for solution processed PE with a DR of 350 Choy et al. (1999). The enhancement was attributed to various mechanisms including increased chain alignment along the drawing direction Hansen and Bernier (1972); Liu et al. (2015), phonon focusing in the elastically anisotropic crystalline phase Pietralla et al. (1989); Mergenthaler and Pietralla (1994), and increased crystallinity Gibson et al. (1977); Choy et al. (1978). Recently, thermal conductivity values around Wm-1K-1 and Wm-1K-1 have been reported in PE microfibers Liu et al. (2015); Wang et al. (2013) and nanofibers Shen et al. (2010); Shrestha et al. (2018), respectively. In macroscopic samples, the introduction of disentangled ultra-high molecular weight polyethylene (UHMWPE) films Rastogi et al. (2011, 2005) with higher crystallinities and less entangled amorphous regions compared to prior samples has led to reports of high thermal conductivities exceeding 60 Wm-1K-1 Ronca et al. (2017); Xu et al. (2019). Several recent studies have also reported high thermal conductivity up to 20 – 30 Wm-1K-1 in a diverse set of polymers besides PE, including polybenzobisoxazole Wang et al. (2013), polyethylene oxide Lu et al. (2017), and amorphous polythiophene Singh et al. (2014).
Knowledge of the structural changes that occur upon drawing from nascent PE aid in identifying the origin of the high thermal conductivity values, and extensive studies have characterized the atomic and nanoscale structure of PE films at different DR. The nascent structure consists of spherulites Bunn and Alcock (1945) which are in turn composed of unoriented stacked lamella in which folded chains are bridged by intra- and inter-lamella tie molecules Keller (1968). The initial crystalline fraction is on the order of %, as measured using nuclear magnetic resonance (NMR) Wilson III and Pake (1953) or heat capacity measurements Peterlin and Meinel (1965), and from SAXS the crystalline domains have long periods nm Fischer and Schmidt (1962); KOBAYASHI and KUROKAWA (1962); Yeh and Geil (1967) with the corresponding size of the crystalline domain inside the unit being around 90% of the long period Geil et al. (1964). On drawing, Peterlin proposed a sequence of processes occur in which stacked lamella transition to micro-fibrils and eventually to chain-extended crystals Peterlin (1971). More precisely, on initial drawing, the lamellae begin to align and a crystalline micro-fibril structure bridged by amorphous domains or tie molecules emerges as the lamellae are fragmented. Subsequently, for the micro-fibrils aggregate with concurrent tautening of the tie-molecules and marginal changes in the crystallinity. Finally, for , chain extension leads to an extended crystal phase formed from the aggregated micro-fibrils and tie-molecules. The density of states and dispersion of atomic vibrations in the crystalline phase have been characterized by various inelastic scattering techniques Danner et al. (1964); Safford and Naumann (1967); Holliday and White (1971); Feldkamp et al. (1968); Twisleton et al. (1982); Heyer et al. (1984); Mermet et al. (2003).
Experimental evidence in support of the above picture has been obtained using various techniques such as transmission electron microscopy (TEM) Smith et al. (1985); Brady and Thomas (1989), SAXS Van Aerle and Braam (1988), wide angle x-ray scattering (WAXS) Van Aerle and Braam (1988), and NMR Hu and Schmidt-Rohr (2000); Litvinov et al. (2011), among others Magonov et al. (1993); Heyer et al. (1984). For instance, the formation of the micro-fibrils via lamellae fragmentation is consistent with a lack of a clear trend of crystallite size with DR for DR Zubov et al. (1992); Van Aerle and Braam (1988). The subsequent unfolding and tautening of tie-molecules along with the aggregation of microfibrils is consistent with an initial rapid increase in crystallinity, elastic modulus and orientation factor with DR below DR 20 Anandakumaran et al. (1988) followed by a marginal increase of only a few percent up to DR as large as 200 Anandakumaran et al. (1988); Van Aerle and Braam (1988); Stein and Norris (1956). Evidence for the existence of extended crystal was obtained using various complementary methods such as SAXS and WAXS Litvinov et al. (2011); Zubov et al. (1992); Tang et al. (2007), TEM Brady and Thomas (1989); Smith et al. (1985), and NMR Hu and Schmidt-Rohr (2000). These various techniques indicated that the diameter of the extended crystal is nm and of longitudinal dimension around 100 – 250 nm or greater Litvinov et al. (2011).
Morphological changes under drawing identified from the above structural studies have provided insight into origin of increase in thermal conductivity. Below DR , the uniaxial thermal conductivity is observed to monotonically increase with DR Choy et al. (1980, 1993). Various effective-medium type models have been proposed to interpret this increase in terms of changes in the crystallinity and crystalline orientation Hennig (1967); Choy and Young (1977); Takayanagi et al. (1964). Although these models are generally successful in explaining measured thermal conductivity data, the actual transport processes may differ from those assumed by effective medium theory because of the presence of phonons that are ballistic over multiple crystallites. Evidence of such processes has been reported even in partially oriented PE samples with low DR using transient grating spectroscopy (TG) Robbins et al. (2019).
For disentangled UHMWPE of DR , the increase in thermal conductivity is difficult to interpret using the above models because the thermal conductivity is observed to increase on average by factor of % despite a lack of detectable change in crystallinity or chain orientation Choy et al. (1978, 1980, 1999); Ronca et al. (2017); Xu et al. (2019). Conflicting explanations have been proposed to account for these observations. For instance, Xu et al. used the isotropic helix-coil model to conclude that the thermal conductivity of the amorphous phase () must be as high as 16 Wm-1K-1 to explain the high thermal conductivity for samples with DR Wm-1K-1 Xu et al. (2019). On the other hand, Ronca et al. used the same model to conclude that the high thermal conductivity for originates from the enlargement of the extended crystal dimensions Ronca et al. (2017). The discrepancy is difficult to resolve by bulk thermal conductivity measurements because the properties of the crystalline and amorphous phases cannot be independently measured. As a result, the physical origin of the high thermal conductivity of disentangled UHMWPE remains unclear.
Here, we report measurements of the thermal conductivity and mean free path accumulation function of disentangled UHMWPE films (DR ) using cryogenic thermal conductivity measurements and transient grating spectroscopy. The thermal conductivity exhibits a marked grating dependence, indicating the presence of ballistic heat-carrying atomic vibrations over the length scale of a grating period. We interpret the TG and cryogenic thermal conductivity measurements using an anisotropic Debye model that describes heat transport by longitudinal atomic vibrations. The analysis indicates that the heat is nearly entirely carried by this branch, with values of the temperature-independent mean free paths being around 400 nm up to several THz. Comparing these results to those of our prior study of disentangled UHMWPE films of lower DR, we find that the high thermal conductivity for DR can be attributed to the presence of enlarged extended crystals. As the phonon MFPs appear to be limited by the dimensions of the extended crystals, our study suggests that disentangled UHMWPE films with higher thermal conductivity may be realized in samples with larger extended crystals.
II Experiment
 \phantomsubcaption\phantomsubcaption
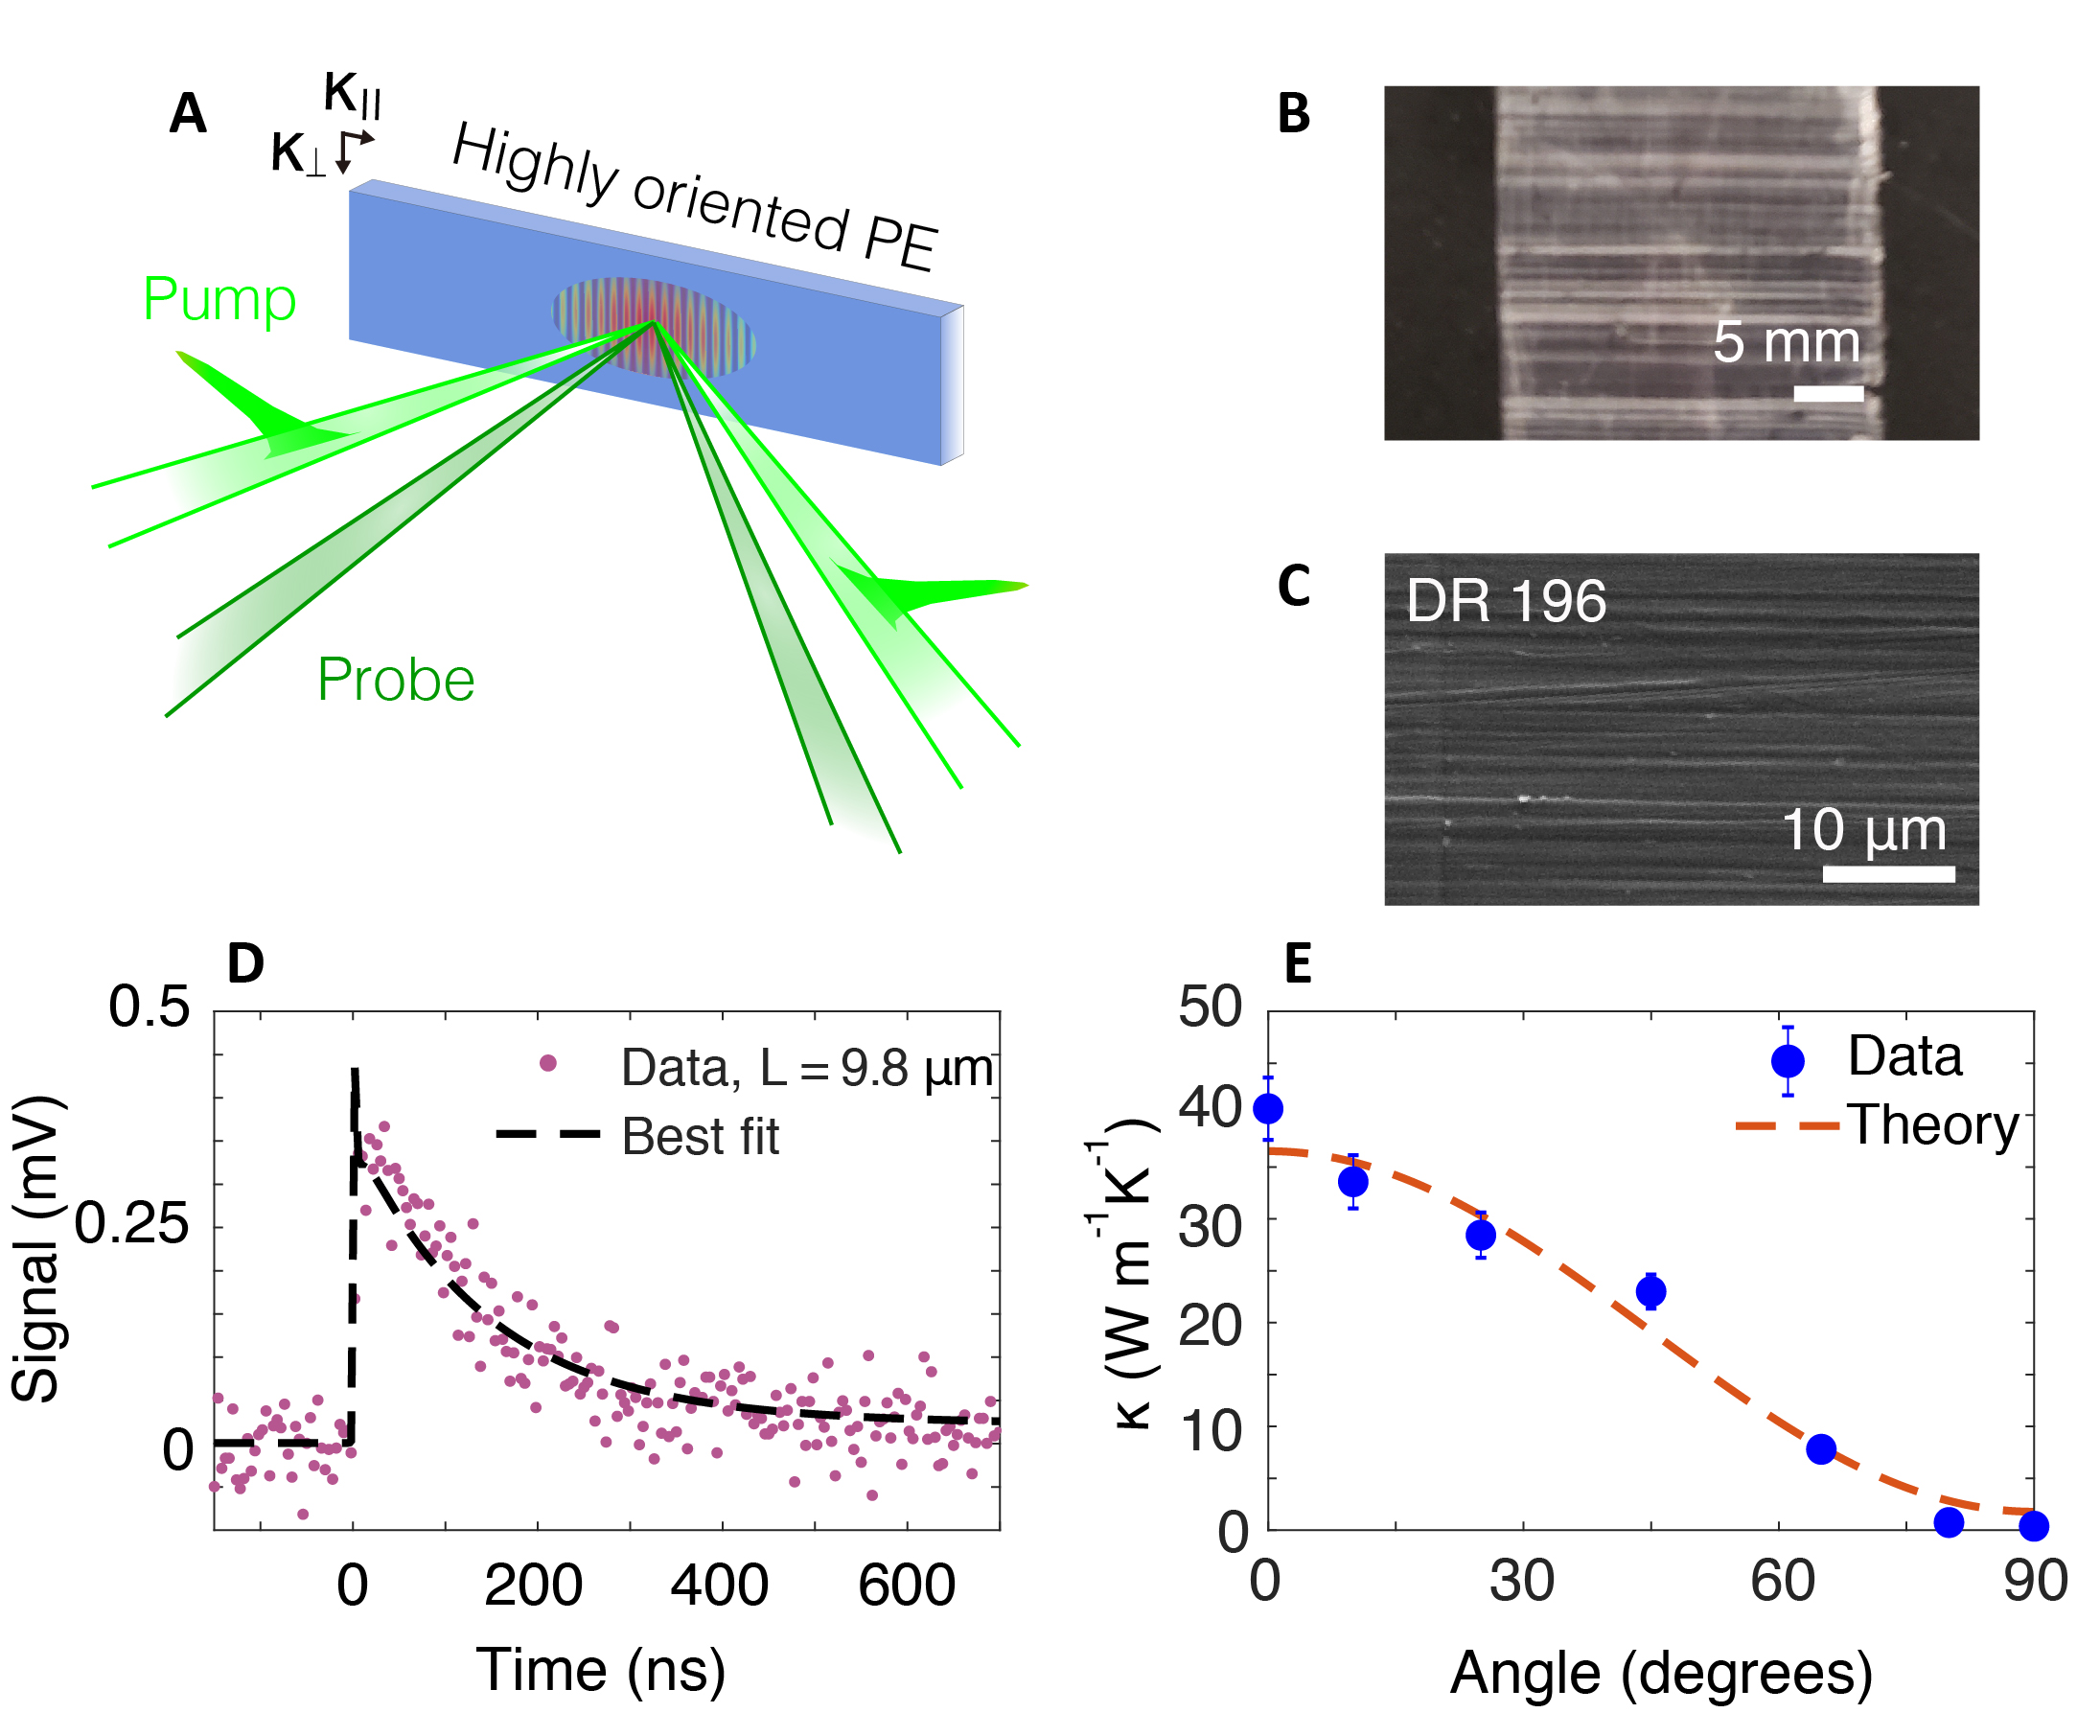
We measured the in-plane thermal conductivity of disentangled UHMWPE films using TG, as schematically illustrated in Fig. 1. The TG setup is identical to that described in Ref. Robbins et al. (2019). Briefly, a pair of pump pulses (wavelength 515 nm, beam diameter 530 m, pulse duration 1 ns, pulse energy 13 J, repetition rate 200 Hz) is focused onto the sample to impulsively create a spatially sinusoidal temperature rise of period and wave vector . The grating relaxes by heat conduction, and its decay is monitored by the heterodyne measurement of a diffracted CW signal beam and reference probe beam (wavelength 532 nm, beam diameter 470 m, CW power 900 W, chopped at 3.2 % duty cycle to reduce steady heating on the sample). The samples are disentangled UHMWPE films synthesized using the same procedure given in Ref. Rastogi et al. (2011), but with higher draw ratio () achieved by rolling () and stretching (). Figure 1 shows an optical image of the film that is of centimeter scale dimension laterally and of thickness around 30 micrometers, as measured using calipers. A scanning electron microscope (SEM) image is given in Fig. 1. In both images, highly oriented fibers extending over tens of microns are visible. Since PE is transparent to visible light, Au nanoparticles (diameter: nm Drakopoulos et al. (2020); concentration: 1 wt%) were added as an optical absorber. The concentration of the Au was selected to minimize the effect of the filler on the thermal conductivity while enabling the formation of a thermal grating on the sample Robbins et al. (2019). Experimental characterization of similar samples using polarized light microscopy, among other methods, indicates that the nanoparticles are oriented in linear chains in the amorphous regions. Drakopoulos et al. (2020)
A representative TG signal measured at grating period is shown in Fig. 1. As described in the Supporting Information of Ref. Robbins et al. (2019), the signal consists of an initially fast decay (time constant ns) followed by a slower decay (time constant ns). The initial fast decay is attributed to the thermal relaxation of the Au nanoparticles, while the subsequent slower decay corresponds to thermal conduction in the film. Following the procedure in Ref. Robbins et al. (2019), we fit the signal with a multi-exponential function; the time constant of the slower decay yields the thermal diffusivity of the sample. Because the initial signal from the nanoparticles exhibits a short time constant compared to their thermal signal, the influence of the nanoparticle signal on the fitted thermal diffusivity is negligible. The signal-to-noise ratio (SNR) of the present measurements is generally less than 20, which is about 30% of that reported in Ref. Robbins et al. (2019) for samples . This decrease is because the highly oriented samples scatter visible light intensely owing to the increased inhomogeneity over length scales comparable to the optical wavelength, as evidenced by AFM images perpendicular to the fiber alignment direction (see Supplementary Material Sec. 4). Nevertheless, TG is able to measure the thermal signal with adequate SNR because only the diffracted signal due to the spatial refractive index profile at the grating wave vector is measured, and the scattered light intercepted by the detector that does not arise from diffraction can be subtracted from the final signal using a heterodyning procedure Johnson et al. (2013). The thermal conductivity was calculated from the measured thermal diffusivity using the heat capacities of linear PE in Ref. Chang (1974).
The in-plane thermal conductivity versus angle between the fiber alignment direction and the thermal gradient is shown in Fig. 1. The thermal conductivity is 40 Wm-1K-1 at 0° (, parallel to grating), and decreases to 0.4 Wm-1K-1 at 90° (, perpendicular to grating). The value along the draw direction is in reasonable agreement with that obtained on a sample without Au nanoparticles using the laser flash method Ronca et al. (2017). The value of Wm-1K-1 is close to that of unoriented PE, which is attributed to the heat conduction by interchain van der Waals interactions Choy (1977). The angle-dependent thermal conductivity was fitted by a geometric model Zolotoyabko (2011) with the thermal conductivity along the two principal directions as input. Good agreement between the model and the data is observed.
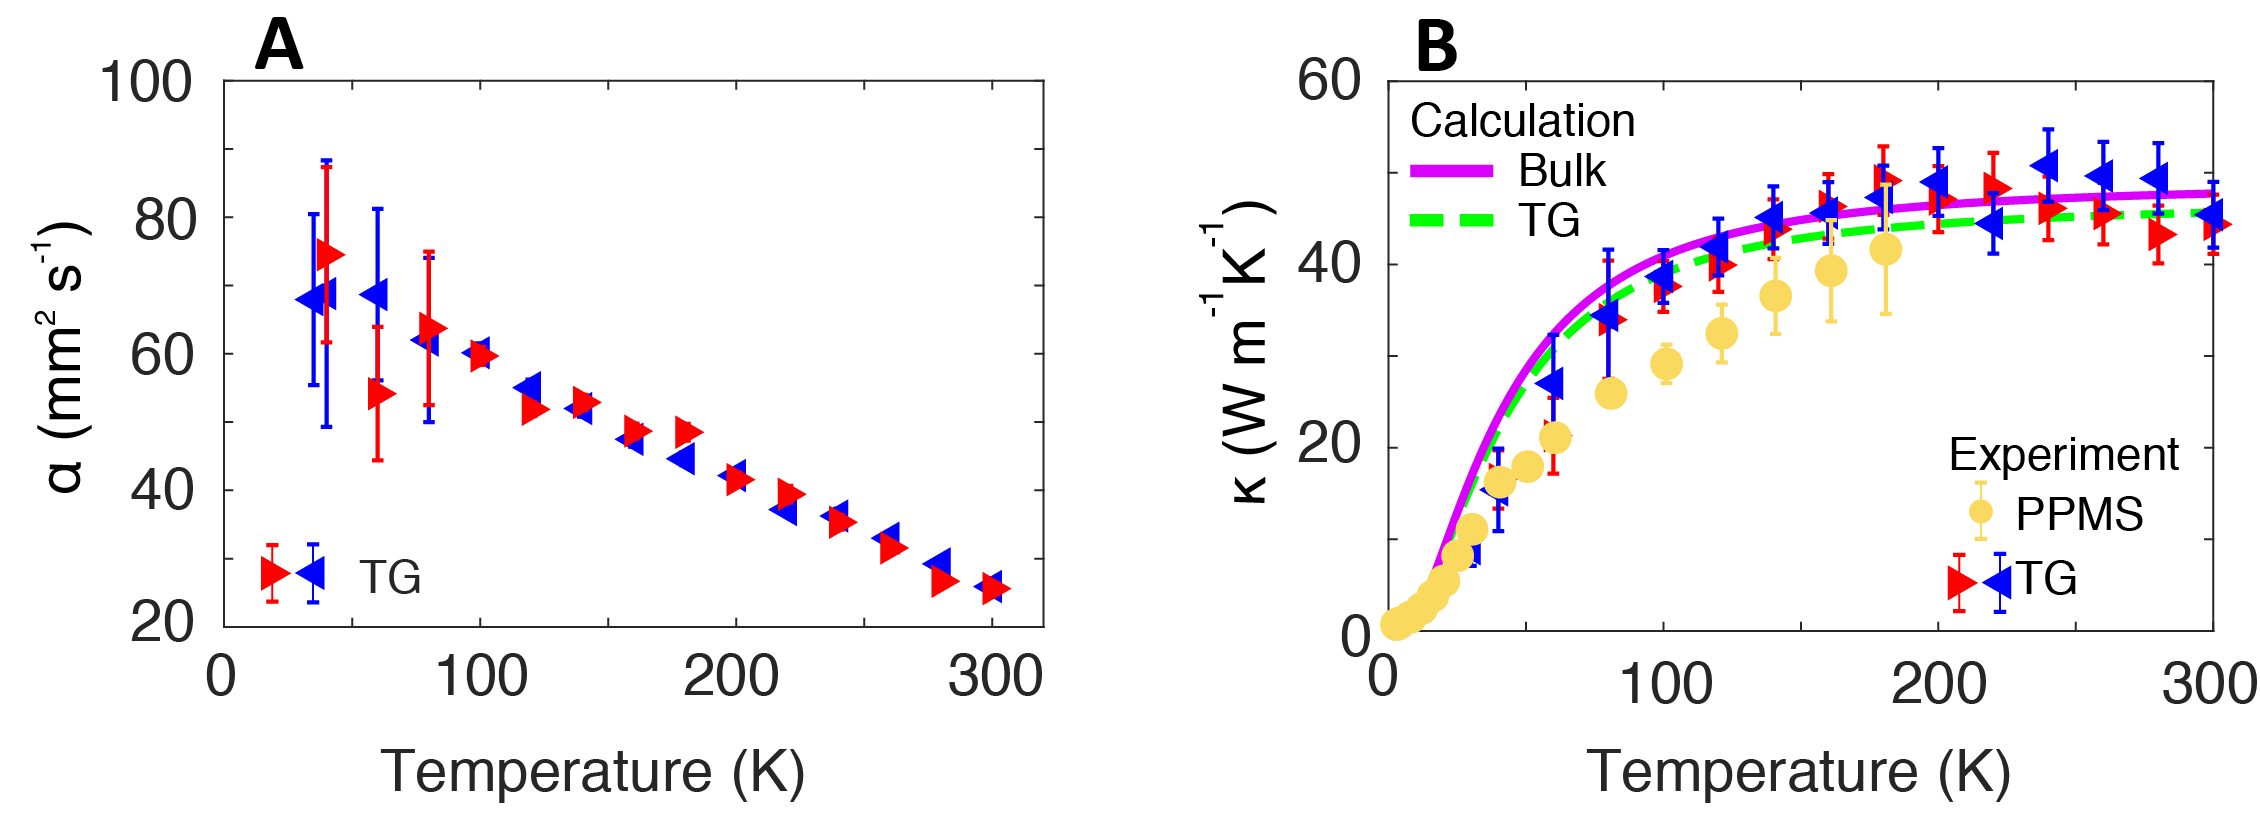
The thermal transport properties can be further examined by measuring the temperature dependence of the thermal diffusivity and conductivity. The bulk thermal diffusivity along the chain direction versus temperature obtained from TG with micrometers between 30 – 300 K is shown in Fig. 2. The diffusivity exhibits a linearly increasing trend with decreasing temperature, a qualitatively similar trend as that reported in microscale crystalline fibers Liu et al. (2015). The corresponding versus temperature is shown in Fig. 2. Within the uncertainty of the measurement, the thermal conductivity remains constant from room temperature to K, below which the thermal conductivity decreases.
The macroscopic dimensions of the present samples permits additional characterization of the thermal conductivity down to K using a Physical Property Measurement System (PPMS) (See Supplementary Material Sec. 3 for further details). The results are shown in Fig. 2. The measured values and the trend of the bulk thermal conductivity are consistent with that obtained from TG. The cryogenic thermal conductivity values on a logarithmic scale are given in Fig. 3. The values exhibit two distinct temperature dependencies with a transition at around 10 K.
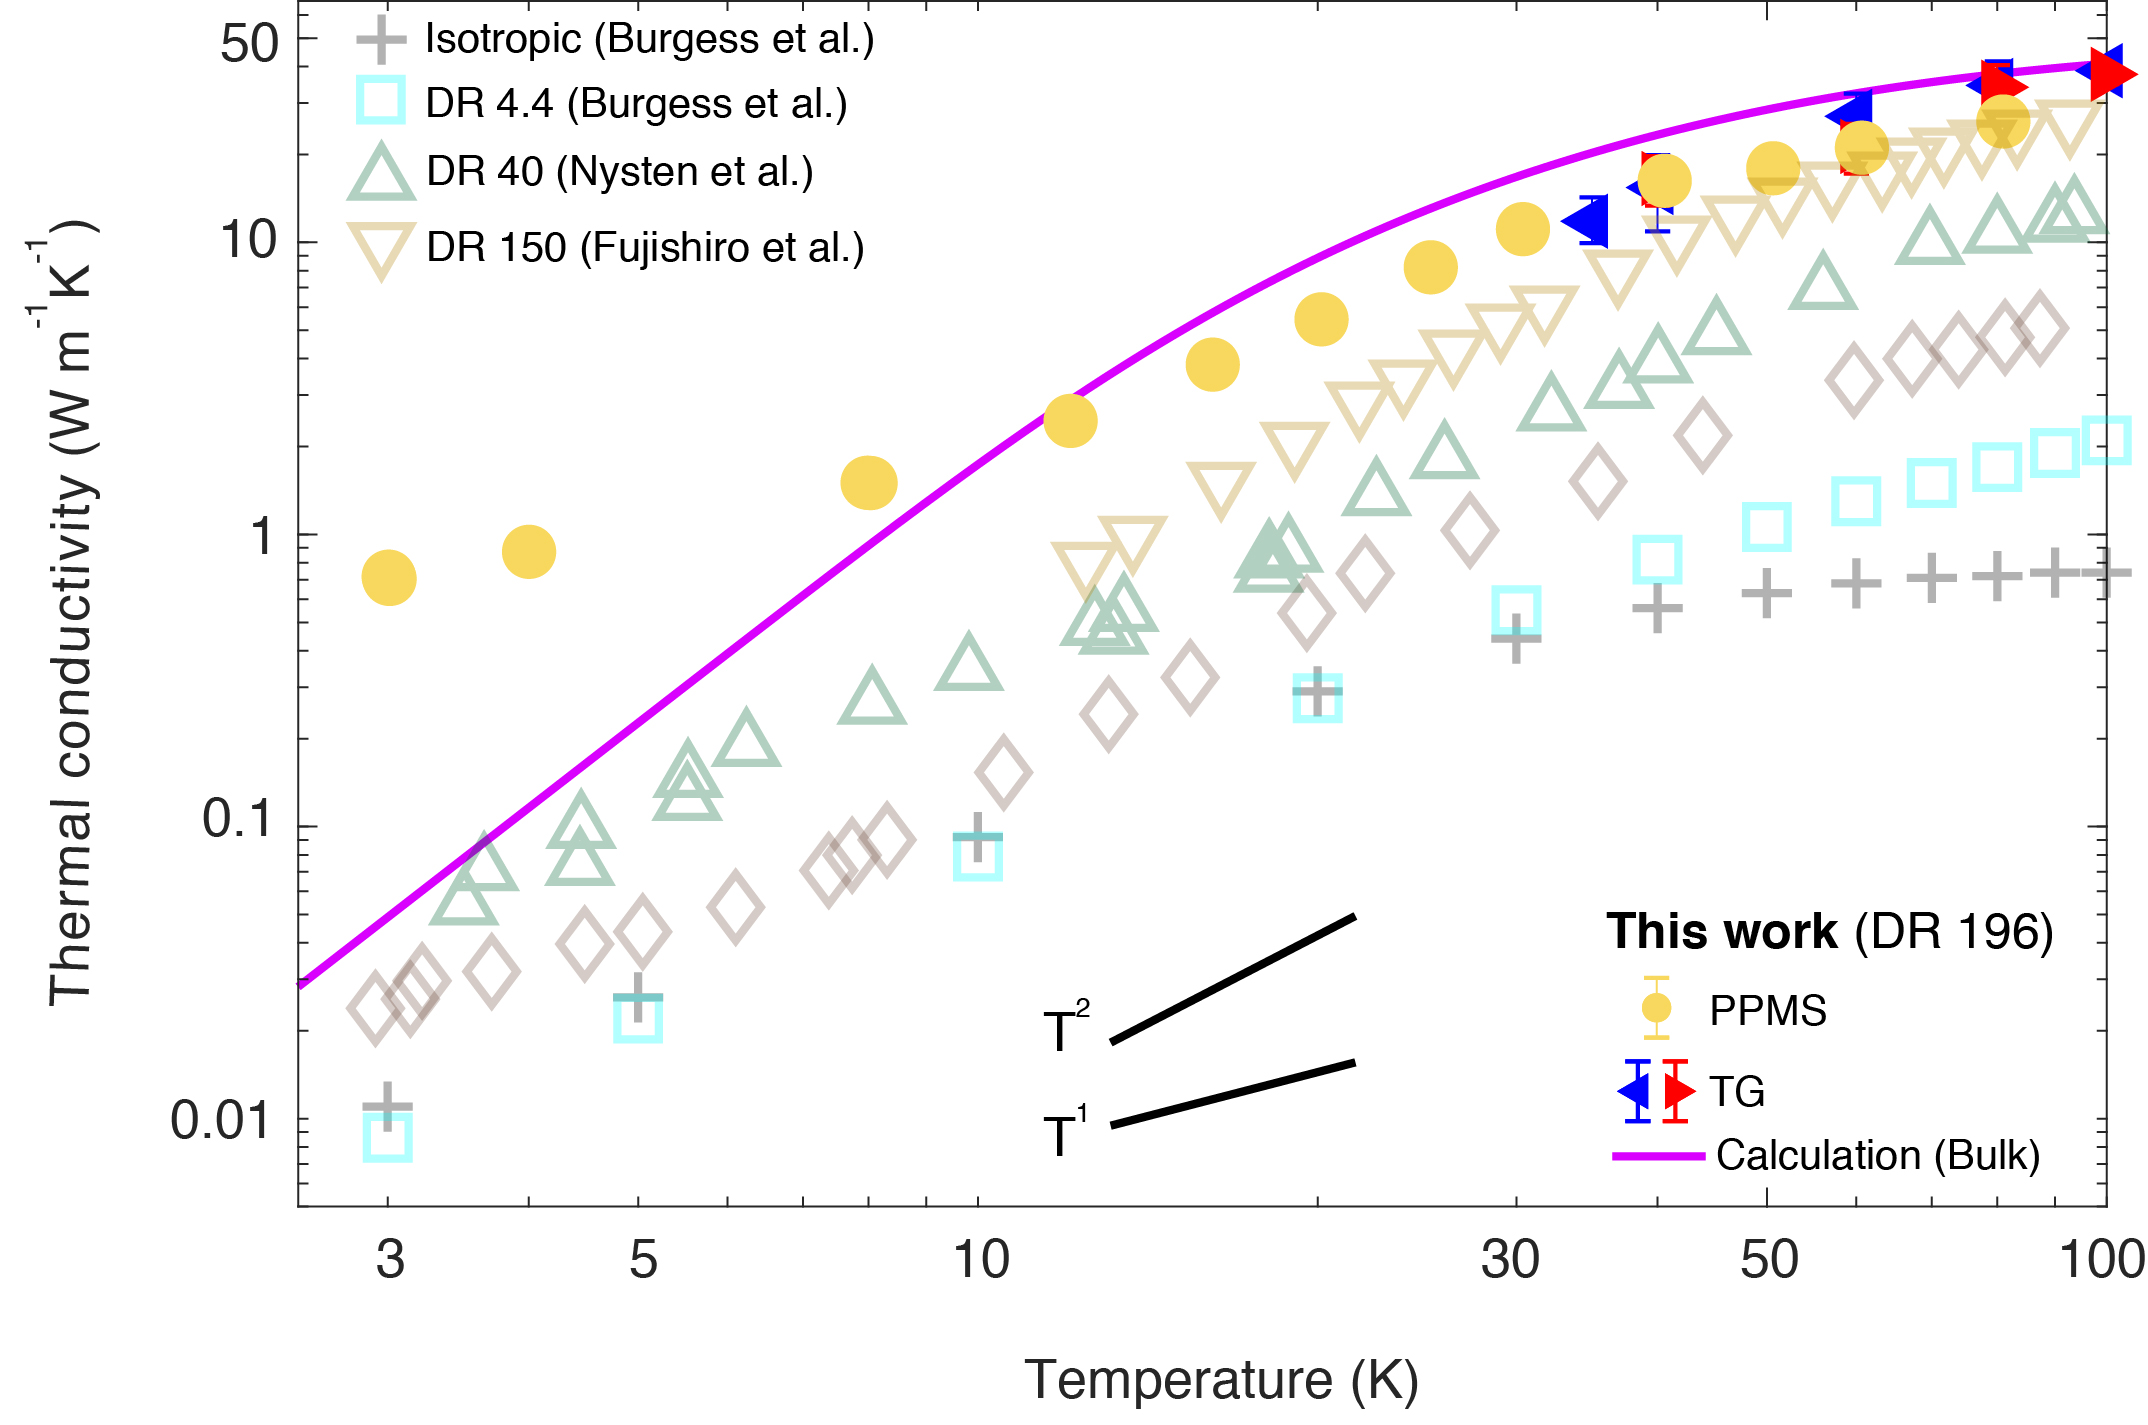
The temperature dependence of the thermal diffusivity and conductivity provides insight into the origin of the high thermal conductivity in the present samples. First, the thermal diffusivity is observed to depend on temperature, ruling out a constant relaxation time for all phonon polarizations as suggested in Ref. Shrestha et al. (2018). Second, the measured trend of thermal conductivity versus temperature is consistent with structural scattering being the dominant scattering mechanism. Above 10 K, the trend is generally consistent with those of previously reported data on PE films of various DR as shown in Fig. 3, although the thermal conductivity of the present sample is consistently higher. Below 10 K, a weaker trend with temperature is observed compared those exhibited by other samples in the same temperature range. This difference may be due to the disentangled nature of the present sample compared to prior solution-cast films and will be the topic of future study. Third, within the uncertainty of the measurements, the measured bulk thermal conductivity is in reasonable agreement with the TG data for , indicating phonon mean free paths are shorter than micrometers Minnich (2012).
 \phantomsubcaption\phantomsubcaption\phantomsubcaption
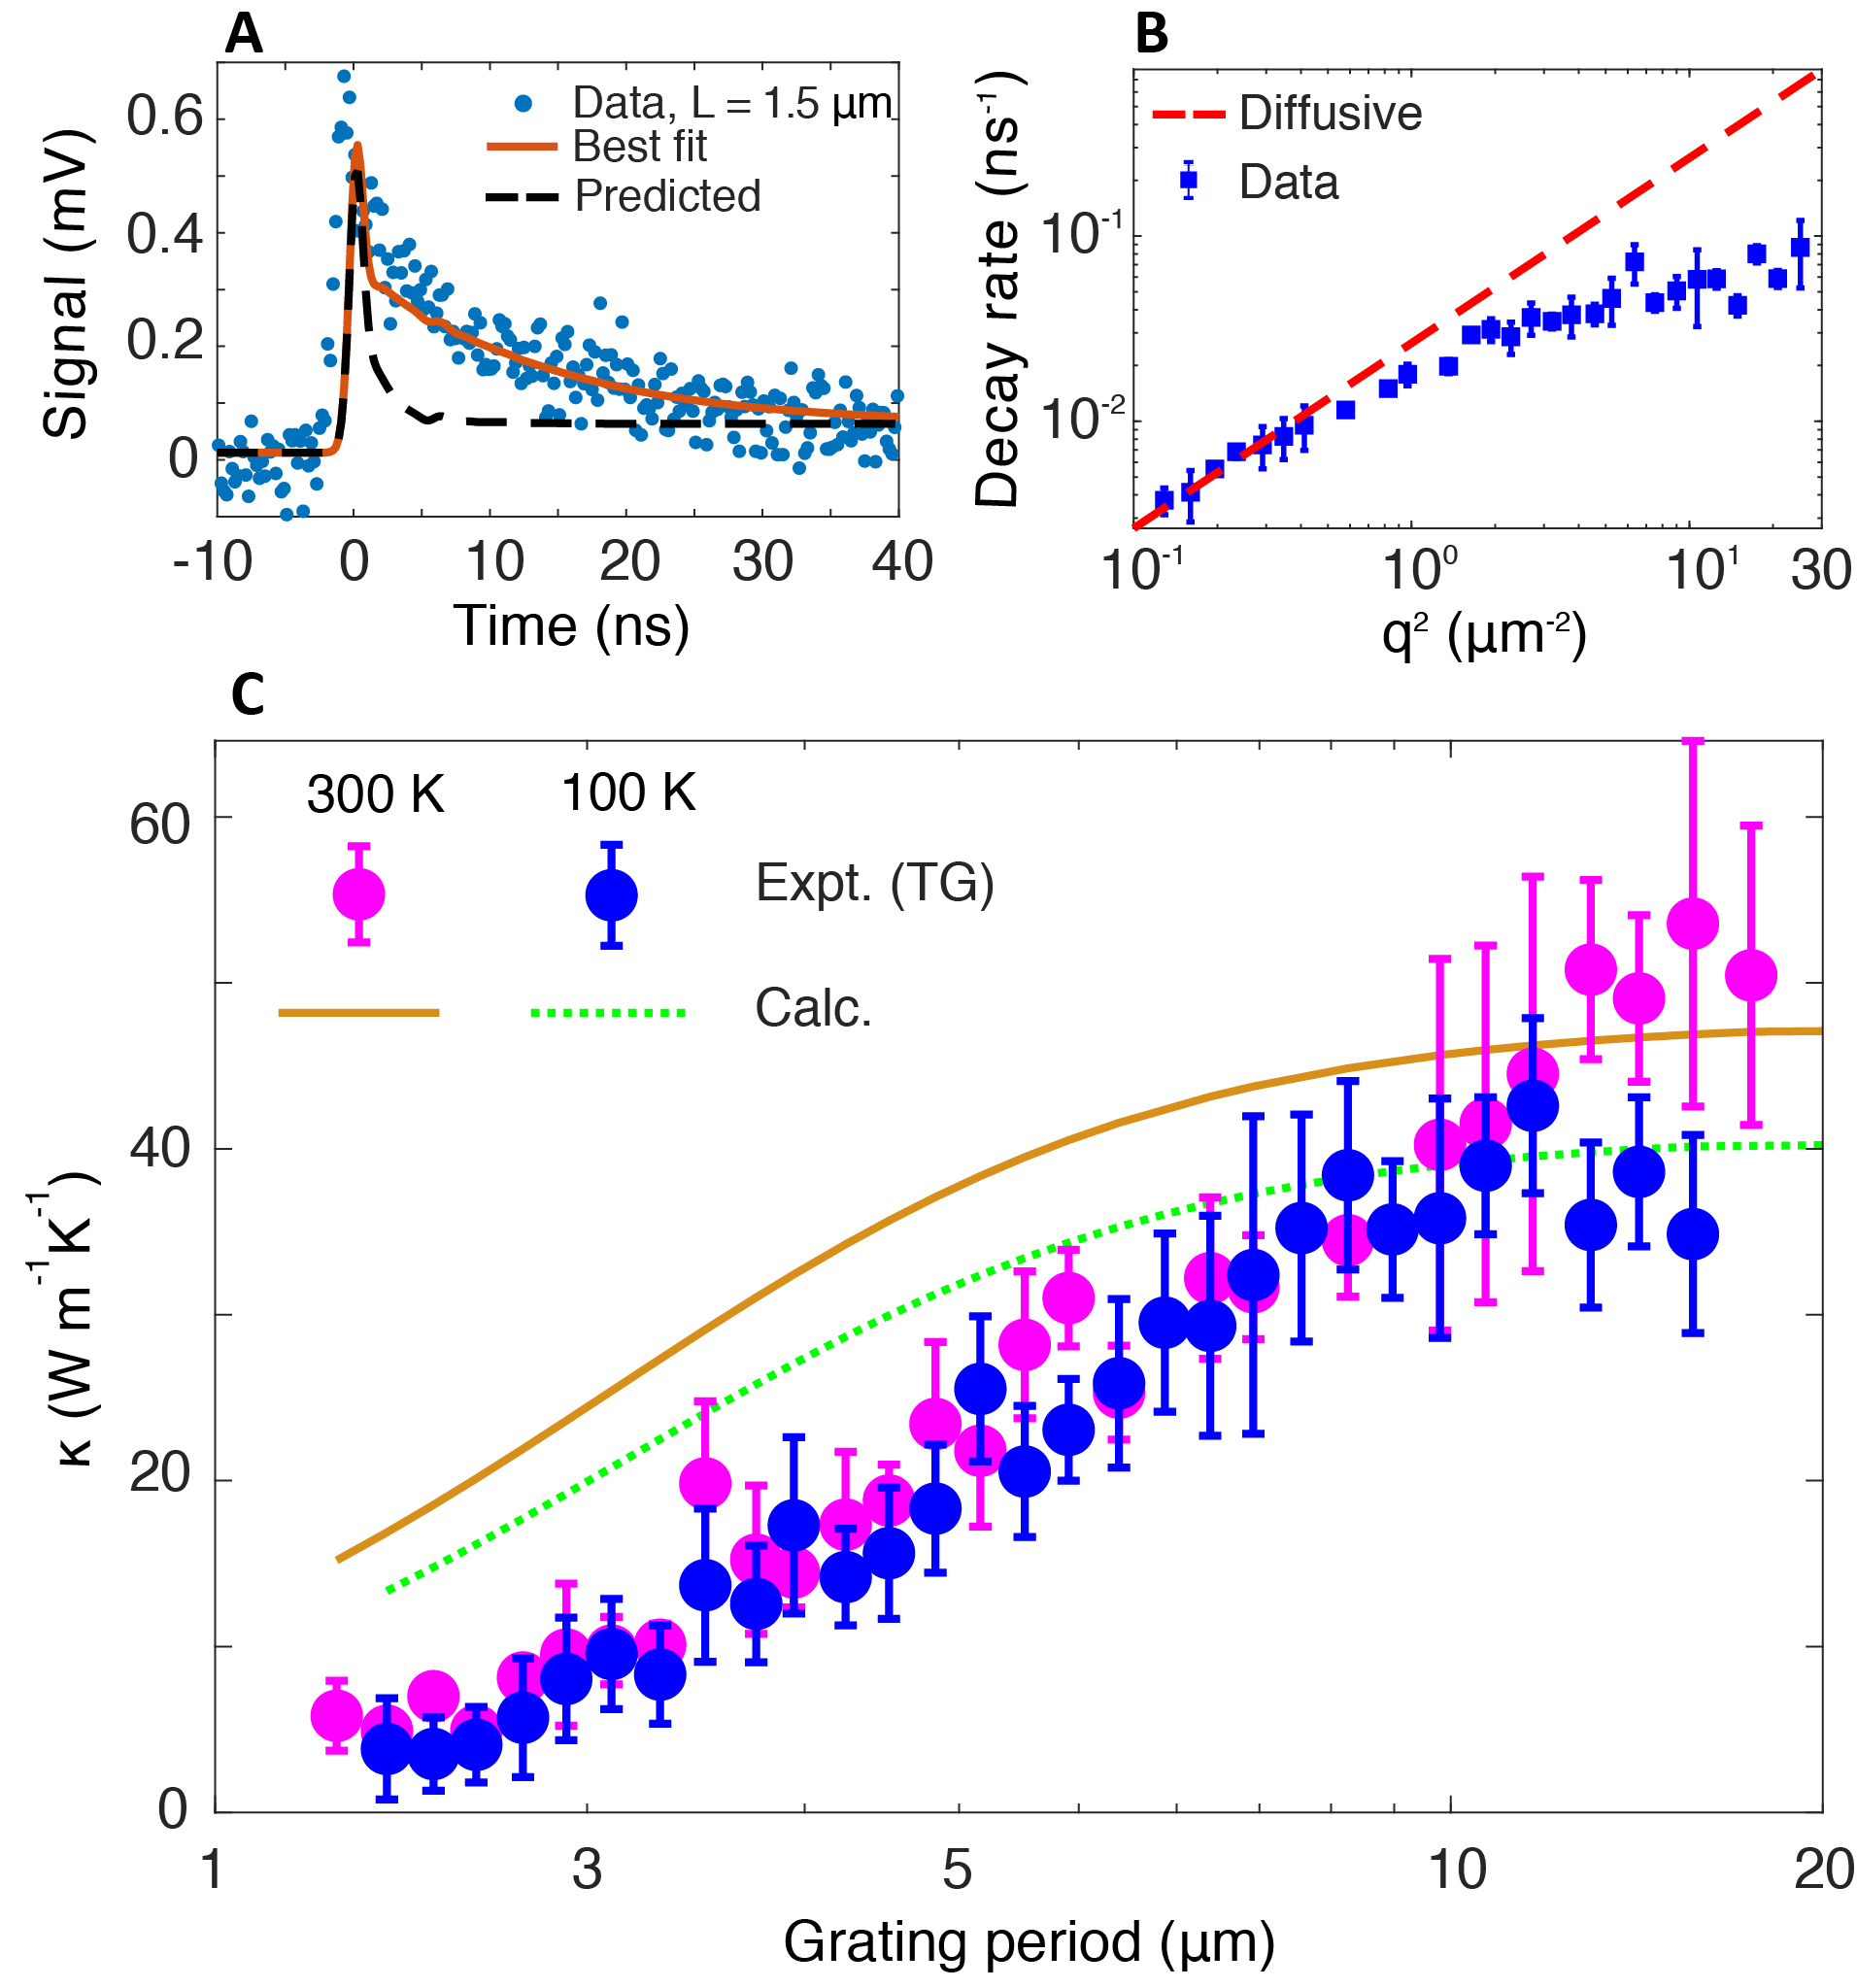
Despite these constraints from the temperature-dependent bulk thermal transport properties, the microscopic properties of the heat-carrying atomic vibrations remain underdetermined. To gain further insight, we exploited the ability of TG to systematically vary the induced thermal gradient over micrometer length scales by tuning the grating period. If heat-carrying phonons propagate ballistically over the grating period, the thermal decay is slower than that predicted from the bulk thermal conductivity Johnson et al. (2013); Minnich (2012). We have previously used this approach to identify ballistic phonons over nanocrystalline domains in disentangled UHMWPE samples of lower DR Robbins et al. (2019).
We apply this approach to the present samples, measuring the thermal conductivity along the chain axis versus grating period at temperatures of 300 K, 220 K, 100 K, and 35 K. The measured TG signal for a grating period of is shown in the inset of Fig 4. The decay is clearly slower than expected based on the bulk thermal conductivity value, indicating the presence of ballistic phonons on the length scale of the grating period. Measurements of the decay rate versus for all the grating periods at 300 K are given in Fig. 4. The measured decay rate is close to that predicted by the bulk thermal conductivity at , above which the decay rate is slower by up to a factor of 5 at the smallest grating period.
The corresponding thermal conductivity versus grating period at 300 K and 100 K is shown in Fig. 4. The thermal conductivity exhibits a marked dependence on grating period up to m, a value comparable to that observed in other covalent crystals with higher thermal conductivity such as silicon Ravichandran et al. (2018); Johnson et al. (2013). Compared to PE samples of lower DR Robbins et al. (2019), the observed trend is significantly more pronounced, indicating the presence of heat-carrying phonons with longer MFPs in the present samples. The observed grating dependence lacks a clear temperature dependence for the temperatures considered here (see Supplementary Material Sec. 3 for additional data). This finding indicates the dominance of the structural scattering, consistent with the trend of the bulk thermal conductivity versus temperature in Fig 2.
III Low energy Debye model
We now construct a model to interpret the measurements in Figs 2, 3, and 4. We begin by noting that Fig. 4 indicates that phonons with MFPs on the order of hundreds of nanometers carry the majority of the heat. Phonons with such long MFPs are likely from the LA branch owing to its high group velocity km s-1 Mermet et al. (2003); Holliday and White (1971); Twisleton et al. (1982); Feldkamp et al. (1968); Pietralla (1996). Therefore, the marked dependence of grating period in Fig. 4 implies that nearly all heat is carried by the LA branch. Further, the grating-period dependent thermal conductivity in Fig. 4 does not exhibit a temperature dependence, indicating that the MFPs are independent of temperature. We therefore construct an anisotropic Debye model Bowman and Krumhansl (1958); Chen et al. (2013) for the heat conducted by this branch and use the data to constrain the frequency-dependence of the LA branch relaxation time. The marked elastic anisotropy of PE can be accounted for to good approximation by assuming the group velocities all point along the chain axis Pietralla et al. (1989). Therefore, the thermal conductivity measured in TG () can be expressed as
| (1) |
where , , is the anisotropic phonon suppression function for an arbitrary phonon dispersion Minnich (2015), and refer to the heat capacity terms in Eq. 11b of Ref. Chen et al. (2013).
We now specify the numerical values for this model. The c-axis velocity of the longitudinal polarization is km s-1 Holliday and White (1971); Feldkamp et al. (1968); Twisleton et al. (1982). The velocity along a perpendicular crystal axis was reported as km s-1 Holliday and White (1971) from inelastic neutron scattering and km s-1 from an ab-initio calculation Shulumba et al. (2017) which may be reflective of the monocrystals present in disentangled UHMWPE Rastogi et al. (2011). We roughly estimate km s-1. We consider to be a characteristic frequency at which the -axis longitudinal velocity decreases below the Debye velocity and ultimately tends towards zero. Roughly, we estimate THz; the analysis below is not sensitive to this choice. This choice then determines THz. The corresponding maximum wave vector magnitude is Å-1.
We now seek to identify the function that best explains the temperature and grating dependence of the thermal conductivity. To constrain the MFP function, we note that at THz, the magnitude of the MFP can be estimated using the dominant phonon approximation Zeller and Pohl (1971) and the cryogenic thermal conductivity measurements in Fig 3. We use the cryogenic thermal conductivity at around 12 K, the minimum temperature that is still on the trend of the thermal conductivity. We find nm at THz, where Wm-1K-1 and Jcm-3K-1 is the computed heat capacity of the longitudinal branch at 12 K.
We now consider various MFP profiles versus frequency that yield the best agreement with the experiments in Figs. 2, 3, and 4 by adjusting the MFP profile subject to the above constraint. After extensive comparison, we found that the best fit is obtained using a constant nm up to THz, beyond which the MFP decreases as , although similar power laws also yield reasonable agreement. (See Supplementary Material Sec. 3 for further details on results using other candidate profiles).
The resulting computed bulk thermal conductivity using this profile is presented in Figs. 2 and 3. In Fig. 2, the bulk thermal conductivity exhibits qualitative agreement with the measurements, producing the observed magnitude and trend. The calculated thermal conductivity in TG with m is close to bulk value, consistent with the good agreement between the TG and PPMS measurements. The grating period dependence of the thermal conductivity is also qualitatively reproduced by the calculation in Fig. 4, and Fig. S2 in Supplementary Material Sec. 2, although quantitative disrepancies exist.
The calculated cryogenic thermal conductivity is shown in Fig. 3. Although a similar qualitative trend is observed above K, the agreement is worse below this temperature. This discrepancy could be attributed to heat conduction by other types of atomic vibrations which may make the primary contribution to thermal conductivity below K.
IV Discussion
We now discuss our findings in context with prior studies of thermal conduction in oriented PE films. We first consider the MFP value of nm for frequencies in the THz range. For frequencies around 1 THz, prior values inferred from literature data using the dominant phonon approximation at cryogenic temperatures are nm using Wm-1K-1 for DR 40 Nysten et al. (1995), as estimated using LA specific heat of Jcm-3K-1 at 10 K using the model described above. This value is comparable to an estimated value of nm for DR 6 at 10 K Mergenthaler and Pietralla (1994). At higher frequencies THz, IXS has been used to obtain a MFP of nm for DR 5.5 Mermet et al. (2003), which is in reasonable agreement with the values inferred from transport studies. The MFPs obtained from TG measurements on a DR 7.5 sample in our previous study ranged from 10 - 200 nm Robbins et al. (2019). All of these values are comparable to but distinctly smaller than the present value, expected as the present samples exhibit higher thermal conductivity. The decrease in MFP at frequencies exceeding THz is also consistent with the increase in broadening reported in IXS Mermet et al. (2003), although this increase occurred at higher frequencies in their data.
An average MFP for all LA phonons of nm was estimated from a study of PE microfibers Wang et al. (2013). This value is considerably smaller than those above; as noted in that work, this value is an underestimate owing to the use of the total heat capacity which is greater than that of the longitudinal polarization only. Finally, an ab-initio study of PE predicted MFPs of up to 200 nm Shulumba et al. (2017). This prediction thus appears to be an underestimate and is likely due to insufficient grid density to sample the stiff LA branch. This observation implies that the predicted thermal conductivity in that work is also an underestimate of the upper limit of thermal conductivity in crystalline PE.
Our findings help to explain the origin of high thermal conductivity in disentangled UHMWPE films. Recent studies have provided conflicting explanations for the high thermal conductivity, with Xu et al. Xu et al. (2019) attributing it to the high thermal conductivity of the amorphous phase Robbins et al. (2019) but Ronca et al. Ronca et al. (2017) attributing it to increased extended crystal dimensions. Our data and analysis are consistent with the latter explanation. Compared to the MFPs of a DR 7.5 sample in our prior study,Robbins et al. (2019) the present MFPs are clearly larger, as would be expected if the extended crystal dimensions have increased. The MFPs in both samples exhibit a clear maximum in the low THz frequencies and are independent of temperature, suggesting phonon scattering is predominantly due to reflections at crystalline domain boundaries. Further, evidence exists for the presence of extended crystals with length on the order of hundreds of nanometers from NMR and TEM Hu and Schmidt-Rohr (2000); Litvinov et al. (2011); Brady and Thomas (1989), values that are compatible with the MFPs obtained here. We infer that heat conduction in disentangled UHMWPE is primarily due to longitudinal atomic vibrations that are ballistic within the extended crystal phase, scattered primarily by reflections at the boundaries between the crystals. Our results therefore support the hypothesis of Ref. Ronca et al. (2017) in which the high thermal conductivity compared to the prediction including only crystallinity and anisotropy factors for DR (Fig. 7 in Ref. Ronca et al. (2017)) was attributed to the enlargement of extended crystal dimensions.
Finally, we discuss the implications of our findings for realizing PE films of higher thermal conductivity. Because the MFPs appear to be limited by the size of the extended crystals, our study indicates that the thermal conductivity of PE films has not yet reached its upper limit. The practical challenge is synthesizing disentangled UHMWPE films with larger extended crystal dimensions. Such films would be expected to have higher thermal conductivity of an amount proportional to the increase in crystalline dimension.
V Summary
In summary, we have characterized the thermal conductivity and mean free path accumulation function of disentangled UHMWPE films with draw ratio of nearly 200 at various temperatures. We find that heat in PE films is nearly entirely carried by longitudinal atomic vibrations with MFPs in the sub-micron range and limited by the dimensions of the extended crystal phase. The high thermal conductivity at exceeding the expected value considering orientation and crystallinity can be attributed to increased dimensions of the extended crystals. Considering the MFPs appear to remain limited by extended crystal dimensions, our work indicates that the thermal conductivity of disentangled UHMWPE films has not yet reached its upper limit.
Acknowledgements.
The authors thank Bolin Liao and Wenkai Ouyang for assistance with PPMS measurements. This work was supported by the Office of Naval Research under Grant Number N00014-18-1-2101.References
- Chen et al. [2016a] Hongyu Chen, Valeriy V. Ginzburg, Jian Yang, Yunfeng Yang, Wei Liu, Yan Huang, Libo Du, and Bin Chen. Thermal conductivity of polymer-based composites: Fundamentals and applications. Progress in Polymer Science, 59:41–85, August 2016a. ISSN 00796700. doi: 10.1016/j.progpolymsci.2016.03.001. URL https://linkinghub.elsevier.com/retrieve/pii/S0079670016000216.
- Mark [2007] James E. Mark, editor. Physical Properties of Polymers Handbook. Springer-Verlag, New York, 2 edition, 2007. ISBN 978-0-387-31235-4. doi: 10.1007/978-0-387-69002-5. URL https://www.springer.com/gp/book/9780387312354.
- Chen et al. [2016b] Xiangjie Chen, Yuehong Su, David Reay, and Saffa Riffat. Recent research developments in polymer heat exchangers – a review. Renewable and Sustainable Energy Reviews, 60:1367–1386, 2016b. ISSN 1364-0321. doi: https://doi.org/10.1016/j.rser.2016.03.024. URL https://www.sciencedirect.com/science/article/pii/S1364032116002598.
- Prasher [2006] R. Prasher. Thermal interface materials: Historical perspective, status, and future directions. Proceedings of the IEEE, 94(8):1571–1586, 2006. doi: 10.1109/JPROC.2006.879796.
- Wei et al. [2021] Xingfei Wei, Zhi Wang, Zhiting Tian, and Tengfei Luo. Thermal Transport in Polymers: A Review. Journal of Heat Transfer, 143(7), 04 2021. ISSN 0022-1481. doi: 10.1115/1.4050557. URL https://doi.org/10.1115/1.4050557. 072101.
- Huang et al. [2018] Congliang Huang, Xin Qian, and Ronggui Yang. Thermal conductivity of polymers and polymer nanocomposites. Materials Science and Engineering: R: Reports, 132:1–22, 2018. ISSN 0927-796X. doi: https://doi.org/10.1016/j.mser.2018.06.002. URL https://www.sciencedirect.com/science/article/pii/S0927796X1830113X.
- Hansen and Bernier [1972] D. Hansen and G. A. Bernier. Thermal conductivity of polyethylene: The effects of crystal size, density and orientation on the thermal conductivity. Polymer Engineering & Science, 12(3):204–208, 1972. doi: 10.1002/pen.760120308. URL https://onlinelibrary.wiley.com/doi/abs/10.1002/pen.760120308.
- Burgess and Greig [1975] S Burgess and D Greig. The low-temperature thermal conductivity of polyethylene. Journal of Physics C: Solid State Physics, 8(11):1637–1648, jun 1975. doi: 10.1088/0022-3719/8/11/015. URL https://doi.org/10.1088/0022-3719/8/11/015.
- Piraux et al. [1989] L Piraux, M Kinany-Alaoui, J. P Issi, D Begin, and D Billaud. Thermal conductivity of an oriented polyacetylene film. Solid State Communications, 70(4):427–429, March 1989. ISSN 0038-1098. doi: 10.1016/0038-1098(89)91073-9. URL http://www.sciencedirect.com/science/article/pii/0038109889910739.
- Choy and Greig [1977] C L Choy and D Greig. The low temperature thermal conductivity of isotropic and oriented polymers. Journal of Physics C: Solid State Physics, 10(2):169–179, jan 1977. doi: 10.1088/0022-3719/10/2/005. URL https://doi.org/10.1088/0022-3719/10/2/005.
- Choy et al. [1980] C. L. Choy, F. C. Chen, and W. H. Luk. Thermal conductivity of oriented crystalline polymers. Journal of Polymer Science: Polymer Physics Edition, 18(6):1187–1207, 1980. doi: 10.1002/pol.1980.180180603. URL https://onlinelibrary.wiley.com/doi/abs/10.1002/pol.1980.180180603.
- Choy et al. [1978] C. L Choy, W. H Luk, and F. C Chen. Thermal conductivity of highly oriented polyethylene. Polymer, 19(2):155–162, February 1978. ISSN 0032-3861. doi: 10.1016/0032-3861(78)90032-0. URL http://www.sciencedirect.com/science/article/pii/0032386178900320.
- Choy et al. [1999] C. L. Choy, Y. W. Wong, G. W. Yang, and Tetsuo Kanamoto. Elastic modulus and thermal conductivity of ultradrawn polyethylene. Journal of Polymer Science Part B: Polymer Physics, 37(23):3359–3367, 1999. ISSN 1099-0488. doi: 10.1002/(SICI)1099-0488(19991201)37:23¡3359::AID-POLB11¿3.0.CO;2-S. URL https://onlinelibrary.wiley.com/doi/abs/10.1002/%28SICI%291099-0488%2819991201%2937%3A23%3C3359%3A%3AAID-POLB11%3E3.0.CO%3B2-S.
- Liu et al. [2015] Jing Liu, Zaoli Xu, Zhe Cheng, Shen Xu, and Xinwei Wang. Thermal conductivity of ultrahigh molecular weight polyethylene crystal: Defect effect uncovered by 0 k limit phonon diffusion. ACS Applied Materials & Interfaces, 7(49):27279–27288, 2015. doi: 10.1021/acsami.5b08578. URL https://doi.org/10.1021/acsami.5b08578. PMID: 26593380.
- Pietralla et al. [1989] M. Pietralla, R. M. Weeger, and D. B. Mergenthaler. The role of phonon focussing and structure scattering in oriented semicrystalline polymers. Zeitschrift für Physik B Condensed Matter, 77(2):219–228, Jun 1989. ISSN 1431-584X. doi: 10.1007/BF01313666. URL https://doi.org/10.1007/BF01313666.
- Mergenthaler and Pietralla [1994] D. B. Mergenthaler and M. Pietralla. Heat conduction in highly oriented polyethylene. Zeitschrift für Physik B Condensed Matter, 94(4):461–468, 1994. doi: 10.1007/BF01317408. URL https://doi.org/10.1007/BF01317408.
- Gibson et al. [1977] A. G. Gibson, D. Greig, M. Sahota, I. M. Ward, and C. L. Choy. Thermal conductivity of ultrahigh-modulus polyethylene. Journal of Polymer Science: Polymer Letters Edition, 15(4):183–192, 1977. doi: 10.1002/pol.1977.130150401. URL https://onlinelibrary.wiley.com/doi/abs/10.1002/pol.1977.130150401.
- Wang et al. [2013] Xiaojia Wang, Victor Ho, Rachel A. Segalman, and David G. Cahill. Thermal conductivity of high-modulus polymer fibers. Macromolecules, 46(12):4937–4943, 2013. doi: 10.1021/ma400612y. URL https://doi.org/10.1021/ma400612y.
- Shen et al. [2010] Sheng Shen, Asegun Henry, Jonathan Tong, Ruiting Zheng, and Gang Chen. Polyethylene nanofibres with very high thermal conductivities. Nature Nanotechnology, 5(4):251–255, April 2010. ISSN 1748-3395. doi: 10.1038/nnano.2010.27. URL https://www.nature.com/articles/nnano.2010.27.
- Shrestha et al. [2018] Ramesh Shrestha, Pengfei Li, Bikramjit Chatterjee, Teng Zheng, Xufei Wu, Zeyu Liu, Tengfei Luo, Sukwon Choi, Kedar Hippalgaonkar, Maarten P. de Boer, and Sheng Shen. Crystalline polymer nanofibers with ultra-high strength and thermal conductivity. Nature Communications, 9(1):1–9, April 2018. ISSN 2041-1723. doi: 10.1038/s41467-018-03978-3. URL https://www.nature.com/articles/s41467-018-03978-3.
- Rastogi et al. [2011] Sanjay Rastogi, Yefeng Yao, Sara Ronca, Johan Bos, and Joris van der Eem. Unprecedented high-modulus high-strength tapes and films of ultrahigh molecular weight polyethylene via solvent-free route. Macromolecules, 44(14):5558–5568, 2011. doi: 10.1021/ma200667m. URL https://doi.org/10.1021/ma200667m.
- Rastogi et al. [2005] Sanjay Rastogi, Dirk R. Lippits, Gerrit W. M. Peters, Robert Graf, Yefeng Yao, and Hans W. Spiess. Heterogeneity in polymer melts from melting of polymer crystals. Nature Materials, 4(8):635–641, Aug 2005. ISSN 1476-4660. doi: 10.1038/nmat1437. URL https://doi.org/10.1038/nmat1437.
- Ronca et al. [2017] Sara Ronca, Tamito Igarashi, Giuseppe Forte, and Sanjay Rastogi. Metallic-like thermal conductivity in a lightweight insulator: Solid-state processed Ultra High Molecular Weight Polyethylene tapes and films. Polymer, 123:203–210, August 2017. ISSN 0032-3861. doi: 10.1016/j.polymer.2017.07.027. URL http://www.sciencedirect.com/science/article/pii/S0032386117306869.
- Xu et al. [2019] Yanfei Xu, Daniel Kraemer, Bai Song, Zhang Jiang, Jiawei Zhou, James Loomis, Jianjian Wang, Mingda Li, Hadi Ghasemi, Xiaopeng Huang, Xiaobo Li, and Gang Chen. Nanostructured polymer films with metal-like thermal conductivity. Nature Communications, 10(1):1–8, April 2019. ISSN 2041-1723. doi: 10.1038/s41467-019-09697-7. URL https://www.nature.com/articles/s41467-019-09697-7.
- Lu et al. [2017] Chenhao Lu, Sum Wai Chiang, Hongda Du, Jia Li, Lin Gan, Xing Zhang, Xiaodong Chu, Youwei Yao, Baohua Li, and Feiyu Kang. Thermal conductivity of electrospinning chain-aligned polyethylene oxide (peo). Polymer, 115:52 – 59, 2017. ISSN 0032-3861. doi: https://doi.org/10.1016/j.polymer.2017.02.024. URL http://www.sciencedirect.com/science/article/pii/S0032386117301477.
- Singh et al. [2014] Virendra Singh, Thomas L. Bougher, Annie Weathers, Ye Cai, Kedong Bi, Michael T. Pettes, Sally A. McMenamin, Wei Lv, Daniel P. Resler, Todd R. Gattuso, David H. Altman, Kenneth H. Sandhage, Li Shi, Asegun Henry, and Baratunde A. Cola. High thermal conductivity of chain-oriented amorphous polythiophene. Nature Nanotechnology, 9(5):384–390, 2014. doi: 10.1038/nnano.2014.44. URL https://doi.org/10.1038/nnano.2014.44.
- Bunn and Alcock [1945] C. W. Bunn and T. C. Alcock. The texture of polythene. Trans. Faraday Soc., 41:317–325, 1945. doi: 10.1039/TF9454100317. URL http://dx.doi.org/10.1039/TF9454100317.
- Keller [1968] A Keller. Polymer crystals. Reports on Progress in Physics, 31(2):623–704, jul 1968. doi: 10.1088/0034-4885/31/2/304. URL https://doi.org/10.1088/0034-4885/31/2/304.
- Wilson III and Pake [1953] C. W. Wilson III and G. E. Pake. Nuclear magnetic resonance determination of degree of crystallinity in two polymers. Journal of Polymer Science, 10(5):503–505, 1953. doi: https://doi.org/10.1002/pol.1953.120100508. URL https://onlinelibrary.wiley.com/doi/abs/10.1002/pol.1953.120100508.
- Peterlin and Meinel [1965] A. Peterlin and G. Meinel. Heat content of amorphous regions of drawn linear polyethylne. Journal of Polymer Science Part B: Polymer Letters, 3(9):783–787, 1965. doi: https://doi.org/10.1002/pol.1965.110030919. URL https://onlinelibrary.wiley.com/doi/abs/10.1002/pol.1965.110030919.
- Fischer and Schmidt [1962] E. W. Fischer and G. F. Schmidt. Long periods in drawn polyethylene. Angewandte Chemie International Edition in English, 1(9):488–499, 1962. doi: https://doi.org/10.1002/anie.196204881. URL https://onlinelibrary.wiley.com/doi/abs/10.1002/anie.196204881.
- KOBAYASHI and KUROKAWA [1962] K. KOBAYASHI and M. KUROKAWA. Small-angle diffraction of polyethylene. Nature, 196(4854):538–539, Nov 1962. ISSN 1476-4687. doi: 10.1038/196538a0. URL https://doi.org/10.1038/196538a0.
- Yeh and Geil [1967] G. S. Y. Yeh and P. H. Geil. Selected-area small-angle electron diffraction. Journal of Materials Science, 2(5):457–469, Sep 1967. ISSN 1573-4803. doi: 10.1007/BF00562952. URL https://doi.org/10.1007/BF00562952.
- Geil et al. [1964] Phillip H. Geil, Franklin R. Anderson, Bernhard Wunderlich, and Tamio Arakawa. Morphology of polyethylene crystallized from the melt under pressure. Journal of Polymer Science Part A: General Papers, 2(8):3707–3720, 1964. doi: https://doi.org/10.1002/pol.1964.100020829. URL https://onlinelibrary.wiley.com/doi/abs/10.1002/pol.1964.100020829.
- Peterlin [1971] A. Peterlin. Molecular model of drawing polyethylene and polypropylene. Journal of Materials Science, 6(6):490–508, Jun 1971. ISSN 1573-4803. doi: 10.1007/BF00550305. URL https://doi.org/10.1007/BF00550305.
- Danner et al. [1964] H. R. Danner, H. Boutin, and G. J. Safford. Low‐frequency molecular vibrations in solid hexane by neutron inelastic scattering. The Journal of Chemical Physics, 41(11):3649–3650, 1964. doi: 10.1063/1.1725784. URL https://doi.org/10.1063/1.1725784.
- Safford and Naumann [1967] G. J. Safford and A. W. Naumann. Low frequency motions in polymers as measured by neutron inelastic scattering. In Fortschritte der Hochpolymeren-Forschung, pages 1–27, Berlin, Heidelberg, 1967. Springer Berlin Heidelberg. ISBN 978-3-540-34908-2.
- Holliday and White [1971] L. Holliday and J. W. White. The stiffness of polymers in relation to their structure:. Pure and Applied Chemistry, 26(3-4):545–582, 1971. doi: doi:10.1351/pac197126030545. URL https://doi.org/10.1351/pac197126030545.
- Feldkamp et al. [1968] L. A. Feldkamp, G. Venkataraman, and J. S. King. Dispersion Relation for Skeletal Vibrations in Deuterated Polyethylene. IAEA, International Atomic Energy Agency (IAEA), 1968. URL http://inis.iaea.org/search/search.aspx?orig_q=RN:44068946.
- Twisleton et al. [1982] J.F Twisleton, J.W White, and P.A Reynolds. Dynamical studies of fully oriented deuteropolyethylene by inelastic neturon scattering. Polymer, 23(4):578–588, 1982. ISSN 0032-3861. doi: https://doi.org/10.1016/0032-3861(82)90097-0. URL https://www.sciencedirect.com/science/article/pii/0032386182900970.
- Heyer et al. [1984] D. Heyer, U. Buchenau, and M. Stamm. Determination of elastic shear constants of polyethylene at room temperature by inelastic neutron scattering. Journal of Polymer Science: Polymer Physics Edition, 22(8):1515–1527, 1984. doi: https://doi.org/10.1002/pol.1984.180220814. URL https://onlinelibrary.wiley.com/doi/abs/10.1002/pol.1984.180220814.
- Mermet et al. [2003] A. Mermet, L. David, M. Lorenzen, and M. Krisch. Inelastic x-ray scattering from stretch-oriented polyethylene. The Journal of Chemical Physics, 119(3):1879–1884, 2003. doi: 10.1063/1.1579681. URL https://doi.org/10.1063/1.1579681.
- Smith et al. [1985] Paul Smith, Alain Boudet, and Henri Chanzy. The structure of ultradrawn high molecular weight polyethylene revealed by electron microscopy at 100 and 1500 kV. Journal of Materials Science Letters, 4(1):13–18, January 1985. ISSN 0261-8028, 1573-4811. doi: 10.1007/BF00719883. URL http://link.springer.com/10.1007/BF00719883.
- Brady and Thomas [1989] Jean M. Brady and Edwin L. Thomas. Conversion of single crystal mats to ultrahigh modulus polyethylene: the formation of a continuous crystalline phase. Polymer, 30(9):1615 – 1622, 1989. ISSN 0032-3861. doi: https://doi.org/10.1016/0032-3861(89)90320-0. URL http://www.sciencedirect.com/science/article/pii/0032386189903200.
- Van Aerle and Braam [1988] N. A. J. M. Van Aerle and A. W. M. Braam. A structural study on solid state drawing of solution-crystallized ultra-high molecular weight polyethylene. Journal of Materials Science, 23(12):4429–4436, 1988. doi: 10.1007/BF00551941. URL https://doi.org/10.1007/BF00551941.
- Hu and Schmidt-Rohr [2000] W.-G Hu and K Schmidt-Rohr. Characterization of ultradrawn polyethylene fibers by nmr: crystallinity, domain sizes and a highly mobile second amorphous phase. Polymer, 41(8):2979 – 2987, 2000. ISSN 0032-3861. doi: https://doi.org/10.1016/S0032-3861(99)00429-2. URL http://www.sciencedirect.com/science/article/pii/S0032386199004292.
- Litvinov et al. [2011] V. M. Litvinov, Jianjun Xu, C. Melian, D. E. Demco, M. Möller, and J. Simmelink. Morphology, chain dynamics, and domain sizes in highly drawn gel-spun ultrahigh molecular weight polyethylene fibers at the final stages of drawing by saxs, waxs, and 1h solid-state nmr. Macromolecules, 44(23):9254–9266, 2011. doi: 10.1021/ma201888f. URL https://doi.org/10.1021/ma201888f.
- Magonov et al. [1993] S. N. Magonov, S. S. Sheiko, R. A. C. Deblieck, and M. Moller. Atomic-force microscopy of gel-drawn ultrahigh-molecular-weight polyethylene. Macromolecules, 26(6):1380–1386, 1993. doi: 10.1021/ma00058a029. URL https://doi.org/10.1021/ma00058a029.
- Zubov et al. [1992] Y. A. Zubov, S. N. Chvalun, V. I. Selikhova, M. B. Konstantinopolskaya, and N. Ph. Bakeev. The structure of highly oriented high modulus polyethylene. Polymer Engineering & Science, 32(17):1316–1324, 1992. doi: 10.1002/pen.760321720. URL https://onlinelibrary.wiley.com/doi/abs/10.1002/pen.760321720.
- Anandakumaran et al. [1988] K. Anandakumaran, S. K. Roy, and R. St. John Manley. Drawing-induced changes in the properties of polyethylene fibers prepared by gelation/crystallization. Macromolecules, 21(6):1746–1751, 1988. doi: 10.1021/ma00184a036. URL https://doi.org/10.1021/ma00184a036.
- Stein and Norris [1956] Richard S. Stein and Forrest H. Norris. The x-ray diffraction, birefringence, and infrared dichroism of stretched polyethylene. Journal of Polymer Science, 21(99):381–396, 1956. doi: https://doi.org/10.1002/pol.1956.120219903. URL https://onlinelibrary.wiley.com/doi/abs/10.1002/pol.1956.120219903.
- Tang et al. [2007] Yujing Tang, Zhiyong Jiang, Yongfeng Men, Lijia An, Hans-Friedrich Enderle, Dieter Lilge, Stephan V. Roth, Rainer Gehrke, and Jens Rieger. Uniaxial deformation of overstretched polyethylene: In-situ synchrotron small angle x-ray scattering study. Polymer, 48(17):5125 – 5132, 2007. ISSN 0032-3861. doi: https://doi.org/10.1016/j.polymer.2007.06.056. URL http://www.sciencedirect.com/science/article/pii/S0032386107006313.
- Choy et al. [1993] C. L. Choy, Y. Fei, and T. G. Xi. Thermal conductivity of gel-spun polyethylene fibers. Journal of Polymer Science Part B: Polymer Physics, 31(3):365–370, 1993. doi: 10.1002/polb.1993.090310315. URL https://onlinelibrary.wiley.com/doi/abs/10.1002/polb.1993.090310315.
- Hennig [1967] Jürgen Hennig. Anisotropy and structure in uniaxially stretched amorphous high polymers. Journal of Polymer Science Part C: Polymer Symposia, 16(5):2751–2761, 1967. doi: 10.1002/polc.5070160528. URL https://onlinelibrary.wiley.com/doi/abs/10.1002/polc.5070160528.
- Choy and Young [1977] C.L. Choy and K. Young. Thermal conductivity of semicrystalline polymers — a model. Polymer, 18(8):769–776, 1977. ISSN 0032-3861. doi: https://doi.org/10.1016/0032-3861(77)90179-3. URL https://www.sciencedirect.com/science/article/pii/0032386177901793.
- Takayanagi et al. [1964] Motowo Takayanagi, Shinsaku Uemura, and Shunsuke Minami. Application of equivalent model method to dynamic rheo-optical properties of crystalline polymer. Journal of Polymer Science Part C: Polymer Symposia, 5(1):113–122, 1964. doi: 10.1002/polc.5070050111. URL https://onlinelibrary.wiley.com/doi/abs/10.1002/polc.5070050111.
- Robbins et al. [2019] Andrew B. Robbins, Stavros X. Drakopoulos, Ignacio Martin-Fabiani, Sara Ronca, and Austin J. Minnich. Ballistic thermal phonons traversing nanocrystalline domains in oriented polyethylene. Proceedings of the National Academy of Sciences, 116(35):17163–17168, August 2019. ISSN 0027-8424, 1091-6490. doi: 10.1073/pnas.1905492116. URL https://www.pnas.org/content/116/35/17163.
- Drakopoulos et al. [2020] Stavros X. Drakopoulos, Oreste Tarallo, Linlin Guan, Ignacio Martin-Fabiani, and Sara Ronca. Nanocomposites of au/disentangled uhmwpe: A combined optical and structural study. Molecules, 25(14), 2020. ISSN 1420-3049. doi: 10.3390/molecules25143225. URL https://www.mdpi.com/1420-3049/25/14/3225.
- Johnson et al. [2013] Jeremy A. Johnson, A. A. Maznev, John Cuffe, Jeffrey K. Eliason, Austin J. Minnich, Timothy Kehoe, Clivia M. Sotomayor Torres, Gang Chen, and Keith A. Nelson. Direct measurement of room-temperature nondiffusive thermal transport over micron distances in a silicon membrane. Phys. Rev. Lett., 110:025901, Jan 2013. doi: 10.1103/PhysRevLett.110.025901. URL https://link.aps.org/doi/10.1103/PhysRevLett.110.025901.
- Chang [1974] SS Chang. Heat capacities of polyethylene from 2 to 360 k. ii. two high density linear polyethylene samples and thermodynamic properties of crystalline linear polyethylene. J. Res. NBS A Phys. Chem, 3, 1974.
- Choy [1977] C.L. Choy. Thermal conductivity of polymers. Polymer, 18(10):984 – 1004, 1977. ISSN 0032-3861. doi: https://doi.org/10.1016/0032-3861(77)90002-7. URL http://www.sciencedirect.com/science/article/pii/0032386177900027.
- Zolotoyabko [2011] E. Zolotoyabko. Basic Concepts of Crystallography. Wiley, 2011. ISBN 9783527330096. URL https://books.google.com/books?id=eNdJYgEACAAJ. in page 195.
- Nysten et al. [1995] B. Nysten, P. Gonry, and J.-P. Issi. Intra-and interchain thermal conduction in polymers. Synthetic Metals, 69(1):67–68, 1995. ISSN 0379-6779. doi: https://doi.org/10.1016/0379-6779(94)02366-7. URL https://www.sciencedirect.com/science/article/pii/0379677994023667. Proceedings of the International Conference on Science and Technology of Synthetic Metals.
- Fujishiro et al. [1998] Hiroyuki Fujishiro, Manabu Ikebe, Toshihiro Kashima, and Atsuhiko Yamanaka. Drawing effect on thermal properties of high-strength polyethylene fibers. Japanese Journal of Applied Physics, 37(Part 1, No. 4A):1994–1995, apr 1998. doi: 10.1143/jjap.37.1994. URL https://doi.org/10.1143/jjap.37.1994.
- Minnich [2012] A. J. Minnich. Determining phonon mean free paths from observations of quasiballistic thermal transport. Phys. Rev. Lett., 109:205901, Nov 2012. doi: 10.1103/PhysRevLett.109.205901. URL https://link.aps.org/doi/10.1103/PhysRevLett.109.205901.
- Ravichandran et al. [2018] Navaneetha K. Ravichandran, Hang Zhang, and Austin J. Minnich. Spectrally resolved specular reflections of thermal phonons from atomically rough surfaces. Phys. Rev. X, 8:041004, Oct 2018. doi: 10.1103/PhysRevX.8.041004. URL https://link.aps.org/doi/10.1103/PhysRevX.8.041004.
- Pietralla [1996] M. Pietralla. High thermal conductivity of polymers: Possibility or dream? Journal of Computer-Aided Materials Design, 3(1):273–280, Aug 1996. ISSN 1573-4900. doi: 10.1007/BF01185664. URL https://doi.org/10.1007/BF01185664.
- Bowman and Krumhansl [1958] J.C. Bowman and J.A. Krumhansl. The low-temperature specific heat of graphite. Journal of Physics and Chemistry of Solids, 6(4):367–379, 1958. ISSN 0022-3697. doi: https://doi.org/10.1016/0022-3697(58)90055-6. URL https://www.sciencedirect.com/science/article/pii/0022369758900556.
- Chen et al. [2013] Z. Chen, Z. Wei, Y. Chen, and C. Dames. Anisotropic debye model for the thermal boundary conductance. Phys. Rev. B, 87:125426, Mar 2013. doi: 10.1103/PhysRevB.87.125426. URL https://link.aps.org/doi/10.1103/PhysRevB.87.125426.
- Minnich [2015] A. J. Minnich. Phonon heat conduction in layered anisotropic crystals. Phys. Rev. B, 91:085206, Feb 2015. doi: 10.1103/PhysRevB.91.085206. URL https://link.aps.org/doi/10.1103/PhysRevB.91.085206.
- Shulumba et al. [2017] Nina Shulumba, Olle Hellman, and Austin J. Minnich. Lattice thermal conductivity of polyethylene molecular crystals from first-principles including nuclear quantum effects. Phys. Rev. Lett., 119:185901, Oct 2017. doi: 10.1103/PhysRevLett.119.185901. URL https://link.aps.org/doi/10.1103/PhysRevLett.119.185901.
- Zeller and Pohl [1971] R. C. Zeller and R. O. Pohl. Thermal conductivity and specific heat of noncrystalline solids. Phys. Rev. B, 4:2029–2041, Sep 1971. doi: 10.1103/PhysRevB.4.2029. URL https://link.aps.org/doi/10.1103/PhysRevB.4.2029.