Abstract
In transition metal dichalcogenides (TMDCs), charge carriers have spin, pseudospin, and valley degrees of freedom associated with magnetic moments. The monolayers and bilayers of the TMDCs, in particular, MoS2, lead strong couplings between the spin and pseudospin effects. This feature have drawn attention to TMDCs for their potential use in advanced tech devices. Meanwhile, high-order harmonic generation (HHG) has recently been applied to the characterization of the electronic structure of solids, such as energy dispersion, Berry-curvature, and topological properties. Here, we show theoretical results obtained with the ‘philosophy’ of using HHG to investigate the structural effects of the monolayer and bilayers of MoS2 on nonlinear optical emission. We use a simple model for MoS2 in the 3R AB staking. We find that the pseudospin and valley indexes (the Berry curvature and the dipole transition matrix element) in TMDC driven by circularly polarized laser (CPL) can encode in the high energy photon emissions. This theoretical investigation is expected to pave the way for the ultrafast manipulation of valleytronics and lead to new questions concerning the spin-obit-coupling (SOC) effects on TMDC materials, Weyl Semimetals, and topological phases and transitions in topological insulators.
keywords:
high-order harmonic generation; transition metal dichalcogenides; pseudospin; Berry curvature; dipole transition matrix element; tight-binding model1 \issuenum1 \articlenumber0 \datereceived \dateaccepted \datepublished \hreflinkhttps://doi.org/ \TitleHigh harmonic generation in monolayer and bilayer of transition metal dichalcogenide \TitleCitationTitle \AuthorYeon Lee 1, Dasol Kim 1, Dong Eon Kim 1,∗ and Alexis Chacón 1 \AuthorNamesFirstname Lastname, Firstname Lastname and Firstname Lastname \AuthorCitationLastname, F.; Lastname, F.; Lastname, F. \corresCorrespondence: kimd@postech.ac.kr (D. E. Kim)
1 Introduction
Since high-order harmonics were first experimentally observed in ZnO Ghimire et al. (2011); Liu et al. (2017); Vampa et al. (2015), their potential in the nonlinear optical spectroscopy of solids has attracted the attention of ultrafast sciences and condensed matter physics Vampa et al. (2015); Itatani et al. (2004); Ghimire and Reis (2019); Amini et al. (2019).
The process of High-order Harmonic Generation (HHG) is a highly nonlinear phenomenon in the sense that an incoming middle infrared or infrared (MIR or IR) eV (with wavelength ) interacting with the solid produces a new spectrum, as a consequence of the optical responses of the lattice to the strong laser field (illustrated in Fig. 1) Vampa et al. (2014); Osika et al. (2017); Amini et al. (2019). The outgoing emission contain high energy photons, , regarding the fundamental driving laser, , where is typically an integer Kruchinin et al. (2018); Osika et al. (2017); Amini et al. (2019) (for a mathematically formal description, See Appendixes A and B). This paper explores the high-order harmonics emission from monolayer and bilayer of a typical TMDC such as MoS2.
The monolayer and bilayer crystalline structures of MoS2 are illustrated in Figs. 1(a) and 1(b), respectively Kormányos et al. (2018); Gong et al. (2013); Zhai and Blanter (2020). In the case of the bilayer, the stacking is featured by the AB type stacking which is so called 3R polytype Zhai and Blanter (2020). This means that the ‘S1’ atom of Layer1 interacts with an ‘empty space’ (dashed black link in Fig. 1(b)) of Layer2; and, the ‘Mo’ atom of Layer1 interacts with an orbital of ‘S2’ atom in Layer2. This is the nearest neighbour interaction between inter-layers. The interactions between the ‘Mo’ and ‘S’ atoms in different layers are mediated by the hopping parameter Kormányos et al. (2018); Gong et al. (2013) which is described in Section 2 and 3. The manipulation of monolayers, bilayer up to bulk TMDCs has been studied by several experimental and theoretical efforts using Angular Resolved Photoelectron-Energy Spectrum (ARPES) techniques Damascelli et al. (2003); Chiu et al. (2016). However, its complete characterization remains yet a downright challenging research field.
Returning to the key physical insight of HHG in solids, the simplified description of the HHG mechanism is depicted in Figs. 1(c) and 1(d) for both monolayer and bilayer MoS2 Gong et al. (2013). The accelerated carriers in the conduction (valence) band have two intrinsic mechanisms Vampa et al. (2014): intraband current and interband current. Note that our theory is subjected to the Keldysh approximation in which , where is the band gap of the crystal (See Appendix B). Thus, the interband mechanism of HHG can be interpreted in terms of three simple steps Vampa and Brabec (2017); Luu and Wörner (2018); Vampa et al. (2015): (i) at a time when the driving laser-field, , reaches its maximum, an electron-hole (e) and (h) pairs is created (see Figs. 1(c)-1(d)) by the action of the oscillating external electric field , (ii) between and , the e and h are accelerated or propagated under the quasi-classical action Eq. (11) in the bands of the MoS2 (See Appendixes A and B.2), gaining a ‘considerable’ amount of energy from the laser and bands, and simultaneously encoding rich information of the lattice structure in the crystal (see Fig. 1(a) and Fig. 1(b)) Vampa and Brabec (2017); Vampa et al. (2014, 2015); Luu and Wörner (2018); Chacón et al. (2020). ‘Finally’, (iii) after these e and h are accelerated on the Brillouin zone (BZ), the e and h can find a time at which they annihilate each other. Through the conservation of energy Vampa and Brabec (2017), this physical picture converts the accumulated e-h energy into a high energy photon with respect to the fundamental-laser as depicted in Figs. 1(c) and 1(d).
Surprisingly, this HHG process encodes rich information about the atomic structural, electron dynamics in the TMDCs. This opens the door to investigate fundamental questions and technological development such as symmetries of the Hamiltonian in the solids, the fermion-dynamics, the effects of the Berry curvature, pseudospin, spin-valley, topological phases and transitions Chacón et al. (2020); Baykusheva et al. (2021); Luu and Wörner (2018); Tancogne-Dejean et al. (2017); Baykusheva et al. ; Hasan and Kane (2010); Haldane (2017). Additionally, these features are relevant to the study of the fundamental protections of the symmetries, carrier measurements, Bloch oscillations at the natural time-scale of the electrons, sub-femtoseconds ( s) Langer et al. (2018).
In addition, it has been demonstrated that in TMDCs, the number of layers and the polytype geometrical features modify the electron structure of the TMDCs and their transport features Kormányos et al. (2018); Gong et al. (2013). This turns MoS2 from a simple semiconductor to a material with a strong-spin orbit coupling (SOC) effect Xiao et al. (2012); Shin et al. (2019); Gong et al. (2013).
In this paper, we use HHG spectroscopy to explore the effects of interlayer coupling in bilayer MoS2 and to investigate how the pseudospin and valley-index can differentiate the monolayer from the bilayer. Furthermore, we pursue to understand whether or not the Berry Curvature and Dipole Transition Matrix Elements (DTMEs) have an impact on the harmonic emissions Xiao et al. (2012).
Pioneering studies of HHG spectra from monolayer and bilayer graphene have shown qualitative differences Yoshikawa et al. (2017); Mrudul and Dixit (2021) and, in addition, shown an attractive un-typical enhancement of the emissivity as a function of the ellipticity of the driven laser, particularly when the fundamental field is elliptically polarized. Similar effects have also been theoretically observed by Tancogne-Dejean in bulk MgO Tancogne-Dejean et al. (2017) by the fully time-dependent density functional theory Tancogne-Dejean et al. (2020).
Here, we calculate the HHG spectra, using the time-dependent density matrix and analyze them using a tight-binding model (TBM), described in Sections 2 and 3. The Berry curvature around the K/K′ under the approach yields Xiao et al. (2012); Gong et al. (2013); Kormányos et al. (2018); Zhu :
| (1) |
The parameters in Eq. (1) are described in Ref. Gong et al. (2013) for the monolayer of TMDC. Note, is related to the onsite potential of the lattice (Fig. 1(a)), is nearest neighbor (NN), and is lattice constant and the valley index for this simple monolayer model. this is the Berry curvature for the monolayer system MoS2 of our TBM up to a linear expansion of the field-free Hamiltonian obtained from Refs. Chacón et al. (2020); Baykusheva et al. (2021). According to Kormányos et al. in Ref. Kormányos et al. (2018) the bilayer Berry curvature about the K/K’, for the valence band, is written as
| (2) |
The parameters , , are defined according to the spin-valley index and the onsite energies Ref. Kormányos et al. (2018). and are related to the hoping strength between the layers of MoS2. Interestingly the bilayer Berry curvatures shows dependence of the interlayer interaction strength. Suggesting the main hypothesis of this paper: “whether or not HHG can encode information of the monolayer peudospin and valley indexes once the system is subjected to strong middle infrared (MIR) lasers.”
We numerically examine the HHG spectra in terms of the Berry Curvature and the DTMEs for both monolayer and bilayer MoS2. The results show an interesting interconnection between the selection rules as well as a particular enhancement in the HHG spectrum for a few harmonic orders (HOs). We define HO as the ratio between the emitted photon frequency and the freq. of fundamental driver , i.e., .
Further, The analysis of angular rotation, pattern of emission reveals a slight difference between mono and bilayers for the high-order harmonics. However, for the harmonic about the bandgap (Fig. 6), we find an interesting difference which might be attributable to the Berry Curvature and the DTMEs. These quantities contain pseudospin and valley indexes information of Mo2 for monolayer or bilayer. This suggest that the angular rotation of the harmonics can be linked to DTMEs.
Surprisingly, in our HHG produced by RCP light, we notice that the HOs in the plateau region exhibit a layer difference with respect to the Berry Curvature and DTMEs. We take advantage of these quantities to analyze our numerical results, the selection rules that these quantities impose and the accumulating phase of the electron and hole wavepackets at each bands (Appendixes B).
In the next, we will review the total currents on the Bloch basis and split them into interband and intraband currents.
Additionally, we will describe the time-dependent density matrix formalism to compute the density at the time and –space.
2 Current and Time-dependent Density Matrix
The microscopic electron-charge current in a periodical crystalline structure subjected to an external oscillating laser , and the macroscopic ‘measurement’ is calculated by integrating the -elementary-microscopic currents in the BZ (atomic units are used throughout this paper unless otherwise indicated):
| (3) |
Here we define the elementary-microscopic current as,
| (4) | |||||
This is the expectation value of the velocity operator where is the full time-dependent Hamiltonian in the length-gauge . The current is defined in terms of the density matrix , and the momentum matrix element Yue and Gaarde (2020); Kruchinin et al. (2013); Wismer and Yakovlev (2018); Chacón et al. (2020). Eq. (3) is conventionally split into two different contributions, the interband current, , (associated with the momentum or dipole matrix element transition between the valence and conduction bands) and the intraband current, , which show how the electron-wave and hole-wave move in each band (See Fig. 1(c) and 1(d), respectively). Mathematically, those contributions are written as follows Yue and Gaarde (2020); Chacón et al. (2020); Baykusheva et al. (2021):
| (5) | |||||
| (6) |
which obviously lead to the total current,
| (7) |
To further evaluate the time-propagation density matrix , and the interband and intraband currents, we numerically solve, in the time–k space, the density matrix given by the Liouville-von Neumann equation,
| (8) |
where is evaluated in the electro-magnetic length-gauge representation of . We will also consider the effects of the dissipation of scattering electrons in the lattice and potential thermal bath influences by . As a state-of-the-art method in high-order harmonics, the phenomenological dephasing time, , is included in the off-diagonal of the ‘dissipation’ . We adopt our numerical method, following Refs. Silva et al. (2019); Kim et al. (2021); Baykusheva et al. (2021) in the moving frame of , where and denote the crystal canonical momentum and the vector potential of the laser-field, respectively. The vector potential is computed according to Vampa and Brabec (2017); Vampa et al. (2014). Given matrix and the transition ‘canonical’ momentum matrix element, , we compute the HHG spectra by Fourier transforming the total current (Eq. (7)) and taking its absolute square. This procedure allows us to compare the nonlinear optical response from monolayer with that from bilayer MoS2.
3 Hamiltonian model for monolayer and bilayer MoS2
According to the tight-binding model (TBM), the laser-free field Hamiltonian of the monolayer Xiao et al. (2012) and bilayer of TMDC, under the staking 3R-polytype symmetry for the bilayer Kormányos et al. (2018); Li et al. (2018); Toh et al. (2017) (Figs. 1(a) and 1(b)) is written as:
| (9) | |||||
where summatory indices , , and are number of layers, the intra-layer nearest-neighbour (NN) and the next nearest-neighbour (NNN) indices. is the onside potential of each atom in the lattice. And are the creation operator at the lattice site and the annihilation operator at the atom of the layer (Figs. 1(a) and 1(b), respectively). , and are the hoping parameters of the NN, NNN intra-layers, as well as the inter-layer, respectively Kormányos et al. (2018); Xiao et al. (2012); Li et al. (2018).
4 Harmonics from mono-layers and bi-layers
In the following sub-sections, we will demonstrate the high-order harmonics emitted from monolayer and bilayer MoS2 subjected to a strong MIR laser-field. In our simulations, we use both a linearly polarized laser (LPL) and a circularly polarized laser-field (CPL). We also analyze the emitted HHG spectra as a function of the interlayer strength .
4.1 Response to linear polarized lasers
We begin presenting our numerical results by showing simulated HHG spectra from monolayer and bilayer MoS2 driven by a linearly (or circularly) polarized laser-fields (LPL or CPL) with respect to the –K direction. The results are shown in Figs. 2(a) and 2(b).
The HHG spectra from monolayer MoS2 shows a few differences with respect to the normalized (normalization of the current with respect to the number of layers) HHG from bilayer MoS2. In particular, there is no substantial difference in the intensity of HHG emissions below the band gap (harmonic orders (). This observation is indicated in blue and red triangles. This result is surprising, since one can intuitively expect that the bilayer will enhance the emission due to more channels for tunneling excitation and interband transition.
By contrast, only the 13th order shows an enhancement of more than one order of magnitude for the MoS2 bilayer. This can be interpreted to indicates a complex e-h recombination. In addition, Figure 2(a) shows the same cut-off regions for both monolayer and bilayer geometrical configurations.
The ‘chaotic’ intensity behavior observed in Fig. 2(a) is rationalized via the selection rules and accumulated phase of the radiation emission, and of course, via the breaking inversion symmetry of the Hamiltonian. These selection rules are imposed by the DTMEs, , and the quasi-classical action phase, (Appendix B), between conduction and valence bands for the monolayer system with respect to the bilayer system Yue and Gaarde (2020); Chacón et al. (2020); Baykusheva et al. (2021). We think that the different coherences in the density matrix lead to larger effects on the 13th-order, from the interband and intraband contributions take place (Figs. 2(c) and 2(d)) Vampa and Brabec (2017); Vampa et al. (2014). While the electron (hole) wavepacket is driven in the conduction (valence) bands and its corresponding dipolar selection rules shown in Fig. 7 and Fig. 8 (Appendix), these “complex propagation" effects can easily lead to constructive or destructive interfering channels.
These results exhibit even and odd HOs and illustrate the selection rules because the interband currents are governed by the dipole matrix element Kim et al. (2021) which breaks the inversion symmetry of the laser-field free Hamiltonian, . In case of the intraband current, the HHG spectra show a complete symmetry behaviour in the sense that only odd HOs show up in the spectra.
4.2 Response to circularly polarized lasers
The HHG produced by a contra-wise clock of the circularly polarized laser are shown in Fig. 2(b). For the different geometrical-phases, i.e., monolayer and bilayer, HHG spectra exhibit interesting differences.
-
1.
A surprising enhancement by almost one order of magnitude in the harmonics emitted around the plateau region is observed between monolayer and bilayer (See blue triangles),
-
2.
All the harmonics follows the 3-fold symmetry of the system with the co-rotating () and contra-rotating () harmonic orders in the plateau region, as has already been experimentally observed in Ref. Saito et al. (2017) in solids with a 3-fold rotational symmetry. Our results fully capture these selection rules. As such, it is clear that circularly-polarized drivers have significant potential in bringing out the signatures between the monolayers and bilayers configurations, their differences and in particular, the valley index and pseudo-spin information as a function of the layers Kormányos et al. (2018).
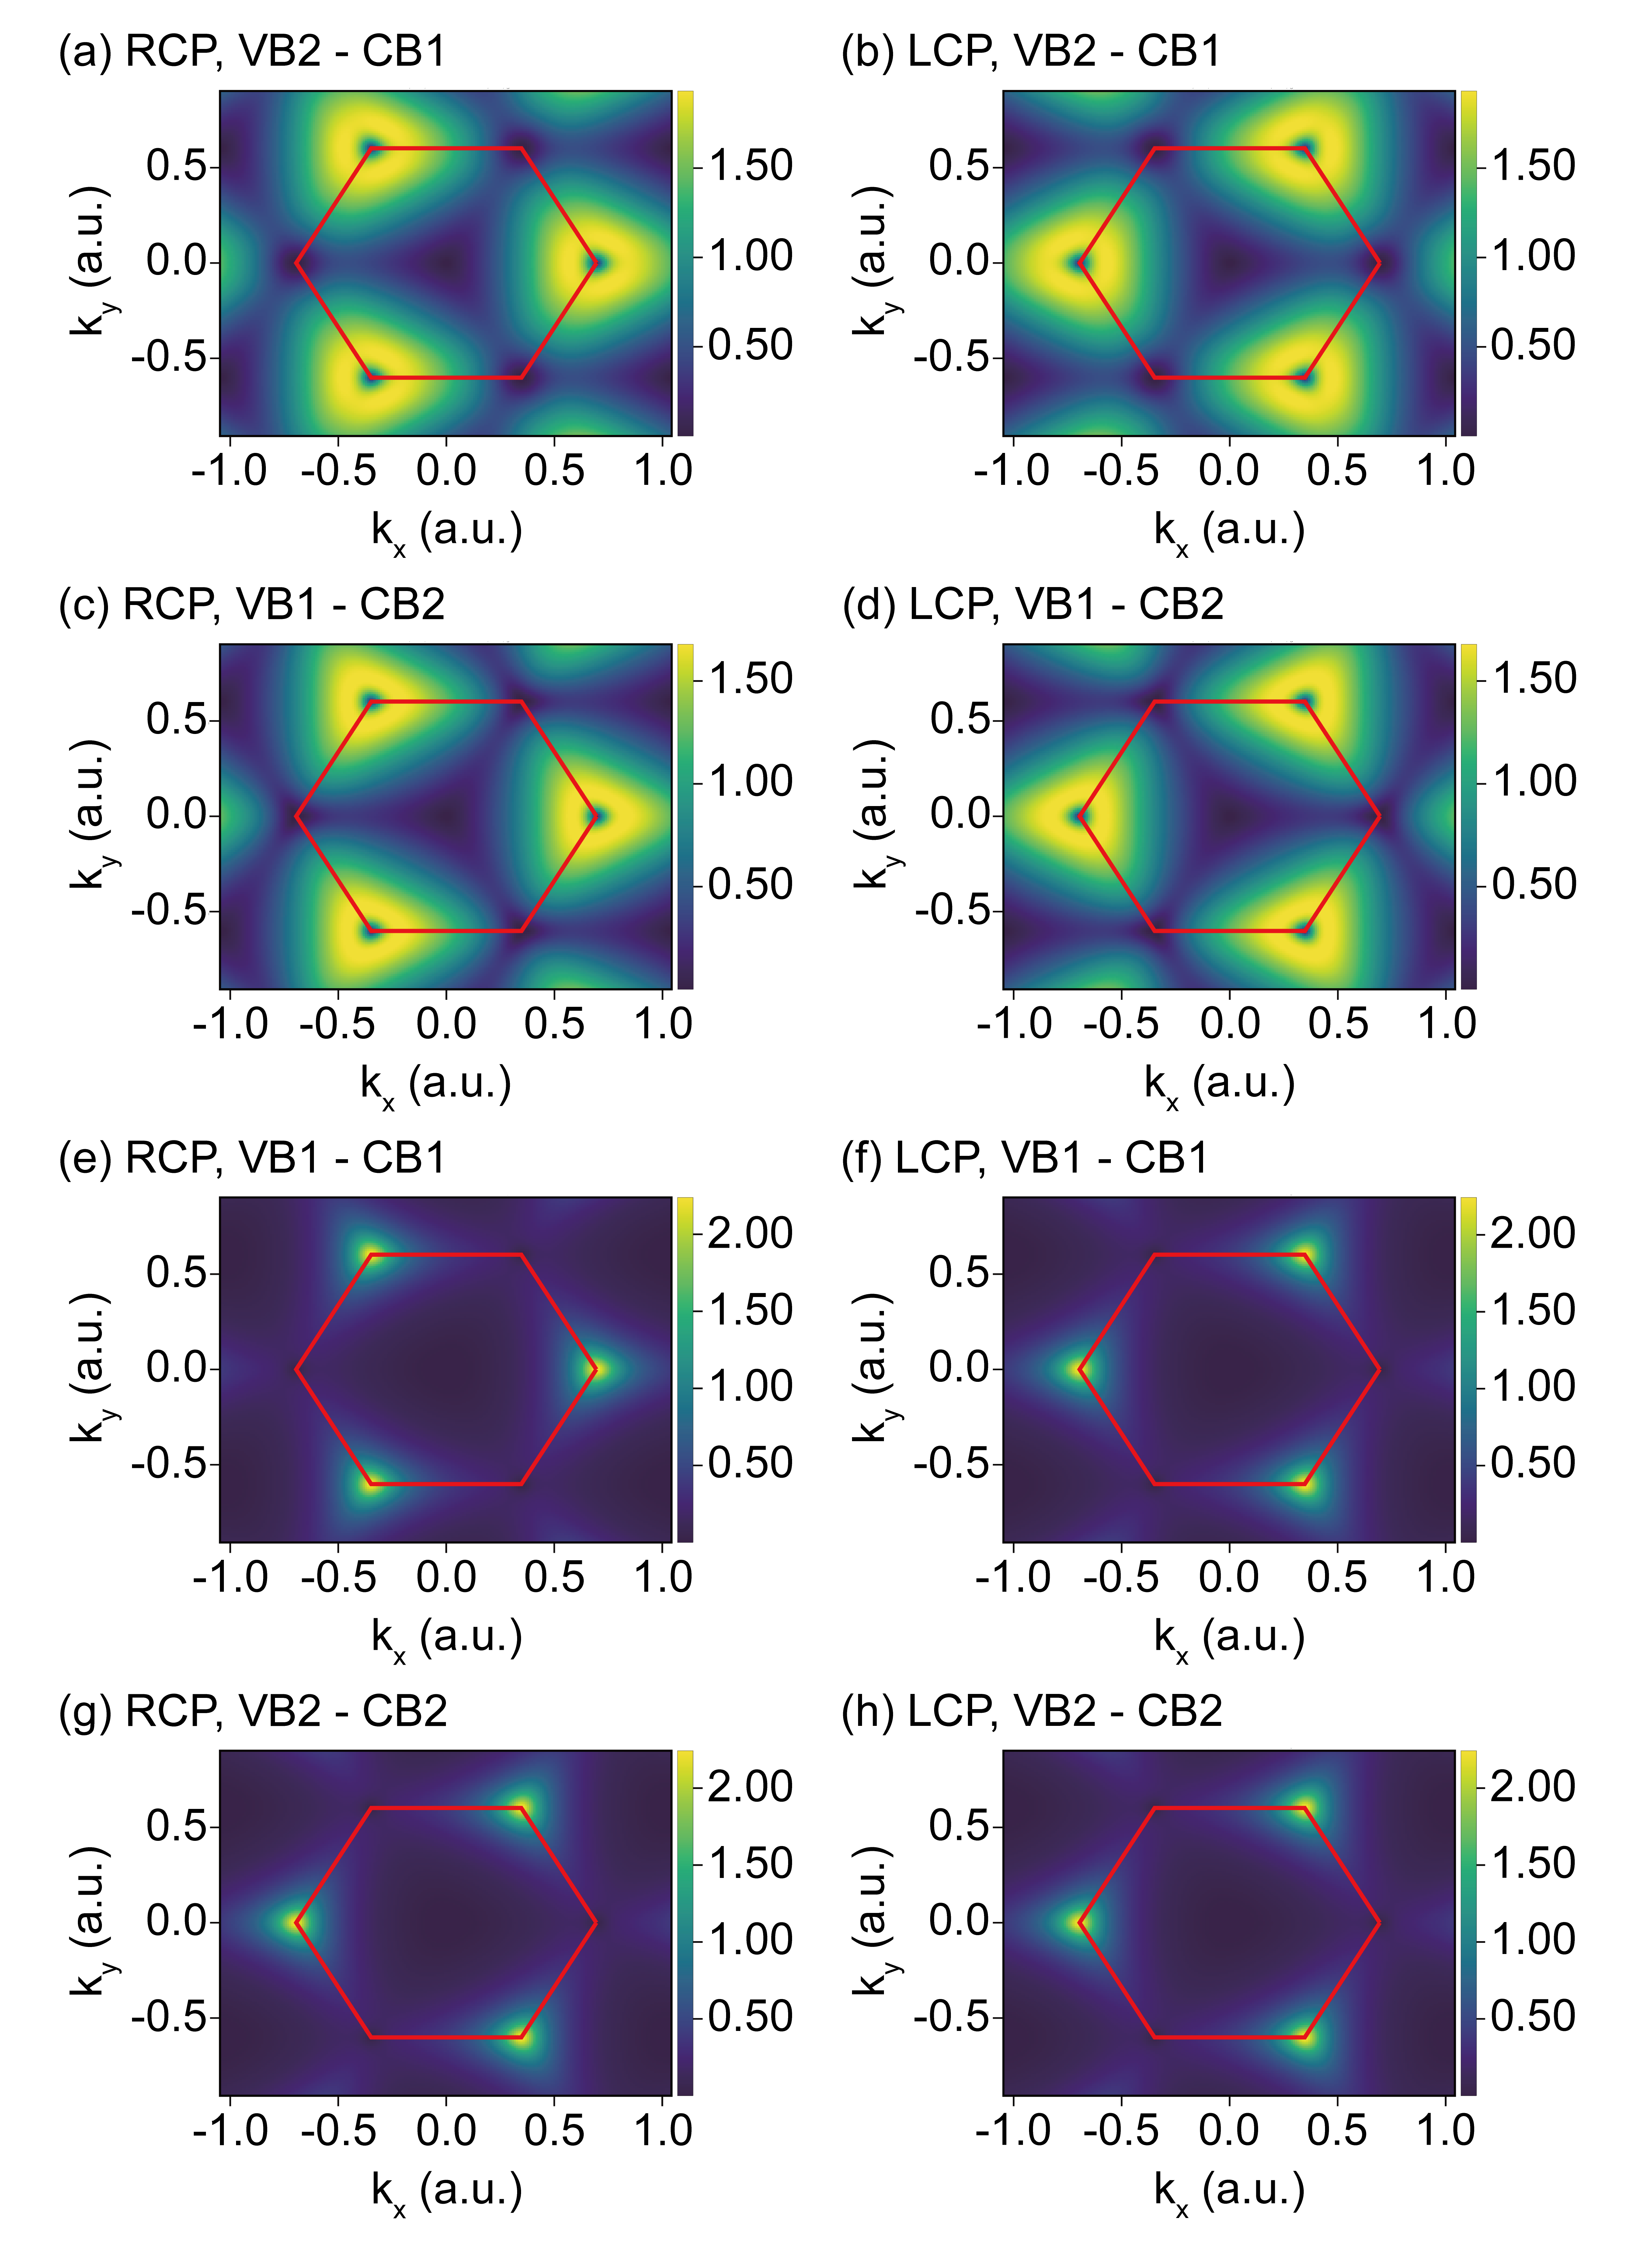
As the selection rules in the HHG spectra are well described for the LPL and CPL, inversion symmetry breaking is manifested in the HHG spectra. This implies that the Berry curvature and the transition dipoles have an interesting effects on harmonic emission Drake and Cassar (2006); Baykusheva et al. (2021); Luu and Wörner (2018) for both monolayer and bilayer MoS2. The results shown in Fig. 2(b) can be attributed to Berry curvature effects about the K’-point in the BZ and the ’rotation of DTMEs’ coupled to the CPL and the action phase (Appendix B.1). Since the dipolar selection rules also govern the photon emission via (the momentum matrix element is proportional to the dipole transition matrix element , obviously the indexes Kim et al. (2021); Baykusheva et al. (2021)), the RCP or LCP will excite the e-h about the K’ and K point respectively. Note, however, that RCP-light will only excite electrons around the K’ points of the BZ as clearly indicated in Figs. 7-10. The mathematical definition of CPL selection rule weighs the Berry curvature around the excitation e (h) wave packet and the recombination of the electron and hole. Thus, we find the potential physical picture which explains approximately the enhancement of the harmonics in the plateau region in monolayer MoS2 compared to the bilayer.
4.3 Interlayer strength in high-order harmonics
Here, we discuss the role of the inter-layer parameter in the HHG spectra.
Fig. 3 reports the HHG spectra as a function of the inter-layer interaction . We find small differences in the range of eV. This range of is logically expected to be on the order of the magnitude of the NN parameter . Naturally, the coupling between the atoms ‘Mo’ of Layer1 and ‘S’ of Layer2 is not strong enough within our approximation to observe dramatic modifications on the HHG spectrum for the bilayer MoS2 (See Figs. 3(a), 3(b) and 3(c), as well as their corresponding comparisons between the approximated interaction strength of , and eV, respectively). However, note that once the interaction strength increases up to –, dramatic differences are observed between monolayer and bilayer MoS2. We did not present or address this result, since it is unlikely that the interplay hopping interaction will reach such a large energy value of 2 or 3 eV.
4.4 Structural angular rotation of the high-order harmonics
Now, We explore the angular rotation of HHG emission for low HOs (those below the band-gap), the plateau and the cut-off region as a function of the laser wavelength. We also study the response of the HHG spectra as a function of the ellipticity of the laser for the monolayer and bilayers of MoS2. This interestingly links to the pseudo-spin and valley effects of our model into the HHG signal.
The angular rotation of the harmonic orders is another interesting quantity which might contain information of the band energy structure, the dipole matrix element and the Berry curvature as well Langer et al. (2018); Karsten and Smith (1981); Luu and Wörner (2018); Liu et al. (2017). Therefore, we calculate the angular rotation of the harmonics using the following procedure: (1) the electric field, , of the driving laser is linearly polarized at an angle of with respect to the –K crystal orientation (direction on the crystal momentum space), (2) we project the resulting charge current components and with respect to the laser orientation. As a result, we focus our attention on the parallel and perpendicular components with respect to the violet laser polarization Langer et al. (2018).
We then compute the angular rotation of the harmonic orders for the parallel and perpendicular components as a function of the laser wavelengths for low HOs, bandgap and cutoff region of the HHG spectra. The results of the total HHG, are shown in Fig. 4.
The 2nd-order shown in Figs. 4(a,d,g) for different laser wavelengths can be understood in terms of DTMEs and its selection rules. The DTMEs show, in Figs. 7 and 8, an ‘start’-like structure for mono and bilayer MoS2. The difference comes from the selection rules and the laser via the Bloch theorem in the BZ, i.e., , where, and are the excitation crystal momentum and time, the emission time. is the vector potential of the laser field . Additionally, we can understand the difference easily by applying perturbative theory to our formalism. Note, however, that this is out of the scope of the current paper.
4.5 Ellipticity dependence of low- and high-order harmonics
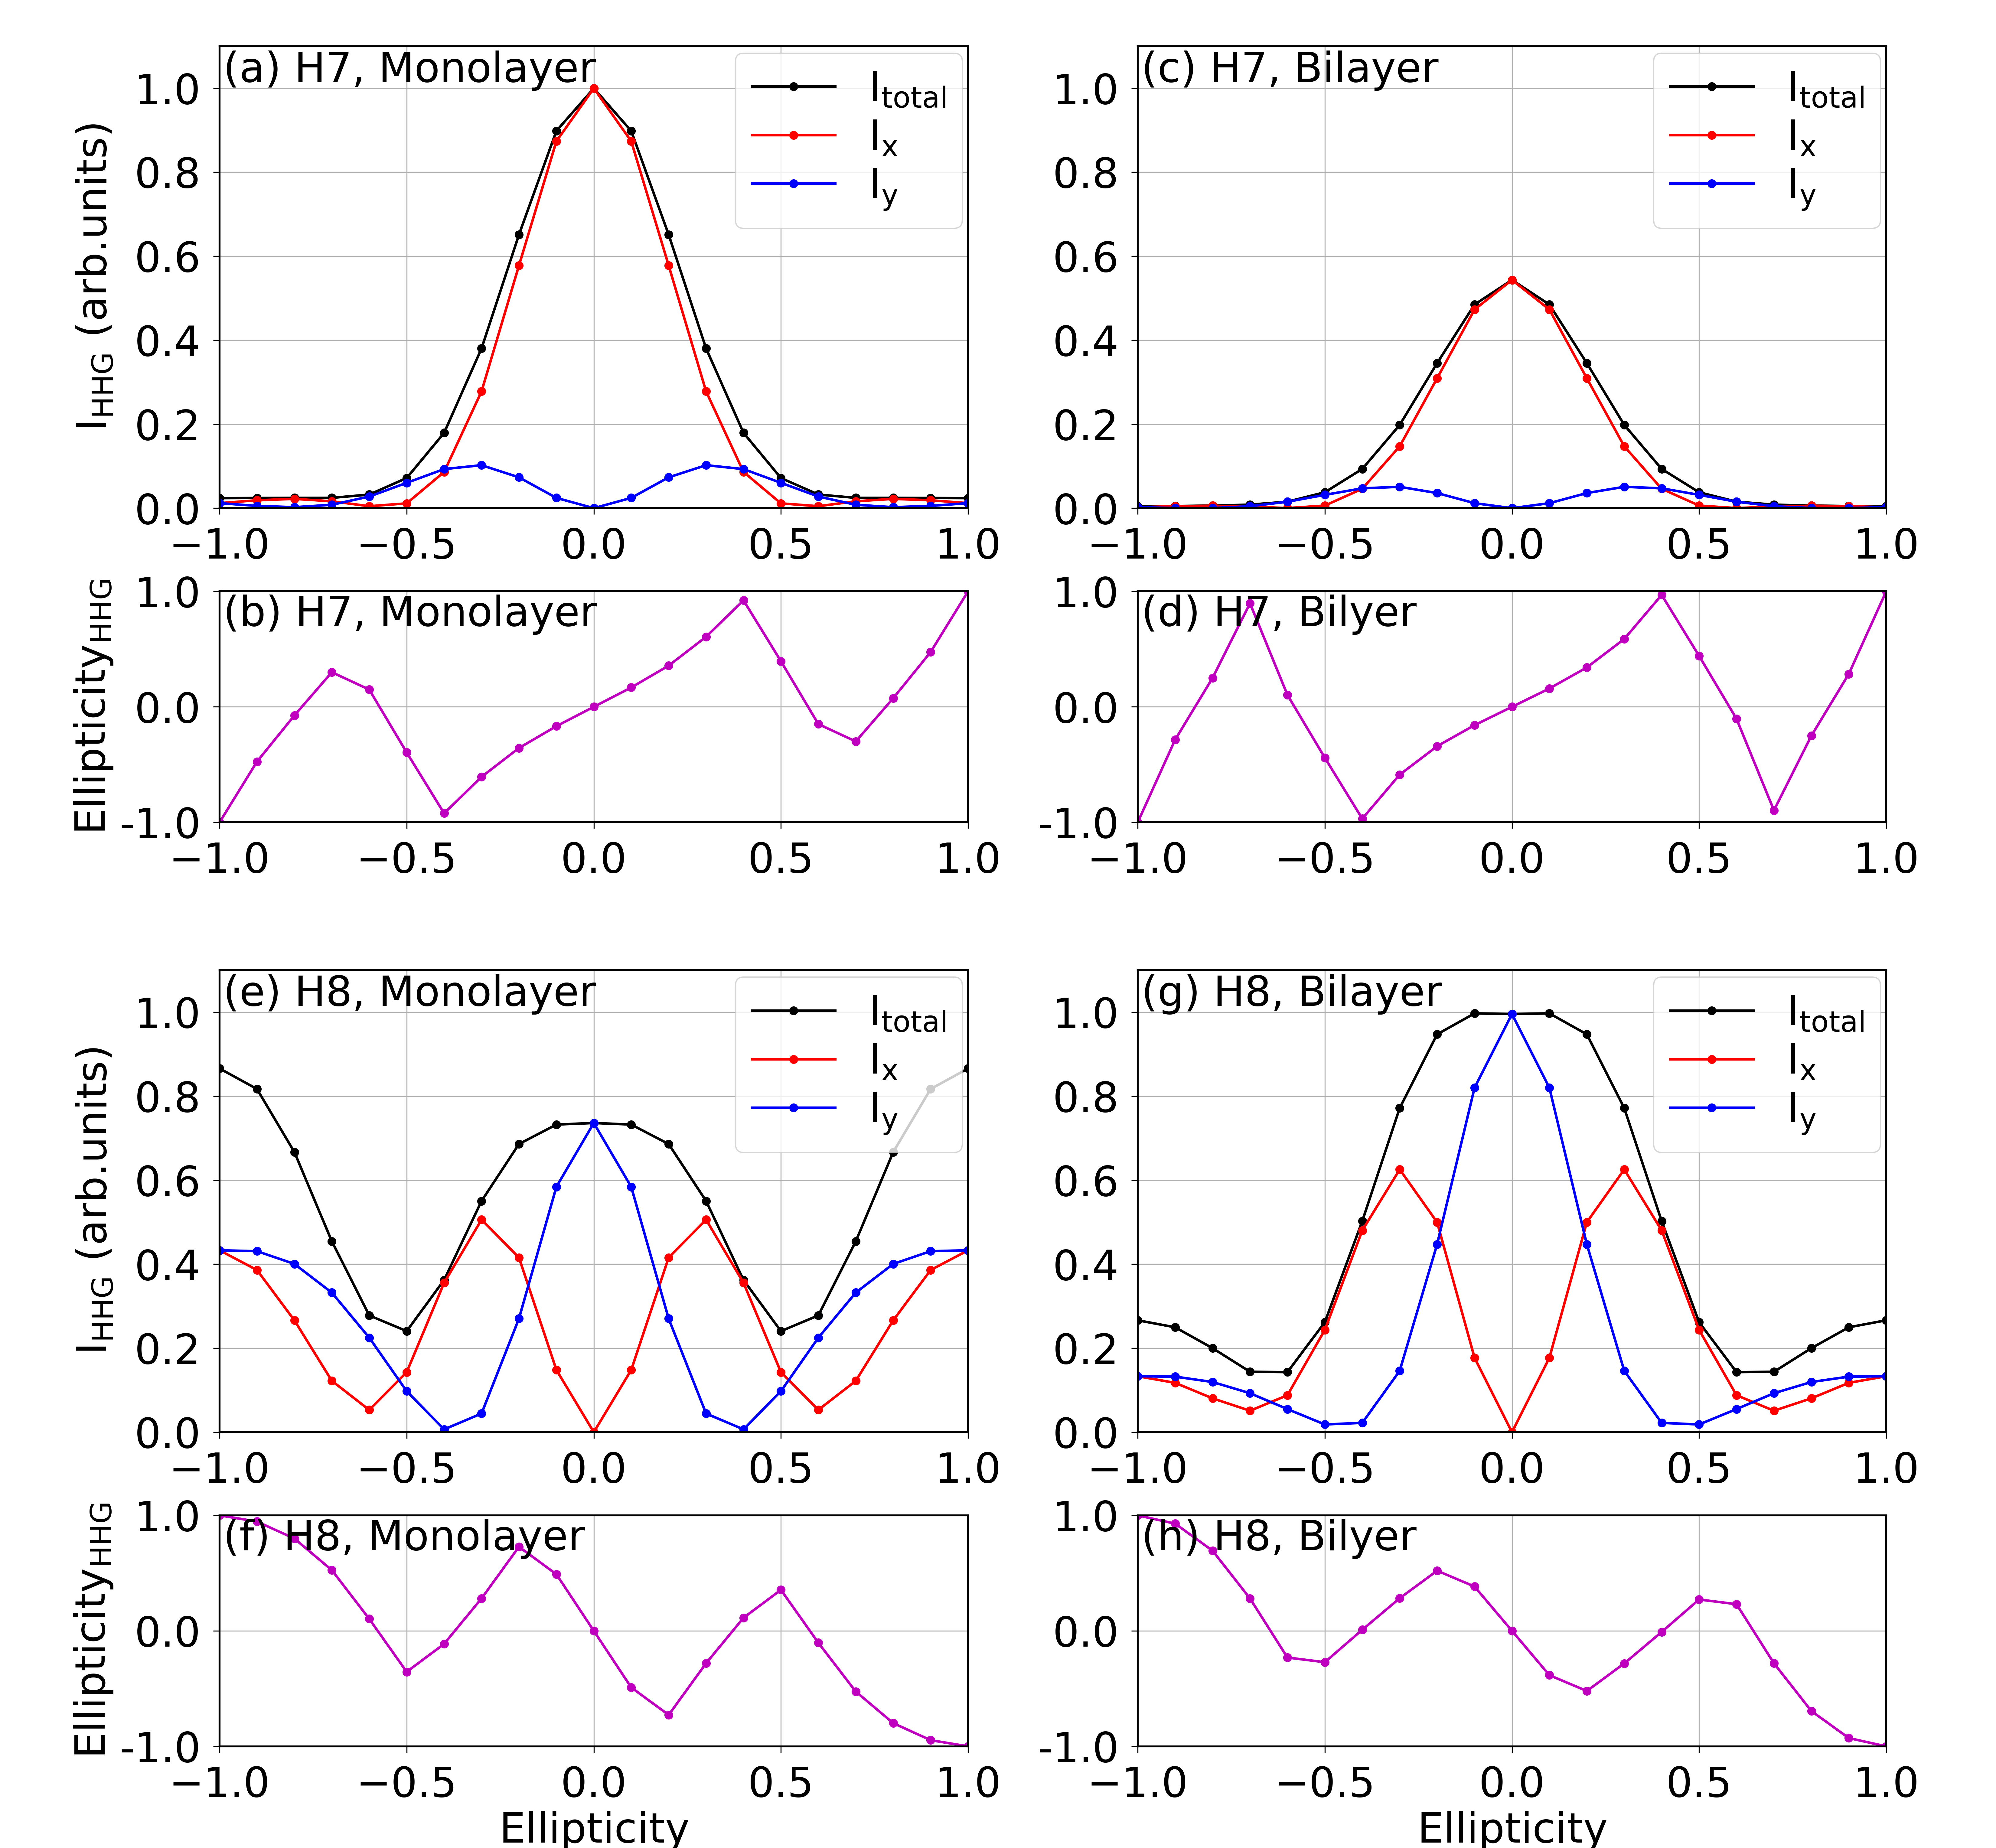
In this section we present the result of the HHG spectra as a function of the ellipticity of the driving-MIR laser. This takes values between , meaning left-circularly polarized-laser (LCP), linear-polarized laser (LPL) and right-circularly polarized-laser (RCP).
Figure 5 show the calculated HHG spectra for co-rotating harmonic order (HO7th) and contra-rotating harmonic order (HO8th) between monolayer and bilayer MoS2. Two harmonic orders, HO7th and HO8th show interesting differences as a function of the ellipticity of the incoming laser for both the monolayer and bilayer MoS2. In Figs. 5(a,c) and 5(b,d), the ellipticity of the HO7th with respect to the ellipticity of the laser is shown. We observe almost the same tendencies with the difference that the emission yield from the monolayer is larger with respect to the bilayer emission for the LPL. The harmonic yield of the LCP vs RCP are almost zero in both monolayer and bilayer cases (Figs. 5(a,c)).
The HO8th, contra-rotating order with respect to the incident RCP (LCP), shows an impressive enhancement at (Fig.5 (e)) for the emission from monolayers. In contrast, the yield of HO8th for the bilayer MoS2 shows a dramatic reduction of 67 in comparison to the monolayer case (Fig.5 (g)).
Finally, the contra-rotating harmonic order exhibits totally different ellipticity from the co-rotating HO. This is expected, according to the selection rules (Figs. 9, 10, and 11). The quasi-classial action phase, (See Appendix 11), allows us to link this signature to pseudo-spin localized at K’ or K valley. The valley index can be associated to the ellipticity analysis of the HOs of Fig. 5(f,h) with signs of the Berry curvatures for mono and bilayer MoS2 at the K or K’ points.
5 Conclusions and outlook
In summary, our theory shows that the high-harmonic generation (HHG) spectrum is capable to:
-
•
observe difference on the nonlinear optical emission about the band gap between monolayers and bilayers of TMDCs.
-
•
describe a unique difference between the angular rotations and ellipticity dependence of the emitted harmonics as a function of the number of layers concerning the ellipticity of the laser, via the selection rule of the dipole matrix element and Berry Curvature to a linear and circularly polarized laser beam.
-
•
is susceptible to breaking the inversion symmetries (IS, respectively) and thus sensitives to the Berry Curvature and its pseudospin character.
These features promise the applications of the TMDC into spin-valley manipulation of the information, thanks to its geometrical and pseudo metallic properties. The TMDC in 2D can especially exhibit topological insulating phases, making them attractive for quantum computing, storage of information, and other applications Xiao et al. (2012). Finally, it is important to note that all of these ideas can be applied and tested in quantum simulators Acín et al. (2018), in particular using ultracold atoms and lattice shaking Lewenstein et al. (2012), as well as Rydberg atoms, polaritons, or circuit QED Bloch et al. (2008); Cirac and Zoller (2012); Bloch et al. (2012); Blatt and Roos (2012); Aspuru-Guzik and Walther (2012); Houck et al. (2012). The usage to study strong-field phenomena is an emerging application of the spintronic and valleytronic technological advances Sala et al. (2017); Senaratne et al. (2018); Ramos et al. (2019). Since the pseudospin is related to magnetic properties and is naturally suited to the study of systems in ordered lattices, it should provide additional clarity to the role of material with pseudospin couplings and valley indexes in high-harmonic emissions.
Data curation and visualization, Yeon Lee; Formal analysis and investigation, Dasol Kim; Methodology and Writing-original draft, Alexis Chacón; Project administration and Funding Acquisition, Dong Eon Kim. Yeon Lee and Dasol Kim contributed equally to this work as first authors. All authors have read and agreed to the published version of the manuscript.
The work has been supported in part by Grant No 2016K1A4A4A01922028 (the Max Planck POSTECH/KOREA Research Initiative Program), Grant No 2020R1A2C2103181 through the National Research Foundation of Korea (NRF) funded by the Ministry of Science and ICT, and Korea Institute for Advancement of Technology (KIAT) grant (No. P0008763, The Competency Development Program for Industry Specialists) funded by MOTIE.
Not applicable
Not applicable
Acknowledgements.
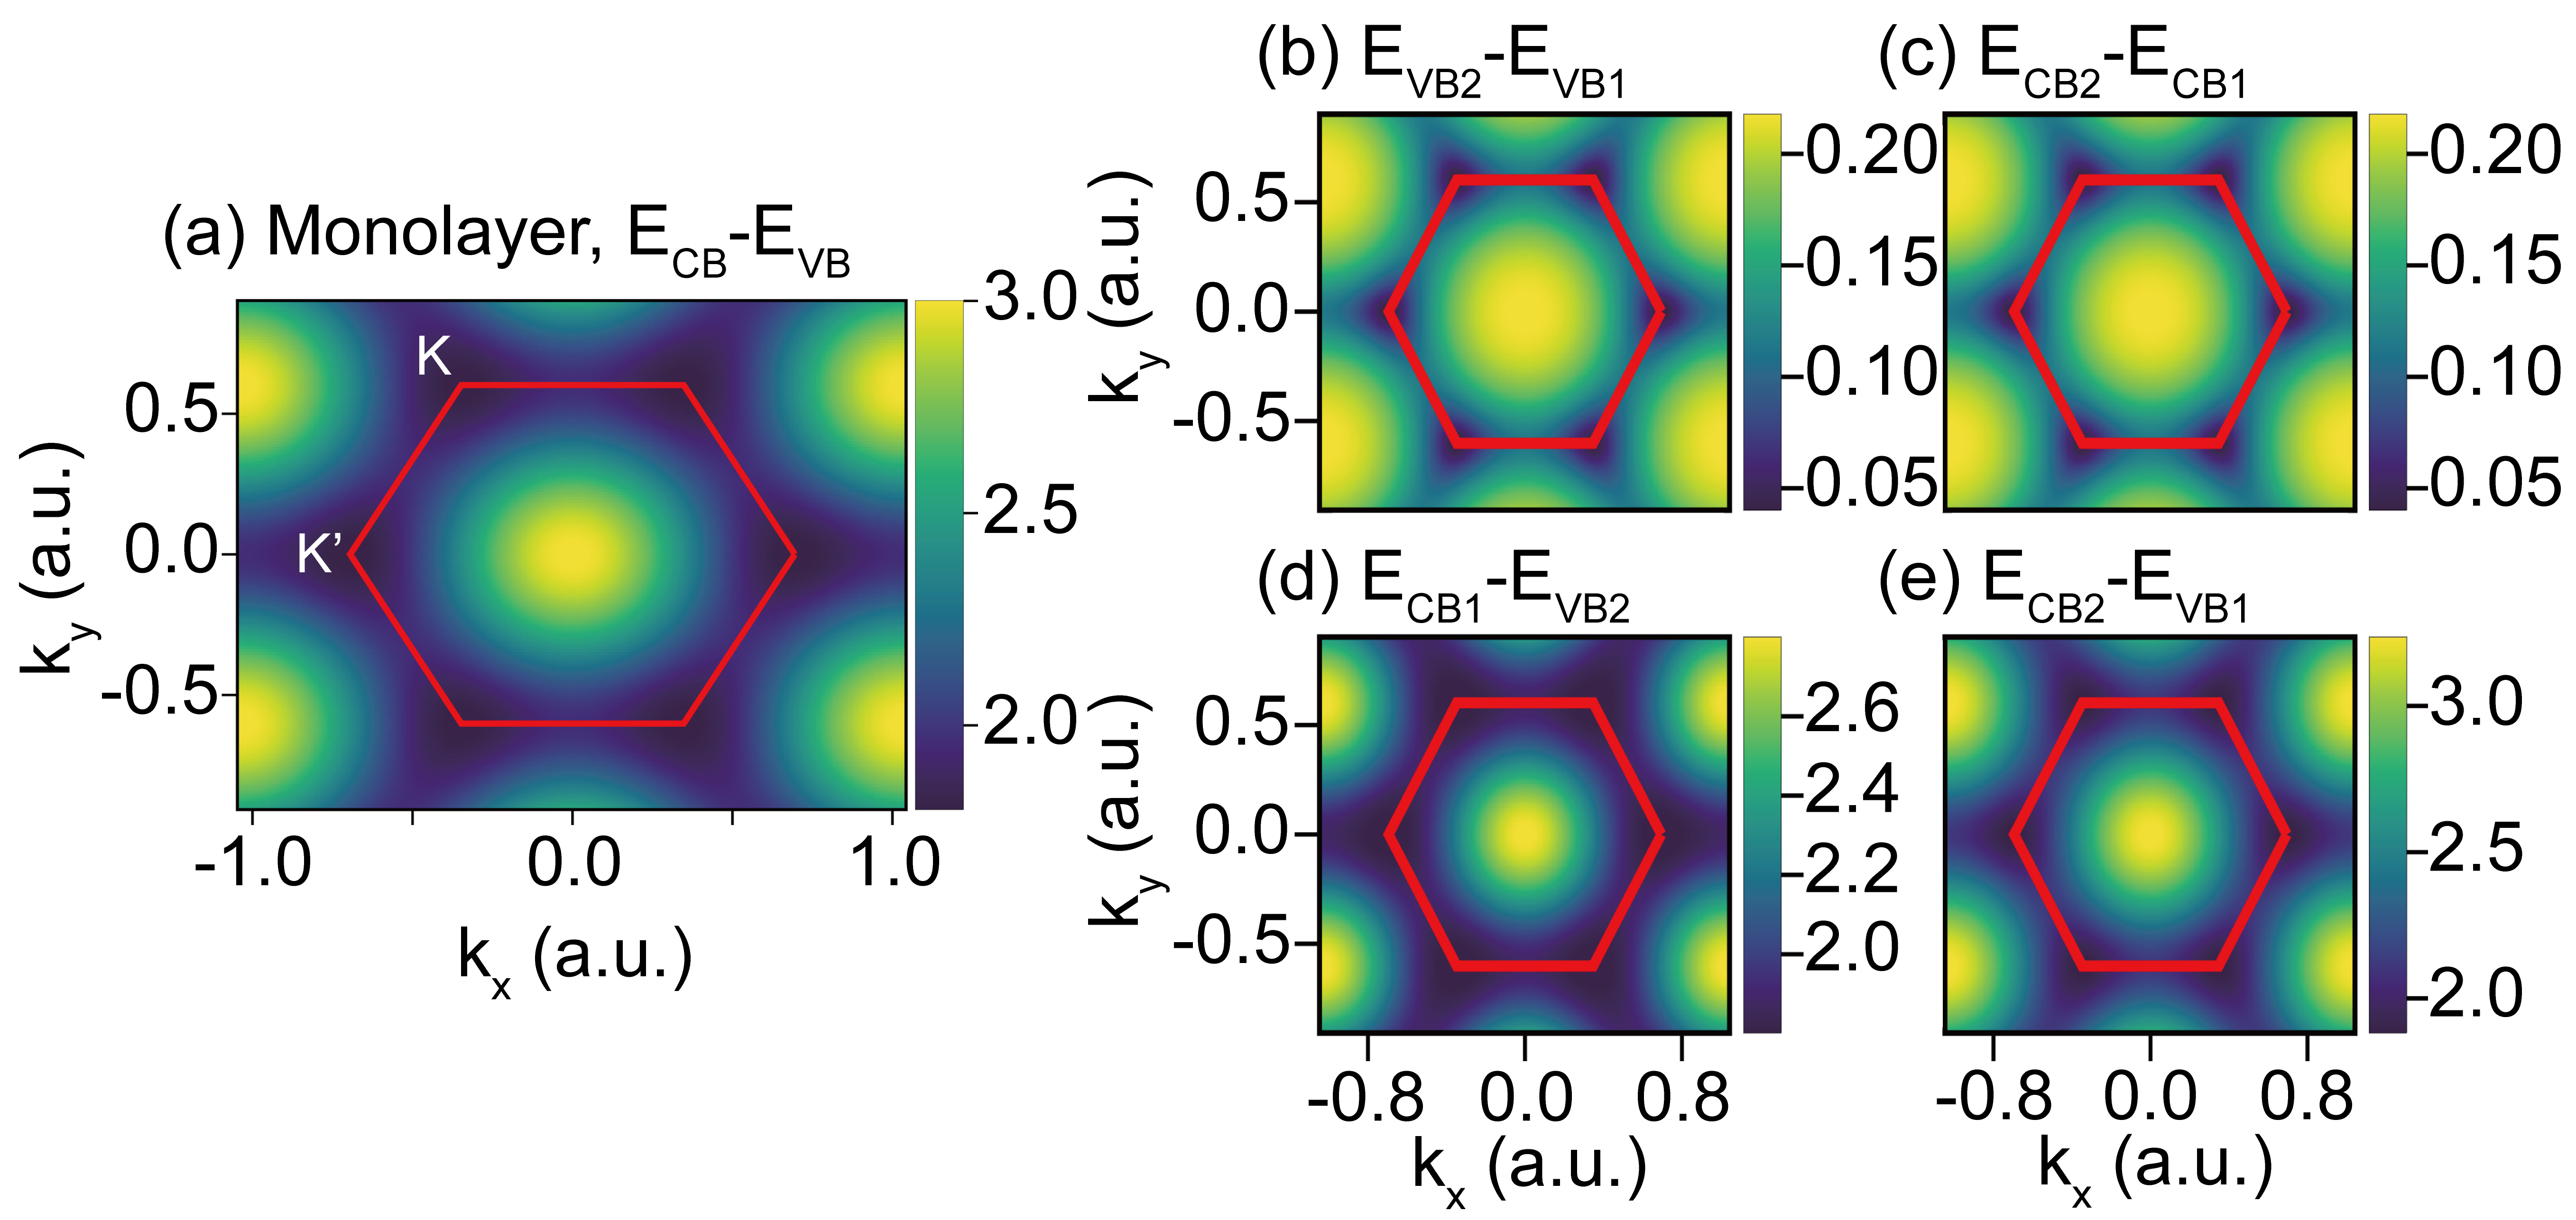
We thank the Max Planck Institute for the Structural Dynamics of matter (MPI-SD) for providing generous computational resources for the intense calculation. \conflictsofinterestThe authors declare no conflict of interest. The funders had no role in the design of the study; in the collection, analyses, or interpretation of data; in the writing of the manuscript, or in the decision to publish the results. \appendixtitlesyes \appendixstartAppendix A Band gap structure in the BZ
The energy difference band between different conduction and valence bands for monolayers and bilayers MoS2 are depicted in Fig. 6. These energy differences are important once the high-order harmonic spectrum are dominated by the inteband currents. Vampa et al. (2014); Chacón et al. (2020). We then can discover a unique physical feature by the interplay between the energy dispersion and the interband currents.
Appendix B Keldysh approximation and quasi-classical analysis
Here we can gain more physical insight into the physics of the HHG spectra by applying the so-called Keldysh approximation, as discussed by Vampa et al. Vampa et al. (2014). This approximation reads: , where is an integer index that stands for the number of conduction bands. Thus, the Keldysh approximation is valid in the limit that and . This essentially means that the population transferred to the conduction band is very small compared to that remaining in the valence band. This approximation is very similar to the one used in the Strong Field Approximation (SFA), which was originally developed for atoms and molecules Chacón et al. (2020); Corkum (1993); Lewenstein et al. (1994); Amini et al. (2019) – we will thus hereafter term it SFA. We focus on the discussion of the inter-band current in this appendix.
B.1 Inter-band current
In this approximation, we will restrict ourselves to the harmonic radiation produced by the interband current according to Ref. Chacón et al. (2020), We obtain a closed form of the expression for the th vectorial-component () within the Hamiltonian matter-gauge Silva et al. (2019) for 2D materials,
| (10) |
where is the so-called quasi-classical action for the electron-hole, which is defined as
| (11) |
Here, indicates the component of the electric field and the transition-dipole product which depends on the polarization of the driving laser. Expressions (10) and (11) are direct analogues of the Landau-Dykhne formula for HHG in atoms, which was derived in Ref. Lewenstein et al. (1994), following the idea of the simple man’s model Corkum (1993) (See Amini et al. (2019) for a recent review). Below we will analyze these expressions using the saddle point approximation over crystal momentum to derive the effects of the Berry curvature on the relevant trajectories.

B.2 Quasi-classical electron-hole pair quantum paths
Assuming that the exponentiated quasi-classical action oscillates rapidly as a function of the canonical crystal momentum , one can apply the saddle-point approximation to find the points at which the integrand’s contributions to the inter-band current (10) concentrated. These are solutions to the saddle-point equation , which can be rephrased as
| (12) |
Two different trajectories are identified from the last equation, the first one is related to the excited electron in the conduction band, whereas the second one involves the trajectory , followed by the hole in the valence band. We then obtain a general th trajectory for the electron () and hole (), which is expressed as
| (13) | ||||
where is the alternating sign and , and the group velocity of the th band is . Here we recognize the Berry curvature as well as the anomalous velocity , which are given by and , respectively, for the electron-hole trajectories of Eq. (13). The previous expression can be rewritten as
| (14) | ||||
These electron-hole pair trajectories, along with the saddle-point condition of Eq. (12), should produce complex-valued solutions for , as is the case for HHG of gases. However, determining the solutions is not a trivial task, as it depends explicitly on the geometrical features, such as the Berry curvature and connection, and the phase of the dipole matrix elements. This gets further complicated as the eigenstates and eigenvalues that make up the energy bands are expected to exhibit branch cuts and branch points connecting the two bands Pechukas et al. (1976); Hwang and Pechukas (1977). Once the momentum is allowed to take on complex values (as it does in complex band structure theory Reuter (2016)), this leads to a nontrivial geometrical problem with a high dimensionality whose analysis requires detailed attention.
Nevertheless, these saddle points should have a component perpendicular to the driving laser field (in the case of linear drivers), which appears as a consequence of anomalous-velocity features and of the Berry curvature in particular.
B.3 Berry Connection, Berry Curvature, and Chern number
To calculate the radiation-interaction features of these eigenstates, the DTME between each state of from conduction to valence bands or vice versa. This DMTE is unique, since it contains the full information of the selection rules for the emitted radiation. We define it in the basis of the Bloch function Blount (1962),
| (15) |
where
| (16) |
is a regular function which encodes the momentum gradient of the periodic part of the Bloch functions. For , defines the DTME as also have been noticed in the text. The main diagonal of Eq. (16) elements is the Berry connection of the -band,
| (17) |
which is responsible for the parallel transport of wave function phase around the band. This parallel transport is measured by the Berry curvature, given by the gauge-invariant curl
| (18) |
This parallel transport is observed in the quasi-classical action phase of the Eq. (16).
B.4 Dipole moment and Berry curvature in the Haldane model (HM)
We now turn to the dipole transition matrix element, as initially defined in Eq. (16), and its deep relationship with the Berry curvature which is given here as Chacón et al. (2020)
| (19) |
On the one hand, we find that the cross product of the HM dipole Eq. (16) yields
| (20) |
Expanding the Berry curvature in the Haldane model, given by Eq. (18), one obtains Chacón et al. (2020); Zhu
| (21) | ||||
We therefore conclude that Chacón et al. (2020):
| (22) |
which demonstrates the close relationship between dipole matrix elements and the Berry curvature in the HM. This confirmation of the relationship between the dipole product and the Berry curvature is extremely important, as it leads to a direct connection of the inter-band transition current of Eq. (10) and the topological invariant for this model.
References
yes
References
- Ghimire et al. (2011) Ghimire, S.; DiChiara, A.D.; Sistrunk, E.; Agostini, P.; DiMauro, L.F.; Reis, D.A. Observation of high-order harmonic generation in a bulk crystal. Nat. Phys. 2011, 7, 138–141, [http://www.dimauro.osu.edu/node/299]. doi:\changeurlcolorblack10.1038/nphys1847.
- Liu et al. (2017) Liu, H.; Li, Y.; You, Y.S.; Ghimire, S.; Heinz, T.F.; Reis, D.A. High-harmonic generation from an atomically thin semiconductor. Nat. Phys. 2017, 13, 262, [https://web.stanford.edu/group/heinz/publications/Pub259.pdf]. doi:\changeurlcolorblack10.1038/nphys3946.
- Vampa et al. (2015) Vampa, G.; Hammond, T.; Thiré, N.; Schmidt, B.; Légaré, F.; McDonald, C.; Brabec, T.; Corkum, P. Linking high harmonics from gases and solids. Nature 2015, 522, 462. doi:\changeurlcolorblack10.1038/nature14517.
- Itatani et al. (2004) Itatani, J.; Levesque, J.; Zeidler, D.; Niikura, H.; Pépin, H.; Kieffer, J.C.; Corkum, P.B.; Villeneuve, D.M. Tomographic imaging of molecular orbitals. Nature 2004, 432, 867–871. doi:\changeurlcolorblack10.1038/nature03183.
- Ghimire and Reis (2019) Ghimire, S.; Reis, D.A. High-harmonic generation from solids (article) Author. Nature Phys. 2019, 15, 10–16. doi:\changeurlcolorblackhttps://doi.org/10.1038/s41567-018-0315-5.
- Amini et al. (2019) Amini, K.; Biegert, J.; Calegari, F.; Chacón, A.; Ciappina, M.F.; Dauphin, A.; Efimov, D.K.; de Morisson Faria, C.F.; Giergiel, K.; Gniewek, P.; Landsman, A.S.; Lesiuk, M.; Mandrysz, M.; Maxwell, A.S.; Moszyński, R.; Ortmann, L.; Pérez-Hernández, J.A.; Picón, A.; Pisanty, E.; Prauzner-Bechcicki, J.; Sacha, K.; Suárez, N.; Zaïr, A.; Zakrzewski, J.; Lewenstein, M. Symphony on strong field approximation. Rep. Prog. Phys. 2019, 82, 116001, [https://arxiv.org/abs/1812.11447]. doi:\changeurlcolorblack10.1088/1361-6633/ab2bb1.
- Vampa et al. (2014) Vampa, G.; McDonald, C.R.; Orlando, G.; Klug, D.D.; Corkum, P.B.; Brabec, T. Theoretical Analysis of High-Harmonic Generation in Solids. Phys. Rev. Lett. 2014, 113, 073901. doi:\changeurlcolorblack10.1103/PhysRevLett.113.073901.
- Osika et al. (2017) Osika, E.N.; Chacón, A.; Ortmann, L.; Suárez, N.; Pérez-Hernández, J.A.; Szafran, B.; Ciappina, M.F.; Sols, F.; Landsman, A.S.; Lewenstein, M. Wannier-Bloch Approach to Localization in High-Harmonics Generation in Solids. Phys. Rev. X 2017, 7, 021017. doi:\changeurlcolorblack10.1103/PhysRevX.7.021017.
- Kruchinin et al. (2018) Kruchinin, S.Y.; Krausz, F.; Yakovlev, V.S. Colloquium: Strong-field phenomena in periodic systems. Rev. Mod. Phys. 2018, 90, 021002. doi:\changeurlcolorblack10.1103/RevModPhys.90.021002.
- Kormányos et al. (2018) Kormányos, A.; Zólyomi, V.; Fal’ko, V.I.; Burkard, G. Tunable Berry curvature and valley and spin Hall effect in bilayer . Phys. Rev. B 2018, 98, 035408. doi:\changeurlcolorblack10.1103/PhysRevB.98.035408.
- Gong et al. (2013) Gong, Z.; Liu, G.B.; Yu, H.; Xiao, D.; Cui, X.; Xu, X.; Yao, W. Magnetoelectric effects and valley-controlled spin quantum gates in transition metal dichalcogenide bilayers. Nature Comm. 2013, 4, 2053. doi:\changeurlcolorblack10.1038/ncomms3053.
- Zhai and Blanter (2020) Zhai, X.; Blanter, Y.M. Spin-valley polarized quantum anomalous Hall effect and a valley-controlled half-metal in bilayer graphene. Phys. Rev. B 2020, 101, 155425. doi:\changeurlcolorblack10.1103/PhysRevB.101.155425.
- Damascelli et al. (2003) Damascelli, A.; Hussain, Z.; Shen, Z.X. Angle-resolved photoemission studies of the cuprate superconductors. Rev. Mod. Phys. 2003, 75, 473–541. doi:\changeurlcolorblack10.1103/RevModPhys.75.473.
- Chiu et al. (2016) Chiu, C.K.; Teo, J.C.Y.; Schnyder, A.P.; Ryu, S. Classification of topological quantum matter with symmetries. Rev. Mod. Phys. 2016, 88, 035005, [https://arxiv.org/abs/1505.03535]. doi:\changeurlcolorblack10.1103/RevModPhys.88.035005.
- Vampa and Brabec (2017) Vampa, G.; Brabec, T. Merge of high harmonic generation from gases and solids and its implications for attosecond science. J. Phys. B: At. Mol. Opt. Phys. 2017, 50, 083001. doi:\changeurlcolorblack10.1088/1361-6455/aa528d.
- Luu and Wörner (2018) Luu, T.T.; Wörner, H.J. Measurement of the Berry curvature of solids using high-harmonic spectroscopy. Nat. Commun. 2018, 9, 916. doi:\changeurlcolorblack10.1038/s41467-018-03397-4.
- Vampa et al. (2015) Vampa, G.; Hammond, T.J.; Thiré, N.; Schmidt, B.E.; Légaré, F.; McDonald, C.R.; Brabec, T.; Klug, D.D.; Corkum, P.B. All-Optical Reconstruction of Crystal Band Structure. Phys. Rev. Lett. 2015, 115, 193603. doi:\changeurlcolorblack10.1103/PhysRevLett.115.193603.
- Chacón et al. (2020) Chacón, A.; Kim, D.; Zhu, W.; Kelly, S.P.; Dauphin, A.; Pisanty, E.; Maxwell, A.S.; Picón, A.; Ciappina, M.F.; Kim, D.E.; Ticknor, C.; Saxena, A.; Lewenstein, M. Circular dichroism in higher-order harmonic generation: Heralding topological phases and transitions in Chern insulators. Phys. Rev. B 2020, 102, 134115. doi:\changeurlcolorblack10.1103/PhysRevB.102.134115.
- Baykusheva et al. (2021) Baykusheva, D.; Chacón, A.; Kim, D.; Kim, D.E.; Reis, D.A.; Ghimire, S. Strong-field physics in three-dimensional topological insulators. Phys. Rev. A 2021, 103, 023101. doi:\changeurlcolorblack10.1103/PhysRevA.103.023101.
- Tancogne-Dejean et al. (2017) Tancogne-Dejean, N.; Mücke, O.D.; Kärtner, F.X.; Rubio, A. Ellipticity dependence of high-harmonic generation in solids originating from coupled intraband and interband dynamics. Nature Comm. 2017, 8, 2041. doi:\changeurlcolorblack10.1038/s41467-017-00764-5.
- Baykusheva et al. (0) Baykusheva, D.; Chacón, A.; Lu, J.; Bailey, T.P.; Sobota, J.A.; Soifer, H.; Kirchmann, P.S.; Rotundu, C.; Uher, C.; Heinz, T.F.; Reis, D.A.; Ghimire, S. All-Optical Probe of Three-Dimensional Topological Insulators Based on High-Harmonic Generation by Circularly Polarized Laser Fields. Nano Letters 0, 0, null, [https://doi.org/10.1021/acs.nanolett.1c02145]. PMID: 34676752, doi:\changeurlcolorblack10.1021/acs.nanolett.1c02145.
- Hasan and Kane (2010) Hasan, M.Z.; Kane, C.L. Colloquium: Topological insulators. Rev. Mod. Phys. 2010, 82, 3045–3067, [https://arxiv.org/abs/1002.3895]. doi:\changeurlcolorblack10.1103/RevModPhys.82.3045.
- Haldane (2017) Haldane, F.D.M. Nobel Lecture: Topological quantum matter. Rev. Mod. Phys. 2017, 89, 040502. doi:\changeurlcolorblack10.1103/RevModPhys.89.040502.
- Langer et al. (2018) Langer, F.; Schmid, C.P.; Schlauderer, S.; Gmitra, M.; Fabian, J.; Nagler, P.; Schüller, C.; Korn, T.; Hawkins, P.G.; Steiner, J.T.; Huttner, U.; Koch, S.W.; Kira, M.; Huber, R. Lightwave valleytronics in a monolayer of tungsten diselenide. Nature 2018, 557, 1476–4687. doi:\changeurlcolorblack10.1038/s41586-018-0013-6.
- Xiao et al. (2012) Xiao, D.; Liu, G.B.; Feng, W.; Xu, X.; Yao, W. Coupled Spin and Valley Physics in Monolayers of and Other Group-VI Dichalcogenides. Phys. Rev. Lett. 2012, 108, 196802. doi:\changeurlcolorblack10.1103/PhysRevLett.108.196802.
- Shin et al. (2019) Shin, D.; Sato, S.A.; Hübener, H.; De Giovannini, U.; Kim, J.; Park, N.; Rubio, A. Unraveling Materials Berry Curvature and Chern Numbers from Real-Time Evolution of Bloch States. Proceedings of the National Academy of Sciences 2019, 116, 4135–4140. doi:\changeurlcolorblack10.1073/pnas.1816904116.
- Yoshikawa et al. (2017) Yoshikawa, N.; Tamaya, T.; Tanaka, K. High-harmonic generation in graphene enhanced by elliptically polarized light excitation. Science 2017, 356, 736–738. doi:\changeurlcolorblack10.1126/science.aam8861.
- Mrudul and Dixit (2021) Mrudul, M.S.; Dixit, G. High-harmonic generation from monolayer and bilayer graphene. Phys. Rev. B 2021, 103, 094308. doi:\changeurlcolorblack10.1103/PhysRevB.103.094308.
- Tancogne-Dejean et al. (2020) Tancogne-Dejean, N.; Oliveira, M.J.T.; Andrade, X.; Appel, H.; Borca, C.H.; Le Breton, G.; Buchholz, F.; Castro, A.; Corni, S.; Correa, A.A.; De Giovannini, U.; Delgado, A.; Eich, F.G.; Flick, J.; Gil, G.; Gomez, A.; Helbig, N.; Hübener, H.; Jestädt, R.; Jornet-Somoza, J.; Larsen, A.H.; Lebedeva, I.V.; Lüders, M.; Marques, M.A.L.; Ohlmann, S.T.; Pipolo, S.; Rampp, M.; Rozzi, C.A.; Strubbe, D.A.; Sato, S.A.; Schäfer, C.; Theophilou, I.; Welden, A.; Rubio, A. Octopus, a computational framework for exploring light-driven phenomena and quantum dynamics in extended and finite systems. The Journal of Chemical Physics 2020, 152, 124119. doi:\changeurlcolorblack10.1063/1.5142502.
- (30) Zhu, W. Notes on Effective Hamiltonian in Topological Condensed Matter Physical Systems (2012).
- Yue and Gaarde (2020) Yue, L.; Gaarde, M.B. Structure gauges and laser gauges for the semiconductor Bloch equations in high-order harmonic generation in solids. Phys. Rev. A 2020, 101, 053411. doi:\changeurlcolorblack10.1103/PhysRevA.101.053411.
- Kruchinin et al. (2013) Kruchinin, S.Y.; Korbman, M.; Yakovlev, V.S. Theory of strong-field injection and control of photocurrent in dielectrics and wide band gap semiconductors. Phys. Rev. B 2013, 87, 115201. doi:\changeurlcolorblack10.1103/PhysRevB.87.115201.
- Wismer and Yakovlev (2018) Wismer, M.S.; Yakovlev, V.S. Gauge-independent decoherence models for solids in external fields. Phys. Rev. B 2018, 97, 144302. doi:\changeurlcolorblack10.1103/PhysRevB.97.144302.
- Silva et al. (2019) Silva, R.E.F.; Martín, F.; Ivanov, M. High harmonic generation in crystals using maximally localized Wannier functions. Phys. Rev. B 2019, 100, 195201. doi:\changeurlcolorblack10.1103/PhysRevB.100.195201.
- Kim et al. (2021) Kim, D.; Shin, D.; Landsman, A.S.; Kim, D.E.; Chacón, A. Theory for all-optical responses in topological materials: the velocity gauge picture, 2021, [arXiv:cond-mat.mes-hall/2105.12294].
- Li et al. (2018) Li, S.; Liu, C.C.; Yao, Y. Floquet high Chern insulators in periodically driven chirally stacked multilayer graphene 2018. 20, 033025. doi:\changeurlcolorblack10.1088/1367-2630/aab2c7.
- Toh et al. (2017) Toh, R.J.; Sofer, Z.; Luxa, J.; Sedmidubský, D.; Pumera, M. 3R phase of MoS2 and WS2 outperforms the corresponding 2H phase for hydrogen evolution. Chem. Commun. 2017, 53, 3054–3057. doi:\changeurlcolorblack10.1039/C6CC09952A.
- Saito et al. (2017) Saito, N.; Xia, P.; Lu, F.; Kanai, T.; Itatani, J.; Ishii, N. Observation of selection rules for circularly polarized fields in high-harmonic generation from a crystalline solid. Optica 2017, 4, 1333–1336. doi:\changeurlcolorblack10.1364/OPTICA.4.001333.
- Drake and Cassar (2006) Drake, G.W.F.; Cassar, M.M. Springer Handbooks of Atomic, Molecular and Optical Physics, 2006, [2005931256]. doi:\changeurlcolorblackhttps://link.springer.com/book/9783030738921.
- Karsten and Smith (1981) Karsten, L.H.; Smith, J. Lattice fermions: Species doubling, chiral invariance and the triangle anomaly. Nucl. Phys. B 1981, 183, 103–140. doi:\changeurlcolorblack10.1016/0550-3213(81)90549-6.
- Acín et al. (2018) Acín, A.; Bloch, I.; Buhrman, H.; Calarco, T.; Eichler, C.; Eisert, J.; Esteve, D.; Gisin, N.; Glaser, S.J.; Jelezko, F.; Kuhr, S.; Lewenstein, M.; Riedel, M.F.; Schmidt, P.O.; Thew, R.; Wallraff, A.; Walmsley, I.; Wilhelm, F.K. The quantum technologies roadmap: a European community view. New J. Phys. 2018, 20, 080201, [https://arxiv.org/abs/1712.03773]. doi:\changeurlcolorblack10.1088/1367-2630/aad1ea.
- Lewenstein et al. (2012) Lewenstein, M.; Sanpera, A.; Ahufinger, V. Ultracold Atoms in Optical Lattices: Simulating quantum many-body systems; Oxford University Press, 2012.
- Bloch et al. (2008) Bloch, I.; Dalibard, J.; Zwerger, W. Many-body physics with ultracold gases. Rev. Mod. Phys. 2008, 80, 885–964, [https://arxiv.org/abs/0704.3011]. doi:\changeurlcolorblack10.1103/RevModPhys.80.885.
- Cirac and Zoller (2012) Cirac, J.I.; Zoller, P. Goals and opportunities in quantum simulation. Nat. Phys. 2012, 8, 264–266. doi:\changeurlcolorblack10.1038/nphys2275.
- Bloch et al. (2012) Bloch, I.; Dalibard, J.; Nascimbène, S. Quantum simulations with ultracold quantum gases. Nat. Phys. 2012, 8, 267–276. doi:\changeurlcolorblack10.1038/nphys2259.
- Blatt and Roos (2012) Blatt, R.; Roos, C.F. Quantum simulations with trapped ions. Nat. Phys. 2012, 8, 277–284. doi:\changeurlcolorblack10.1038/nphys2252.
- Aspuru-Guzik and Walther (2012) Aspuru-Guzik, A.; Walther, P. Photonic quantum simulators. Nat. Phys. 2012, 8, 285–291. doi:\changeurlcolorblack10.1038/nphys2253.
- Houck et al. (2012) Houck, A.A.; Türeci, H.E.; Koch, J. On-chip quantum simulation with superconducting circuits. Nat. Phys. 2012, 8, 292–299. doi:\changeurlcolorblack10.1038/nphys2251.
- Sala et al. (2017) Sala, S.; Förster, J.; Saenz, A. Ultracold-atom quantum simulator for attosecond science. Phys. Rev. A 2017, 95, 011403, [https://arxiv.org/abs/1311.2304]. doi:\changeurlcolorblack10.1103/PhysRevA.95.011403.
- Senaratne et al. (2018) Senaratne, R.; Rajagopal, S.V.; Shimasaki, T.; Dotti, P.E.; Fujiwara, K.M.; Singh, K.; Geiger, Z.A.; Weld, D.M. Quantum simulation of ultrafast dynamics using trapped ultracold atoms. Nature Commun. 2018, 9, 2065. doi:\changeurlcolorblack10.1038/s41467-018-04556-3.
- Ramos et al. (2019) Ramos, R.; Spiering, D.; Racicot, I.; Steinberg, A.M. Measuring the time a tunnelling atom spends in the barrier 2019. [https://arxiv.org/abs/1907.13523].
- Corkum (1993) Corkum, P.B. Plasma perspective on strong field multiphoton ionization. Phys. Rev. Lett. 1993, 71, 1994. doi:\changeurlcolorblack10.1103/PhysRevLett.71.1994.
- Lewenstein et al. (1994) Lewenstein, M.; Balcou, P.; Ivanov, M.Y.; L’Huillier, A.; Corkum, P.B. Theory of high-harmonic generation by low-frequency laser fields. Phys. Rev. A 1994, 49, 2117. doi:\changeurlcolorblack10.1103/PhysRevA.49.2117.
- Pechukas et al. (1976) Pechukas, P.; George, T.F.; Morokuma, K.; McLafferty, F.J.; Laing, J.R. Analytic structure of the eigenvalue problem as used in semiclassical theory of electronically inelastic collisions. J. Chem. Phys. 1976, 64, 1099–1105. doi:\changeurlcolorblack10.1063/1.432297.
- Hwang and Pechukas (1977) Hwang, J.T.; Pechukas, P. The adiabatic theorem in the complex plane and the semiclassical calculation of nonadiabatic transition amplitudes. J. Chem. Phys. 1977, 67, 4640–4653. doi:\changeurlcolorblack10.1063/1.434630.
- Reuter (2016) Reuter, M.G. A unified perspective of complex band structure: interpretations, formulations, and applications. J. Phys.: Condens. Matter 2016, 29, 053001, [https://arxiv.org/abs/1607.06724]. doi:\changeurlcolorblack10.1088/1361-648x/29/5/053001.
- Blount (1962) Blount, E. Formalisms of Band Theory. In Solid State Physics; Seitz, F.; Turnbull, D., Eds.; Academic Press, 1962; Vol. 13, pp. 305–373.