Development of a Data-Driven Method to Simulate the Detector Response of Anti-neutron at BESIII
Abstract
In this paper, a data-driven method to precisely simulate the detector response of the anti-neutron depositing in the Electromagnetic Calorimeter (EMC) at BESIII is introduced. A large anti-neutron data sample can be selected using the decay from the BESIII data sample of 10 billion events. The detection efficiency for and various observables of anti-neutrons interacting in the EMC detector are simulated, taking the correlations among the variables into consideration. The systematic uncertainty of this data-driven simulation method is determined to be less than 1% on average. This method can be widely applied in physics processes that require precise simulation of the detector response of anti-neutrons in the EMC.
keywords:
Anti-neutron , Electromagnetic calorimeter , Detector simulation , Data-driven , BESIII[First]organization=Department of Modern Physics, University of Science and Technology of China, postcode=230026, city=Hefei, country=China
[Second]organization=State Key Laboratory of Particle Detection and Electronics, postcode=230026, city=Hefei, country=China
1 Introduction
The neutron is one of the primary building blocks of atomic matter in the visible universe. There is a rich physics program involving neutrons in the final state in electron-positron collider experiments, including the study of the electromagnetic form factors of the neutron via [1], and measurements of hyperon () decays which will eventually produce neutrons. Reference [2] discusses a possible new source of neutrons in decays, showing a large potential to study many open problems in particle and nuclear physics. One further example is the investigation of violation in hyperon decays via [3, 4] at BESIII, where the experimental sensitivity is with 1.3 billion , dominated by statistical uncertainty. The BESIII experiment has collected a data sample of 10 billion events, which can be used to study the decays of hyperons with unprecedented precision [5]. Using neutral decay modes of hyperons, the statistics will be further improved due to their large branching fractions, e.g. , [6], and more independent observables can be constructed from the neutral decay parameters. Moreover, the hyperon dominantly decays to neutrons, [6], and its production or decays are hardly discussed in electron-positron collision experiments due to difficulties in neutron reconstruction.
Usually, the anti-particles to neutrons, namely anti-neutrons, are used in the reconstruction instead of neutrons due to their large energy deposition in the calorimeter following an annihilation reaction, which allows for a good discrimination between electromagnetic showers from the annihilation products and photons, measured with the EMC. However, a large discrepancy is observed between data and the simulation of the anti-neutron detector response based on Geant4 [7]. Though many models have been implemented in Geant4 to describe hadron-nucleon interactions, such as quark-gluon string model (QGS), the Fritiof parton model (FTF) or the Bertini and Precompound models, none of them gives a satisfactory result for the simulation of anti-neutrons. A lot of efforts spent on correcting the efficiencies of anti-neutron reconstruction in physics analyses [3, 8, 9], and the systematic uncertainties caused by the Geant4-based simulation are still difficult to determine.
In this paper, we introduce a model-independent data-driven method to simulate the detector response of the anti-neutron at BESIII. Both the detection efficiency and various observables of anti-neutrons are sampled from data, which is independent from the Geant4 simulation. The paper is organized as follows. A brief description of the BESIII experiment is introduced in Sec. 2. The selection of the anti-neutron sample is presented in Sec. 3. Section 4 illustrates the detailed data-driven simulation of the detector response to anti-neutrons in the EMC. Section 5 gives two comparisons between the simulation and data. Finally, a conclusion and further prospects are presented in Sec. 6.
2 The BEPCII and the BESIII experiment
The BESIII detector [10] records symmetric collisions provided by the BEPCII storage ring [11], which operates with a peak luminosity of in the center-of-mass energy range from 2.0 to 4.95 GeV. The cylindrical core of the BESIII detector covers 93% of the full solid angle and consists of a helium-based multilayer drift chamber (MDC), a plastic scintillator time-of-flight system (TOF), and a CsI(Tl) electromagnetic calorimeter (EMC), which are all enclosed in a superconducting solenoidal magnet providing a 1.0 T magnetic field. The solenoid is supported by an octagonal flux-return yoke with resistive plate counter muon identification modules interleaved with steel. The charged-particle momentum resolution at is , and the specific energy loss () resolution is for electrons from Bhabha scattering. The time resolution in the TOF barrel region is 68 ps, while that in the end cap region is 110 ps. The end cap TOF system was upgraded in 2015 using multi-gap resistive plate chamber technology, providing a time resolution of 60 ps [12, 13, 14].
The EMC at BESIII is designed to precisely measure the deposited energies of neutral particles and to provide trigger conditions. It is comprised of 6240 CsI(Tl) crystals, arranged in one barrel and two end caps. The barrel has an inner radius of 94 cm and a length of 275 cm. The end caps have an inner length of 50 cm and are placed 138 cm from the collision point. The angular coverage is within the polar angle range of for the barrel and for the end caps. The EMC measures the energies of electrons and photons with an energy resolution of () at GeV in the barrel (end cap) region; the position is measured with a resolution of .
Using this detector setup, anti-neutrons can be detected by the EMC with a relatively high efficiency. The anti-neutrons are likely to annihilate in the EMC [15] and produce several secondary particles. The largest energy deposition () can be as high as 2 GeV. Other variables used to characterize showers from the anti-neutron in the EMC include the number of hits () from the primary shower and the second moment () of the shower, defined as , with the energy deposited in the crystal of the shower and the distance from the center of that crystals to the center of the shower.
3 Anti-neutron samples
3.1 Selection of
To study the performance of anti-neutrons in the EMC, a large sample of anti-neutrons with high purity is needed. The process has several advantages for the study of anti-neutron properties from data: a large amount of anti-neutron events can be selected from 10 billion events thanks to a fraction of [6]; the momentum of the anti-neutrons covers a large range from above 0 to 1.2 GeV/ in the whole angular acceptance; the anti-neutron signal can be determined precisely with low backgrounds by reconstructing the four-momenta of and and studying the recoil side of .
The charged tracks are reconstructed from hits in the MDC. The polar angles of charged tracks are required to fulfill . The distance of closest approach to the interaction point of each charged track must be within cm along the beam direction () and be within cm in the plane perpendicular to the beam axis (). This vertex requirement is applied to suppress beam-associated backgrounds. Two tracks with opposite charge are required in each event. Any events with additional charged tracks within cm and cm are rejected to suppress the background mainly caused by anti-neutron annihilation within the beam pipe material. The combined information from and TOF is used to calculate particle identification (PID) probabilities for the pion, kaon and proton hypotheses, respectively, and the particle type with the highest probability is assigned to the corresponding track. In each event, exactly one and one are required. A vertex fit is performed for the two selected tracks to improve the momentum resolution and the corresponding of vertex fit is required to be less than 30. After the above selection, the invariant mass of the system recoiling against , , is shown in Fig. 1, where a clear peak is observed in data that indicates the signal from the anti-neutron.
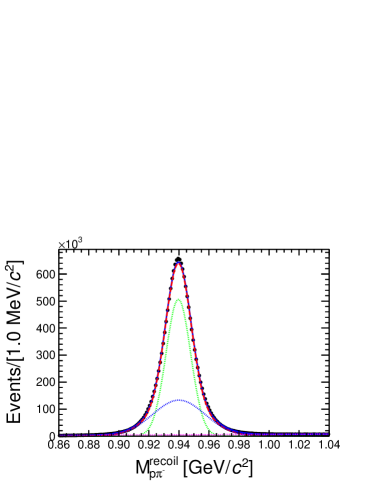
A large inclusive sample of about 10 billion simulated events is used to estimate possible background contributions, where the resonance is generated by kkmc [16, 17] subsequent decays with known branching fractions are generated by EvtGen [18], and the remaining unmeasured decays are generated by LundCharm [19]. Studies of the inclusive MC simulation indicate that very few background events can survive after application of above selection criteria, and the main background contribution comes from the process , which does not peak in the signal region of . To obtain the signal yield of , a binned maximum likelihood fit is performed on the distribution, where the signal is described by a double-Gaussian shape function, and the background is described by a first-order Chebyshev polynomial. The fit result is shown in Fig. 1 and yields signal events. The error is statistical only. The background contribution in the signal region is about 2.1% and flat. The results of the fit are used to determine the amount of background events as a pre-study for the following sideband analysis within .
3.2 Anti-neutron selection
Neutral shower candidates are reconstructed from isolated clusters in the EMC crystals. Efficiency and energy resolution are improved by including the energy deposited in the nearby TOF counters. A minimum energy of 25 MeV in barrel region () or 50 MeV in end caps region () is required for a good neutral shower. The most energetic among the good neutral showers is assigned to be the anti-neutron candidate. With this requirement, the anti-neutron shower can be selected with a purity over 99% from data, which is estimated by matching the position of the selected shower with that predicted by the recoil system.
\begin{overpic}[width=130.08731pt]{nbar_energy.eps} \put(80.0,55.0){\small{(a)}} \end{overpic} \begin{overpic}[width=130.08731pt]{nbar_secmom.eps} \put(80.0,55.0){\small{(b)}} \end{overpic} \begin{overpic}[width=130.08731pt]{nbar_hits.eps} \put(80.0,55.0){\small{(c)}} \end{overpic}
Several distributions of anti-neutron showers are investigated with the selected anti-neutron sample as shown in Fig. 2. The definitions of signal and sidebands are the same as in Sec. 3.1. A further selection criterion on the deposited energy from the primary anti-neutron shower, GeV, is applied to distinguish the signal showers from background. The Geant4-based signal MC for is simulated with a uniform phase space (PHSP) generator and is used for a comparison with data. To have a fair comparison between data and signal MC, a weight depending on the momentum and polar angle of the anti-neutron is applied to the signal MC. A large discrepancy between simulated and measured anti-neutrons is observed as shown in Fig. 2, which indicates that the simulation of anti-neutrons based on Geant4 is unreliable. In many analyses, various requirements on , and are applied on the anti-neutron to further suppress background events. The large discrepancy in these distributions will cause a large error for the detection efficiency. Therefore, the simulation performance of anti-neutrons in the EMC needs to be improved. In the following, we introduce a Geant4-independent way to simulate an anti-neutron detector response via a data-driven method.
4 Simulation of the detector response to anti-neutrons
The detection efficiency and observables in the EMC for anti-neutrons can be treated separately in the Geant4-independent simulation. Firstly, a detection efficiency for anti-neutrons is obtained from the selected sample, as determined by the number of signal events in before and after the shower selection as described in Sec. 3 including any further requirements on the anti-neutron shower. The efficiency of anti-neutron from MC simulation can then be sampled with the Accept-Reject Sampling method [20]. Secondly, various observables are simulated according to the distributions from data via an inverse transform sampling method [21], including the characteristic variables which describe the shower of the anti-neutron, e.g. , and , and kinematic variables, e.g. polar angle and azimuth angle , as well as their errors.
4.1 Detection efficiency
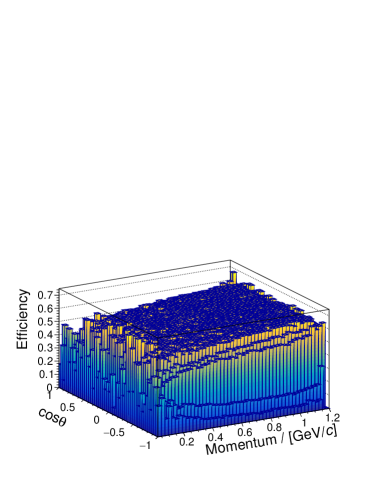
The detection efficiency of the anti-neutron for any selection criteria can be well expressed in terms of momentum and polar angle . The efficiency surface is determined by
| (1) |
where and stand for the number of signal events in a given and range before and after applying the selection criteria, respectively. For the 2D efficiency matrix, the momentum is divided into 50 bins in the range (0, 1.2) GeV/, and the range of the polar angle is divided into 36 bins for and 84 bins for . The number of signal events is determined by counting the events of in the corresponding range of and in data after subtracting the background events as described in Sec. 3.
An example distribution of the anti-neutron efficiency as a function of and obtained from data is shown in Fig. 3. Such a model independent, data-driven efficiency can be used to replace the efficiency in Geant4-based MC by adopting the Accept-Reject Sampling method [20]. The framework for simulating the detection efficiency is presented in Algorithm 1.
In Algorithm 1, the detection efficiency for an anti-neutron is sampled according to an efficiency in a bin of the anti-neutron as expressed above. The intrinsic uncertainty of is given by summing statistical and systematic uncertainties in quadrature, which will be used to derivate the systematic uncertainties of this algorithm. The systematic uncertainties of the detection efficiency mainly come from the estimation of the background contribution, where alternative fits are performed on with a second-order polynomial for background, or the usage of a different fitting range. The resulting differences on the background estimation are taken as the systematic uncertainty. The average systematic uncertainties from the background shape and fit range are 0.3% and 0.03%, respectively.
4.2 Anti-neutron observables in EMC
Typically, there are two kinds of observables for anti-neutrons to be considered in physics analyses. The first group comprises the characteristic variables used to distinguish anti-neutron showers from photon showers, such as , and etc. These applications can be found in Ref. [1, 3]. The second group contains the kinematic-related variables which can be involved in kinematic fitting [22], such as in Ref. [8, 9]. For kinematic fits including anti-neutrons, the energy information is missing since anti-neutrons do not actually deposit all their energy in the EMC. Instead, the position information, and , and the corresponding errors, and , are implemented in the kinematic fit and therefore need to be simulated precisely. The framework for the simulation of such kind of observables is presented in Algorithm 2.
In Algorithm 2, an inverse transform sampling method is performed to simulate observables, where the cumulative distribution functions (CDFs) are calculated from the normalized distributions of the anti-neutrons observables in data. The CDF is a monotonly rising function as shown in Fig. 4 for as an example. With a given random number from 0 to 1, one can determine the corresponding value. This method is widely used for the sampling of a distribution which cannot be easily parameterized.
Unlike the detection efficiency of the anti-neutron which is only related to the momentum and polar angle , there are correlations among the observables. In the following, we describe the details about the simulation of characteristic variables and kinematic-related variables of the anti-neutron.
-
•
Characteristic variables of the anti-neutron
The distributions of characteristic variables, , and , are dependent on the momentum and the polar angle of the anti-neutron. The momentum range is divided into 50 bins for (0, 1.2) GeV/, and the polar angle is divided into 50 bins within . The distributions of simulated observables by means of Algorithm 2 are consistent with these from data, as shown in Fig. 2.
\begin{overpic}[width=195.12767pt]{energyCDF.eps} \put(80.0,55.0){} \end{overpic}
Figure 4: Cumulative distribution function (CDF) of as an example in the 30th bin of and 25th bin of . A random variable with distribution can be calculated from by a random number generated from a uniform distribution in the interval [0, 1]. -
•
Kinematic variables of the anti-neutron
The kinematic fit including an anti-neutron uses the spatial information , measured with the EMC and their error matrix while the deposited energy is a free parameter. The reconstructed and are determined by the spatial resolution of the anti-neutron at EMC, i.e. the opening angle between the position vectors of the anti-neutron shower in the EMC and its direction as simulated on the generator level . A good agreement on between data and MC are necessary. Figure 5 shows the comparison between data and Geant4-based simulation for , where a large discrepancy is observed.
\begin{overpic}[width=195.12767pt]{Corr_nbar_degree.eps} \put(80.0,55.0){\small{(a)}} \end{overpic} \begin{overpic}[width=195.12767pt]{Corr_nbar_chisq.eps} \put(80.0,55.0){\small{(b)}} \end{overpic}
Figure 5: (a) Distribution of the opening angle between the position of the anti-neutron shower in the EMC and its direction on generator level; (b) distributions from the 3C kinematic fit. The black dots with error bar are results from data. The red lines are Geant4-based simulation. The blue lines are Geant4-independent simulation. The distribution of is relevant for the momentum , polar angle and the deposited energy . As a consequence, a 3D sampling is necessary for the simulation of . To guarantee that the number of entries in most bins are larger than , the momentum range is divided into 12 bins for (0, 1.2) GeV/; the polar angle range is divided into 20 bins from -1 to 1; the deposited energy is divided into 10 bins for (0, 1.0) GeV, 2 bins from 1.0 to 1.4 GeV and one bin for GeV. With the application of Algorithm 2 for the simulation of , a good agreement is achieved as shown in Fig. 5.
The polar angle and azimuthal angle of the anti-neutron can then be calculated from , by
(2a) (2b) where and are the polar and azimuthal angles of the anti-neutron on the generator level, and is a uniform random number in the range between 0 to .
-
•
Error matrix of the anti-neutron
For the kinematic fit, an initial error matrix of the anti-neutron is needed as input for further iterations and for calculating the value. As there is no correlation considered between and , only the diagonal elements of the error matrix are non-zero. By default, the error matrix of the EMC shower is obtained by assuming an electromagnetic shower from a photon or electron. However, the error matrix of the anti-neutron is very different since larger error matrix elements are expected due to its wider shower shape. Therefore, the error matrix elements should be re-simulated for the kinematic fit for both data and MC. Two diagonal matrix elements, and , are obtained from Eq. 2. The resolutions depend on and , and the corresponding 2D sampling is performed with divided into 20 bins from 0 to 2.0 GeV and divided into 50 bins within .
As an example, the kinematic fit is performed for , including the spatial information of the anti-neutron. It is denoted as a 3C kinematic fit, with four-momentum constraint and one free parameter, the energy deposition of the anti-neutron. The distributions from the Geant4-based simulation and the Geant4-independent simulation are shown in Fig. 5(b).
4.3 Effects of the detector resolution
There is a small gap between the barrel and end caps in EMC. The edge effect due to spatial resolution, which can lead to migration of anti-neutron showers from the barrel to the end caps, or vice versa, needs to be considered.
\begin{overpic}[width=143.09538pt]{shower_coseff.eps}
\put(80.0,60.0){\small{(a)}}
\end{overpic}
\begin{overpic}[width=143.09538pt]{shower_peff.eps}
\put(80.0,60.0){\small{(b)}}
\end{overpic}
\begin{overpic}[width=143.09538pt]{total_costhetaeff.eps}
\put(80.0,60.0){\small{(c)}}
\end{overpic}
\begin{overpic}[width=143.09538pt]{total_peff.eps}
\put(80.0,60.0){\small{(d)}}
\end{overpic}
A simplified unfolding method is used to correct the edge effect along near the gaps. In each momentum bin, a conditional probability is defined as
| (3) | ||||
where is the number of events found in the barrel in the -th bin of at the generator level, and is the number of events of the latter. For each event, we generate a random number from . If , the anti-neutron should be considered as detected in barrel, otherwise it should be considered as detected in end caps. Due to the limitation of statistics and the beam-associated background, the quality of the simualtion of the anti-neutron in end caps is worse than that in barrel, as shown in Fig. 6.
In the sampling of kinematic variables, information of the anti-neutron, e.g., , from its generator level is needed. However, this can only be obtained from the recoil system of in data, . The difference between and will lead to a bias in the simulation. To correct this, can be considered as the convolution of with a resolution function ,
| (4) |
An interface class provided by ROOT [23] is used to perform a deconvolution and to estimate the true four momenta of the anti-neutron.
5 Comparison to experimental data
5.1
The preliminary selection criteria of are the same as in Sec. 3. Further requirements on the characteristic variables of the anti-neutron are applied, e.g. GeV, cm2 and . The set of selection criteria is widely used in analyses to distinguish showers between neutron and anti-neutron. The selection efficiency of the anti-neutron with respect to and as well the divergence between data and simulated MC are shown in Figures. 6(a) and (b). Excellent agreement can be observed for data and the Geant4-independent simulation.
Furthermore, a three-constraint kinematic fit imposing energy-momentum conservation is implemented under the hypothesis of , and the corresponding is required to be less than 40. Fig. 6(c) and (d) show the efficiency after the applied kinematic fit, where the overall difference between data and simulation is less than 1% in . Due to the sensitivity of the kinematic fit and the low statistics at low momentum of the anti-neutron in , the difference is found to be larger than 1% at low , while the difference between data and simulation is less than 1% for GeV/.
5.2
The decay process is used to study the polarization of and probe violation [3]. A precise simulation of anti-neutron related observables is essential for improving the sensitivity of violation at BESIII. Here we present the measurement of branching fraction of using the anti-neutron simulation developed in this work. The process is denoted as tag side with following selection criteria: candidates for are reconstructed by combining two oppositely charged tracks into the final states ; two daughter tracks are constrained to originate from a common decay vertex by requiring of the second vertex fit to be less than 35. The single tag efficiency is and the signal yield is utilizing 1.3 billion events collected at BESIII. For the signal side of , at least three showers are required. The most energetic shower with deposited energy larger than is considered as the anti-neutron candidate. Another pair of showers, differing at least by from the anti-neutron shower vector, are used to reconstruct the candidates. To improve the resolution, a three-constraint (3C) kinematic fit is performed imposing energy-momentum conservation, and the is required to be less than 200. The double tag efficiency is and the final signal yield is . The branching fraction can be determined by
| (5) |
to be with the anti-neutron simulated using the data-driven method described in this paper. The uncertainty is statistical. The result is consistent with the PDG value [6] within the statistical uncertainty. The distributions of angular position and the invariant mass of can be found in Fig. 7.
\begin{overpic}[width=195.12767pt]{lambdacostheta.eps} \put(80.0,55.0){$(a)$} \end{overpic} \begin{overpic}[width=195.12767pt]{mass3c.eps} \put(80.0,55.0){$(b)$} \end{overpic}
6 Summary
In this paper, a data-driven method developed to provide a Geant4-independent simulation of the detector response of the anti-neutron in the EMC at BESIII is introduced. A large amount of anti-neutrons is selected from the process . The performance of the anti-neutron in the EMC is simulated, including its detection efficiency and various observables. Our approach ensures a high agreement between data and simulation, when determining the detection efficiency of the anti-neutron, as well as a satisfying precision from a kinematic fit procedure, e.g. the systematic uncertainty can be reduced to be 1% on average. The algorithm can be used effectively in a variety of physics processes in the future at BESIII, such as the measurement of nucleon electromagnetic form factors, or the hyperon decay and corresponding sensitivity probe of hyperons.
We want to mention that this method can also be used to simulate other neutral particles at BESIII, such as the neutron and . At BESIII, which collected 10 billion events, a large amount of neutrons can be selected from , and can be selected from , respectively, which ensures the feasibility of simulating the detector response of these neutral particles with our data-driven method.
Acknowledgments
The authors gratefully thank the BESIII Collaboration for the profitable discussion and internal review, thank Kai Zhu, Chunxiu Liu and Paul Larin for their suggestions and proofreading, thank Xiaobin Ji, Karin Schonning, Weimin Song, Bo Zheng, Liaoyuan Dong and Wolfgang Gradl for their help to improve the analysis. This work is supported partly by the National Science Foundation of China under Project No.12122509, 11911530140, U1832103, 11625523, USTC Research Funds of the Double First-Class Initiative YD2030002005 and the Fundamental Research Funds for the Central Universities.
References
- [1] M. Ablikim, et al., Oscillating features in the electromagnetic structure of the neutron, Nature Phys. 17 (11) (2021) 1200–1204. doi:10.1038/s41567-021-01345-6.
-
[2]
C.-Z. Yuan, M. Karliner,
Cornucopia of
Antineutrons and Hyperons from a Super Factory for
Next-Generation Nuclear and Particle Physics High-Precision Experiments,
Phys. Rev. Lett. 127 (2021) 012003.
doi:10.1103/PhysRevLett.127.012003.
URL https://link.aps.org/doi/10.1103/PhysRevLett.127.012003 - [3] M. Ablikim, et al., Polarization and Entanglement in Baryon-Antibaryon Pair Production in Electron-Positron Annihilation, Nature Phys. 15 (2019) 631–634. arXiv:1808.08917, doi:10.1038/s41567-019-0494-8.
- [4] M. Ablikim, et al., Weak phases and CP-symmetry tests in sequential decays of entangled double-strange baryons (5 2021). arXiv:2105.11155.
- [5] H. B. Li, Prospects for rare and forbidden hyperon decays at BESIII, Front. Phys. (Beijing) 12 (5) (2017) 121301, [Erratum: Front.Phys.(Beijing) 14, 64001 (2019)]. arXiv:1612.01775, doi:10.1007/s11467-017-0691-9.
- [6] P. A. Zyla, et al., Review of Particle Physics, PTEP 2020 (8) (2020) 083C01. doi:10.1093/ptep/ptaa104.
- [7] S. Agostinelli, et al., GEANT4–a simulation toolkit, Nucl. Instrum. Meth. A 506 (2003) 250–303. doi:10.1016/S0168-9002(03)01368-8.
- [8] M. Ablikim, et al., First Measurements of Decays, Phys. Rev. D 101 (9) (2020) 092002. arXiv:2004.01394, doi:10.1103/PhysRevD.101.092002.
- [9] M. Ablikim, et al., Measurements of and time-like electromagnetic form factors for center-of-mass energies from 2.3864 to 3.0200 GeV, Phys. Lett. B 814 (2021) 136110. arXiv:2009.01404, doi:10.1016/j.physletb.2021.136110.
- [10] M. Ablikim, et al., Design and Construction of the BESIII Detector, Nucl. Instrum. Meth. A 614 (2010) 345–399. arXiv:0911.4960, doi:10.1016/j.nima.2009.12.050.
- [11] C. Yu, et al., BEPCII Performance and Beam Dynamics Studies on Luminosity, in: 7th International Particle Accelerator Conference, 2016. doi:10.18429/JACoW-IPAC2016-TUYA01.
- [12] X. Li, Y. Sun, C. Li, Z. Liu, Y. Heng, M. Shao, X. Wang, Z. Wu, P. Cao, M. Chen, Study of MRPC technology for BESIII endcap-TOF upgrade, Radiation Detection Technology and Methods 1 (2) (2017) 13.
- [13] Y. X. Guo, S. S. Sun, F. F. An, R. X. Yang, M. Zhou, Z. Wu, H. L. Dai, Y. K. Heng, C. Li, Z. Y. Deng, The study of time calibration for upgraded end cap TOF of BESIII, Radiation Detection Technology and Methods 1 (2) (2017) 15.
- [14] P. Cao, et al., Design and construction of the new BESIII endcap Time-of-Flight system with MRPC Technology, Nucl. Instrum. Meth. A 953 (2020) 163053. doi:10.1016/j.nima.2019.163053.
-
[15]
M. Astrua, E. Botta, T. Bressani, D. Calvo, C. Casalegno, A. Feliciello,
A. Filippi, S. Marcello, M. Agnello, F. Iazzi,
Antineutron-nucleus
annihilation cross sections below 400 MeV/c, Nuclear Physics A 697 (1)
(2002) 209–224.
doi:https://doi.org/10.1016/S0375-9474(01)01252-0.
URL https://www.sciencedirect.com/science/ARTICLE/pii/S0375947401012520 - [16] S. Jadach, B. F. L. Ward, Z. Was, The Precision Monte Carlo event generator K K for two fermion final states in collisions, Comput. Phys. Commun. 130 (2000) 260–325. arXiv:hep-ph/9912214, doi:10.1016/S0010-4655(00)00048-5.
- [17] S. Jadach, B. F. L. Ward, Z. Was, Coherent exclusive exponentiation for precision Monte Carlo calculations, Phys. Rev. D 63 (2001) 113009. arXiv:hep-ph/0006359, doi:10.1103/PhysRevD.63.113009.
- [18] D. J. Lange, The EvtGen particle decay simulation package, Nucl. Instrum. Meth. A 462 (2001) 152–155. doi:10.1016/S0168-9002(01)00089-4.
-
[19]
J. C. Chen, G. S. Huang, X. R. Qi, D. H. Zhang, Y. S. Zhu,
Event generator
for and decay, Phys. Rev. D
62 (2000) 034003.
doi:10.1103/PhysRevD.62.034003.
URL https://link.aps.org/doi/10.1103/PhysRevD.62.034003 - [20] G. Casella, R. Wells, Generalized accept-reject sampling schemes, Lecture Notes-Monograph Series 45 (2004) 342–347.
- [21] Caflisch, E. Russel, Monte carlo and quasi-monte carlo methods, Acta Numerica 7 (1998) 1–49.
- [22] L. Yan, et al., Lagrange multiplier method used in BESIII kinematic fitting, Chin. Phys. C 34 (2010) 204–209. doi:10.1088/1674-1137/34/2/009.
-
[23]
F. Rademakers, R. Brun, P. Canal, A. Naumann, O. Couet, L. Moneta, G. Ganis,
V. Vassilev, D. Piparo, B. Bellenot, Root - an
object-oriented data analysis framework. root-project/root: v5.34/09 (2013).
URL https://root.cern/