Vehicular Visible Light Communications
Noise Analysis and Autoencoder Based Denoising
Abstract
Vehicular visible light communications (V-VLC) is a promising intelligent transportation systems (ITS) technology for vehicle-to-vehicle (V2V) and vehicle-to-infrastructure (V2I) communications with the utilization of light emitting diodes (LEDs). The main degrading factor for the performance of V-VLC systems is noise. Unlike traditional radio frequency (RF) based systems, V-VLC systems include many noise sources: solar radiation, background lighting from vehicle, street, parking garage and tunnel lights. Traditional V-VLC system noise modeling is based on the additive white Gaussian noise assumption in the form of shot and thermal noise. In this paper, to investigate both time correlated and white noise components of the V-VLC channel, we propose a noise analysis based on Allan variance (AVAR), which provides a time-series analysis method to identify noise from the data. We also propose a generalized Wiener process based V-VLC channel noise synthesis methodology to generate different noise components. We further propose convolutional autoencoder (CAE) based denoising scheme to reduce V-VLC signal noise, which achieves reconstruction root mean square error (RMSE) of 0.0442 and 0.0474 for indoor and outdoor channels, respectively.
I Introduction
Vehicular communications, enabling various form of connectivity between road users such as V2V, V2I and vehicle-to-pedestrian (V2P) communications, aim to increase road safety and efficiency through the exchange of traffic, road and vehicle information. Currently, RF based cellular-vehicle-to-everything (C-V2X) [1] and Dedicated Short Range Communication (DSRC) [2] technologies are standardized to support vehicle-to-everything (V2X) applications. However, omnipresence of LEDs in the vehicle lighting paves the way for V-VLC as a complementary technology to the existing schemes. Since V-VLC provides RF interference, jam and spoof free directional optical communications, it is mainly foreseen to be a strong candidate to enable secure vehicular communications.
V-VLC signal quality substantially degrades with the noise due to ambient lighting sourced from solar radiation, traffic lights, road lighting, and vehicle lights in the V-VLC channel. Thus, accurate noise characterization and artificial noise synthesis plays an important role in the evaluation of system performance to address different background lighting conditions. Moreover, reducing V-VLC signal noise increases signal-to-noise ratio (SNR), increasing symbol detection probability.
Noise for the visible light communication (VLC) schemes is generally assumed to composed of shot noise and thermal noise in the form of white Gaussian noise [3]. Shot noise arises due to photons incident on the photodetector (PD) active area and increases with the square root of the incident optical power. Therefore, background lights, together with the modulated V-VLC transmitter are the main sources of shot noise. On the other hand, thermal noise is mainly generated by the receiver circuits, due to irregular motion of electrons in conducting materials [4]. Thermal noise increases with the operating temperature of receiver electronics and decreases with the increasing resistance, which is independent from the incident optical power. In the literature, VLC noise is characterized in [5] for indoor environments, where the noise is demonstrated to exhibit time correlated characteristics due to LED lighting. Moreover, noise for outdoor V-VLC is investigated in [6, 7], where [6] presents the VLC system bit-error-rate (BER) degradation due to solar irradiance induced noise and [7] provides V-VLC BER analysis with the consideration of thermal, shot, dark and intersymbol interference (ISI) noise. However, none of the studies to date has empirically characterized the V-VLC noise in terms of different noise components for various ambient light sources. Moreover, V-VLC signal denoising has not been investigated to date.
In this paper, we investigate the time correlation properties of V-VLC noise due to background lighting and identify noise components by using AVAR. We further propose a generalized Wiener process to synthesize V-VLC channel noise for simulation purposes. Moreover, we present a denoising scheme to reduce V-VLC signal noise. The main novel contributions of this paper are threefold.
-
•
We analyze the time correlation of noise together with LED transmitter-optical receiver distance dependence in the V-VLC channel based on the real world data collected for solar radiation and LED ambient light disturbed channels, for the first time in the literature.
-
•
We identify the V-VLC channel noise types by using AVAR and artificially generate the time-correlated artificial light induced noise with a Wiener filter based recursive algorithm.
-
•
We propose a CAE based V-VLC signal denosing scheme to remove the adversarial effects of ambient light induced noise, for the first time in the literature.
The rest of the paper is organized as follows. Section II provides the methodologies used to identify noise components, synthesize noise and denoising. Section III details the experimental setup which is used to capture noise and V-VLC signals for different ambient lighting conditions. In Section IV, we provide the results for noise characterization, noise synthesis and the proposed denoising scheme performance. Section V concludes the paper.
II Methodology
II-A Noise Analysis
V-VLC receivers generate electrical signals from the incident photons on PD. The detection of photons from the V-VLC transmitter and background lighting is considered to be the primary noise source for V-VLC, known as photon shot noise. Moreover, the variation in the amount of PD dark current due to the thermal excitation of electrons within the silicon chip in the absence of incidence photons constitutes the dark shot noise. On the other hand, the optical-to-electrical converted signals are amplified at the receiver by trans-impedance circuits, which generate thermal noise by the thermal fluctuation of electrons in the load resistance of the circuits. The shot noise and thermal noise are generally assumed to follow Gaussian distribution, which yields limited accuracy for noise modeling, since various forms of ambient lights can lead different noise distributions.
Considering a V-VLC transceiver with a LED transmitter and optical receiver, the V-VLC received signal is described as
| (1) |
where x(t) is the transmitted V-VLC signal, is the responsivity of PD (A/W), is the optical channel response, and represents the channel noise.
The can be in the form of white noise, where the values at any point are independent and uncorrelated from the other values, or colored noise, where the values are correlated to the other points. The noise is characterized by its power spectrum, which decays as , where describes the type of noise (i.e., white noise, flicker noise, random walk noise) and represents the frequency [8]. In the context of VLC, white noise, flicker noise and random walk noise can be regarded as dominant noise sources due to receiver electronics, DC offset and LED modulation, respectively [5].
When no background lighting is present, can be modeled as a signal independent, zero mean Gaussian random variable with standard deviation of and power spectral density (PSD) given by, , where . However, considering background lighting from other light sources such as street lights, and other vehicle lights, noise can exhibit time correlated behavior at different correlation times [5]. Therefore, time correlation of VLC noise for different channels is investigated by using Ljung Box test to identify the noise time correlation characteristics, where the identified noise components are further quantified with the noise coefficients by using AVAR.
Ljung Box Q-test
The Ljung-Box method tests the auto-correlation structure of the data samples for the null hypothesis of independent distribution of the data against the hypothesis of the correlated data by using test statistic [9]. Let the channel noise process with samples be defined as , then, the sample auto-correlation, , at lag , is given by
| (2) |
The null and alternative hypotheses are
Hypothesis 0 (White noise):
Hypothesis 1 (Colored noise):
Considering the null hypothesis, the Ljung-Box test statistic, , is calculated as
| (3) |
where is the number of lags. Considering the significance level , the threshold above which the the null hypothesis is rejected becomes the -quantile as , where is the value of the chi-square distribution corresponding to the significance level and degrees of freedom.
To further analyze noise characteristics by the identification of noise coefficients for white, flicker and random walk noise, AVAR method is used.
Allan Variance
AVAR provides a time-series analysis method to identify noise from the data based on the derivation of the evolution of root mean squares random drift error with time. To obtain the Allan variance for a discrete random variable with samples, first, clusters from samples are formed, where , and the total number of clusters is the integer of . Then, the mean value of two adjacent clusters is calculated as
| (4) |
| (5) |
The AVAR of cluster with length can be described as
| (6) |
where the log-log plot of AVAR calculated by (6) with cluster length allows to identify different noise types by the slope of the curves, where the curve slope of the Allan deviation (i.e., square root of AVAR), is , and for white, flicker and random walk noise, respectively [10].
Considering two-sided PSD, , of the continuous random process, the relationship between the AVAR and the is given by [5]
| (7) |
where substitution of the considered noise PSD into the equation and performing integration yields noise coefficients as defined in the IEEE standard [10].
Time-correlated random walk noise is observed for VLC channel due to Brownian motion in the receiver circuit [5], which is given by , where is the random walk coefficient, calculated by . Flicker noise, observed in almost all electronic devices including VLC receivers due to the flow of direct current is given by, , where is the flicker noise coefficient, represented by . Therefore, the V-VLC system channel noise is identified by the extraction of flicker noise (), white noise () and random-walk () coefficients evaluating the log-log plots of , and at the respective values (i.e., white noise =(1), flicker = (3), random walk = ().
II-B Noise Synthesis
Noise synthesis is useful to simulate practical V-VLC noise behaviour for different background lighting conditions, where white noise and correlated perturbations in the form of flicker noise and random walk can be obtained by using AVAR. Then, a recursive Wiener filter based method is employed to generate artificial V-VLC noise yielding the desired noise coefficients. The colored noise is defined as the convolution of white noise () with an impulse response function, where a white noise process is filtered by using a generalized Wiener filter for as
| (8) |
Representing as the power series, , the weights are recursively calculated by [8]
| (9) |
Then, taking the inverse Z transform of yielding and substituting into the discrete convolution, the colored noise vector of length is obtained by
| (10) |
where is an independent and identically distributed white noise sequence. The model enables white, flicker and random walk noise samples generation with the selection of and .
II-C Denoising
In practical V-VLC scenarios, noise contaminated V-VLC symbols lead to lower SNR and higher BER due to erroneous detection of the symbols. Moreover, exact characterization, identification and subtraction of the noise requires a comprehensive analysis, since noise sources vary for mobile scenarios. Thus, we propose a CAE based denoising scheme, which learns the noise characteristics from the training data to reconstruct the pulse based V-VLC symbols from their noisy counterparts.
The CAE combines Convolutional Neural Networks (CNNs) [11] with autoencoder (AE) [12], where CNN algorithm takes the input data and assigns importance to the various aspects of the data in form of weights and biases enabling differentiation of the features. For CNN each layer is connected to another with a limited number of connections, and the same pattern is used for all subsequent layer connections yielding special down-sampling (pooling) layers. Thus, the search space for the number of parameters is reduced. CNN consists of convolutional layers, which include a set of filters to extract feature maps describing the input data; max-pooling layers to obtain translation invariance and dimension reduction with down-sampling; and a fully connected layer, which provides regression or classification. On the other hand, AE is a multilayered artificial neural network (ANN), which aims to replicate the input at the output and learns by supervision. AE consists of input, encoding and decoding layers. At the encoder, noise corrupted input data is mapped to a hidden representation by using a non-linear transformation given by , whereas the hidden representation is mapped back to reconstructed data at the decoder through another non-linear transformation as , where and are non-linear activation functions such as Rectified Linear Unit (ReLU), and represent the weight and bias matrix of the encoder, and represent the weight and bias matrix of the decoder, respectively. , , and are minimized with the loss function.
III Measurement Setup
To analyze the V-VLC channel noise time dependence characteristics due to background lighting sources, we test three different data-sets where the channel is disturbed by indoor parking garage LED lighting, outdoor solar radiation, and vehicle LED lights. At the receiver side, a PD (Thorlabs-PDA100A) with a plano convex lens (Thorlabs-LA1050-A) converts the ambient light optical signals into electrical signals. Then, a high speed digital storage oscilloscope (RohdeSchwarz RTA-4004) is used to digitize and store the measurement samples. The background lighting of the indoor parking garage is composed of 8 LEDs driven by alternative current (AC), whereas vehicle (Fiat Tipo 2018) LED day time running light (DRL) light is driven by a pulse width modulation (PWM) circuit to enable dimming control while ensuring power efficiency. On the other hand, solar radiation is considered as the main noise source for outdoor background light during day conditions, where noise due to other artificial light sources (i.e. vehicle DRL LED lights) is not considered. To analyze V-VLC noise, N=1000000 measurement samples are recorded with 625 MSPS sample rate.
To train and test the CAE denoising scheme, on-off keying modulation (OOK) based V-VLC signals with 1 ms ON and 4 ms OFF period are recorded at 10 m distance from a single vehicle DRL LED light. For indoor parking garage scenario, 8 LEDs are turned on, whereas for outdoor scenarios, bright sun and shadow conditions without any artificial noise are considered to address different noise levels. For each record, N=4000000 samples with 1.67 MSPS sample rate, corresponding to 2.39 time length, are recorded. Considering ON and OFF periods of the V-VLC sequences, each record consists of approximately 500 pulses. The noise free pulses are recorded in an indoor parking garage with complete darkness. For each noise condition, 15 measurement runs are executed to form the training and test data sets of 5000 pulse samples per scenario.
IV Results and Analytics
IV-A Noise Characterization
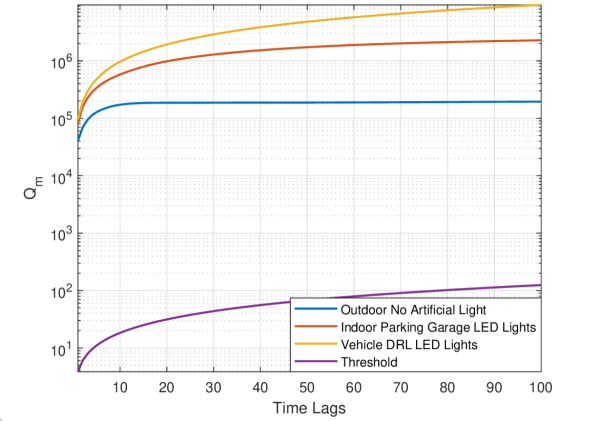
To investigate the time dependence of the V-VLC channel noise samples, Ljung-Box Q-test is performed on measurements samples from three different noise disturbed V-VLC channels.
Fig. 1 shows the Ljung-Box Q statistics values for with the threshold statistics to reject the null hypothesis at = 0.05 significance level. The obtained statistic values are far above the threshold, yielding lower -values below which indicates that the null hypothesis can be rejected. Therefore, the test results indicate that the V-VLC channel noise exhibits a time dependent statistical behaviour. Moreover, vehicle LED disturbed channel indicates the highest time correlation, whereas the outdoor V-VLC channel under solar radiation has the lowest time correlation. To further identify the noise characteristics of the measurement samples with the noise coefficients, AVAR method is employed.
Channel Noise Coefficient Random Walk (K) Flicker Noise (B) White Noise (N) Indoor Garage 8 LEDs 0.0117 Indoor Garage 1 LED 0.0022 Outdoor Solar Radiation N/A Vehicle DRL LED 0.1129 0.0167
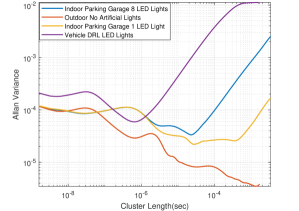
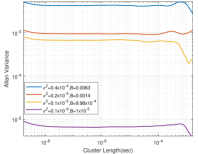
Fig. 2 (a) demonstrates the AVAR for the scenarios under consideration. The curves for outdoor and ambient light free dark indoor scenarios show flicker noise and white noise characteristics, whereas illuminated indoor parking garage and vehicle LED light disturbed V-VLC channels exhibit flicker noise and white noise along with the random walk noise. The noise coefficients for the considered scenarios are listed in Table I. The random walk coefficient is the highest for the PWM modulated vehicle LED disturbed channel among all scenarios whereas increased number of LEDs is shown to increase the random walk for indoor scenarios. Moreover, the white noise coefficient for indoor LED light disturbed channel is slightly higher when compared to non-illuminated indoor channel, where AC power driven LEDs are observed to increase the white noise at the receiver. On the other hand, flicker noise increases with the DC offset of the illumination, where the vehicle LED directed towards the receiver generates the highest DC offset together with the strongest flicker noise.
Scenario Noise Coefficient Random Walk (K) Flicker Noise (B) White Noise (N) Vehicle LED DRL 5 m 0.2195 0.0053 Vehicle LED DRL 15 m 0.0152
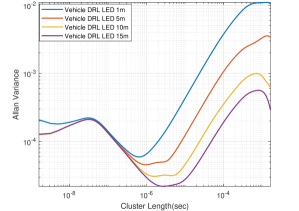
Fig. 2 (b) depicts the distance dependent noise characteristics of the vehicle LED disturbed V-VLC channel and Table II shows the noise coefficients at varying distances. Both the white noise and random walk coefficients decrease with the increasing distance. However, random walk noise decreases substantially when compared to white noise. Thus, the fundamental noise due to PWM modulated vehicle LED lights is random walk, where the main source of the white noise can be regarded as thermal noise, independent of incident light.
IV-B Noise Synthesis
The noise analysis results demonstrate the existence of colored noise along with the white noise for V-VLC channels. While the traditional white noise assumption can provide a basis for system simulations, incorporating colored noise components increases the evaluation accuracy, specifically for time varying V-VLC channels. Therefore, we are interested in simulating different noise components with varying noise coefficients. The proposed generalized Wiener process based method generates various noise samples with the selection of and parameters, to define the noise type and strength, respectively.
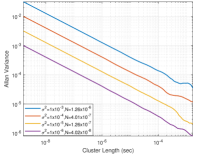
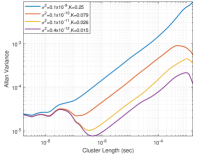
Fig. 3 shows the AVAR for synthesized white (), flicker () and random walk () noise with varying values. Fig. 3 (a) depicts AVAR for the white noise disturbed channel, Fig. 3 (b) denotes the dominant flicker noise, whereas Fig. 3 (c) presents the combination of white, flicker and random walk noise with the strong random walk noise component. Since white noise is demonstrated to decrease with the decreasing illumination, lower values of can be used to simulate low illumination scenarios yielding smaller coefficients. On the other hand, stronger flicker noise due to DC offset can be simulated with increasing values. Moreover, distance dependent vehicle LED disturbed channel noise can be simulated with the algorithm as depicted in Fig. 3(c) where the decreasing with increasing distance can be simulated by the decreasing values of . Therefore, the recursive noise synthesis algorithm can be used to generate artificial V-VLC noise datasets.
IV-C Denoising
The proposed CAE denoiser is trained with the database of noisy and clean signals. The database consists of 5.000 V-VLC OOK samples for indoor, outdoor bright sun and shadow V-VLC channels together with the clean signals. Three different databases, mixed data (MD), outdoor data (OD), and indoor data (ID), are formed to train and evaluate the performance of the proposed scheme. The MD data-set consists of indoor LED light contaminated and outdoor solar radiation disturbed samples, OD data-set includes pure outdoor solar radiation disturbed bright sun and shadow scenario samples, and ID dat-set includes pure LED light contaminated samples. The SNR levels of the noisy signals vary due to DC offset. Therefore, all signal amplitudes are normalized between 0 and 1. The training database is divided into two subsets for training and test with 70 and 30 ratios, respectively.
The denoising scheme is implemented in Python using library [13] with tensorflow [14] platform. The model is trained by using Adam optimizer [15] with binary-cross-entropy loss function [16] for 100 epochs using batch size 50 on an embedded computer, NVIDIA Jetson TX2.
In the proposed V-VLC CAE denoising scheme, the input noisy V-VLC signals are encoded into low dimensional features at the encoder with two convolutional layers, whereas the decoder reconstructs the output from the low dimensional features with two transposed convolutional layers. In the encoder, the input signals with size are taken as input, then a convolutional process with 128 filters of size and stride of 2 including maximum norm regularization is applied on the first layer. The next convolutional layer is made up of 32 filters with size and a stride of 2. The decoder part is the symmetric inverse of the encoder, whereas at the output layer, a deconvolutional layer with one filter employs padding to yield the same size with the input data.
The RMSE metric is used to evaluate the variance between the model output of denoised signals and the clean signals. The smaller RMSE value indicates the better denoising performance, and RMSE can be calculated by , where is the number of samples, is the clean signal vector and denotes the denoised signal vector.
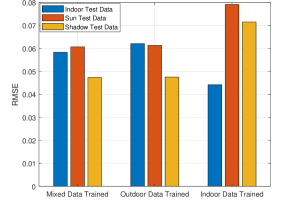

Fig. 4 (a) demonstrates the RMSE denosing performance of the proposed models for bright sun, shadow outdoor and indoor LED light contaminated channels. The proposed CAE denoising scheme, trained with MD data-set, achieves 0.0607, 0.0474, 0.0583 RMSE for bright sun, shadow outdoor and indoor channels. On the other hand, the model trained with ID data-set yields 0.0791, 0.0715 and 0.0442 RMSE for bright sun, shadow outdoor and indoor channels, respectively. Moreover, the OD data-set trained model performs similar to the mixed sample trained model, with 0.0613, 0.0475, 0.0621 RMSE for bright sun, shadow outdoor and indoor channels, respectively. Thus, model trained with artificial LED background lighting (ID data-set) yields 28.8% and 22.7% better denoising performance for LED light disturbed symbols when compared to OD trained and MD trained models, respectively. On the other hand, the best performing MD data-set trained model tested with the solar radiation disturbed symbols outperforms the RMSE of OD and ID trained models by 0.2% and 33.7%, respectively. Therefore, two-different offline trained CAEs can be used to denoise LED contaminated and outdoor solar radiation contaminated V-VLC symbols.
Fig. 4 (b) presents the outdoor solar radiation contaminated V-VLC signals for shadow scenario together with the clean and the best performing CAE model denoised counterparts. The mean normalized signal amplitudes of noisy, denoised and original signals are, 0.7597 V, 0.8408 V, 0.8483 V for ON symbols and 0.2368 V, 0.1514 V, 0.1429 V, for OFF symbols, respectively. Thus, the CAE denoising scheme considerably increases the detectability of the amplitude levels of noisy signals.
V Conclusion
In this paper, we propose noise analysis and synthesis for V-VLC together with a CAE based denoising scheme. The noise analysis reveals the time correlation properties of the V-VLC noise due to LED background lighting, where the time correlated colored noise is demonstrated to be composed of flicker noise and random walk noise. The random walk noise is the dominant noise component for indoor garage LED and vehicle LED disturbed V-VLC channels, where the flicker noise is observed to be stronger for the channels with higher DC component. Since V-VLC channels are exposed to different noise components, a flexible algorithm to synthesize noise is proposed. The algorithm generates artificial noise data sets in the form of white noise, flicker noise and random walk noise with different strengths. The presented algorithm can be used to simulate V-VLC system performance under different noise conditions. Moreover, we propose a CAE based denoising scheme, which reduces the noise due to LED lighting and solar radiation for indoor and outdoor environments, respectively. The proposed denoising scheme, trained with indoor LED disturbed and outdoor solar radiation disturbed V-VLC symbols is demonstrated to perform best for outdoor solar radiation disturbed V-VLC signals under shadow, where the main noise source is in the form of white noise. Therefore, CAE based denoising scheme can be used to increase V-VLC system performance by increasing the symbol detection probability.
VI Acknowledgement
This work was supported by CHIST-ERA grant CHIST-ERA-18-SDCDN-001, the Scientific and Technological Council of Turkey 119E350 and Ford Otosan.
References
- [1] R. Molina-Masegosa and J. Gozalvez, “Lte-v for sidelink 5g v2x vehicular communications: A new 5g technology for short-range vehicle-to-everything communications,” IEEE Vehicular Technology Magazine, vol. 12, no. 4, pp. 30–39, 2017.
- [2] F. Arena, G. Pau, and A. Severino, “A review on ieee 802.11 p for intelligent transportation systems,” Journal of Sensor and Actuator Networks, vol. 9, no. 2, p. 22, 2020.
- [3] Z. Ghassemlooy, W. Popoola, and S. Rajbhandari, Optical wireless communications: system and channel modelling with Matlab®. CRC press, 2019.
- [4] T. Komine and M. Nakagawa, “Fundamental analysis for visible-light communication system using led lights,” IEEE transactions on Consumer Electronics, vol. 50, no. 1, pp. 100–107, 2004.
- [5] L. Hua, Y. Zhuang, L. Qi, J. Yang, and L. Shi, “Noise analysis and modeling in visible light communication using allan variance,” IEEE Access, vol. 6, pp. 74320–74327, 2018.
- [6] M. S. Islim and H. Haas, “An investigation of the solar irradiance effect on visible light communications,” in 2017 IEEE 28th Annual International Symposium on Personal, Indoor, and Mobile Radio Communications (PIMRC), pp. 1–6, IEEE, 2017.
- [7] H. Farahneh, F. Hussain, and X. Fernando, “Performance analysis of adaptive ofdm modulation scheme in vlc vehicular communication network in realistic noise environment,” EURASIP Journal on Wireless Communications and Networking, vol. 2018, no. 1, pp. 1–15, 2018.
- [8] N. J. Kasdin, “Discrete simulation of colored noise and stochastic processes and 1/f/sup/spl alpha//power law noise generation,” Proceedings of the IEEE, vol. 83, no. 5, pp. 802–827, 1995.
- [9] G. M. Ljung and G. E. Box, “On a measure of lack of fit in time series models,” Biometrika, vol. 65, no. 2, pp. 297–303, 1978.
- [10] I. S. 647-2006, “Ieee standard specification format guide and test procedure for single-axis laser gyros,” The Institute of Electrical and Electronics Engineers New York, 2006.
- [11] I. Goodfellow, Y. Bengio, A. Courville, and Y. Bengio, Deep learning, vol. 1. MIT press Cambridge, 2016.
- [12] P. Vincent, H. Larochelle, I. Lajoie, Y. Bengio, P.-A. Manzagol, and L. Bottou, “Stacked denoising autoencoders: Learning useful representations in a deep network with a local denoising criterion.,” Journal of machine learning research, vol. 11, no. 12, 2010.
- [13] F. Chollet et al., “Keras: Deep learning library for theano and tensorflow,” URL: https://keras. io/, vol. 7, no. 8, p. T1, 2015.
- [14] M. Abadi, A. Agarwal, P. Barham, E. Brevdo, Z. Chen, C. Citro, G. S. Corrado, A. Davis, J. Dean, M. Devin, et al., “Tensorflow: Large-scale machine learning on heterogeneous distributed systems,” arXiv preprint arXiv:1603.04467, 2016.
- [15] D. P. Kingma and J. Ba, “Adam: A method for stochastic optimization,” arXiv preprint arXiv:1412.6980, 2014.
- [16] J. Shore and R. Johnson, “Axiomatic derivation of the principle of maximum entropy and the principle of minimum cross-entropy,” IEEE Transactions on information theory, vol. 26, no. 1, pp. 26–37, 1980.