Tweet Analysis for Enhancement of COVID-19 Epidemic Simulation: A Case Study in Japan
Abstract
1
The COVID-19 pandemic, which began in December 2019, progressed in a complicated manner and thus caused problems worldwide. Seeking clues to the reasons for the complicated progression is necessary but challenging in the fight against the pandemic. We sought clues by investigating the relationship between reactions on social media and the COVID-19 epidemic in Japan. Twitter was selected as the social media platform for study because it has a large user base in Japan and because it quickly propagates short topic-focused messages (“tweets”). Analysis using Japanese Twitter data suggests that reactions on social media and the progression of the COVID-19 pandemic may have a close relationship. Experiments to evaluate the potential of using tweets to support the prediction of how an epidemic will progress demonstrated the value of using epidemic-related social media data. Our findings provide insights into the relationship between user reactions on social media, particularly Twitter, and epidemic progression, which can be used to fight pandemics.
2 Keywords:
COVID-19, SEIR model, Simulation, SNS, Twitter, Emotion, Emoji
3 Introduction
We investigated the potential of using data from social media to enhance the prediction and simulation of an epidemic’s* progression. A case study was carried out using Twitter data related to the COVID-19 epidemic in Japan. The COVID-19 pandemic has been causing global problems that have affected everyone for a lengthy period, and the end is not in sight. During the pandemic, people are seeking information or clues for use in deciding their next actions through a variety of channels: newspapers, TV, and especially social media.
Studies have shown that social media greatly affects society. Twitter is one of the largest social media platforms worldwide that greatly affects several aspects of society (daily life conversations, news reports, event advertisements, etc.) in various domains (health, entertainment, economics, research, politics, etc.). During the COVID-19 pandemic, a large volume of information on Twitter regarding the infection situation, symptoms, treatment, vaccinations, restrictions, and so on is being continuously shared and discussed. Users can share their emotions and opinions regarding the information instantaneously without geographical limitations. The effects of these emotions and opinions can thus spread rapidly.
Research on predicting the progression of the COVID-19 pandemic has received much attention worldwide. Early prediction is important for implementing countermeasures against its spread. Epidemiological models, e.g., the susceptible-exposed-infected-recovered (SEIR) model, are commonly used for such prediction. The parameters are obtained from observed data or set on the basis of predefined scenarios. Complex problems, e.g., the emergence of new variants, diverging government policies, and diverging public perceptions, have arisen as the pandemic has lasted longer and longer. Many countries, including Japan, have already experienced more than four waves of the pandemic. To tackle the complicated progression of the COVID-19 pandemic and to deal with the challenge of obtaining parameters reflecting reality as conditions continue to change, recent research has focused on utilizing extra information to enhance the prediction model.
One way to obtain such information is to monitor social media: Twitter, Facebook, Reddit, etc. Social networking services, which were initially simply playgrounds for small communities of computer users, have evolved into large social media platforms connecting both online and offline social networks. Twitter, one of the largest social media platforms, has been targeted in numerous studies aimed at identifying the personality traits of social media users (Wald et al., 2012; Sumner et al., 2012). Monitoring social media is an attractive approach to gathering data for use in various types of research (Azzaoui et al., 2021; Yoneoka et al., 2020; Alessa et al., 2019; Yoo and Choi, 2020). Several epidemic-related behaviors can be observed on social media, for instance, health information seeking. A heavy reliance on social media has been observed during the COVID-19 pandemic (Neely et al., 2021; Dadaczynski et al., 2021; Skarpa and Garoufallou, 2021). Several studies of the formation of pandemic waves have revealed an association between non-pharmaceutical interventions and social behaviors (Cacciapaglia et al., 2021; Kupferschmidt, 2020; Ravi et al., 2021). Previous work on using Twitter data to support predicting of COVID-19 epidemic progression have used tweet counts (with relevant keywords) (Yousefinaghani et al., 2021) and tweet full-text analysis (Azzaoui et al., 2021).
In research regarding social media affecting social behavior, emotion is a critical aspect (Settanni and Marengo, 2015; Park et al., 2012; Wald et al., 2012). Van Bavel et al. observed that, especially in the current COVID-19 pandemic, ”Social networks can amplify the spread of behaviors that are both harmful and beneficial during an epidemic, and these effects may spread through the network to friends, friends’ friends and even friends’ friends’ friends” (Van Bavel et al., 2020). The social network created by a popular social media platform such as Twitter is huge with instant connectivity without geographical limitations. This means that popular social media platforms can amplify the spread of behaviors to a magnitude much much greater than offline social networks (e.g., neighborhoods). Several studies have revealed the emotions of social media users towards COVID-19 progression (Wheaton et al., 2021; Arora et al., 2021; Toriumi et al., 2020; Dyer and Kolic, 2020; Mathur et al., 2020; Kaur et al., 2020).
We have investigated the utilization of emoji usage on Twitter to capture changes in the emotions of social media users for use in enhancing epidemiological models. Several studies have focused on capturing emotion from texts including posts on Twitter (“tweets”). However, accurately understanding emotional tweets by using full-text analysis is a challenging task. Emoji analysis is an attractive approach because social media users tend to express emotions using non-verbal communication, and they share a common understanding of many emoji.
Several studies have shown that emojis are used on social media as non-verbal communication cues to assist communication (Suntwal et al., 2021; Elder, 2018; Cheng, 2017; Lo, 2008). Emoji are digital images depicting simple illustrations including facial expressions (smiley face, crying face, fearful face, scary face, etc.), as illustrated in Figure 1. Emotional messages can be directly expressed through emoji. Because social media users share a common understanding of many emoji, emotions can be effectively and conveniently communicated through emoji.
One crucial point when using social media data, particularly Twitter data, is that social media users may become less engaged, i.e., performing fewer actions such as “liking,” “commenting,” and “sharing,” as the pandemic lasts longer and longer(Yousefinaghani et al., 2021). When engagement drops to a certain level, social media data becomes less representative of behavioral changes. The results of a study using Twitter data from the U.S. and Canada by Yousefinaghani et al. (2021) suggest that there will be less engagement through social media due to a feeling of exhaustion as waves of the pandemic continue. In this study, we also took into consideration the results of previous studies using Japanese Twitter data.
4 Materials and Methods
4.1 Data Collection
The data consisted of tweet counts and COVID-19 infection data from Japan.
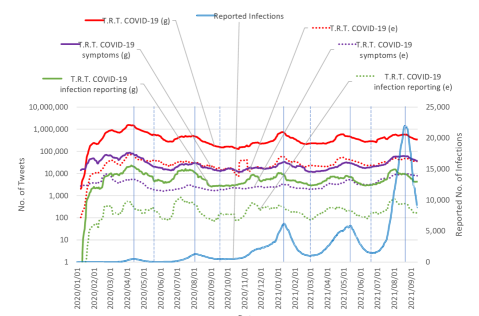
The tweet count data were collected using the Twitter API (version 2) with academic research access. Several settings were considered, from the general COVID-19 related tweet count to more fine-grained target subsets of keywords. Three sets of keywords were used: COVID-19 related set, COVID-19 symptom related set111The symptom-related keywords were obtained from https://www.kansensho.or.jp/ref/d77.html and Yousefinaghani et al. (2021), and COVID-19 infection reporting related set. For each set, the collections were further filtered to retain only tweets containing emojis. The COVID-19 related set was the primary set used. The other sets were used for an ablation study and analysis of the characteristics of the tweets. The details of the settings are shown in Table 1. The collected data show that the number of COVID-19 related tweets has been correlated to some degree with the COVID-19 epidemic progression since the beginning of the epidemic (Figure 2).
| Tweets Related To | Only Tweets with Emojis | Query Keywords | Daily No. of Tweets |
|---|---|---|---|
| COVID-19 (g) | No | 新型コロナ , コロナ感染 , コロナ禍 , コロナワクチン , 緊急事態宣言 , まん延防止 , 感染者 (translation: [new-variant corona, corona infection, corona disaster, corona vaccine, emergency declaration, spread prevention, infected person/people]) | 414,576 |
| \hdashlineCOVID-19 (e) | Yes | same as above | 29,484 |
| COVID-19 symptoms (g) | No | 発熱 , 鼻汁 , 咽頭痛 , 咳嗽 , 嗅覚異常 , 味覚異常 , 息切れ , 咳 , のどの痛み , 喉の痛み , 嗅覚障害 , 味覚障害, excluding {風邪 , インフルエンザ , 糖尿病 , マラリア , サタデーナイトフィーバ , 喫煙 , たばこ , アレルギー , アレルギ } (translation: [fever, nasal discharge, sore throat, cough, dysosmia, dysgeusia, shortness of breath, cough, sore throat, sore throat, dysosmia, dysgeusia], excluding: {cold, influenza, diabetes, malaria, Saturday night fever (a movie-related reference to the risk of going out dancing), smoking, tobacco, allergies, allergies }) | 28,814 |
| \hdashlineCOVID-19 symptoms (e) | Yes | same as above | 3,597 |
| COVID-19 infection reporting (g) | No | 感染者数 , 陽性者数 (translation: [number of infected people, number of confirmed positive cases]) | 6,518 |
| \hdashlineCOVID-19 infection reporting (e) | Yes | same as above | 232 |
The COVID-19 infection reporting data for Japan were obtained from JX Press222https://jxpress.net/. The dataset contains daily infection reports for all prefectures in Japan. It was used for training or calibrating two core models used by the epidemic simulation system described in Subsections 4.2 and 4.3.
4.2 SNS Reaction Trend & COVID-19 Epidemic Progression Change Prediction
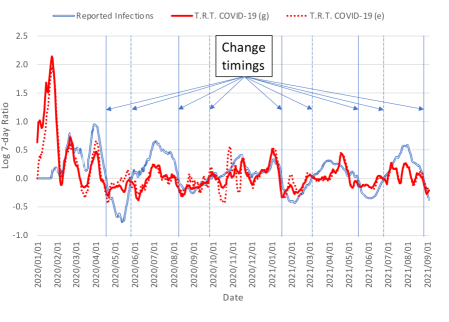
As shown in Figures 2 and 3, the trend in reported infections or cases was similar to the trend in the reaction level on social media. This suggests a non-negligible correlation between the two signals. Predicting the trend of changes in the epidemic progression helps to set up appropriate scenarios for simulating the future epidemic state, which in turn supports policy makers. In this sense, given the suggestion of a potential relationship between the trends of the two signals, additional information from social media reactions may further support predicting changes in the epidemic progression.
Here, the trend representations were estimated using the ratio of the signals for days and , which were the same day of the week:
| (1) |
where represents the two signals, the reactions on Twitter measured by tweet count and the epidemic state estimated from the reported number of new infections on day , and represents the trend measured as the 7-day change. This transformation absorbs the weekly effect observed in the Japanese data. The transformation was further smoothed by a 15-day moving average.
To model the relationship between the trend in social media reactions and the trend in epidemic progression, we utilized a long short-term memory (LSTM) neural network (Hochreiter and Schmidhuber, 1997), a well-known and successful neural network architecture in time-series modeling, and the multivariate time-series of the two trends. LSTM neural networks have been used in various domains for modeling time-series and have achieved practical results. In previous studies of COVID-19 epidemic prediction systems, LSTM models were used as the core models (Chimmula and Zhang, 2020; Shahid et al., 2020; Kırbaş et al., 2020).
To cope with the unknown complexity of the relationship between the two time-series, we use an ensemble system of multi-layer LSTM models with various hyperparameter (number of layers, number of neurons) settings and parameter initialization of the LSTM models 333.
The LSTM system is optimized by minimizing the mean squared error:
| (2) |
where marks the end of the observable or training data, is the number of time-series (including the trend of reactions on Twitter and the trend of the epidemic progression), and are the observed data and the corresponding predictions.
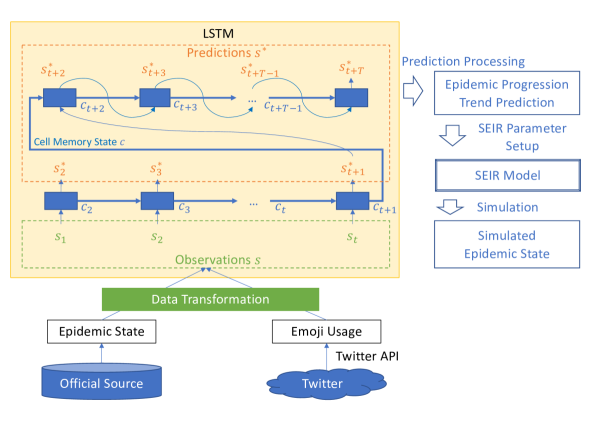
The inference procedure has two phases. In the first phase, the LSTM ensemble system receives observed data up to time and uses them to create memory state and prediction (Equation 3). In the second phase, from input time-step , the prediction of the previous time-step is used as the input to predict the next time-step (Equation 4). The inference procedure is illustrated in the “LSTM” box at the top-left of Figure 4. In the training or optimization process, only the first phase is invoked, and predictions are used for the aforementioned optimization.
| (3) | ||||
| (4) |
where is the input time-step, marks the end of the observable data, is the length of the prediction period, is the memory state of the LSTM, and are the observed data and corresponding predictions.
The outputs of the change prediction model are used for setting up the COVID-19 simulation system described in the next subsection. The outputs of the change prediction model are processed to identify the timings when the predicted values change sign (illustrated in Figure 3):
-
•
From positive to negative: the signal progression changes from increasing (up-trend) to decreasing (down-trend).
-
•
From negative to positive: the signal progression changes from decreasing (down-trend) to increasing (up-trend).
4.3 COVID-19 Epidemic Simulation System
The COVID-19 epidemic simulation system consists of two stages: 1) change prediction, 2) simulation. The change prediction is executed as described in Subsection 4.3. The simulation is executed using SEIR, a common epidemic model. The overall flow of the system illustrated in Figure 4 is as follows.
-
1.
Data collection: collect tweet count and COVID-19 epidemic state;
-
2.
Data transformation: estimate trend representations for tweet count and COVID-19 epidemic progression;
-
3.
Change prediction: predict trends and identify change timings;
-
4.
SEIR model parameter setup: set SEIR model parameters in accordance with the identified change timings;
-
5.
Simulation: perform epidemic simulation.
We used the simulation system proposed by Lemaitre et al. (2021) with a stochastic SEIR model to model the disease dynamics. The system supports multi-location epidemic modeling to estimate the force of infection (rate at which susceptible individuals are infected) by using inter-location mobility. The formulation of the SEIR model is described in the Appendix Appendix. We performed prefecture-wide multi-location setup. The SEIR model uses the following parameters: the latent period , which is the time interval between when an individual becomes infected and when he or she becomes infectious, the infectious period , which is the time interval during which an individual is infectious, and the effective reproduction number (t) for each location at time , which is the number of cases generated in the current state of a population.
While the latent period and infectious period depend on the COVID-19 variant, the effective reproduction number depends not only on the variant but also on the contact rate in the community, which changes as the behaviors of the community members change. During one wave of the COVID-19 epidemic, the change in was greatly affected by behavioral changes due to perceived events, e.g., surging of cases and policy changes (emergency declarations), resulting in up trends and down trends in the epidemic progression. Hence, determining is the key to effective simulation.
A set was obtained using the calibration method used by Lemaitre et al. (2021) for the period from 2020/12/24 to 2020/01/21 (the 3rd wave in Japan) using the observed epidemic data. Two subsets of were established: up-trend set (2020/12/24 – 2020/01/06) and down-trend set (2021/01/07 – 2021/01/21).
In the simulation period from 2021/04/23 to 2021/06/30, for each trend (up or down) time span , a set of for each location was drawn from a uniform distribution:
| (5) |
where are, respectively, the minimum and maximum values of a set of previously obtained reproduction numbers, which can be either or depending on whether time span is trending up or down. If is an up-trend time span, is selected, and if is a down-trend time span, is selected. The change timings, and , are determined in the change prediction stage, as described in Subsection 4.2.
For evaluation, we measure the errors in the change prediction and simulation stages against the observed data for the period from 2021/04/23 (in the up-trend of the 4th wave) to 2021/06/30 (ending of the 4th wave). We used data from 2020/12/24 to 2020/01/21 (in the 3rd wave) to obtain the SEIR model parameters and data from 2020/11/15 to 2021/04/22 (the end timing of observable data) for training the change prediction model. Two observed timings of trend changes were used for evaluation: and , where marks the change from up-trend to down-trend, and marks the change from down-trend to up-trend in the epidemic progression as observed in the infection reports.
The evaluation metric for change prediction was the difference in days between the predicted date and the actual date of the trend change (Equation 6).
| (6) |
The evaluation metric for simulation was the root-mean-square error (RMSE).
5 Results
Table 2 shows the results for change prediction and simulation. Two baselines were used for reference.
-
•
Baseline 1: was set for the entire simulation period using in the up-trend and down-trend periods of the 3rd wave. were sampled for both the up-trend and down-trend periods without knowing the exact timing of the trend change.
-
•
Baseline 2: was set for the entire simulation period using in the up-trend period of the 3rd wave. were sampled for only the up-trend period.
For our approach, we used three system settings:
-
•
+change prediction w/o using tweet data: the epidemic simulation system was setup withchange prediction using only the epidemic state data, not the tweet data.
-
•
+change prediction using T.R.T. COVID-19 (g): the epidemic simulation system was setup with change prediction using both the epidemic state data and the COVID-19 related tweet count data.
-
•
+change prediction using T.R.T. COVID-19 (e): similar to setting for (g) except that tweets were filtered to remove ones not containing emoji.
The additional use of the COVID-19 related tweet count (g) resulted in better prediction of the epidemic progression trend changes than without using the count: prediction was improved by 8.5 days for and 6.3 days for . This led to a reduction of in the RMSE. Given that the daily tweet count of COVID-19 related tweets filtered for emoji (e) was smaller than the more general count (g), the results are similar: the difference in change prediction was 0.2 days for and 2.4 days for , and the RMSE was worse. In all results, the predicted trend changes preceded the observed changes. The baseline results show that without estimating the trending change, the RMSE were times worse.
| Epidemic Simulation System | Change Prediction ( / ) | Simulation (RMSE) | Daily No. of Tweets |
|---|---|---|---|
| Baseline 1 | n/a | 18,093.9 | n/a |
| Baseline 2 | n/a | 25,216.0 | n/a |
| +change prediction w/o using tweet data | -16.3 / -28.0 | 2,377.9 | n/a |
| +change prediction using T.R.T. COVID-19 (g) | -7.8 / -21.7 | 1,360.4 | 414,576 |
| +change prediction using T.R.T. COVID-19 (e) | -8.0 / -19.3 | 1,435.1 | 29,484 |
6 Discussion
The relationship between user reactions on social media and the COVID-19 epidemic progression remains close for the long term. Social media engagements related to COVID-19 have remained fairly steady over the five waves of COVID-19 epidemic surges in Japan. They reached their highest level in the first wave, dropped a bit in the second wave, and then picked up in the following waves. The engagements peaked at around the peak of each wave. This demonstrates the value of using epidemic-related social media data, particularly Twitter data.
The 3rd and 4th waves in the period from 2020/11/15 to 2021/06/25 exhibited similar characteristics: the wave shapes were similar (Figure 2) and the vaccination rates were similar444https://www.kantei.go.jp/jp/headline/kansensho/vaccine.html. Despite the similar wave shapes, the reactions to non-pharmaceutical interventions and emergency declarations differed between the two waves. In the 3rd wave, an emergency declaration was issued on 2021/01/07, and a change in the epidemic progression trend (from increasing to decreasing) was observed on 2021/01/17 (ten days later). In contrast, in the 4th wave, an emergency declaration was issued on 2021/04/25, and a change in the epidemic progression trend was observed on 2021/05/15 (20 days later). The 10-day later response in the 4th wave is attributed to reluctance to comply or exhaustion after already being subjected to two previous emergency declarations. The reluctance or exhaustion level is somewhat correlated with the reaction on social media, which was partially captured by the change prediction model and resulted in more accurate prediction of the change in the epidemic progression trend.
Future Work
For further improvement in the simulation results, the method for setting the SEIR model parameters needs to be further improved, especially for the setting of . In this study, the distribution from which the set of for each location was drawn was assumed to be uniform, and the up- and down-trend parameter sets were manually established. The setting of the SEIR model parameters would be more challenging in periods in which the epidemic conditions greatly differed, e.g., the 5th wave in Japan in which the delta variant was dominant. Viable options include selecting values from the most recent wave with adjustment for the infectious power of newer variants and selecting from the period with the most similar social media reactions although measuring similarity would be a challenging task. Furthermore, it is necessary to consider the emergence of new COVID-19 variants and how they would affect the parameters as well as the social media reactions. These challenges will be addressed in future work.
As preparation for future work, we performed experiments on training the change prediction model using different fine-grained tweet counts:
-
•
T.R.T. COVID-19 symptoms(g)
-
•
T.R.T. COVID-19 symptoms(e)
-
•
T.R.T. COVID-19 infection reporting (g)
-
•
T.R.T. COVID-19 infection reporting (e).
The tweet counts are listed in Table 1, and the results of the additional experiments are shown in Table 3.
| Tweet Count for Change Prediction | Change Prediction ( / ) | Simulation (RMSE) | Daily No. of Tweets |
|---|---|---|---|
| T.R.T. COVID-19 (g) | -7.8 / -21.7 | 1,360.4 | 414,576 |
| T.R.T. COVID-19 (e) | -8.0 / -19.3 | 1,435.1 | 29,484 |
| T.R.T. COVID-19 symptoms (g) | -17.4 / -27.7 | 2,478.9 | 28,814 |
| T.R.T. COVID-19 symptoms (e) | -16.2 / -29.4 | 2,389.6 | 3,597 |
| T.R.T. COVID-19 infection reporting (g) | -13.4 / -26.4 | 2,051.2 | 6,518 |
| T.R.T. COVID-19 infection reporting (e) | -12.4 / -23.4 | 1,932.7 | 232 |
Compared with using the general-topic COVID-19 related tweet counts, using more specific-topic tweet counts did not show improvement: the RMSE was worse for the simulation period. This suggests that the relationship between reactions on social media and epidemic progression is complex. The general count, covering a broad range of topics, exhibited greater predictive power than the more specific counts. Manual topic design thus may not be an efficient approach. The development of automatic topic discovery techniques for finding relevant topics discussed on social media that can support epidemic progression prediction could be promising.
The results for tweet counts with emoji filtering (e) compared with the general tweet counts (g) showed that the emoji settings have similar representative value as the general settings: the RMSE difference was only even with fewer tweets. One advantage of using emoji settings is the ability to perform fine-grained analysis on specific emotions (fear, anger, etc.) represented by various emojis. Further studies on the specific emotions used by social media users for typical topics could help in discovering topics where changes in emotion could affect epidemic progression. This could be done by analyzing social media contents (emoji vs. topics) to identify emotions trending on topics relevant to epidemic progression This is left for future work.
Appendix
In this study, we used the simulation system proposed by Lemaitre et al. (2021) with a stochastic SEIR model used to model the disease dynamics. This system supports multi-location epidemic modeling to estimate the force of infection using inter-location mobility. For Japan, we performed prefecture-wide multi-location setup. Given the parameters, including the reproduction numbers (t), latent period , and infectious period , the transitions between the compartments Susceptible, Exposed, Infected, and Recovered for each location are
| (7) | ||||
| (8) | ||||
| (9) | ||||
| (10) | ||||
| (11) | ||||
| (12) | ||||
| (13) | ||||
| (14) | ||||
| (15) | ||||
| (16) |
where represent the daily mobility from location to location , is the population of location , is the proportion of time that moving individuals spend away, and is the mixing coefficient.
Conflict of Interest Statement
The authors declare that the research was conducted in the absence of any commercial or financial relationships that could be construed as a potential conflict of interest.
Author Contributions
VT and TM contributed to the conception and design of the study and to the data collection. VT implemented the system, performed data curation, conducted the experiments, and wrote the first draft of the manuscript. TM validated the progress and results of the study via daily discussion with VT. Both authors contributed to manuscript revision and read and approved the submitted version.
Funding
This work was supported with funding from the COVID-19 Program and the Future Investment Program of the Research Organization of Information and Systems, Japan.
Acknowledgments
We are grateful to the members of the COVID-19 Project at our institute for their valuable discussions in frequent meetings.
Data Availability Statement
The data analyzed in this study were obtained from Twitter (tweet counts), JX Press (COVID-19 epidemic state), and ZENRIN DataCom (mobility data) and used in accordance with the licenses and restrictions of Twitter’s “Developer Agreement and Policy,” JX Press’ “License for Research Purposes,” and ZENRIN DataCom’s “License for Research Purposes.” Requests to access these datasets should be directed respectively to https://twitter.com/, https://jxpress.net/, and https://www.zenrin-datacom.net/.
References
- Alessa et al. (2019) Alessa, A., Faezipour, M., et al. (2019). Preliminary flu outbreak prediction using twitter posts classification and linear regression with historical centers for disease control and prevention reports: Prediction framework study. JMIR public health and surveillance 5, e12383
- Arora et al. (2021) Arora, A., Chakraborty, P., Bhatia, M., and Mittal, P. (2021). Role of emotion in excessive use of twitter during covid-19 imposed lockdown in india. Journal of Technology in Behavioral Science 6, 370–377
- Azzaoui et al. (2021) Azzaoui, A. E., Singh, S. K., and Park, J. H. (2021). Sns big data analysis framework for covid-19 outbreak prediction in smart healthy city. Sustainable Cities and Society 71, 102993
- Cacciapaglia et al. (2021) Cacciapaglia, G., Cot, C., and Sannino, F. (2021). Multiwave pandemic dynamics explained: How to tame the next wave of infectious diseases. Scientific reports 11, 1–8
- Cheng (2017) Cheng, L. (2017). Do i mean what i say and say what i mean? a cross cultural approach to the use of emoticons & emojis in cmc messages. Fonseca , 199
- Chimmula and Zhang (2020) Chimmula, V. K. R. and Zhang, L. (2020). Time series forecasting of covid-19 transmission in canada using lstm networks. Chaos, Solitons & Fractals 135, 109864
- Dadaczynski et al. (2021) Dadaczynski, K., Okan, O., Messer, M., Leung, A. Y., Rosário, R., Darlington, E., et al. (2021). Digital health literacy and web-based information-seeking behaviors of university students in germany during the covid-19 pandemic: cross-sectional survey study. Journal of medical Internet research 23, e24097
- Dyer and Kolic (2020) Dyer, J. and Kolic, B. (2020). Public risk perception and emotion on twitter during the covid-19 pandemic. Applied Network Science 5, 1–32
- Elder (2018) Elder, A. M. (2018). What words can’t say: Emoji and other non-verbal elements of technologically-mediated communication. Journal of Information, Communication and Ethics in Society
- Hochreiter and Schmidhuber (1997) Hochreiter, S. and Schmidhuber, J. (1997). Long short-term memory. Neural computation 9, 1735–1780
- Kaur et al. (2020) Kaur, S., Kaul, P., and Zadeh, P. M. (2020). Monitoring the dynamics of emotions during covid-19 using twitter data. Procedia Computer Science 177, 423–430
- Kırbaş et al. (2020) Kırbaş, İ., Sözen, A., Tuncer, A. D., and Kazancıoğlu, F. Ş. (2020). Comparative analysis and forecasting of covid-19 cases in various european countries with arima, narnn and lstm approaches. Chaos, Solitons & Fractals 138, 110015
- Kupferschmidt (2020) Kupferschmidt, K. (2020). Can europe tame the pandemic’s next wave?
- Lemaitre et al. (2021) Lemaitre, J. C., Grantz, K. H., Kaminsky, J., Meredith, H. R., Truelove, S. A., Lauer, S. A., et al. (2021). A scenario modeling pipeline for covid-19 emergency planning. Scientific reports 11, 1–13
- Lo (2008) Lo, S.-K. (2008). The nonverbal communication functions of emoticons in computer-mediated communication. Cyberpsychology & behavior 11, 595–597
- Mathur et al. (2020) Mathur, A., Kubde, P., and Vaidya, S. (2020). Emotional analysis using twitter data during pandemic situation: Covid-19. In 2020 5th International Conference on Communication and Electronics Systems (ICCES) (IEEE), 845–848
- Neely et al. (2021) Neely, S., Eldredge, C., Sanders, R., et al. (2021). Health information seeking behaviors on social media during the covid-19 pandemic among american social networking site users: Survey study. Journal of Medical Internet Research 23, e29802
- Park et al. (2012) Park, M., Cha, C., and Cha, M. (2012). Depressive moods of users portrayed in twitter. 1–8
- Ravi et al. (2021) Ravi, V. et al. (2021). How can india be prepared for the third wave? Neurology India 69, 545
- Settanni and Marengo (2015) Settanni, M. and Marengo, D. (2015). Sharing feelings online: studying emotional well-being via automated text analysis of facebook posts. Frontiers in psychology 6, 1045
- Shahid et al. (2020) Shahid, F., Zameer, A., and Muneeb, M. (2020). Predictions for covid-19 with deep learning models of lstm, gru and bi-lstm. Chaos, Solitons & Fractals 140, 110212
- Skarpa and Garoufallou (2021) Skarpa, P. E. and Garoufallou, E. (2021). Information seeking behavior and covid-19 pandemic: A snapshot of young, middle aged and senior individuals in greece. International Journal of Medical Informatics 150, 104465
- Sumner et al. (2012) Sumner, C., Byers, A., Boochever, R., and Park, G. J. (2012). Predicting dark triad personality traits from twitter usage and a linguistic analysis of tweets. In 2012 11th international conference on machine learning and applications (IEEE), vol. 2, 386–393
- Suntwal et al. (2021) Suntwal, S., Brown, S., and Brandimarte, L. (2021). Pictographs, ideograms, and emojis (pie): A framework for empirical research using non-verbal cues. In Proceedings of the 54th Hawaii International Conference on System Sciences. 6400
- Toriumi et al. (2020) Toriumi, F., Sakaki, T., and Yoshida, M. (2020). Social emotions under the spread of covid-19 using social media. Transactions of the Japanese Society for Artificial Intelligence , F–K45_1
- Van Bavel et al. (2020) Van Bavel, J. J., Baicker, K., Boggio, P. S., Capraro, V., Cichocka, A., Cikara, M., et al. (2020). Using social and behavioural science to support covid-19 pandemic response. Nature human behaviour 4, 460–471
- Wald et al. (2012) Wald, R., Khoshgoftaar, T. M., Napolitano, A., and Sumner, C. (2012). Using twitter content to predict psychopathy. In 2012 11th International Conference on Machine Learning and Applications (IEEE), vol. 2, 394–401
- Wheaton et al. (2021) Wheaton, M. G., Prikhidko, A., and Messner, G. R. (2021). Is fear of covid-19 contagious? the effects of emotion contagion and social media use on anxiety in response to the coronavirus pandemic. Frontiers in psychology 11, 3594
- Yoneoka et al. (2020) Yoneoka, D., Kawashima, T., Tanoue, Y., Nomura, S., Ejima, K., Shi, S., et al. (2020). Early sns-based monitoring system for the covid-19 outbreak in japan: a population-level observational study. Journal of epidemiology , JE20200150
- Yoo and Choi (2020) Yoo, W. and Choi, D.-H. (2020). Predictors of expressing and receiving information on social networking sites during mers-cov outbreak in south korea. Journal of Risk Research 23, 912–927
- Yousefinaghani et al. (2021) Yousefinaghani, S., Dara, R., Mubareka, S., and Sharif, S. (2021). Prediction of covid-19 waves using social media and google search: A case study of the us and canada. Frontiers in public health 9, 359