11email: oliver@oliver-mueller.ch 22institutetext: Université de Strasbourg, CNRS, Observatoire astronomique de Strasbourg, UMR 7550, F-67000 Strasbourg, France 33institutetext: INAF, Arcetri Astrophysical Observatory, Largo Enrico Fermi 5, I-50125, Florence, Italy 44institutetext: Leibniz-Institut fur Astrophysik Potsdam (AIP), An der Sternwarte 16, D-14482 Potsdam, Germany 55institutetext: European Space Agency (ESA), European Space Research and Technology Centre (ESTEC), Keplerlaan 1, 2201 AZ Noordwijk, The Netherlands 66institutetext: European Southern Observatory, Karl-Schwarzschild Strasse 2, 85748, Garching, Germany 77institutetext: Research School of Astronomy and Astrophysics, Australian National University, Canberra, ACT 2611, Australia
The Cen A galaxy group: dynamical mass and missing baryons††thanks: Based on observations collected at the European Organisation for Astronomical Research in the Southern Hemisphere under the ESO program 0101.A-0193.
The nearby elliptical galaxy Cen A is surrounded by a flattened system of dwarf satellite galaxies with coherent motions. Using a novel Bayesian approach, we measure the mean rotation velocity and velocity dispersion of the satellite system. We find indicating that the satellite system has non-negligible rotational support. Using Jeans’ equations, we measure a circular velocity of 258 km s-1 and a dynamical mass of M⊙ within 800 kpc. In a CDM cosmological context, we find that the Cen A group has a baryon fraction and is missing 77 of the cosmologically available baryons. Consequently, Cen A should have a hot intergalactic medium with a mass of 81011 M⊙, which is more than 20 times larger than current X-ray estimates. Intriguingly, The whole Cen A group lies on the baryonic Tully-Fisher relation defined by individual rotationally supported galaxies, as expected in Milgromian dynamics (MOND) with no need of missing baryons.
Key Words.:
Cosmology: dark matter – Cosmology: observations – Galaxies: dwarf – Galaxies: elliptical and lenticular, cD – Galaxies: halos – Galaxies: kinematics and dynamics1 Introduction
Galaxy groups are a key testbed for the Cold Dark Matter (CDM) cosmological model (Kroupa et al., 2010; Bullock & Boylan-Kolchin, 2017; Oppenheimer et al., 2021) as well as for alternative theories (Banik & Zhao, 2018; Milgrom, 2019). In the Local Volume ( Mpc), about half of all major galaxies reside in virialized groups, while the remaining half constitutes the so-called “field” population (Karachentsev, 2005). More massive galaxy clusters, which are absent in the Local Volume, are estimated to contain a minor fraction of the galaxy population, about 1015 (Karachentsev, 2005). Unfortunately, estimating the dynamical mass () of galaxy groups is more challenging than for galaxy clusters. Only a sub-sample of galaxy groups have a high-density hot medium that can be studied with existing X-ray telescopes to estimate from hydrostatic equilibrium (e.g. see Kourkchi & Tully 2017 and references therein). Moreover, galaxy groups are too diffuse to produce detectable gravitational lensing signal from background galaxies. The only remaining approach is using the line-of-sight velocities of galaxy members, as it has been pioneered by Zwicky (1933) almost a century ago.
Dynamical mass estimates for galaxy groups usually rely on the Virial theorem and/or on the “zero-velocity surface” method (Lynden-Bell, 1981; Sandage, 1986; Karachentsev, 2005; Karachentsev et al., 2009; Tully, 2015; Kashibadze & Karachentsev, 2018). Both methods assume that the member galaxies are isotropically distributed (spherical symmetry) and follow random orbits. These assumptions appear unreasonable for our own Local Group: most dwarf satellites of the Milky Way and M31 are distributed in narrow planar structures with significant angular momentum (Pawlowski et al., 2012; Ibata et al., 2013; Pawlowski & Kroupa, 2020; Santos-Santos et al., 2020; Pawlowski & Sohn, 2021). Flattened distributions of galaxies are observed also on larger spatial scales out to Mpc in the Local Group (Pawlowski et al., 2013) and in other nearby groups (Müller et al., 2017; Byun et al., 2020; Heesters et al., 2021; Martinez-Delgado et al., 2021). Thus, it is important to check the accuracy of these methods by comparing them with different approaches to estimate .
The Centaurus group is one of the best studied galaxy systems in our cosmic neighborhood (e.g. Côté et al., 1997; Jerjen et al., 2000a; Karachentsev et al., 2002; Crnojević et al., 2011; Müller et al., 2015; Taylor et al., 2018). Similarly to the Local Group, it is composed of two main giant galaxies – Centaurus A (Cen A) and M83 – each one with its own system of dwarf satellite galaxies. In this article we focus on Cen A and its dwarf galaxy satellites, which we will refer to as the “Cen A group” for simplicity.
The combination of accurate distances based on the tip of the red giant branch (TRGB) method and line-of-sight velocity measurements for 28 dwarf galaxies show that the Cen A satellite system forms a flattened and kinematically-coherent structure (Tully et al., 2015; Müller et al., 2016, 2018, 2021b), analogous to those found around the Milky Way and M31. Satellite systems with a similar kinematic coherence are extremely rare in CDM simulations, leading to the so-called “planes of satellites” problem (Kroupa et al., 2010; Libeskind et al., 2015; Pawlowski, 2018). These observations also suggest that dynamical mass estimates of Cen A should consider a flattened (non-spherical) system with both rotation and pressure support.
In this article, we use a Bayesian model to show that the satellite system of Cen A has significant rotational support (Sect. 2). Next, we use the Jeans’ equation in cylindrical symmetry to estimate the circular velocity and dynamical mass of the Cen A group (Sect. 3). Finally, we compare our new mass estimate with previous determinations in the literature and discuss the implications for CDM cosmology and alternative theories (Sect. 4).
2 Kinematics of Cen A satellite system
Cen A has 42 confirmed satellites and 30 additional candidates that await membership confirmation (Müller et al., 2019). Here we consider 27 galaxies from Müller et al. (2021b) that have both TRGB distances and line-of-sight velocities (see their Table A.1)111The references are: Peterson & Caldwell (1993), Banks et al. (1999), Jerjen et al. (2000a, b), Koribalski et al. (2004), Doyle et al. (2005), Saviane & Jerjen (2007), Bouchard et al. (2007), Tully et al. (2008, 2015), Kirby et al. (2012), Puzia & Sharina (2008), Karachentsev et al. (2013), Müller et al. (2019, 2021a), and Fahrion et al. (2020b)., as well as one dwarf galaxy with only velocity information, giving a total of 28 dwarf galaxies. For three galaxies the EDD team222Extragalactic Distance Database: http://edd.ifa.hawaii.edu/ (Tully et al., 2009) has re-reduced and updated the available HI data. The new values of the line-of-sight velocities are 4682 km s-1 for NGC 5102, 5163 km s-1 for ESO 324-024, and 5452 km s-1 for ESO 325-011, which we adopt here. Throughout the paper, based on EDD we adopt a distance of 3.68 Mpc for Cen A, we note however, that an average distance of 3.80.1 Mpc for Cen A is found using different distance estimates (Rejkuba, 2004; Harris et al., 2010). We use the EDD value to be as self-consistent as possible.
We build a Bayesian model to quantify the relative degrees of rotation and pressure support in the satellite system. Similar models have been used to study the motion of globular clusters within their host galaxies (e.g. Côté et al., 2001; Veljanoski & Helmi, 2016; Fahrion et al., 2020a; Lewis et al., 2020). Our model assumes that the satellite system is centered on Cen A and its galaxy members rotate in a common plane with a mean velocity . Deviations from purely circular motions (out-of-planar motions and more complex orbits) are encapsulated in the parameter that is a proxy for the mean velocity dispersion of the satellite system. This parameter sums quadratically to the observational error on the line-of-sight velocity of a satellite , giving the observed deviation from purely circular motions:
| (1) |
The projected velocity of a satellite galaxy along the line of sight is then given by
| (2) |
where is the inclination of the plane with respect to the sky, PA is the position angle of the major axis of the plane, is the measured 3D distance of a satellite from Cen A, and and are its projected separations from Cen A in the right ascension and declination directions, respectively.
The log likelihood is then given by:
| (3) |
where is the number of satellites and is the systemic velocity of the satellite system. Thus, the free parameters of the model are , , PA, , and .
For the systemic velocity, we assume a Gaussian prior centered at 556 km s-1 (the mean of ) with a standard deviation of 10 km s-1 (the standard error on the mean). The central value of is in close agreement with the systemic velocity of Cen A from HI observations (Koribalski et al., 2004), planetary nebulae (Peng et al., 2004b), and globular clusters (Peng et al., 2004a; Woodley et al., 2010)333However, velocities derived from stellar tracers are systematically lower (by 10-20 km s-1) than the HI measurement. This is still within the error, but may indicate that the gas is moving in respect to the stellar component of Cen A, which could be explained by Cen A’s recent major merger (Wang et al., 2020).. For the inclination angle, we assume a Gaussian prior centered at 86∘ with a standard deviation of 1∘ as suggested by the 3D geometry of the satellite system (Müller et al., 2019). In general, the rotation velocity of a projected disk is degenerate with the inclination angle: a tight prior on is crucial to break this degeneracy. Given that the satellite plane is seen close to edge-on, the precise value of plays a minor role in our estimate of (see Eq. 2).
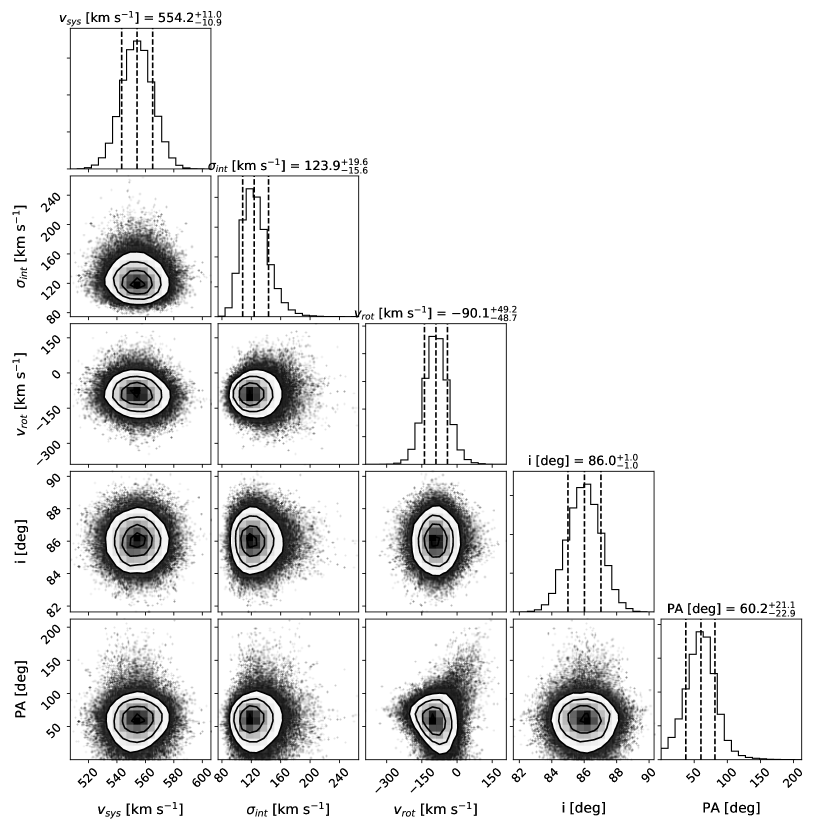
For the position angle, we run a preliminary MCMC simulation using a flat prior with . The resulting posterior probability distribution marginalized along PA displays two nearly Gaussian modes separated by 180∘, which represents two physical solutions for clockwise and anti-clockwise rotation. We shift one of the modes by 180∘ and determine PA, which we use to set a Gaussian prior on PA in a final MCMC run. For and , we use broad flat priors with km s-1 and km s-1. To sample the posterior distribution, we run a MCMC with 100 walkers with a chain length of 10’000 each. We use 100 burn-in iterations and then sample over the full chains to get the posterior.
Figure 1 shows that the posterior distributions are well behaved and display distinct peaks, indicating that the maximum-likelihood parameters are well determined. We find a rotational component with km s-1 (2 detection) and a random component with km s-1 (7 detection). The resulting ratio is 0.7, indicating that rotational support is non-negligible. To test the significance of the rotational component, we re-run our experiment 100 times by reshuffling the velocities and their errors among the satellites (all other parameters are kept the same). This results in a lower rotational component ( km s-1) and a higher random component ( km s-1). Most likely, the satellite system forms a thick structure flattened by rotation (see also Müller et al., 2019). The final PA value of degrees is consistent with previous estimate within 2.5 (Müller et al., 2018, 2021b); the difference is due to the fact that the current measurement maximizes the rotation signal, while previous measurements maximized the number of kinematically coherent satellites considering only the sign of the line-of-sight velocities with respect to Cen A but not their absolute values. Our results for and are consistent with those from Woodley (2006), who found km s-1, km s-1, and PA using a spherical model for a smaller sample of 13 galaxies. The PA estimates differs significantly, though.
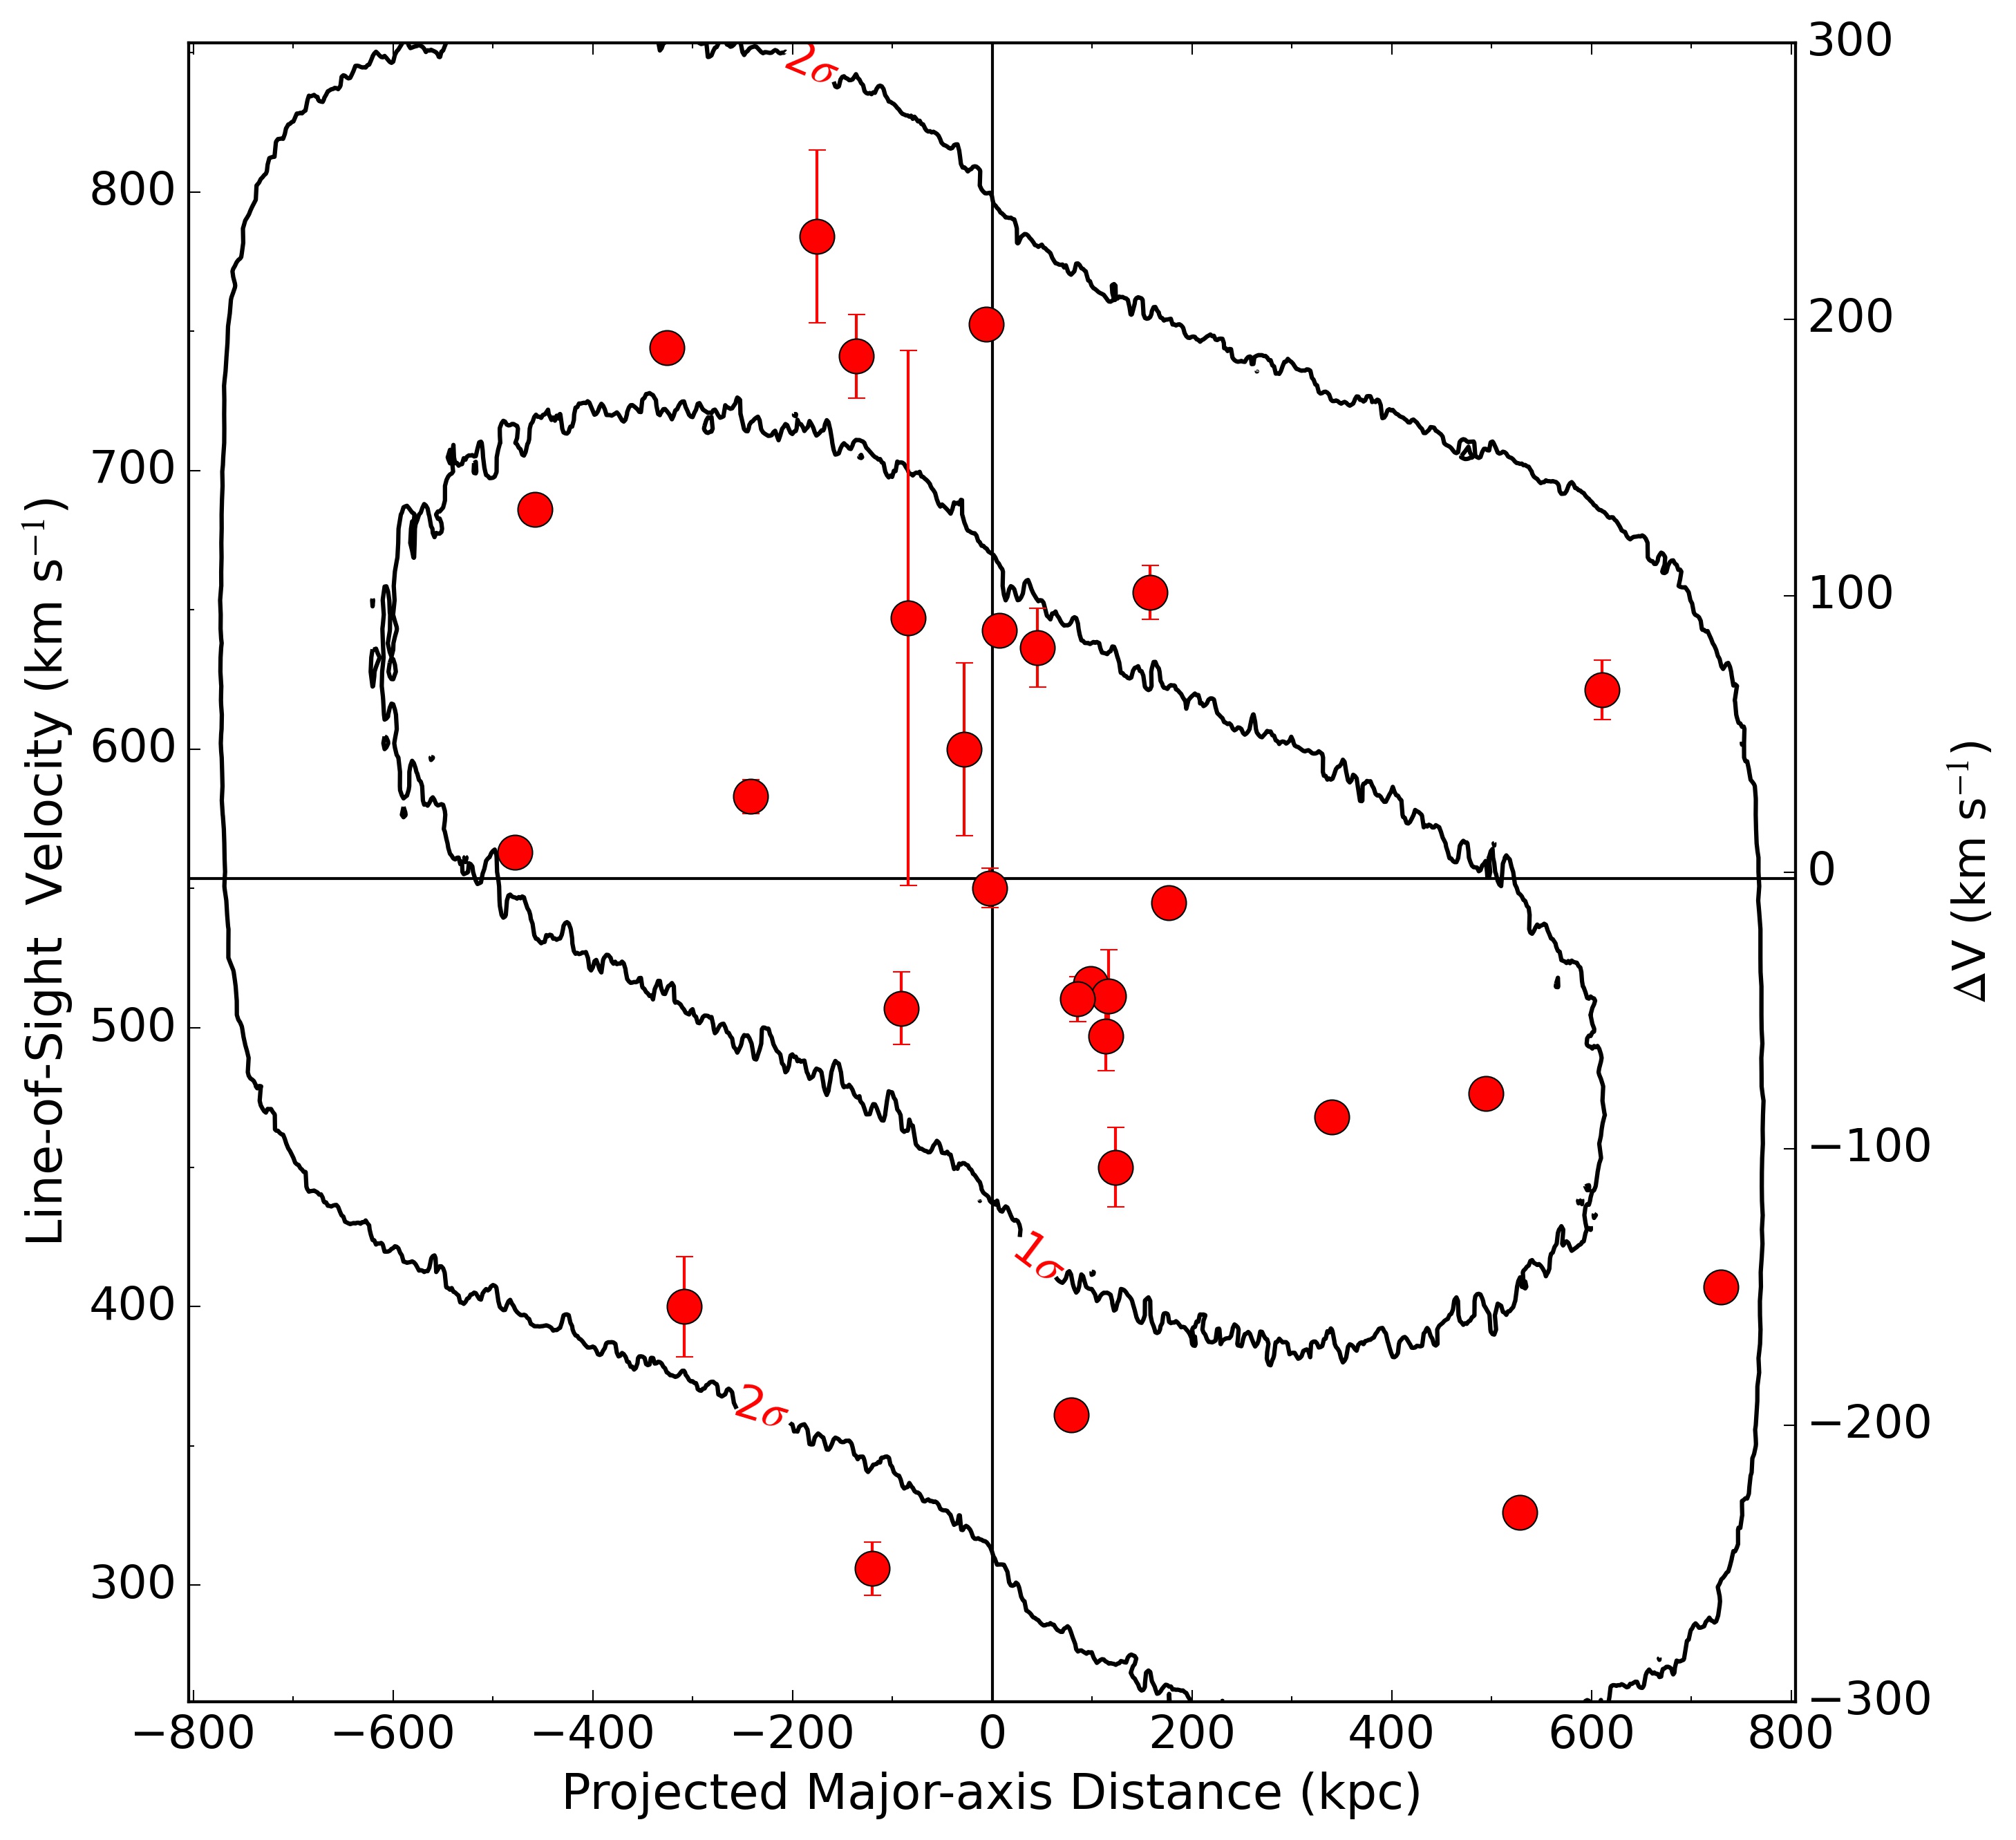
Figure 2 shows a position-velocity (PV) diagram along the projected major axis of the kinematic plane. The contours represent a rotating disk model projected on the sky, using the best-fit parameters from the MCMC analysis (Fig. 1). The disk model has a Gaussian thickness of 130 kpc (Müller et al., 2019) and assumes that satellite galaxies have equal probability to be found at any radius in the plane. Then, when the disk is projected to nearly edge-on orientation (), the probability of having a galaxy at small projected distances is higher than having one at larger projected distances due to line-of-sight integration. Figure 2 shows that all galaxies but one – KK 203 – agree within 2 with our model (60 within 1).
3 Dynamics of Cen A satellite system
3.1 Mean circular velocity
We use the motion of satellite galaxies around Cen A to measure the circular velocity and dynamical mass of the whole group. A dynamical analysis is not straightforward because the satellite system is supported by both rotation and random motions and only line-of-sight velocities are available. We assume that the satellite system is axisymmetric and adopt a cylindrical reference system (, , ) where is perpendicular to the rotating plane defined by Eq. 2. We further assume that the velocity ellipsoid is isotropic (), and thus the parameter in our MCMC analysis can be equate to the isotropic velocity dispersion. Under these simplifying assumptions, the circular velocity of a test particle subjected to the equilibrium gravitational potential is given by the Jeans’ equation in cylindrical symmetry (see, e.g. Lelli et al., 2014):
| (4) |
where
| (5) |
depends on the density profile of the tracers and the velocity dispersion profile . Having only 28 galaxies with line-of-sight velocities, we cannot constrain the velocity dispersion profile, so we consider as the average velocity dispersion across different radii and set the second term in Eq. 5 to zero.
To estimate the first term in Eq. 5, we consider all confirmed Cen A members adding 15 galaxies with known distances444These are: KKs53 (Tully et al., 2015), CenA-MM-Dw11, CenA-MM-Dw5, CenA-MM-Dw4, CenA-MM-Dw10, CenA-MM-Dw6, CenA-MM-Dw7, CenA-MM-Dw2, CenA-MM-Dw1, CenA-MM-Dw3, CenA-MM-Dw9, CenA-MM-Dw8 (Crnojević et al., 2014, 2019), KK213, KK217, and CenN (Karachentsev et al., 2002). (but without line-of-sight velocities) for a total of 43 objects. We project the galaxies in the plane () integrating along , i.e. a face-on projection of the satellite system. We assume that the thickness of the plane does not change with radius, so , where is the mass surface density. We measure summing the baryonic mass of the galaxies in an inner circle of radius 200 kpc and five outer annuli with a width of 150 kpc. This gives five radial bins that contain 18, 8, 9, 5, and 3 galaxies from the innermost to the outermost bin. Stellar masses for the satellites are derived either from -band magnitudes (where available) according to the Local Volume (LV) catalog adopting a mass-to-light ratio of 0.6 (McGaugh & Schombert 2014, 2015, the near infrared yields almost constant mass-to-light ratios), or from -band magnitudes according to Müller et al. (2019) with a mass-to-light ratio of 2.0 (see e.g. Lelli et al., 2017, for typical mass-to-light ratio values). When available, the cold gas mass is added to obtain the total baryonic mass, using where is the measured HI mass and the factor 1.33 takes the contribution of Helium into account. One galaxy (NGC4945) is removed from this analysis because it is two orders of magnitude more massive then the rest of the dwarf galaxies, leading to a sudden jump in the third radial bin. Fitting the resulting density profile with a power law, we obtain which is consistent with the outer slope of a NFW profile (Navarro et al., 1997). Because the bins were chosen arbitrarily and there are uncertainties in the stellar masses of the satellites, we double checked this fit using an MC approach. We randomly selected the inner and outer most ellipses to be within 100 kpc of the initially chosen radii, and the radial bins having a width between 100 kpc and 200 kpc. We varied the baryonic masses within a factor of 0.5 and 2. We repeatedly fitted the density profile using these randomizations and found that the slope of the density profile varied by 1.3, which is consistent with the error coming from the fit (1.5). If we turn off the randomization of the mass-to-light ratios the variation doesn’t change.
We obtain a circular velocity of km s-1. The uncertainty of the circular velocity is derived through an error propagation of Eq. 4 using the rotational velocity , the velocity dispersion and the fitted slope of the density profile , contributing to 17 km s-1, 32 km s-1, and 44 km s-1, respectively.
If we assume that there is some mild tangential anisotropy (), Equation 5 is replaced by . Then, the circular velocity decreases by 15 km s-1 which is smaller than our random errors on (60 km s-1).
3.2 Dynamical and baryonic masses
To estimate the dynamical mass of the group, we use the mean circular velocity and the maximal distance of the satellite population
| (6) |
With kms -1 and kpc, we get a dynamical mass of M⊙.
In a CDM cosmological context, the properties of cosmic structures are usually given in terms of a density contrast with respect to the critical density of the Universe . One then defines as the radius at which the mass volume density is equal to . If we assume that corresponds to the circular velocity at radius , the total mass (baryons and dark matter) is given by (see, e.g. McGaugh, 2012):
| (7) |
where km s-1 Mpc-1 (Schombert et al., 2020) is the Hubble constant555the exact value of the Hubble constant is highly debated, but generally ranges between 67 and 75 km s-1 Mpc-1, with uncertainties of the order of 2-5 km s-1 Mpc-1 (Freedman et al., 2019; Planck Collaboration et al., 2020a; Kourkchi et al., 2020; Khetan et al., 2021; Riess et al., 2021). We here adopt a Hubble constant based on the baryonic Tully-Fisher relation (BTFR)., and is given by
| (8) |
Adopting , we derive M⊙ within kpc.
Now we need to estimate the baryonic mass of the Cen A group. This is the baryonic mass locked into all confirmed galaxy members, neglecting the possible inter-galactic medium and the gas mass of Cen A, which is negligible compared to its stellar mass (, Struve et al. 2010). Cen A contributes for most of the group mass ( M⊙ from Romanowsky & Fall (2012), re-scaled to a distance of 3.68 Mpc), while the satellite galaxies add another M⊙. We estimate the baryonic mass of the Cen A group to be M⊙. We then derive a baryon fraction . This estimate is significantly lower than the baryon fraction expected from CDM fits to the cosmic microwave background: (Planck Collaboration et al., 2020b). This is another facet of the so-called “missing baryons problem” (McGaugh et al., 2010), which now emerges in a whole galaxy group rather than in a single galaxy. The amount of missing baryons in the Cen A group (77) is comparable to that in typical massive galaxies (Katz et al., 2018). This discrepancy is usually explained assuming that the missing baryons reside in a hot, diffuse gas phase that is difficult to detect and quantify. In a CDM context, therefore, we expect that the Cen A group should contain 8 in hot gas. There is a hot X-ray halo and filamentary structure detected in association with Cen A (Forman et al., 1985). Using most recent X-ray observations, Gaspari et al. (2019) find that the hot gas mass of Cen A is only M⊙ within 15 kpc (the observed size of the X-ray halo) and increases to M⊙ when extrapolating out to 300 kpc. This latter mass estimate is still 27 times smaller than that expected from the cosmic baryon fraction.
Some authors use different density contrasts to define the characteristic quantities of a cosmic structure. If we use , we get M⊙ within a virial radius kpc. In this case, Cen A would have a baryon fraction and be missing about 84 of the cosmologically available baryons. Clearly, the missing baryon problem in Cen A becomes even worse if we consider the dynamical mass of 1.21013 M⊙ out to the last measurable radius (800 kpc): then the baryon fraction decreases to a mere 0.02 and the amount of missing baryons increases to 90.
| Method | Radius | Ref. | |
|---|---|---|---|
| M⊙ | kpc | ||
| Rotating Plane | 1 | ||
| Virial Theorem | 1 | ||
| Rotating Plane | 1 | ||
| Virial Theorem | 8 | 400 | 2 |
| Rotating Plane | 1 | ||
| Virial Theorem | 12 | 600 | 3 |
| Rotating Sphere | 760 | 4 | |
| Rotating Plane | 1 | ||
| Zero-Velocity Surface | 6 | 1400 | 2 |
4 Discussion
4.1 Comparison with previous mass estimates
The dynamical mass of Cen A has been estimated by several authors using different techniques. Studies based on globular clusters (Peng et al., 2004a; Woodley et al., 2010) and/or planetary nebulae (Peng et al., 2004b; Samurović, 2016) probe the inner 4080 kpc, so they trace the gravitational potential of the central galaxy. Here we focus on the dynamical mass of the whole Cen A group (excluding the M83 association).
Table 1 lists mass measurements from the literature in increasing order of physical radius. Our mass estimate within kpc is consistent with previous measurements from van den Bergh (2000) and Woodley (2006) within similar radii. Specifically, van den Bergh (2000) used 30 candidate galaxy members (without secure distances at the time, where later observations showed that some of their candidates were not Cen A members, but rather M 83 members, which forms a distinct group, see Tully 2015) assuming spherical symmetry and an isotropic velocity ellipsoid, whereas Woodley (2006) used 13 confirmed members assuming a spherical model with both rotation and dispersion support. We think that our modeling is more reliable because it considers the observed spatial flattening of the satellite systems and deprojects the rotation velocity from the sky plane to the disk plane (see Sect. 2).
Our mass estimate within kpc is significantly larger than the value from Karachentsev et al. (2007) at a larger radius (1.4 Mpc) from the zero-velocity surface method. On the other hand, our mass estimates within a density contrast of 100 or 200, respectively ( kpc and kpc), is consistent with the one from Karachentsev et al. (2007) within a similar radius (400 kpc) using the Virial theorem. We conclude that the zero-velocity method is inferior to estimates using spherical and/or disk models, which display only minor differences.
To address the actual difference between a non-rotating spherical model – which can be considered as the CDM expectation – and a rotating disk model, we repeat the MCMC analysis in Sect. 2.2 dropping the term in Eq. (3) and fitting only for , as it is routinely done in the study of pressure-supported systems (e.g. Mateo et al. 1991; Walker et al. 2009; Taibi et al. 2018; van Dokkum et al. 2019; Emsellem et al. 2019; Collins et al. 2021). We find km s-1, which is larger than the previous estimate because the rotational component now enters as a pressure term. To infer the dynamical mass, we adopt the Wolf et al. (2010) estimator that holds when the velocity dispersion profile is approximately flat near the half-mass radius :
| (9) |
For kpc (approximated by the median separation of the satellite system), we derive a dynamical mass of M⊙ for such a non-rotating spherical model. If we use Eq. 6 at the same radius, we derive a dynamical mass of M⊙ for the rotating disk model. These two values are consistent within the errors but we consider the rotating disk model better because the satellite system of Cen A is clearly non-spherical.
4.2 Baryonic Tully-Fisher Relation and MOND
Having measured the circular velocity and baryonic mass of the Cen A group, we can investigate its position on the baryonic Tully-Fisher relation (BTFR, McGaugh et al. 2000). The BTFR is an empirical relationship between the baryonic mass of a galaxy and the circular velocity along the flat part of the rotation curve, pointing to a tight coupling between baryons and dark matter (e.g. Lelli et al., 2016b, 2019). Figure 3 shows the location of the Cen A group on the BTFR defined by late-type galaxies from the SPARC database (Lelli et al., 2016a) as well as early-type galaxies from Atlas3D (den Heijer et al., 2015). Our measurement of the Cen A group falls right on top of the BTFR. This is remarkable because we are comparing individual galaxies with a whole galaxy group, whose formation and evolution history is presumably governed by different processes on larger scales.
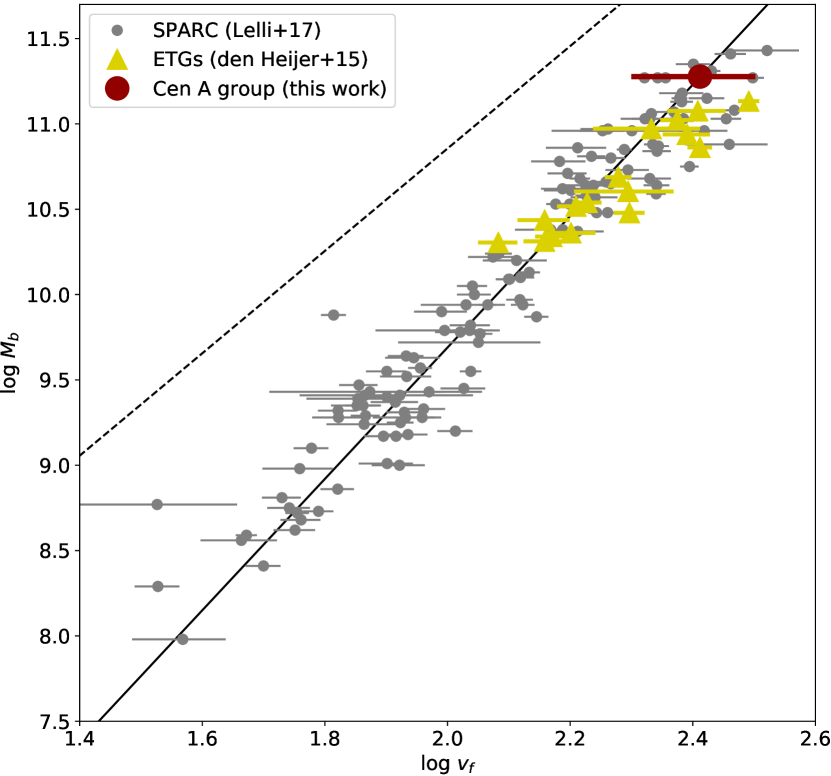
The location of Cen A on the BTFR agrees with the expectations of Milgromian Dynamics (MOND, Milgrom, 1983c, a, b). MOND is an alternative to particle dark matter, in which the Newtonian laws of Gravity and/or inertia are modified at accelerations smaller than 10-10 m s-2 (Famaey & McGaugh, 2012). In a MOND context, the BTFR represents a fundamental law of Nature that should be followed by any isolated gravitational system in equilibrium, independently of its formation and evolution. MOND has been successfully tested in Cen A using globular clusters (Samurović, 2016). Fig. 3 extends such a test out to much larger radii. In a MOND context, the Cen A group should contain little (if any) missing baryons. This is in line with the study of Milgrom (2019) for a sample of 56 galaxy groups. Note that, in MOND, the internal gravity of the Cen A group would dominate over the external one within 500 kpc (Oria et al., 2021), and a drop of 60 km s-1 would be expected at 800 kpc due to the external field effect arising from the cosmic large-scale structure (see e.g. Haghi et al. 2019; Freundlich et al. 2021; Chae et al. 2021), which is within our error bar for the global value.
5 Summary and Conclusions
We studied the dynamics of the Cen A galaxy group using accurate 3D distances and line-of-sight velocities of its member galaxies. Our main results can be summarized as follows:
-
1.
We used a Bayesian model to study the kinematics of the satellite system considering both rotation and random motions. The ratio between the mean rotation velocity and the mean velocity dispersion is , indicating that the satellite system has significant rotational support.
-
2.
Assuming an axisymmetric and isotropic (in velocity space) satellite system, we derived a mean circular velocity of 258 km s-1. This translates into a dynamical mass of M⊙ within 800 kpc (the distance of the outermost satellite from Cen A).
-
3.
In a CDM context, we derive a virial mass M⊙ within a virial radius kpc. This gives a baryon fraction implying that about 77 of the cosmologically available baryons are missing. The missing baryons may be in a hot diffuse medium with a mass of 81011 M⊙, which is 4 times larger than the mass locked in stars and gas within galaxies. The expected hot gas mass is more than one order of magnitude larger than that inferred from the most recent X-ray observations. On the other hand, at the galaxy level, for Cen A is much higher than predicted by common abundance matching relations (e.g., Moster et al. 2013; Behroozi et al. 2013) but is compatible within scatter and error bars with the stellar-to-halo-mass relation from Kravtsov et al. (2018).
-
4.
Cen A group lies on the baryonic Tully-Fisher relation defined by individual galaxies. This is in agreement with MOND predictions with no need for a significant amount of unaccounted baryons.
Acknowledgements.
We thank the referee for the constructive report, which helped to clarify and improve the manuscript. O.M. is grateful to the Swiss National Science Foundation for financial support. O.M. also thanks the Arcetri Astrophysical Observatory for its hospitality during his visit. B.F., M.S.P. and O.M. thank the DAAD for PPP grant 57512596 funded by the BMBF, and the Partenariat Hubert Curien (PHC) for PROCOPE project 44677UE. B.F. acknowledges funding from the Agence Nationale de la Recherche (ANR projects ANR-18-CE31-0006 and ANR-19-CE31-0017), and from the European Research Council (ERC) under the European Union’s Horizon 2020 Framework programme (grant agreement number 834148). M.S.P. is funded by a Leibniz-Junior Research Group grant (project number J94/2020) via the Leibniz Competition, and further thanks the Klaus Tschira Stiftung gGmbH and German Scholars Organization e.V. for support via a Klaus Tschira Boost Fund. K.F. acknowledges support through the European Space Agency fellowship programme.References
- Banik & Zhao (2018) Banik, I. & Zhao, H. 2018, MNRAS, 473, 4033
- Banks et al. (1999) Banks, G. D., Disney, M. J., Knezek, P. M., et al. 1999, ApJ, 524, 612
- Behroozi et al. (2013) Behroozi, P. S., Wechsler, R. H., & Conroy, C. 2013, ApJ, 770, 57
- Bouchard et al. (2007) Bouchard, A., Jerjen, H., Da Costa, G. S., & Ott, J. 2007, AJ, 133, 261
- Bullock & Boylan-Kolchin (2017) Bullock, J. S. & Boylan-Kolchin, M. 2017, ARA&A, 55, 343
- Byun et al. (2020) Byun, W., Sheen, Y.-K., Park, H. S., et al. 2020, ApJ, 891, 18
- Chae et al. (2021) Chae, K.-H., Desmond, H., Lelli, F., McGaugh, S. S., & Schombert, J. M. 2021, ApJ, 921, 104
- Collins et al. (2021) Collins, M. L. M., Read, J. I., Ibata, R. A., et al. 2021, MNRAS, 505, 5686
- Côté et al. (2001) Côté, P., McLaughlin, D. E., Hanes, D. A., et al. 2001, ApJ, 559, 828
- Côté et al. (1997) Côté, S., Freeman, K. C., Carignan, C., & Quinn, P. J. 1997, AJ, 114, 1313
- Crnojević et al. (2011) Crnojević, D., Grebel, E. K., & Cole, A. A. 2011, A&A, 530, A59
- Crnojević et al. (2019) Crnojević, D., Sand, D. J., Bennet, P., et al. 2019, ApJ, 872, 80
- Crnojević et al. (2014) Crnojević, D., Sand, D. J., Caldwell, N., et al. 2014, ApJ, 795, L35
- den Heijer et al. (2015) den Heijer, M., Oosterloo, T. A., Serra, P., et al. 2015, A&A, 581, A98
- Doyle et al. (2005) Doyle, M. T., Drinkwater, M. J., Rohde, D. J., et al. 2005, MNRAS, 361, 34
- Emsellem et al. (2019) Emsellem, E., van der Burg, R. F. J., Fensch, J., et al. 2019, A&A, 625, A76
- Fahrion et al. (2020a) Fahrion, K., Lyubenova, M., Hilker, M., et al. 2020a, A&A, 637, A26
- Fahrion et al. (2020b) Fahrion, K., Müller, O., Rejkuba, M., et al. 2020b, A&A, 634, A53
- Famaey & McGaugh (2012) Famaey, B. & McGaugh, S. S. 2012, Living Reviews in Relativity, 15, 10
- Forman et al. (1985) Forman, W., Jones, C., & Tucker, W. 1985, ApJ, 293, 102
- Freedman et al. (2019) Freedman, W. L., Madore, B. F., Hatt, D., et al. 2019, ApJ, 882, 34
- Freundlich et al. (2021) Freundlich, J., Famaey, B., Oria, P. A., et al. 2021, arXiv e-prints, arXiv:2109.04487
- Gaspari et al. (2019) Gaspari, M., Eckert, D., Ettori, S., et al. 2019, ApJ, 884, 169
- Haghi et al. (2019) Haghi, H., Kroupa, P., Banik, I., et al. 2019, MNRAS, 487, 2441
- Harris et al. (2010) Harris, G. L. H., Rejkuba, M., & Harris, W. E. 2010, PASA, 27, 457
- Heesters et al. (2021) Heesters, N., Habas, R., Marleau, F. R., et al. 2021, A&A, 654, A161
- Ibata et al. (2013) Ibata, R. A., Lewis, G. F., Conn, A. R., et al. 2013, NAT, 493, 62
- Jerjen et al. (2000a) Jerjen, H., Binggeli, B., & Freeman, K. C. 2000a, AJ, 119, 593
- Jerjen et al. (2000b) Jerjen, H., Freeman, K. C., & Binggeli, B. 2000b, AJ, 119, 166
- Karachentsev (2005) Karachentsev, I. D. 2005, AJ, 129, 178
- Karachentsev et al. (2009) Karachentsev, I. D., Kashibadze, O. G., Makarov, D. I., & Tully, R. B. 2009, MNRAS, 393, 1265
- Karachentsev et al. (2013) Karachentsev, I. D., Makarov, D. I., & Kaisina, E. I. 2013, AJ, 145, 101
- Karachentsev et al. (2002) Karachentsev, I. D., Sharina, M. E., Dolphin, A. E., et al. 2002, A&A, 385, 21
- Karachentsev et al. (2007) Karachentsev, I. D., Tully, R. B., Dolphin, A., et al. 2007, AJ, 133, 504
- Kashibadze & Karachentsev (2018) Kashibadze, O. G. & Karachentsev, I. D. 2018, A&A, 609, A11
- Katz et al. (2018) Katz, H., Desmond, H., Lelli, F., et al. 2018, MNRAS, 480, 4287
- Khetan et al. (2021) Khetan, N., Izzo, L., Branchesi, M., et al. 2021, A&A, 647, A72
- Kirby et al. (2012) Kirby, E. M., Koribalski, B., Jerjen, H., & López-Sánchez, Á. 2012, MNRAS, 420, 2924
- Koribalski et al. (2004) Koribalski, B. S., Staveley-Smith, L., Kilborn, V. A., et al. 2004, AJ, 128, 16
- Kourkchi & Tully (2017) Kourkchi, E. & Tully, R. B. 2017, ApJ, 843, 16
- Kourkchi et al. (2020) Kourkchi, E., Tully, R. B., Eftekharzadeh, S., et al. 2020, ApJ, 902, 145
- Kravtsov et al. (2018) Kravtsov, A. V., Vikhlinin, A. A., & Meshcheryakov, A. V. 2018, Astronomy Letters, 44, 8
- Kroupa et al. (2010) Kroupa, P., Famaey, B., de Boer, K. S., et al. 2010, A&A, 523, A32
- Lelli et al. (2014) Lelli, F., Fraternali, F., & Verheijen, M. 2014, A&A, 563, A27
- Lelli et al. (2016a) Lelli, F., McGaugh, S. S., & Schombert, J. M. 2016a, AJ, 152, 157
- Lelli et al. (2016b) Lelli, F., McGaugh, S. S., & Schombert, J. M. 2016b, ApJ, 816, L14
- Lelli et al. (2019) Lelli, F., McGaugh, S. S., Schombert, J. M., Desmond, H., & Katz, H. 2019, MNRAS, 484, 3267
- Lelli et al. (2017) Lelli, F., McGaugh, S. S., Schombert, J. M., & Pawlowski, M. S. 2017, ApJ, 836, 152
- Lewis et al. (2020) Lewis, G. F., Brewer, B. J., & Wan, Z. 2020, MNRAS, 491, L1
- Libeskind et al. (2015) Libeskind, N. I., Hoffman, Y., Tully, R. B., et al. 2015, MNRAS, 452, 1052
- Lynden-Bell (1981) Lynden-Bell, D. 1981, The Observatory, 101, 111
- Martinez-Delgado et al. (2021) Martinez-Delgado, D., Makarov, D., Javanmardi, B., et al. 2021, arXiv e-prints, arXiv:2106.08868
- Mateo et al. (1991) Mateo, M., Olszewski, E., Welch, D. L., Fischer, P., & Kunkel, W. 1991, AJ, 102, 914
- McGaugh (2012) McGaugh, S. S. 2012, AJ, 143, 40
- McGaugh & Schombert (2014) McGaugh, S. S. & Schombert, J. M. 2014, AJ, 148, 77
- McGaugh & Schombert (2015) McGaugh, S. S. & Schombert, J. M. 2015, ApJ, 802, 18
- McGaugh et al. (2000) McGaugh, S. S., Schombert, J. M., Bothun, G. D., & de Blok, W. J. G. 2000, ApJ, 533, L99
- McGaugh et al. (2010) McGaugh, S. S., Schombert, J. M., de Blok, W. J. G., & Zagursky, M. J. 2010, ApJ, 708, L14
- Milgrom (1983a) Milgrom, M. 1983a, ApJ, 270, 371
- Milgrom (1983b) Milgrom, M. 1983b, ApJ, 270, 384
- Milgrom (1983c) Milgrom, M. 1983c, ApJ, 270, 365
- Milgrom (2019) Milgrom, M. 2019, Phys. Rev. D, 99, 044041
- Moster et al. (2013) Moster, B. P., Naab, T., & White, S. D. M. 2013, MNRAS, 428, 3121
- Müller et al. (2021a) Müller, O., Fahrion, K., Rejkuba, M., et al. 2021a, A&A, 645, A92
- Müller et al. (2015) Müller, O., Jerjen, H., & Binggeli, B. 2015, A&A, 583, A79
- Müller et al. (2016) Müller, O., Jerjen, H., Pawlowski, M. S., & Binggeli, B. 2016, A&A, 595, A119
- Müller et al. (2018) Müller, O., Pawlowski, M. S., Jerjen, H., & Lelli, F. 2018, Science, 359, 534
- Müller et al. (2021b) Müller, O., Pawlowski, M. S., Lelli, F., et al. 2021b, A&A, 645, L5
- Müller et al. (2019) Müller, O., Rejkuba, M., Pawlowski, M. S., et al. 2019, A&A, 629, A18
- Müller et al. (2017) Müller, O., Scalera, R., Binggeli, B., & Jerjen, H. 2017, A&A, 602, A119
- Navarro et al. (1997) Navarro, J. F., Frenk, C. S., & White, S. D. M. 1997, ApJ, 490, 493
- Oppenheimer et al. (2021) Oppenheimer, B. D., Babul, A., Bahé, Y., Butsky, I. S., & McCarthy, I. G. 2021, Universe, 7, 209
- Oria et al. (2021) Oria, P. A., Famaey, B., Thomas, G. F., et al. 2021, arXiv e-prints, arXiv:2109.10160
- Pawlowski (2018) Pawlowski, M. S. 2018, Modern Physics Letters A, 33, 1830004
- Pawlowski & Kroupa (2020) Pawlowski, M. S. & Kroupa, P. 2020, MNRAS, 491, 3042
- Pawlowski et al. (2013) Pawlowski, M. S., Kroupa, P., & Jerjen, H. 2013, MNRAS, 435, 1928
- Pawlowski et al. (2012) Pawlowski, M. S., Pflamm-Altenburg, J., & Kroupa, P. 2012, MNRAS, 423, 1109
- Pawlowski & Sohn (2021) Pawlowski, M. S. & Sohn, S. T. 2021, arXiv e-prints, arXiv:2109.13253
- Peng et al. (2004a) Peng, E. W., Ford, H. C., & Freeman, K. C. 2004a, ApJ, 602, 705
- Peng et al. (2004b) Peng, E. W., Ford, H. C., & Freeman, K. C. 2004b, ApJ, 602, 685
- Peterson & Caldwell (1993) Peterson, R. C. & Caldwell, N. 1993, AJ, 105, 1411
- Planck Collaboration et al. (2020a) Planck Collaboration, Aghanim, N., Akrami, Y., et al. 2020a, A&A, 641, A6
- Planck Collaboration et al. (2020b) Planck Collaboration, Aghanim, N., Akrami, Y., et al. 2020b, A&A, 641, A6
- Puzia & Sharina (2008) Puzia, T. H. & Sharina, M. E. 2008, ApJ, 674, 909
- Rejkuba (2004) Rejkuba, M. 2004, A&A, 413, 903
- Riess et al. (2021) Riess, A. G., Casertano, S., Yuan, W., et al. 2021, ApJ, 908, L6
- Romanowsky & Fall (2012) Romanowsky, A. J. & Fall, S. M. 2012, ApJS, 203, 17
- Samurović (2016) Samurović, S. 2016, Ap&SS, 361, 199
- Sandage (1986) Sandage, A. 1986, ApJ, 307, 1
- Santos-Santos et al. (2020) Santos-Santos, I. M., Domínguez-Tenreiro, R., & Pawlowski, M. S. 2020, MNRAS, 499, 3755
- Saviane & Jerjen (2007) Saviane, I. & Jerjen, H. 2007, AJ, 133, 1756
- Schombert et al. (2020) Schombert, J., McGaugh, S., & Lelli, F. 2020, AJ, 160, 71
- Struve et al. (2010) Struve, C., Oosterloo, T. A., Morganti, R., & Saripalli, L. 2010, A&A, 515, A67
- Taibi et al. (2018) Taibi, S., Battaglia, G., Kacharov, N., et al. 2018, A&A, 618, A122
- Taylor et al. (2018) Taylor, M. A., Eigenthaler, P., Puzia, T. H., et al. 2018, ApJ, 867, L15
- Tully (2015) Tully, R. B. 2015, AJ, 149, 54
- Tully et al. (2015) Tully, R. B., Libeskind, N. I., Karachentsev, I. D., et al. 2015, ApJ, 802, L25
- Tully et al. (2009) Tully, R. B., Rizzi, L., Shaya, E. J., et al. 2009, AJ, 138, 323
- Tully et al. (2008) Tully, R. B., Shaya, E. J., Karachentsev, I. D., et al. 2008, ApJ, 676, 184
- van den Bergh (2000) van den Bergh, S. 2000, AJ, 119, 609
- van Dokkum et al. (2019) van Dokkum, P., Danieli, S., Abraham, R., Conroy, C., & Romanowsky, A. J. 2019, ApJ, 874, L5
- Veljanoski & Helmi (2016) Veljanoski, J. & Helmi, A. 2016, A&A, 592, A55
- Walker et al. (2009) Walker, M. G., Mateo, M., Olszewski, E. W., et al. 2009, ApJ, 704, 1274
- Wang et al. (2020) Wang, J., Hammer, F., Rejkuba, M., Crnojević, D., & Yang, Y. 2020, MNRAS, 498, 2766
- Wolf et al. (2010) Wolf, J., Martinez, G. D., Bullock, J. S., et al. 2010, MNRAS, 406, 1220
- Woodley (2006) Woodley, K. A. 2006, AJ, 132, 2424
- Woodley et al. (2010) Woodley, K. A., Gómez, M., Harris, W. E., Geisler, D., & Harris, G. L. H. 2010, AJ, 139, 1871
- Zwicky (1933) Zwicky, F. 1933, Helvetica Physica Acta, 6, 110