First measurement of the reaction in an inertial confinement fusion implosion at the National Ignition Facility: Initial steps toward the development of a radiochemistry mix diagnostic
Abstract
We report the first measurement of the reaction in a polar-direct-drive exploding pusher (PDXP) at the National Ignition Facility (NIF). This work is motivated by the need to develop alternative mix diagnostics, radiochemistry being the focus here. The target is composed of a deuterium-tritium (DT) fill surrounded by a roughly thick beryllium ablator. The inner portion of the beryllium ablator is doped with of \isotope[10]B. Radiation-hydrodynamics calculations were performed in 1D to optimize both the remaining boron rho-R and the DT neutron yield. A charged-particle transport post-processor has been developed to study -induced reactions on the ablator material. Results indicate a large \isotope[13]N production from -induced reactions on \isotope[10]B, measurable by the radiochemical analysis of gaseous samples system at the NIF. The PDXP target N201115-001 was successfully fielded on the NIF, and nitrogen from the reaction was measured. The \isotope[13]N production yield, as well as the DT neutron yield, was, however, lower than expected. Some of the reduced yields can be explained by the oblate shape, but the ratios of the various radiochemical signals are not commensurate with expectations based on a simple reduction of the 1D results. Preliminary 2D radiation-hydrodynamics computations are consistent with the experimental measurements, and work is ongoing to extend the radiochemistry analysis into higher dimensions.
I Introduction
Inertial confinement fusion (ICF)Nuckolls et al. (1972) involves a target capsule filled (usually) with deuterium-tritium (DT) fuel that is compressed and heated by the energy delivered to the outer ablator layer of the target using either direct laser light,Craxton et al. (2015) or x-rays generated inside a Hohlraum illumined by lasers.Lindl (1995) Much of the outer layer ablates off, causing the remaining target to implode via the rocket effect. The central fuel is compressed and heated as the remaining ablator material moves inwards, and the ablator’s kinetic energy is converted into fuel internal energy. As pressure builds in the DT gas, the ablator begins decelerating and eventually stagnates, representing the point at which work ceases to increase the fuel energy.
During the deceleration phase of the implosion, Rayleigh-TaylorLord Rayleigh (1882); Taylor (1950) (RT) instabilities can form, leading to mixing between the ablator material and the DT fuel.Palaniyappan et al. (2020) The shock waves involved in the implosion can induce Richtmyer-MeshkovRichtmyer (1960); Meshkov (1969) (RM) instabilities, possibly contributing to mixing as well.Bose et al. (2015) RT, RM, and other instabilities are seeded by surface finish imperfections, illumination nonuniformity, the fill tube, glue spot, and the capsule support tent.Clark et al. (2016); Haines et al. (2017); Weber et al. (2017); Clark et al. (2019); Haines et al. (2019); Weber et al. (2020) Mixing between the ablator material and the DT gas is undesirable, because it reduces the fuel temperature. It also raises the adiabat of the fuel,Cheng et al. (2016, 2018) making it harder to compress. Both of these effects reduce the performance of the capsule.
One method for diagnosing the mix of ablator material into the DT fuel is to study the degree of elevated x-ray emission from the burning DT fuel.Ma et al. (2013) X-ray imaging can also show distortions during the implosion and the hot spot at peak compression.Döppner et al. (2020) However, there are capsule designs being developed for the National Ignition FacilityEdwards et al. (2013) (NIF), such as double shell and pushered single shell,Montgomery et al. (2018); Dewald et al. (2019) for which this x-ray technique cannot be used effectively because the designs involve a high- shell surrounding the DT fuel that is opaque to x-rays.
A possible alternative mix diagnostic involves measuring the interaction of alpha particles, produced in the reaction, with the ablator material.Colvin et al. (2008) The Radiochemical Analysis of Gaseous Samples (RAGS) facility Shaughnessy et al. (2012) at NIF, which collects the gaseous debris emitted into the chamber from imploded capsules, allows for quantitative measurements of -induced reactions, as long as the reaction products are gaseous. If mixing occurs, the DT production is reduced due to the decrease of the capsule performance. The reduction in the DT yield from mixing may be partially compensated for by the closer proximity of the ablator materials to the alpha production region. The net effect is expected to be an appreciable change in the radiochemical signature ratios, making radiochemistry (RadChem) a valuable mix diagnostic for ICF studies.Colvin et al. (2008)
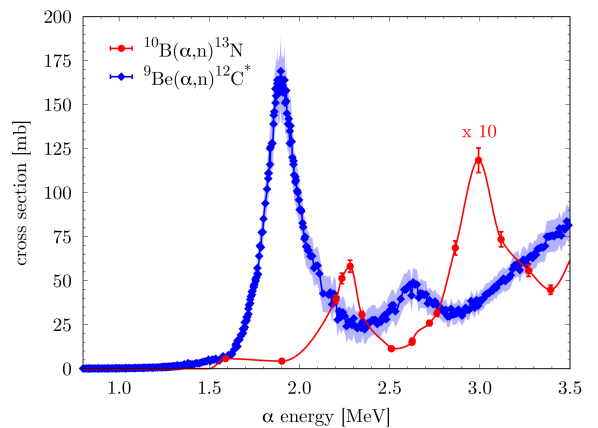
In this work, we present the first measurement of the reaction in an ICF implosion, using a polar-direct-drive exploding pusher (PDXP) shot at NIF, N201115-001, as a first step in the development of RadChem mix diagnostics. The cross section for this reaction is shown in Fig. 1 (red circles), as discussed in Ref. Liu et al., 2019. There is a significant peak in the cross section for particles with of energy, slightly below the expected energy for ’s produced from the D+T fusion reaction.
The N201115-001 target consisted of a 65/35 at. % deuterium-tritium fill ( at room temperature) surrounded by a boron-doped beryllium ablator. In addition to the \isotope[13]N measurement, RAGS was also used to measure the neutron-induced reaction on argon, , providing a potential additional diagnostic for the areal density of the remaining ablator material at the time of the DT burn, in a similar manner as Ref. Wilson et al., 2017. As described later in the manuscript, the \isotope[41]Ar signal can also be used as a mix metric together with \isotope[13]N. (Argon was present in the beryllium ablator as a by-product of the sputter-coating fabrication process.) The gamma reaction history (GRH) capabilityHerrmann et al. (2010) was also employed in an attempt to measure gamma from the de-excitation of carbon excited states coming from the reaction, as a cross calibration for the RadChem diagnostic. This reaction cross section is also shown in Fig. 1 (blue diamonds). The capsule produced DT neutrons, and \isotope[13]N and \isotope[41]Ar. A combination of low signal and competition between the and the DT fusion gamma rays allowed only an upper limit of of the gamma ray yield (see Table 1 and the discussion in Sec. IV). Due to the ablator being made primarily of beryllium, the GRH signal was not able to infer a shell from the data as has been done for carbon-based ablators.Meaney et al. (2021)
| \isotope[10]B dopant level | General Atomics | |
| \isotope[40]Ar concentration | General Atomics | |
| Bang time | GRHHerrmann et al. (2010) | |
| SPIDERKhan et al. (2012) | ||
| Burn width | GRH | |
| SPIDER | ||
| DT yield | Well-NADYeamans and Bleuel (2017) | |
| \isotope[13]N yield | RAGSShaughnessy et al. (2012) | |
| \isotope[41]Ar yield | RAGS | |
| yield | GRH |
The remainder of the paper is organized as follows. In Sec. II, we discuss the target design, the radiation-hydrodynamics modeling framework and initial optimization studies, and the target fabrication process. In Sec. III, we present tuned post-shot simulations in 1D, the RadChem post-processing framework is introduced, and we discuss sensitivities observed from applying this methodology to our 1D simulations. The experimental results are presented in Sec. IV, and more detailed 2D radiation-hydrodynamics modeling is also considered here. Finally, we conclude in Sec. V and discuss next steps for the platform.
II Initial design studies
We based our original design on a previously developed low-convergence, high-yield polar direct-drive exploding pusher platform.Ellison et al. (2018) The particular capsule we chose to emulate was fielded on NIF shot N190707-001 (colloquially known as “Little Guy”), a CH ablator target that yielded neutrons.Yeamans et al. (2021) In that design, the laser drive was optimized to minimize multi-dimensional effects, enabling physics studies in an approximately 1D configuration. Further, this laser drive (total of laser energy) has the advantage of inducing no known optics damage at NIF, providing a robust neutron signal with no risk to the laser. In this design work, we opted to keep the same laser pulse history and beam pointings due to the record performance achieved with no optics damage.
In order to measure the primary reaction, the capsule design had to be modified to include \isotope[10]B near the DT fuel region, placing it in close proximity to the particles produced from thermonuclear burn. However, it proved difficult to fabricate leak-tight pure boron ablators that can hold DT gas at the required fill pressures, limiting our design choices to only utilizing a doped \isotope[10]B region. In a CH ablator, \isotope[13]N can also be produced from the competing reactions and . This background production from carbon can potentially be comparable to the production from boron,Liu et al. (2019) posing significant technical challenges to the extraction of the -induced contribution from the total signal. Instead, we considered a beryllium ablator with a region of boron-doped beryllium on the inner part of the capsule. This has the additional advantage of providing a complementary diagnostic via the measurement of gammas coming from the reaction.
We note that the relevant reactions for this study are only those populating the \isotope[13]N lowest-energy state, the angle-integrated cross section of which has been recently remeasured in the energy range relevant for DT nuclear burnLiu et al. (2019) (see Fig. 1). In fact, the ground-state of \isotope[13]N has a half-life of ,Ajzenberg-Selove (1991) long enough to allow collection using RAGS. \isotope[13]N excited states are proton unbound and will, instead, immediately decay to stable \isotope[12]C.
The long half-life of \isotope[41]Ar (Nesaraja and Mccutchan (2016)) makes it a good candidate for collection at RAGS, allowing us to also measure the reaction . The sputter-coating process used to fabricate these capsules results in a small amount of argon being uniformly deposited within the ablator as well. From our analysis of the fabricated capsule, the \isotope[40]Ar concentration in the ablator shell was estimated to be of the order of . Indirect-drive targets are sensitive to the argon concentration, primarily as a result of the modification in the opacity of the ablator.Wilson et al. (2017) However, this is not as well studied for direct-drive targets. Preliminary modeling, discussed in Sec. III.3, finds sensitivity to the argon concentration.
II.1 Modeling framework and design optimization
Our design calculations are carried out with xRAGE,Gittings et al. (2008); Haines et al. (2017) the Los Alamos National Laboratory’s Eulerian radiation-hydrodynamics code. A laser package has recently been implemented for 1D and 2D xRAGE computations.Marozas et al. (2018); Haines et al. (2020) Here, we use an ad hoc laser power multiplier, , to reduce the input laser energy to account for cross-beam energy transfer (CBET) or other laser plasma instabilities (LPI) that are not currently modeled. (Although a CBET package is available, it increases the computational cost considerably and was not used in our preliminary design calculations.) Thermal conduction in xRAGE (and many radiation-hydrodynamics codes) is handled using the Spitzer-Harm approach with a flux limiter that is used to limit the rate at which heat can be transported (for more details, see Ref. Meezan et al., 2020 and references therein). The appropriate value of for any given configuration is an area of active research,Farmer et al. (2020, 2021) and we treat it as a free parameter here. We first modeled the CH capsule N190707 using 1D xRAGE simulations in order to calibrate and , following Ref. Ellison et al., 2018. We performed a two-dimensional scan of the parameter space, seeking to match the observed DT yield and the bang time as closely as possible. The best match to N190707 was found for and .
Having calibrated our 1D simulations to match the existing data from N190707, we then began preliminary design simulations for the N201115 target. As noted previously, we considered an ablator consisting of an outer pure beryllium layer and an inner boron-doped beryllium layer. In our modeling for N201115, the \isotope[10]B and \isotope[9]Be are included as separate materials, each with their respective equations of state (EOS) from the Livermore Equations of State (LEOS) databaseYoung and Corey (1995) and opacities as calculated from the OPLIB databaseColgan et al. (2016) using the TOPS code.Abdallah Jr and Clark (1985) The materials are pre-mixed in the appropriate atomic fractions in the doped region of the ablator. In these initial design studies, we considered \isotope[10]B in the inner beryllium layer; though as will be discussed subsequently, we were limited to due to fabrication practicalities. Finally, although a small fraction of \isotope[40]Ar is present in the ablator layers as noted previously, this was not modeled in these initial calculations. Sensitivity to the argon concentration is considered later in Sec. III.3.
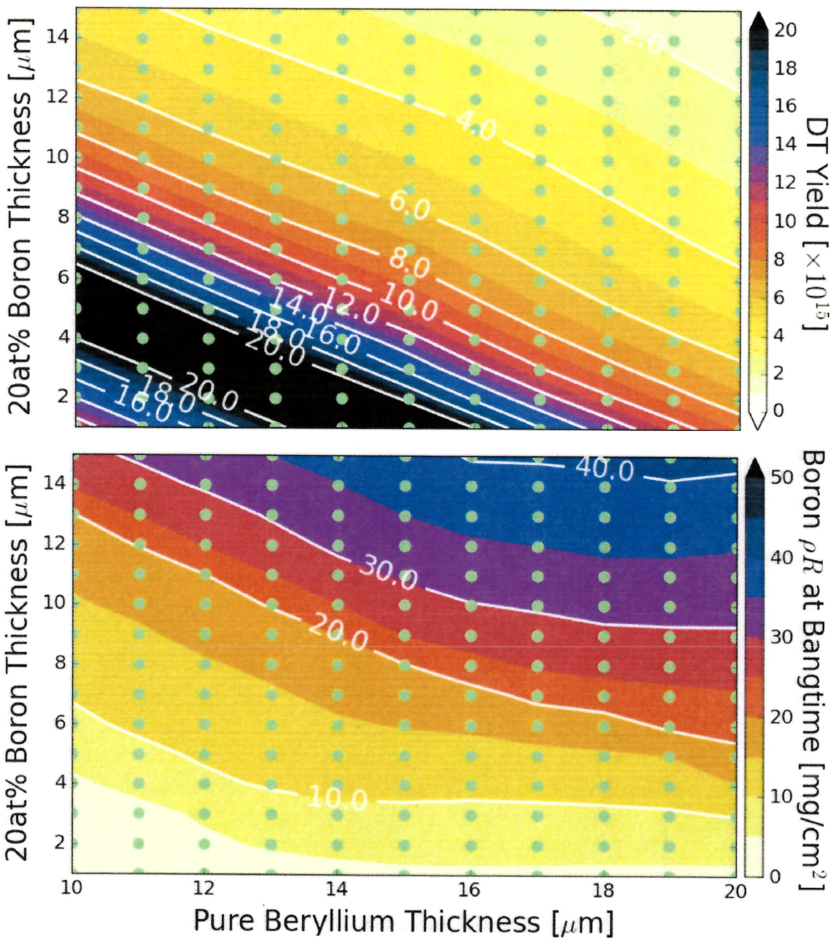
We varied the thicknesses of the outer pure beryllium ablator layer and the inner boron-doped layer, and the results of this parameter scan are shown in Fig. 2. The gas radius was fixed at , and the fill was 65/35 DT at in these calculations. Our goal was to maximize both the DT neutron yield and the boron at stagnation in order to provide targets for the particles produced during thermonuclear burn. In contrast to N190707, here the goal was to have a shell whose inner \isotope[10]B-doped portion would be mostly intact at stagnation, providing sufficient targets for the particles, while the outermost pure beryllium layer was ablated off. We find that the DT neutron yield is optimized in this design for thin ablators, on the order of total thickness, with a peak value just above DT neutrons. The yield is insensitive to the breakdown between pure beryllium and doped layer thickness.
The boron at stagnation is increased for thicker ablator layers. If the total ablator layer thickness is too small, the shell ends up burning through and very little boron remains near stagnation. Thicker layers increase the boron , as expected, but the total yield drops considerably due to the added ablator mass. Based on these studies, we opted for a capsule that had a thick boron-doped beryllium inner layer and a thick pure beryllium outer layer. The predicted 1D yield for such a target was DT neutrons with a boron of at stagnation.
II.2 Target fabrication
During the fabrication process of the target, we conducted three different coating runs to test the addition of \isotope[10]B dopant to a beryllium ablator. The first run resulted in a leak-tight capsule with good surface quality. However, the amount of boron introduced in the ablator was estimated to be much less than anticipated, of the order of . With the second run, the \isotope[10]B dopant level reached , but the target was not leak-tight. The third and final run produced a leak-tight capsule with an intermediate value of of \isotope[10]B dopant. However, the beryllium ablator did not shrink as much as expected during pyrolysis of the target mandrel, and the outer radius was much larger than originally designed.
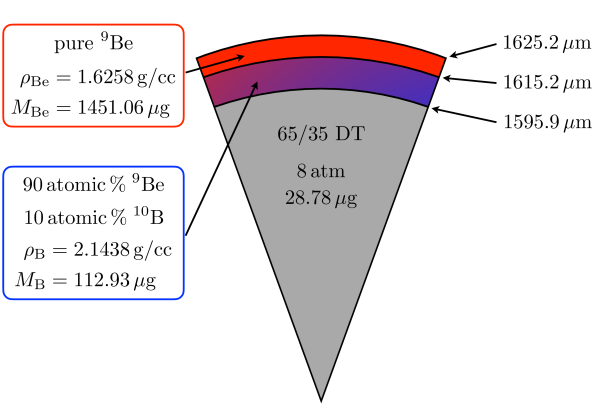
The resulting capsule had an inner radius of , and it was filled with DT at , for a total fuel mass of (Fig. 3). There is a thick boron-doped beryllium layer surrounded by a pure beryllium layer. With this configuration, the total mass of the boron dopant is , and the average density of the doped region of the ablator was estimated at . All subsequent computational results use these target dimensions.
III Post-shot modeling in 1D
Although the as-built target dimensions differed considerably from the “optimal” design that was determined in Sec. II.1, we proceeded with fielding the target as a proof-of-principle shot. Here, we present our initial 1D post-shot modeling using the as-built target dimensions, we introduce the radiochemistry post-processing framework, and we perform a sensitivity analysis to the dopant concentration levels.
III.1 xRAGE simulations
Our initial design studies neglected the small amount of argon in the ablator layers, but we now include it here by modifying the opacities for both the beryllium and boron materials. We also modified the isotopic concentrations to include the argon component, as isotopics are important for the 3T package which impacts the laser deposition. However, the equations of state were left unchanged in this study. Sensitivity to the \isotope[40]Ar concentration is discussed further in Sec. III.3.
As mentioned previously, modeling of the CH ablator shot N190707 found very good agreement with and a flux limiter of . However, our initial 1D post-shot modeling using the as-built target dimensions for our \isotope[9]Be/\isotope[10]B ablator shot found that we could get a better match to the observed bang time (see Table 1) using a higher laser power multiplier, , and the same flux limiter. This likely points to key differences in the ablation efficiencies of CH and Be. Similar behavior has been observed in HYDRA(Marinak et al., 2001) calculations, where a larger power multiplier is needed for Be ablators relative to CH ablators.Schmitt Note that this higher laser power multiplier will change the contours of boron and DT yield previously identified in Fig. 2. The additional laser power will result in more ablation of material, so initially thicker targets are needed to compensate for this effect. The yield and boron contours in Fig. 2 will both shift up and to the right. All the results presented in the next sections have been obtained using and in 1D xRAGE calculations.
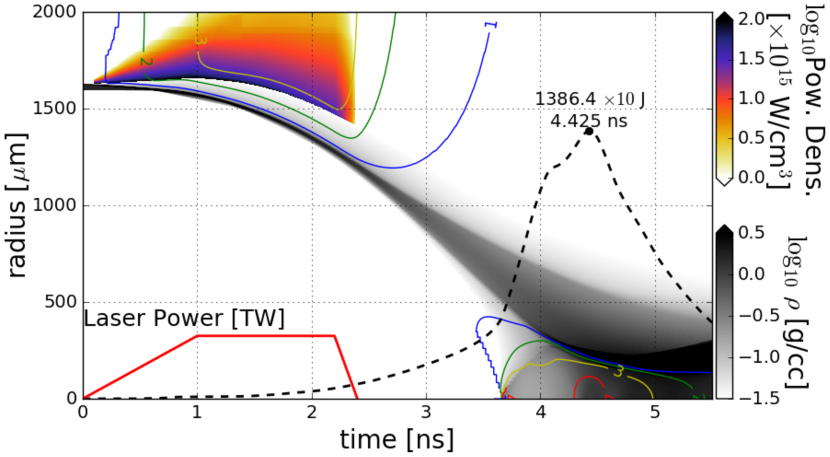
The dynamics of the implosion are best illustrated in the – contour plot from a 1D xRAGE simulation, shown in Fig. 4. The density contours are shown in grayscale and the laser power deposition is illustrated in the color contours. The laser drive lasts for the first of the implosion, ablating material off of the outer surface of the capsule and driving the remaining mass inwards. As the shell coasts inwards, its kinetic energy is converted into internal energy of the DT fuel, which is shown in the dashed black line of Fig. 4. The peak value of fuel internal energy occurs at , which nearly coincides with the capsule bang time. Given the fuel conditions as a function of time, we calculated the DT neutron production rate, resulting in a predicted total yield of DT neutrons and a burn width of (see also Fig. 7 and Table 2).
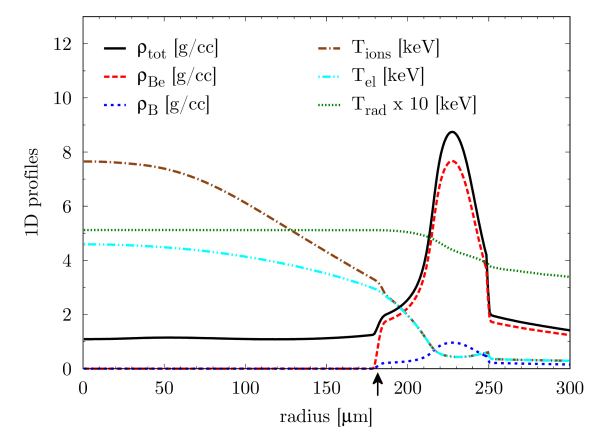
The corresponding bang time density and temperature profiles (assuming no hydrodynamical mix between the fuel and the ablator shell material) are shown in Fig. 5. At this time, the fuel-ablator interface is situated at , with a DT average density of and a peak ablator density of . The central ion and electron temperatures are and , respectively. The radiation temperature in the capsule is much smaller, only about .
III.2 RadChem analysis
We developed a charged-particle transport post-processor in order to study -induced reactions in the ablator material. Here, we describe the post-processor and apply it to our 1D post-shot simulation results. Given the generic reaction , the final number of nuclei is given by the integral over energy and time of the -particle flux , multiplied by the reaction cross section and the initial number of nuclei
| (1) |
where the energy integral is evaluated for -particle energies from to . In our study, and , respectively.
The time-dependent 1D xRAGE density and temperature profiles have been used to track the energy loss of particles produced in different regions of the fuel due to the stopping power in the target plasma (both within the DT fuel and the ablator materials). The stopping power is calculated according to ZimmermanZimmerman (1990) and includes contributions from free electrons and ions in the plasma. No bound electron contribution is considered, as the plasma is fully ionized at the temperatures considered here.
The implosion and nuclear burn conditions of N201115 from 1D xRAGE computations are such that all of the particles produced into the DT fuel are predicted to reach and cross the fuel-ablator interface. They all eventually stop within the ablator, where -induced reactions on \isotope[10]B and \isotope[9]Be can occur (no mix assumed). At bang time, particles get trapped within into the ablator that roughly corresponds to the position of the peak density of boron and beryllium (see Fig. 5).
We note that, as a result of the relatively large size of the fuel region, particles loose a non-negligible amount of energy before reaching the ablator ( on average at bang time). This greatly affects the yield of -induced reactions as the relevant cross sections are strongly energy dependent (see Fig. 1). The DT neutrons are in stark contrast to this, as they can travel almost unperturbed through the plasma (minimal energy loss), producing \isotope[41]Ar in the ablator via the reaction , that has a cross section of .Otuka et al. (2014)
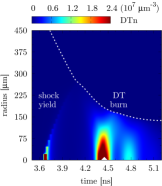
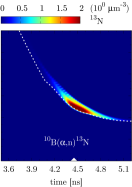
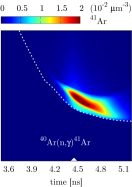
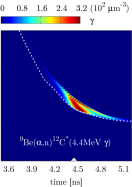
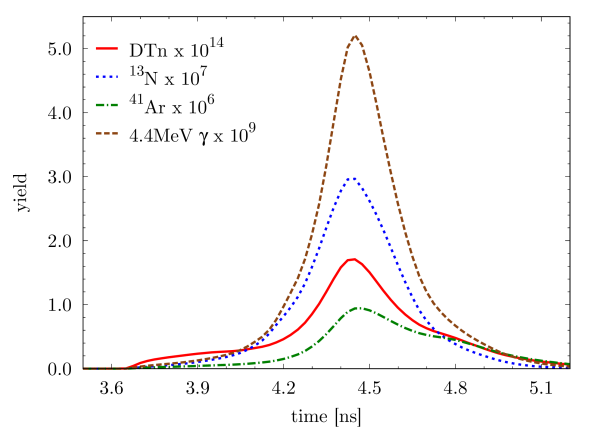
Figure 6 shows the contour plot for the predicted particle yields per unit volume achieved during the N201115 implosion: left to right for DT, \isotope[13]N, \isotope[41]Ar, and . Bang time is highlighted with a white upward triangle, and the position of the fuel-ablator interface is also displayed with a white dashed curve. The latter matches the contours for DT neutrons and -induced reactions as no hydrodynamical mix between the fuel and the ablator material has been considered in this run. The DT profile shows an early neutron production for . This corresponds to the shock yield and has minimal impact on -induced reactions in the ablator. During the following DT nuclear burn, the fuel region is compressed from to , with the peak neutron density production at bang time localized within from the center of the capsule. The -induced reactions on \isotope[10]B and \isotope[9]Be are confined in a narrow region close to the fuel-ablator interface, as the alpha particles quickly lose energy into the ablator material and eventually stop. The \isotope[41]Ar production covers instead a wider spatial region as the DT neutrons have minimal energy loss traveling through the plasma, and they can, thus, interact with the entire ablator layer before escaping the capsule. The time-dependent (position-integrated) yields are shown in Fig. 7. The DT shock yield is identifiable for earlier times . As already mentioned, this earlier signal does not significantly contribute to -induced reactions, as also visible in this figure.
A summary of the 1D xRAGE-RadChem analysis is reported in Table 2. The predicted DT yield is . The expected \isotope[13]N and \isotope[41]Ar signals are of the order of and , respectively. Both signals exceed the corresponding RAGS thresholds ( and ), and are, thus, measurable. The signal from the reaction is also expected to be above threshold , and, thus, theoretically measurable by the GRH detector.
The combination of these radiochemical signals, in particular their ratios, can be used to assess mixing. As pointed out in Ref. Colvin et al., 2008, in mix calculations of ICF capsules, ratios of thermonuclear yield and radiochemical signals are sensitive to mix. In particular, different reactions lead to different yield ratios when mix is involved, and this can be used to indirectly assess the level of mixing. - and -induced reactions are differently affected by mix, the former manifesting larger variations due to non-trivial changes in the stopping power in the fuel when mix occurs. The combined analysis of \isotope[13]N and \isotope[41]Ar signals is, thus, a valuable tool for mix diagnostic. The signal can potentially be used as a complementary diagnostic, as it is still largely affected by mix (-induced reactions), but the measurement is done with an independent detector. Preliminary 1D xRAGE calculations including BHR mixingBesnard, Haas, and Rauenzahn (1989), show, indeed, variations in the RadChem ratios for modest mixing scenarios, not commensurate with changes in the DT yield. A detailed discussion of RadChem mix diagnostic for boron/beryllium ablator capsules goes beyond the scope of this work as the current target was not designed for mix sensitivity, but rather to test our ability to measure the reaction. Modifying the current design to be more sensitive to mix is the subject of a future investigation.
| \isotope[10]B dopant level | |
|---|---|
| \isotope[40]Ar concentration | |
| Bang time | |
| Burn width | |
| DT yield | |
| \isotope[13]N yield | |
| \isotope[41]Ar yield | |
| yield |
III.3 Sensitivity study
The xRAGE-RadChem analysis presented so far refers to the capsule design illustrated in Fig. 3 that includes a \isotope[10]B dopant level and a \isotope[40]Ar concentration in the ablator. An accurate determination of the boron and argon concentrations in the manufactured N201115-001 capsule is, however, challenging. In order to assess the sensitivity of our simulations to variations in the boron and argon concentrations, we ran few extra scenarios.
We first changed the \isotope[10]B dopant level up to twice the design value (up to ). This does not significantly modify the implosion dynamics. Bang time remains unchanged, and ion, electron, and radiation temperatures are subject to minimal variations throughout the implosion. The total DT yield decreases by at most , implying a similar change to the \isotope[41]Ar signal. Changes to the nitrogen (gamma) yield are linearly proportional to the increased (decreased) concentration of boron (beryllium), as one might have naively expected. A uncertainty on the boron concentration will imply a uncertainty on the predicted -induced reaction yields, with almost no change to the other relevant physical quantities.
Changes in the argon concentration, instead, are less trivial and result in larger modifications of the implosion and burn properties (see Table 3). Adding argon results in the ablator becoming more diffuse during the coasting phase, likely an effect of the increased opacity. Essentially, the argon acts as a sink for photons, and the ablator heats up and expands during the coasting as a result of absorption of this “extra” energy. During the laser drive phase, the peak radiation temperature in the boron-dopant material is without any argon, while with \isotope[40]Ar the peak radiation temperature in the boron is . There is not a large effect on the inner surface trajectory, and the reported laser energy absorbed by the capsule is comparable in all cases. Increasing the \isotope[40]Ar concentration results in a lower peak ablator density at stagnation, owing to the more diffuse ablator. Increasing the argon percentage drops the DT yield considerably and results in larger burn widths. This has a considerable impact on -induced reactions, with \isotope[13]N and yields decreasing by roughly a factor of 4 moving from no argon to \isotope[40]Ar concentration.
From the above analysis, it is evident that argon is not a passive ride-along for direct-drive implosions. It results in reduced performance, owing to a more diffuse ablator during the coasting phase. However, it is possible that the detrimental effects of argon in the ablator might be mitigated somewhat by a shorter coast time, giving the ablator less time to decompress as a result of the absorbed radiation energy.
| \isotope[40]Ar conc. | ||||
|---|---|---|---|---|
| Bang time | ||||
| Burn width | ||||
| DT yield | ||||
| \isotope[13]N yield | ||||
| \isotope[41]Ar yield | ||||
IV Experimental results
The NIF shot N201115-001 produced an estimated DT neutrons, only of the predicted 1D yield, with significant shape asymmetry. The capsule bang time occurred at based on the SPIDER (GRH) measurement, and the burn duration (full-width-at-half-maximum) was according to the GRH analysis (see Table 1 for details).
| Legendre decomposition | |
|---|---|
| Polar view | Equatorial view |
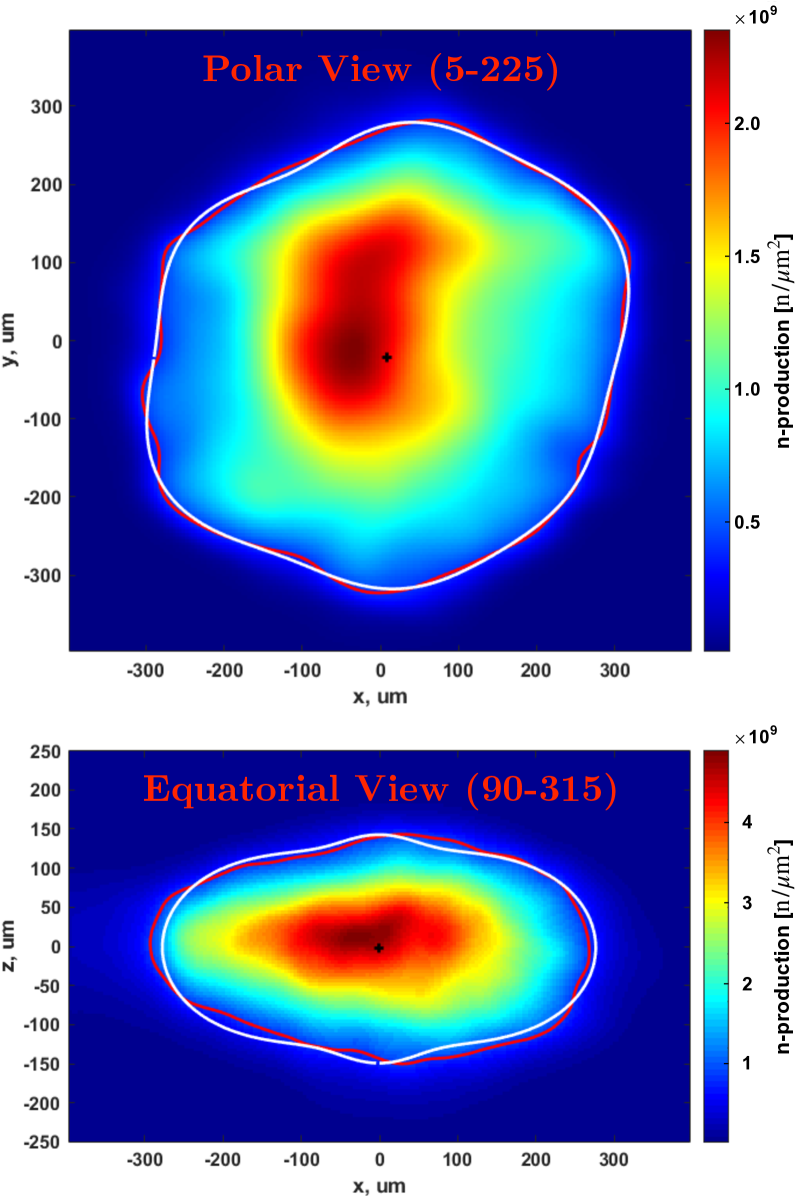
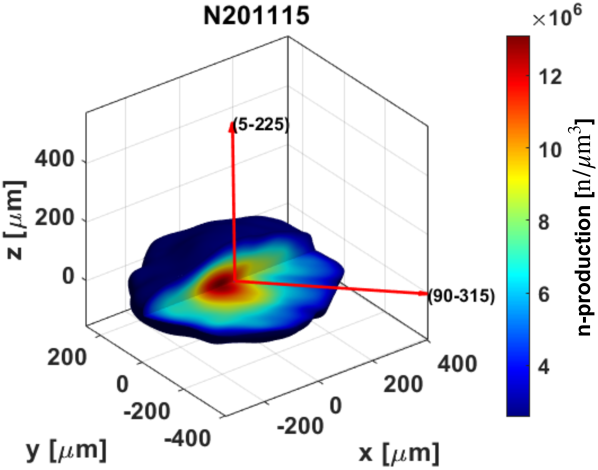
The neutron production region was very large, with a sizable Legendre mode asymmetry and modest azimuthal asymmetry. A 3D reconstruction of the neutron production region for this shot is shown in Fig. 8, produced from two independent lines-of-sight utilizing the procedure described in Ref. Volegov et al., 2021. The first line of sight views the capsule from near the northern pole of the target chamber at and , while the second line of sight views the capsule from the equator looking from and . The 2D images from each diagnostic port are also shown in Fig. 8.
The dominant Fourier component from a decomposition of the polar view is with , and there was also a significant azimuthal feature with . The azimuthal asymmetry is here attributed to the fact that two NIF quads (sets of four beams) had to be dropped for this shot. However, these dropped beams do not explain the significantly pancaked (oblate) implosion, which was found to have very large Legendre and components as extracted from the equatorial view. The average radius of the neutron production region was estimated to be quite large, , with and . These numbers are summarized in the inset table of Fig. 8. As will be demonstrated subsequently, this shape asymmetry can be reasonably reproduced in preliminary 2D xRAGE post-shot modeling.
IV.1 Radiochemical signatures
Both \isotope[13]N and \isotope[41]Ar were detected at RAGS. The \isotope[13]N is collected directly into the RAGS abort tank, bypassing the getters, and assayed by measuring its decay by positron emission. The RAGS collection efficiency of \isotope[13]N is not fully characterized at this time. The collection efficiency has been measured for those circumstances where \isotope[13]N is produced in a Hohlraum via the reaction, but this is not necessarily the same as the collection efficiency for direct drive shots because possible nitrogen molecular formation in the NIF chamber could depend on configuration geometry. Thus, although we saw a very clear \isotope[13]N signal at RAGS, we were only able to estimate the number of \isotope[13]N atoms produced at the time of capsule burn. The quoted uncertainty on the \isotope[13]N signal (see Table 1) is conservatively estimated at the level. This is derived from the estimated detector efficiencies based on previous measurements and the statistics on the decay signal.Cassata and Velsko The uncertainty stemming from the error in the \isotope[10]B concentration in the manufactured capsule cannot be estimated at this time, due to the difficulties in the accurate determination of the boron dopant level from General Atomics.
The collection scheme for \isotope[41]Ar at RAGS is described in Ref. Wilson et al., 2017, and it is assayed using a calibrated HPGe detector to measure the -rays emitted in beta-decay of \isotope[41]Ar. The analysis of the measured \isotope[41]Ar signal is more delicate compared to \isotope[13]N. One would need more than argon atoms to quantify the answer with a 12% uncertainty.Cassata and Velsko At and below the threshold, we can determine that the signal is \isotope[41]Ar from its half-life but cannot put an accurate figure (with a quotable uncertainty) on the number of atoms collected. Because of this and the uncertainty in the \isotope[40]Ar concentration in the manufactured capsule, inferring the areal density of the remaining ablator material at the time of the DT burn from the \isotope[41]Ar signal Wilson et al. (2017) would not be accurate, and it has not been attempted.
The measured signals for both \isotope[13]N and \isotope[41]Ar were considerably lower than expected based on the 1D pre-shot predictions, and at least part of this is ascribed to the reduced DT yield. Note that the 13N yield is lower than expected pre-shot calculations by more than the reduced DT yield. First, the exact amount of \isotope[10]B included in the doped ablator region was not able to be well characterized by General Atomics, so there is uncertainty in the initial amount present in the target (see Sec. III.3). Second, the asymmetric nature of the implosion plays a crucial role. The asymmetric distribution of the fuel and ablator materials strongly affects the particle transport in the plasma. The stopping power is subject to non-trivial changes that clearly reflect in the RadChem signals due to the strongly energy-dependent cross sections of the relevant reactions.
The signal from the GRH diagnostic was low and quite noisy, complicating the analysis. The threshold quoted in Table 1 is the required threshold for a measurement to make a detectable signal independent of the DT yield. For a nominal signal made up of both rays and the DT fusion rays, a ray contribution should produce a detectable change ( relative increase of the signal). Since the gain settings for the GRH detector were set for a higher signal than actually achieved, we effectively obtained a near null signal. However, we can still provide a conservative upper limit for the signal (see Table 1). If rays were actually released, we would have seen a clear physics signal. Since we did not, we can estimate that the number of rays was below that upper limit. Note that, because of the overall noisy signal, the GRH estimate of the burn width is affected by a relatively large uncertainty (Table 1). For cleaner data, the uncertainty is typically to .
IV.2 Post-shot modeling in 2D
In order to better understand the source of the shape asymmetry, we performed a preliminary 2D post-shot computation. The as-fired laser beam configuration, including the beam pointings and elliptical beam spots, was imported into xRAGE, allowing us to capture the polar aspects of the drive though the azimuthal variation was artificially symmetrized here. In our initial computation, we used the as-designed laser pulse with all beams at nominally the same power. Further, we did not drop the missing quads here, which would require 3D computations to fully capture; a 3D laser ray-trace capability is being developed for xRAGE, but it is not yet available. Further, the experiment used wavelength detuning on some of the beams in an attempt to mitigate CBET. While a CBET package is available in xRAGE, it increases the computational cost considerably, and so, this wavelength detuning is also neglected here. Finally, our initial 2D simulation neglected the argon dopant in the ablator material. All of these effects will be considered more fully in future simulations.
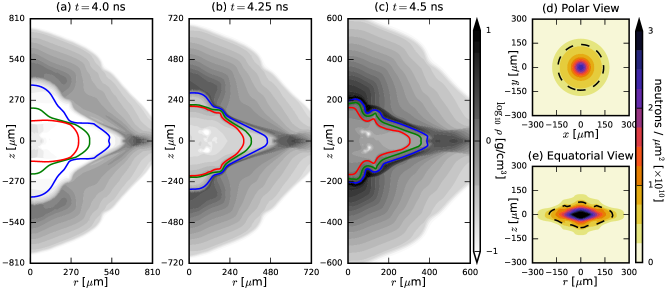
Results from this preliminary 2D simulation are shown in Fig. 9. Mass density contours are shown in Fig. 9(a)-9(c) in grayscale at several points leading up to stagnation, and ion temperature contours are also shown as colored lines: keV, keV, and keV. It is immediately clear that both the incoming unablated material and the central gas region are very oblate as a result of the polar laser drive configuration. The 2D simulation results were processed to estimate the neutron production rate as a function of time, and the total neutron production rate was integrated in time for all cells. Bang time for this simulation occurs at , which is close to the SPIDER result and consistent with the GRH estimate (see Table 1). The simulated DT neutron yield is , roughly 26% of the predicted 1D neutron yield, but only a factor of higher than the experimentally measured value. It is expected that the simulated yield will be further reduced when azimuthal asymmetries from the dropped quads and engineering defects, such as the capsule fill tube, are also incorporated into the simulation. These values are summarized in Table 4.
The total neutron production rate integrated in time for all cells was used as the source in computing line-integrated neutron emission data for pinholes placed at the pole and equator of the capsule, enabling more direct comparison to the experimentally reported neutron images. Synthetic neutron pinhole images are shown in Fig. 9(d) and 9(e) for a polar and equatorial view, respectively. The dashed black contours highlight 17% of the maximum value in each image. For the polar view, the 17% contour has a radius of , which is only about half of the reported radius of . Legendre analysis of the 17% contour in the equatorial view reveals that , , and . These values are also summarized in Table 4. Recall that the experimentally measured values were m, and .
Although our preliminary 2D xRAGE calculation indicates a smaller burning region compared to what can be inferred from the neutron images, the neutron production region has a distinct oblate shape which is qualitatively consistent with the experimental results. One possible explanation for the difference is the length of the burn width: the simulation burn width is compared to the experimental burn width of . The longer burn width in the experiment corresponds to neutrons being produced away from the time of peak convergence. Since these neutron images are time-integrated, this would result in the experimental neutron production region becoming larger in size, relative to simulation. Further, as noted previously, our 2D xRAGE calculation is also missing some elements that can affect both DT yield and implosion shape. In spite of this, however, our current results are encouraging, and we expect that the agreement with experimental results will be improved as our modeling fidelity increases.
| \isotope[10]B dopant level | |
|---|---|
| \isotope[40]Ar concentration | |
| Bang time | |
| Burn width | |
| DT yield | |
| Polar view | Equatorial view |
IV.3 Discussion
The significant asymmetry observed in both the experimental data for N201115 and the preliminary post-shot xRAGE simulations clearly demands a more sophisticated post-processing of the radiochemical signatures beyond the simple 1D model introduced previously. Work is ongoing to develop such a framework, but a detailed comparison of the observed radiochemical measurements to our simulation predictions is not available at this time. It is also expected that hydrodynamic instabilities, which lead to the mixing of the boron/beryllium ablator material into the DT fuel region, can alter the expected RadChem signals. Disentangling these effects is the subject of ongoing investigations.
One point worth mentioning is that, as noted previously, this capsule was quite a bit larger, outer radius, than the original design dimensions based on N190707-001, which was only outer radius. We did not attempt to alter the beam pointings to account for the larger radius capsule of N201115-001, so this likely accounts for at least some of the significant asymmetry observed here. However, it should be noted that N190707-001 also had a somewhat oblate neutron emission region(Yeamans et al., 2021), although the performance was considerably greater ( DT neutrons). The greater performance of N190707 is expected since our capsule had considerably more ablator mass by design in order to leave some \isotope[10]B near the fuel region. In order to get an estimate of how much the larger radius capsule changed the shape, we ran a preliminary 2D xRAGE simulation of N190707 using a lower laser power multiplier of to approximately match bang time for this CH ablator capsule. However, we still neglected CBET and the wavelength detuning in this first-pass analysis. We found that even the smaller radius of N190707 still produced a fairly oblate implosion in xRAGE. That is, even had the boron/beryllium ablator capsule been the correct radius, we would likely still have observed an oblate implosion with reduced performance. Clearly, additional work is needed to improve the drive conditions for these polar-drive targets.
V Conclusions
The goal of the current experiment was to test the feasibility of producing \isotope[13]N through the reaction in a PDXP at the NIF. This was motivated by the need to develop an alpha-particle-induced RadChem mix diagnostic for more complicated inertial confinement fusion capsule designs. We observed a very robust \isotope[13]N signal using the RAGS facility at NIF despite the fact that our PDXP yield was quite suppressed compared to 1D clean estimates. Our preliminary post-shot computations in xRAGE indicate that the oblate shape contributes to some of the reduced performance: the 2D “clean” yield is 26% of the 1D clean yield. However, this by itself does not explain all of the degradation since the 2D yield is still larger than the experimentally observed value. The significant asymmetry also complicates the interpretation of the radiochemical signals, and work is ongoing to extend the radiochemistry analysis to higher dimensions. Further optimization of the laser beam configuration for these targets is also under way. However, the observed \isotope[13]N signal strongly suggests that alpha-particle-induced radiochemistry, with its dependence on plasma stopping power, can provide a practical diagnostic for NIF capsule dynamics.
Acknowledgements.
We thank E. Kemp and Z. Walters for the design starting point, and J. L. Goodman and P. A. Bradley for insightful discussions. This work was supported by the U.S. Department of Energy through the Los Alamos National Laboratory. Los Alamos National Laboratory is operated by Triad National Security, LLC, for the National Nuclear Security Administration of U.S. Department of Energy (Contract No. 89233218CNA000001).Author declarations
Conflict of Interest
The authors have no conflicts to disclose.
Data availability
The data that support the findings of this study are available from the corresponding author upon reasonable request.
References
- Nuckolls et al. (1972) J. Nuckolls, L. Wood, A. Thiessen, and G. Zimmerman, “Laser Compression of Matter to Super-High Densities: Thermonuclear (CTR) Applications,” Nature 239, 139 (1972).
- Craxton et al. (2015) R. S. Craxton, K. S. Anderson, T. R. Boehly, V. N. Goncharov, D. R. Harding, J. P. Knauer, R. L. McCrory, P. W. McKenty, D. D. Meyerhofer, J. F. Myatt, A. J. Schmitt, J. D. Sethian, R. W. Short, S. Skupsky, W. Theobald, W. L. Kruer, K. Tanaka, R. Betti, T. J. B. Collins, J. A. Delettrez, S. X. Hu, J. A. Marozas, A. V. Maximov, D. T. Michel, P. B. Radha, S. P. Regan, T. C. Sangster, W. Seka, A. A. Solodov, J. M. Soures, C. Stoeckl, and J. D. Zuegel, “Direct-drive inertial confinement fusion: A review,” Phys. Plasmas 22, 110501 (2015).
- Lindl (1995) J. Lindl, “Development of the indirect-drive approach to inertial confinement fusion and the target physics basis for ignition and gain,” Phys. Plasmas 2, 3933–4024 (1995).
- Lord Rayleigh (1882) Lord Rayleigh, “Investigation of the character of the equilibrium of an incompressible heavy fluid of variable density,” Proc. London Math. Soc. s1-14, 170–177 (1882).
- Taylor (1950) G. I. Taylor, “The instability of liquid surfaces when accelerated in a direction perpendicular to their planes. i,” Proc. R. Soc. London, Ser. A 201, 192–196 (1950).
- Palaniyappan et al. (2020) S. Palaniyappan, J. P. Sauppe, B. J. Tobias, C. F. Kawaguchi, K. A. Flippo, A. B. Zylstra, O. L. Landen, D. Shvarts, E. Malka, S. H. Batha, P. A. Bradley, E. N. Loomis, N. N. Vazirani, L. Kot, D. W. Schmidt, T. H. Day, R. Gonzales, and J. L. Kline, “Hydro-scaling of direct-drive cylindrical implosions at the OMEGA and the National Ignition Facility,” Phys. Plasmas 27, 042708 (2020).
- Richtmyer (1960) R. D. Richtmyer, “Taylor instability in shock acceleration of compressible fluids,” Commun. Pure Appl. Math. 13, 297–319 (1960).
- Meshkov (1969) E. Meshkov, “Instability of the interface of two gases accelerated by a shock wave,” Fluid Dyn. 4, 101–104 (1969).
- Bose et al. (2015) A. Bose, K. M. Woo, R. Nora, and R. Betti, “Hydrodynamic scaling of the deceleration-phase Rayleigh–Taylor instability,” Phys. Plasmas 22, 072702 (2015).
- Clark et al. (2016) D. S. Clark, C. R. Weber, J. L. Milovich, J. D. Salmonson, A. L. Kritcher, S. W. Haan, B. A. Hammel, D. E. Hinkel, O. A. Hurricane, O. S. Jones, M. M. Marinak, P. K. Patel, H. F. Robey, S. M. Sepke, and M. J. Edwards, “Three-dimensional simulations of low foot and high foot implosion experiments on the National Ignition Facility,” Phys. Plasmas 23, 056302 (2016).
- Haines et al. (2017) B. M. Haines, C. H. Aldrich, J. M. Campbell, R. M. Rauenzahn, and C. A. Wingate, “High-resolution modeling of indirectly driven high-convergence layered inertial confinement fusion capsule implosions,” Phys. Plasmas 24, 052701 (2017).
- Weber et al. (2017) C. R. Weber, D. T. Casey, D. S. Clark, B. A. Hammel, A. MacPhee, J. Milovich, D. Martinez, H. F. Robey, V. A. Smalyuk, M. Stadermann, P. Amendt, S. Bhandarkar, B. Chang, C. Choate, J. Crippen, S. J. Felker, J. E. Field, S. W. Haan, S. Johnson, J. J. Kroll, O. L. Landen, M. Marinak, M. Mcinnis, A. Nikroo, N. Rice, and S. M. Sepke, “Improving ICF implosion performance with alternative capsule supports,” Phys. Plasmas 24, 056302 (2017).
- Clark et al. (2019) D. S. Clark, C. R. Weber, J. L. Milovich, A. E. Pak, D. T. Casey, B. A. Hammel, D. D. Ho, O. S. Jones, J. M. Koning, A. L. Kritcher, M. M. Marinak, L. P. Masse, D. H. Munro, M. V. Patel, P. K. Patel, H. F. Robey, C. R. Schroeder, S. M. Sepke, and M. J. Edwards, “Three-dimensional modeling and hydrodynamic scaling of National Ignition Facility implosions,” Phys. Plasmas 26, 050601 (2019).
- Haines et al. (2019) B. M. Haines, R. E. Olson, W. Sweet, S. A. Yi, A. B. Zylstra, P. A. Bradley, F. Elsner, H. Huang, R. Jimenez, J. L. Kline, C. Kong, G. A. Kyrala, R. J. Leeper, R. Paguio, S. Pajoom, R. R. Peterson, M. Ratledge, and N. Rice, “Robustness to hydrodynamic instabilities in indirectly driven layered capsule implosions,” Phys. Plasmas 26, 012707 (2019).
- Weber et al. (2020) C. R. Weber, D. S. Clark, A. Pak, N. Alfonso, B. Bachmann, L. F. Berzak Hopkins, T. Bunn, J. Crippen, L. Divol, T. Dittrich, A. L. Kritcher, O. L. Landen, S. Le Pape, A. G. MacPhee, E. Marley, L. P. Masse, J. L. Milovich, A. Nikroo, P. K. Patel, L. A. Pickworth, N. Rice, V. A. Smalyuk, and M. Stadermann, “Mixing in ICF implosions on the National Ignition Facility caused by the fill-tube,” Phys. Plasmas 27, 032703 (2020).
- Cheng et al. (2016) B. Cheng, T. J. T. Kwan, Y. M. Wang, S. A. Yi, S. H. Batha, and F. J. Wysocki, “Effects of preheat and mix on the fuel adiabat of an imploding capsule,” Phys. Plasmas 23, 120702 (2016).
- Cheng et al. (2018) B. Cheng, T. J. T. Kwan, Y. M. Wang, S. A. Yi, S. H. Batha, and F. Wysocki, “Ignition and pusher adiabat,” Plasma Phys. Control. Fusion 60, 074011 (2018).
- Ma et al. (2013) T. Ma, P. K. Patel, N. Izumi, P. T. Springer, M. H. Key, L. J. Atherton, L. R. Benedetti, D. K. Bradley, D. A. Callahan, P. M. Celliers, C. J. Cerjan, D. S. Clark, E. L. Dewald, S. N. Dixit, T. Döppner, D. H. Edgell, R. Epstein, S. Glenn, G. Grim, S. W. Haan, B. A. Hammel, D. Hicks, W. W. Hsing, O. S. Jones, S. F. Khan, J. D. Kilkenny, J. L. Kline, G. A. Kyrala, O. L. Landen, S. Le Pape, B. J. MacGowan, A. J. Mackinnon, A. G. MacPhee, N. B. Meezan, J. D. Moody, A. Pak, T. Parham, H.-S. Park, J. E. Ralph, S. P. Regan, B. A. Remington, H. F. Robey, J. S. Ross, B. K. Spears, V. Smalyuk, L. J. Suter, R. Tommasini, R. P. Town, S. V. Weber, J. D. Lindl, M. J. Edwards, S. H. Glenzer, and E. I. Moses, “Onset of Hydrodynamic Mix in High-Velocity, Highly Compressed Inertial Confinement Fusion Implosions,” Phys. Rev. Lett. 111, 085004 (2013).
- Döppner et al. (2020) T. Döppner, D. E. Hinkel, L. C. Jarrott, L. Masse, J. E. Ralph, L. R. Benedetti, B. Bachmann, P. M. Celliers, D. T. Casey, L. Divol, J. E. Field, C. Goyon, R. Hatarik, M. Hohenberger, N. Izumi, S. F. Khan, A. L. Kritcher, T. Ma, B. J. MacGowan, M. Millot, J. Milovich, S. Nagel, A. Pak, J. Park, P. Patel, R. Tommasini, P. Volegov, C. Weber, O. L. Landen, D. A. Callahan, O. A. Hurricane, and M. J. Edwards, “Achieving 280 Gbar hot spot pressure in DT-layered CH capsule implosions at the National Ignition Facility,” Phys. Plasmas 27, 042701 (2020).
- Edwards et al. (2013) M. J. Edwards, P. K. Patel, J. D. Lindl, L. J. Atherton, S. H. Glenzer, S. W. Haan, J. D. Kilkenny, O. L. Landen, E. I. Moses, A. Nikroo, R. Petrasso, T. C. Sangster, P. T. Springer, S. Batha, R. Benedetti, L. Bernstein, R. Betti, D. L. Bleuel, T. R. Boehly, D. K. Bradley, J. A. Caggiano, D. A. Callahan, P. M. Celliers, C. J. Cerjan, K. C. Chen, D. S. Clark, G. W. Collins, E. L. Dewald, L. Divol, S. Dixit, T. Doeppner, D. H. Edgell, J. E. Fair, M. Farrell, R. J. Fortner, J. Frenje, M. G. Gatu Johnson, E. Giraldez, V. Y. Glebov, G. Grim, B. A. Hammel, A. V. Hamza, D. R. Harding, S. P. Hatchett, N. Hein, H. W. Herrmann, D. Hicks, D. E. Hinkel, M. Hoppe, W. W. Hsing, N. Izumi, B. Jacoby, O. S. Jones, D. Kalantar, R. Kauffman, J. L. Kline, J. P. Knauer, J. A. Koch, B. J. Kozioziemski, G. Kyrala, K. N. LaFortune, S. L. Pape, R. J. Leeper, R. Lerche, T. Ma, B. J. MacGowan, A. J. MacKinnon, A. Macphee, E. R. Mapoles, M. M. Marinak, M. Mauldin, P. W. McKenty, M. Meezan, P. A. Michel, J. Milovich, J. D. Moody, M. Moran, D. H. Munro, C. L. Olson, K. Opachich, A. E. Pak, T. Parham, H.-S. Park, J. E. Ralph, S. P. Regan, B. Remington, H. Rinderknecht, H. F. Robey, M. Rosen, S. Ross, J. D. Salmonson, J. Sater, D. H. Schneider, F. H. Séguin, S. M. Sepke, D. A. Shaughnessy, V. A. Smalyuk, B. K. Spears, C. Stoeckl, W. Stoeffl, L. Suter, C. A. Thomas, R. Tommasini, R. P. Town, S. V. Weber, P. J. Wegner, K. Widman, M. Wilke, D. C. Wilson, C. B. Yeamans, and A. Zylstra, “Progress towards ignition on the National Ignition Facility,” Phys. Plasmas 20, 070501 (2013).
- Montgomery et al. (2018) D. S. Montgomery, W. S. Daughton, B. J. Albright, A. N. Simakov, D. C. Wilson, E. S. Dodd, R. C. Kirkpatrick, R. G. Watt, M. A. Gunderson, E. N. Loomis, E. C. Merritt, T. Cardenas, P. Amendt, J. L. Milovich, H. F. Robey, R. E. Tipton, and M. D. Rosen, “Design considerations for indirectly driven double shell capsules,” Phys. Plasmas 25, 092706 (2018).
- Dewald et al. (2019) E. L. Dewald, J. E. Pino, R. E. Tipton, J. D. Salmonson, J. Ralph, E. Hartouni, S. F. Khan, R. Hatarik, C. V. Young, D. Thorn, V. A. Smalyuk, R. Sacks, A. Nikroo, N. Rice, S. A. MacLaren, S. Prisbrey, B. A. Remington, and F. Graziani, “Pushered single shell implosions for mix and radiation trapping studies using high-Z layers on National Ignition Facility,” Physics of Plasmas 26, 072705 (2019).
- Colvin et al. (2008) J. Colvin, C. Cerjan, R. Hoffman, M. Stoyer, and P. Amendt, “Radiochemical tracers as a mix diagnostic for the ignition double-shell capsule,” Phys. Plasmas 15, 102704 (2008).
- Shaughnessy et al. (2012) D. A. Shaughnessy, C. A. Velsko, D. R. Jedlovec, C. B. Yeamans, K. J. Moody, E. Tereshatov, W. Stoeffl, and A. Riddle, “The Radiochemical Analysis of Gaseous Samples (RAGS) apparatus for nuclear diagnostics at the National Ignition Facility (invited),” Rev. Sci. Instrum. 83, 10D917 (2012).
- Liu et al. (2019) Q. Liu, M. Febbraro, R. J. deBoer, A. Boeltzig, Y. Chen, C. Cerjan, M. Couder, B. Frentz, J. Görres, E. A. Henry, E. Lamere, K. T. Macon, K. V. Manukyan, L. Morales, P. D. O’Malley, S. D. Pain, W. A. Peters, D. Schneider, C. Seymour, G. Seymour, E. Temanson, R. Toomey, B. Vande Kolk, J. Weaver, and M. Wiescher, “Measurement of the cross section for and its application as a diagnostic at the National Ignition Facility,” Phys. Rev. C 100, 034601 (2019).
- Wilson et al. (2017) D. C. Wilson, W. Cassata, S. Sepke, C. Velsko, H. Huang, C. Yeamans, J. L. Kline, A. Yi, A. N. Simakov, S. Haan, et al., “Use of 41ar production to measure ablator areal density in nif beryllium implosions,” Phys. Plasmas 24, 022701 (2017).
- Herrmann et al. (2010) H. W. Herrmann, N. Hoffman, D. C. Wilson, W. Stoeffl, L. Dauffy, Y. H. Kim, A. McEvoy, C. S. Young, J. M. Mack, C. J. Horsfield, M. Rubery, E. K. Miller, and Z. A. Ali, “Diagnosing inertial confinement fusion gamma ray physics (invited),” Rev. Sci. Instrum. 81, 10D333 (2010).
- Meaney et al. (2021) K. D. Meaney, N. M. Hoffman, Y. Kim, H. Geppert-Kleinrath, H. W. Herrmann, C. Cerjan, O. Landen, and B. Appelbe, “Time resolved ablator areal density during peak fusion burn on inertial confinement fusion implosions,” Phys. Plasmas 28, 032701 (2021).
- Otuka et al. (2014) N. Otuka, E. Dupont, V. Semkova, B. Pritychenko, A. Blokhin, M. Aikawa, S. Babykina, M. Bossant, G. Chen, S. Dunaeva, R. Forrest, T. Fukahori, N. Furutachi, S. Ganesan, Z. Ge, O. Gritzay, M. Herman, S. Hlavač, K. Katō, B. Lalremruata, Y. Lee, A. Makinaga, K. Matsumoto, M. Mikhaylyukova, G. Pikulina, V. Pronyaev, A. Saxena, O. Schwerer, S. Simakov, N. Soppera, R. Suzuki, S. Takács, X. Tao, S. Taova, F. Tárkányi, V. Varlamov, J. Wang, S. Yang, V. Zerkin, and Y. Zhuang, “Towards a More Complete and Accurate Experimental Nuclear Reaction Data Library (EXFOR): International Collaboration Between Nuclear Reaction Data Centres (NRDC),” Nuclear Data Sheets 120, 272–276 (2014).
- Khan et al. (2012) S. F. Khan, P. M. Bell, D. K. Bradley, S. R. Burns, J. R. Celeste, L. S. Dauffy, M. J. Eckart, M. A. Gerhard, C. Hagmann, D. I. Headley, J. P. Holder, N. Izumi, M. C. Jones, J. W. Kellogg, H. Y. Khater, J. R. Kimbrough, A. G. Macphee, Y. P. Opachich, N. E. Palmer, R. B. Petre, J. L. Porter, R. T. Shelton, T. L. Thomas, and J. B. Worden, “Measuring x-ray burn history with the Streaked Polar Instrumentation for Diagnosing Energetic Radiation (SPIDER) at the National Ignition Facility (NIF),” in Target Diagnostics Physics and Engineering for Inertial Confinement Fusion, Vol. 8505, edited by P. Bell and G. P. Grim, International Society for Optics and Photonics (SPIE, 2012) pp. 33 – 40.
- Yeamans and Bleuel (2017) C. B. Yeamans and D. L. Bleuel, “The Spatially Distributed Neutron Activation Diagnostic FNADs at the National Ignition Facility,” Fusion Science and Technology 72, 120–128 (2017).
- Ellison et al. (2018) C. L. Ellison, H. D. Whitley, C. R. D. Brown, S. R. Copeland, W. J. Garbett, H. P. Le, M. B. Schneider, Z. B. Walters, H. Chen, J. I. Castor, R. S. Craxton, M. Gatu Johnson, E. M. Garcia, F. R. Graziani, G. E. Kemp, C. M. Krauland, P. W. McKenty, B. Lahmann, J. E. Pino, M. S. Rubery, H. A. Scott, R. Shepherd, and H. Sio, “Development and modeling of a polar-direct-drive exploding pusher platform at the National Ignition Facility,” Phys. Plasmas 25, 072710 (2018).
- Yeamans et al. (2021) C. Yeamans, G. Kemp, Z. Walters, H. Whitley, P. McKenty, E. Garcia, Y. Yang, R. Craxton, and B. Blue, “High yield polar direct drive fusion neutron sources at the National Ignition Facility,” Nuclear Fusion 61, 046031 (2021).
- Ajzenberg-Selove (1991) F. Ajzenberg-Selove, “Energy levels of light nuclei A=13–15,” Nucl. Phys. A 523, 1–196 (1991).
- Nesaraja and Mccutchan (2016) C. D. Nesaraja and E. A. Mccutchan, “ENSDF Full Evaluation,” NDS 133, 1 (2016).
- Gittings et al. (2008) M. Gittings, R. Weaver, M. Clover, T. Betlach, N. Byrne, R. Coker, E. Dendy, R. Hueckstaedt, K. New, W. R. Oakes, D. Ranta, and R. Stefan, “The RAGE radiation-hydrodynamic code,” Comput. Sci. Discovery 1, 015005 (2008).
- Marozas et al. (2018) J. A. Marozas, M. Hohenberger, M. J. Rosenberg, D. Turnbull, T. J. B. Collins, P. B. Radha, P. W. McKenty, J. D. Zuegel, F. J. Marshall, S. P. Regan, T. C. Sangster, W. Seka, E. M. Campbell, V. N. Goncharov, M. W. Bowers, J.-M. G. Di Nicola, G. Erbert, B. J. MacGowan, L. J. Pelz, J. Moody, and S. T. Yang, “Wavelength-detuning cross-beam energy transfer mitigation scheme for direct drive: Modeling and evidence from National Ignition Facility implosions,” Phys. Plasmas 25, 056314 (2018).
- Haines et al. (2020) B. Haines, D. Keller, J. Marozas, P. McKenty, K. Anderson, T. Collins, W. Dai, M. Hall, S. Jones, M. McKay Jr, R. Rauenzahn, and D. Woods, “Coupling laser physics to radiation-hydrodynamics,” Computers & Fluids 201, 104478 (2020).
- Meezan et al. (2020) N. Meezan, D. Woods, N. Izumi, H. Chen, H. Scott, M. Schneider, D. Liedahl, O. Jones, G. Zimmerman, J. Moody, et al., “Evidence of restricted heat transport in national ignition facility hohlraums,” Phys. Plasmas 27, 102704 (2020).
- Farmer et al. (2020) W. Farmer, C. Bruulsema, G. Swadling, M. Sherlock, M. Rosen, W. Rozmus, D. Edgell, J. Katz, B. Pollock, and J. Ross, “Validation of heat transport modeling using directly driven beryllium spheres,” Phys. Plasmas 27, 082701 (2020).
- Farmer et al. (2021) W. Farmer, M. Rosen, G. Swadling, C. Bruulsema, C. Harris, W. Rozmus, M. Schneider, M. Sherlock, D. Edgell, J. Katz, et al., “Investigation of heat transport using directly driven gold spheres,” Phys. Plasmas 28, 032707 (2021).
- Young and Corey (1995) D. A. Young and E. M. Corey, “A new global equation of state model for hot, dense matter,” Journal of Applied Physics 78, 3748–3755 (1995).
- Colgan et al. (2016) J. Colgan, D. P. Kilcrease, N. Magee, M. E. Sherrill, J. Abdallah Jr, P. Hakel, C. J. Fontes, J. A. Guzik, and K. Mussack, “A new generation of Los Alamos opacity tables,” ApJ 817, 116 (2016).
- Abdallah Jr and Clark (1985) J. Abdallah Jr and R. E. Clark, “Tops: A multigroup opacity code,” Tech. Rep. (Los Alamos National Lab., NM (USA), 1985).
- Marinak et al. (2001) M. M. Marinak, G. Kerbel, N. Gentile, O. Jones, D. Munro, S. Pollaine, T. Dittrich, and S. Haan, “Three-dimensional HYDRA simulations of national ignition facility targets,” Phys. Plasmas 8, 2275–2280 (2001).
- (46) M. J. Schmitt, private communication (2021).
- Zimmerman (1990) G. B. Zimmerman, “Recent Developments in Monte Carlo Techniques,” (1990), UCRL-JC-1056016.
- Besnard, Haas, and Rauenzahn (1989) D. Besnard, J. Haas, and R. Rauenzahn, “Statistical modeling of shock-interface interaction,” Physica D: Nonlinear Phenomena 37, 227–247 (1989).
- Volegov et al. (2021) P. Volegov, S. Batha, D. Fittinghoff, C. Danly, V. Geppert-Kleinrath, C. Wilde, and A. Zylstra, “Three-dimensional reconstruction of neutron, gamma-ray, and x-ray sources using a cylindrical-harmonics expansion,” Rev. Sci. Instrum. 92, 033508 (2021).
- (50) B. Cassata and C. Velsko, private communication (2021).