Free-energy landscapes of DNA and its assemblies: Perspectives from coarse-grained modelling
Abstract
This chapter will provide an overview of how characterizing free-energy landscapes can provide insights into the biophysical properties of DNA, as well as into the behaviour of the DNA assemblies used in the field of DNA nanotechnology. The landscapes for these complex systems are accessible through the use of accurate coarse-grained descriptions of DNA. Particular foci will be the landscapes associated with DNA self-assembly and mechanical deformation, where the latter can arise from either externally imposed forces or internal stresses.
keywords:
DNA , free-energy landscapes , coarse-graining1 Introduction
Free-energy landscapes depict the free energy of a system as a function of a limited number of coordinates (often termed order parameters or reaction coordinates). These landscapes can provide a simplified representation of the main features of configuration space, for example, the (meta)stable states of the system, the pathways between these states in this reduced order-parameter space and the size of the associated free-energy barriers.
These landscapes provide a much more coarse-grained view of a system than a potential-energy surface (PES). For example, the number of potential energy wells that contribute to a particular point on the free-energy landscape may be enormous, particularly for large systems and those where some of the states involve structural disorder. As such the free-energy landscapes naturally capture the effects of entropy and, unlike a PES, free-energy landscapes are specific to the temperature of interest. As the projection of the system’s configurations onto a limited number of order parameters inevitably leads to a loss of information, the choice of these order parameters is particularly important if the free-energy landscapes are to provide a useful representation of the system; some of the problems associated with bad choices are well documented [1]. Even with a good choice, however, the properties of the landscapes are still intrinsically order-parameter dependent.
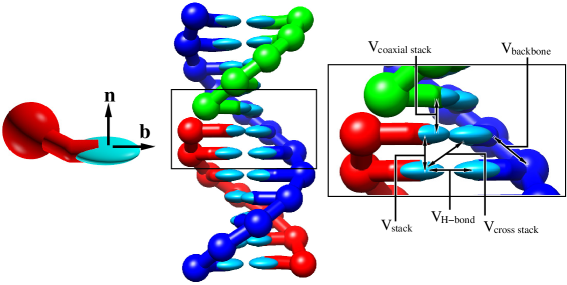
Here, we will illustrate the utility of analysing systems in terms of their free-energy landscapes for a series of systems made out of DNA. As the systems of interest would often involve an extremely large number of atoms if all were explicitly represented, we instead represent the DNA using a coarse-grained model of DNA at the nucleotide level, thus allowing us to access much larger systems and much longer time scales. Specifically, we use the oxDNA model [2, 3, 4], which models the DNA as a set of rigid nucleotides with a set of interactions representing the bonding along the backbone, Watson-Crick base-pairing, stacking, coaxial stacking, cross-stacking, and electrostatics, as illustrated in Fig. 1. One of the dangers of coarse-graining is that the removed degrees of freedom are in some way coupled to the process of interest and cannot simply be “integrated out”. In the case of oxDNA, it is probably reasonable to assume that the intramolecular degrees of freedom of the nucleotide do not change significantly in most of the processes in which we are interested, but the potential effects of only including the solvent degrees of freedom implicitly are somewhat less clear.
In the development of the oxDNA model a particular focus was on the accurate representation of the thermodynamics of hybridization and a good description of single-stranded DNA and double-stranded DNA mechanics (i.e. the thermodynamic cost of structural deformations). This makes the model particularly well-suited for the computation of free-energy landscapes associated with the biophysical properties of DNA and for systems of interest to DNA nanotechnology. Although certain features of these landscapes are relatively straightforward to predict from simpler models (e.g. the Santa Lucia model for hybridization free energies [5] and the worm-like chain model for DNA mechanics [6]), the oxDNA model naturally captures the interplay of configurational entropy (particularly of single-stranded sections), geometric effects resulting from the double-helical structure of double-stranded DNA and DNA mechanics that go into determining the size of free-energy barriers for intramolecular processes, and which would be otherwise hard to estimate accurately.
We should note that the oxDNA model has a number of variants. In particular a second version of the model (sometimes called oxDNA2) was developed that introduced explicit electrostatic interactions and fine-tuned structural parameters to enable the structure of large DNA nanostructures, such as DNA origami, to be accurately described [4, 7]. Although this second model is now generally the version of choice, the predictions of the two models will be very similar for many systems, and the results reported here will be for both models. In addition, one has the option to use a sequence-averaged or sequence-dependent [3] parameterization, where in the former the strength of the interactions are independent of the identity of the nucleotides involved. Most of the results reported here are for the sequence-averaged parameterization, as it allows the generic properties of systems to be elucidated, whereas the sequence-dependent parameterization tends to be reserved for detailed comparisons to specific experimental systems.
2 Computing free-energy landscapes
Free-energy landscapes are simply related to equilibrium probability distributions through
| (1) |
where is a set of order parameters that are being used to characterize the system and is an arbitary constant. To facilitate visualization of the free-energy landscape often only one or two order parameters are used.
The major difficulty in computing such free-energy landscapes is that one is often interested in high free-energy regions of the landscape — say because one is interested in the size of the free-energy barrier for a process — which have a very low probability and so will be poorly sampled in standard simulations. To overcome this problem, there is now a large array of rare-event and enhanced sampling simulation methods that allow free-energy landscapes or the rates of slow processes on such landscapes to be computed [8, 9, 10, 11]. In our work on the free-energy landscapes of DNA systems, we have almost exclusively used one of the simplest and earliest of such methods, namely umbrella sampling [8, 12]. This involves adding an additional biasing potential to the potential energy in order to improve the sampling of the higher free-energy regions of the landscape. From the probability distribution in a biased simulation it is a simple matter to estimate the same distribution for the unbiased system.
There can be different ways to implement umbrella sampling. One limit is to choose the biasing potential so that all regions of the landscape can be well sampled. This has the potential disadvantage that the simulation has to be sufficiently long that the system is able to diffuse back and forth across the whole order parameter space a sufficient number of times for the relative free energies of different parts of the landscape to be correctly estimated. A second issue is generating the biasing potential. Ideally, one would want to be flat, but to achieve this would require , i.e. one would need to know the quantity that one is seeking to calculate. One typically gets around this problem by running a series of simulations in which the biasing potential is iteratively improved until sampling is sufficiently uniform.
The other limit is to run many separate simulations with different biasing potentials, the aim being that each characterizes a different region of the landscape. One simple way to achieve this is to use harmonic biasing potentials whose minima form a grid in the order-parameter space. A best estimate of the whole free-energy landscape can then be constructed from the set of biased probability distributions using the weighted-histogram analysis method (WHAM) [13]. For this to be accurate it is important that there is sufficient overlap between the probability distributions for adjacent points on the order-parameter grid.
This approach has a number of potential advantages. Firstly, it is potentially much more efficient, simply because the simulation time required to diffuse over an order parameter window is expected to be proportional to . Thus, this analysis would predict for one-dimensional umbrella sampling that the total time required to accurately sample the landscape when using windows is a factor of shorter compared to a simulation with one window [14]. Secondly, this approach naturally lends itself to trivial parallelization through task farming.
However, the major disadvantage is that it can be much easier for problems with the sampling to go unnoticed. In particular, it is often the case that even when the system is at the top of a free-energy barrier transitioning between states that are representative of the two basins that meet at that point may still be an activated process and hence slow. A good estimate of the relative free-energy of the two basins can only be obtained if for the windows in the transition region the systems transits back and forth between states associated with the two basins sufficiently frequently.
Typically, we use an intermediate approach with a limited number of overlapping windows; those that cover a transition region often need to be run for significantly longer.
3 Example free-energy landscapes
3.1 Hybridization
Hybridization, the association of two strands to form a double helix, represents the most fundamental process of DNA self-assembly. Consequently, this process has been well characterized experimentally with the thermodynamics well understood [5, 15] but with open questions still remaining concerning the hybridization kinetics [16, 17].
The most basic measure of the degree of assembly is the number of base pairs formed. The free-energy profile as a function of this order parameter is shown in Fig. 2(a). The main features of this landscape are (i) the barrier associated with the formation of the first base pair due to the loss of translational entropy, (ii) the roughly linear down hill slope as the duplex zips up and (iii) deviations from linearity for the final base pairs due to the propensity of the end base pairs to “fray”.
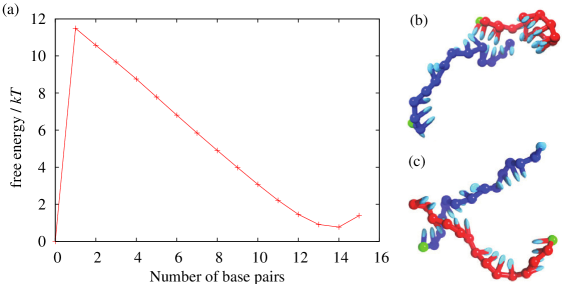
Variants of this basic landscape, often as components of a larger landscape, will be seen a number of times in this review. However, it is important to be aware of a number of additional complexities. Firstly, when picking a reaction coordinate to compute a free-energy profile one usually wants to choose the slowest degree of freedom in the system. If that is the case, motions orthogonal to that coordinate would be expected to be in equilibrium as one dynamically progresses along the reaction coordinate. In the case of hybridization, though, structural rearrangement of the unhybridized sections of the chain is another slow coordinate, leading to dynamical effects not expected from the landscape. For example, even though a state with one base pair is the free-energy transition state on assembly, two to three base pairs must form before the probability of hybridization exceeds 50%. This is because when one base pair is formed the rearrangements of the chain required to form the next base pair are slow (Fig. 2(b)), with breaking of the base pair occurring at a faster rate. Similarly, on melting, states with one base pair are more likely to zip up than dissociate because the chains still adopt conformations that allow base pairing to occur relatively easily.
Secondly, the implicit description of the solvent in coarse-grained models such as oxDNA may neglect important degrees of freedom for the hybridization process. For example, the oxDNA barrier to hybridization is purely entropic and the oxDNA transition state is enthalpically stabilized with respect to the single-stranded reactants because of the base pair(s) formed at the transition state. Hence, the oxDNA hybridization rate decreases with temperature because of this negative activation energy [16]. However, in reality, hybridization rates generally increase with temperature [18]. Thus, there must be an enthalpic barrier to hybridization that is not captured by oxDNA. The most likely source is the water degrees of freedom, for example, desolvating the bases and the resulting rearrangements of the hydrogen-bond network.
What have we learnt from this free-energy landscape? Not that much in some ways. The loss of translational entropy that is the dominant contributor to the free energy barrier can be easily estimated from standard statistical mechanics and, as the oxDNA model has been parameterized to the predictions of the SantaLucia model, the free-energy of binding should be very similar to that model. The most non-trivial feature is perhaps the change in slope due to fraying; this has not been “put into” oxDNA, but emerges naturally from its relatively realistic description of the basic physical properties of the nucleotides.
3.2 Hairpin formation
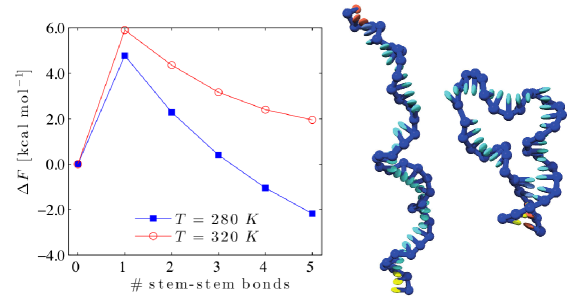
The next example that we consider is the formation of a hairpin. The free-energy profile as a function of the number of stem base pairs formed is shown in Fig. 3 at two temperatures. Its form is very similar to that for hybridization, but for this unimolecular process the barrier is instead a result of the loss in configurational entropy on forming the hairpin loop. One of the particular strengths of the oxDNA model is its ability to capture such features, particularly as describing single-stranded DNA accurately using polymer models is not so straightforward. This enables the model to reproduce hairpin melting temperatures accurately, albeit noting that the reproduction of such data was considered in the model parameterization.
3.3 Kissing hairpins
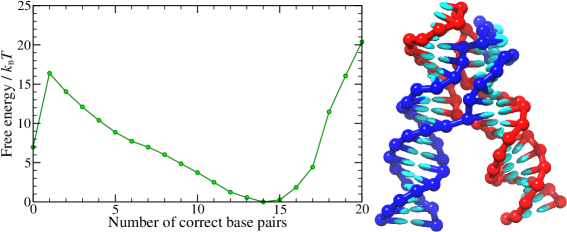
The formation of the DNA double helix requires the wrapping of each strand around each other in a right-handed fashion. In some instances, this wrapping may not be topologically feasible. Fig. 4 illustrates one such example, namely the hybridization of two fully complementary hairpin loops (such a structure is termed a kissing loop). As the loops are longer than the DNA pitch length and there are no free ends, the two loops cannot fully wrap around each other without defects associated with the the opposite wrapping. The topological and geometric frustration in this system is evident from the free-energy profile. Although the formation of the first few base pairs is relatively unhindered, the graph shows increasing curvature as more base pairs are formed, and the lowest free-energy state has only 14 of the 20 possible base pairs formed.
Somewhat similar topological impediments to assembly may well be relevant to DNA origamis. For example, if both the end domains of a staple strand bind first to the scaffold strand, then any remaining unbound middle domains no longer have a free end to facilitate wrapping and so correct binding of that domain may no longer be topological feasible without dissociation of one of the end domains.
3.4 Force-induced melting
The hairpin free-energy profiles in Fig. 3 illustrate the destabilization of the assembled state by temperature. Another mechanism of destabilization is by the application of stress to the DNA systems. Fig. 5(a) illustrates the destabilization of a DNA duplex under the action of tensile force applied in a ‘shearing’ mode (the forces are applied at opposite ends of the duplex on different strands). As the force increases, the duplex becomes increasingly destabilized because there is now an additional contribution to the free energy of breaking a base pair, where is the extension gained in the direction of the force from breaking a base pair. Beyond 10 base pairs (approximately the pitch of DNA) the effect of the force is mainly just to change the slope of the profile, but below this value of the reaction coordinate the profile develops greater structure. In this limit, the orientation of the intact double-helical section varies with the number of remaining base pairs (as illustrated by the configurations in Fig. 5(b)) and hence so does the extension gained when a base-pair breaks.
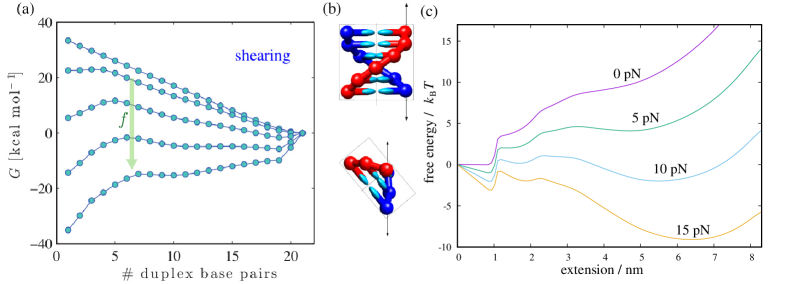
Of course, the number of base pairs is not the only reaction co-ordinate that one can potentially use. In the case of force-induced transitions, the free-energy profile as a function of the extension provides a representation that one can more directly relate to experiments using optical tweezers [22]. Such landscapes are illustrated in Fig. 5(c) for a hairpin with a 6-bp stem where tensile forces are applied to both end nucleotides. The free-energy minimum at 1 nm corresponds to the oriented closed state (1 nm is the separation of the oxDNA nucleotide centres in a base pair), whereas the minimum at 5-7 nm that appears at higher forces corresponds to the open state. The metastable minimum at 2 nm corresponds to a hairpin with the end base pair broken, but no further intermediate sub-states are resolvable. The stabilization of the open state with increasing force is clear, and the centre of the transition from the closed to the open state occurs at close to 10 pN.
3.5 Duplex bending
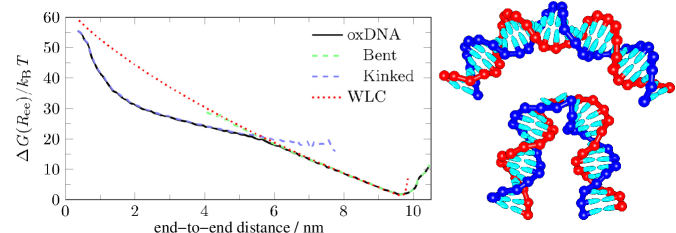
Free-energy landscapes can also be computed that quantify the effect of mechanical deformation on double-stranded DNA. In Fig. 6 we show the thermodynamic cost of duplex bending, using the end-to-end distance of the duplex as the order parameter. The free-energy minimum corresponds to the relaxed duplex. As the two ends of the duplex are pulled together the free-energy rises smoothly in line with the predictions of the worm-like chain model. However, below a certain end-to-end distance (about 5.5 nm in the example shown) it become favourable for the bending stress to be localized at a “kink” defect where the DNA bends sharply and the stacking and usually base-pairing interactions are disrupted. The kink acts a bit like a hinge allowing further bending to occur more easily. At very short distances, the free energy begins to rise more rapidly due the repulsion between the two ends. The point at which kinking occurs in such free-energy profiles depends on the duplex length; for sufficiently long duplexes the two ends can be brought together to form a roughly circular configuration without any need for kinking [23].
3.6 DNA nanodevices
In many DNA nanodevices, part of the mechanism involves an intramolecular hybridization process. The two-footed DNA walker of Ref. [25] provides just such an example. This device is capable of walking across a DNA origami through the successive additions of fuel and anti-fuel molecules that cause the legs to be lifted and placed back down. The process illustrated in Fig. 7(a) is of leg placement after a fuel molecule F1 has bound to the foothold T1. The intramolecular hybridization of the leg L1 with the remaining unbound domain of F1 leads to correct foot placement, whereas the binding of a second F1 molecule to L1 instead leads to a trapped state.
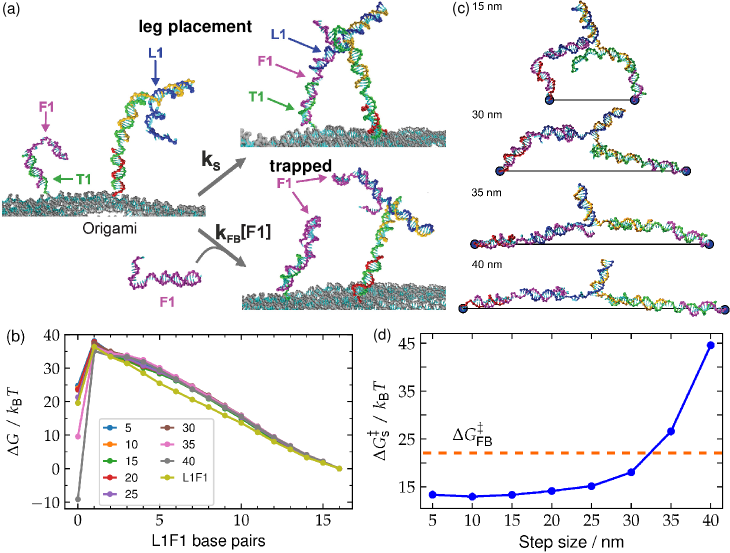
Fig. 7(b) shows the free-energy landscapes for leg placement as a function of the step size of the walker. Beyond a step size of 25–30 nm, the free-energy for leg placement increases rapidly. This is because there is an increasing free-energetic cost for the walker adopting a stretched-out state, as is very evident from the bound states illustrated in Fig. 7(c). In terms of free-energy barriers, the main effect of increasing the step size is to increase the barrier for binding (Fig. 7(d)); most of the free-energy cost of adopting a stretched-out state has to be paid to initiate binding. Thus, the step size has a much greater effect on the binding rate than the unbinding rate.
Although estimating absolute rates from free-energy landscapes requires additional dynamical information, the relative rates for similar processes can often be accurately estimated by assuming that dynamical factors other than the free-energy barriers cancel out; i.e.
| (2) |
where and are the rates of the two reactions being compared. For example, this equation allowed a detailed comparison to experimental results for the walker, considering both the effects of step size and fuel concentration [26].
The above provides an example where a change in the free energy of reaction mainly affects the binding rates. This is often the case when a mechanical deformation is required to initiate binding; for example, this also applies to DNA cyclization reactions [27]. An opposite example is the hybridization rate between two strands that can themselves form short hairpins [28, 29]. The hairpins stabilize the single-stranded state compared to sequences that do not allow hairpins to form, thus reducing the overall free energy of hybridization. However, the hairpins only have a relatively small effect on the binding rate because, in the cases considered, the hairpins are short enough that hybridization can be initiated in other sections of the strand, and only once the free-energy barrier has been crossed do the hairpin base pairs need to be broken. By contrast, there is a large increase in the rate of unbinding, because during dissociation the strands can start to form the hairpins, thus stabilising partially melted states and reducing the free-energy barrier to dissociation.
3.7 Displacement reactions
One of the fundamental processes used in DNA nanotechnology to drive structural changes is toehold-mediated strand displacement. In this process an “invader” strand binds to an exposed single-stranded toehold on the “target” strand and then proceeds to displace the adjacent “incumbent” strand to form a duplex with the target strand (example intermediate configurations are shown in Fig. 8(a,b)). The first panel of Fig. 8(c) shows the landscape for a standard displacement reaction where the invader is fully complementary to the target. The pathway involves the invader binding to the toehold and then the displacement process, which at each step involves the loss of a base pair by the incumbent followed by the invader gaining a base pair (leading to the diagonal paths across the landscape). The final stage is dissociation of the incumbent strand, which may occur spontaneously before the last few base pairs have been displaced.
A key property that determines the rate of displacement is the likelihood that the invading strand will dissociate rather than complete the displacement. For example, the rate increases as the toehold length increases, because it makes dissociation less likely once the invading strand is fully bound to the toehold. One of the features of the displacement reaction is that there is a small barrier (of about ) to initiating the displacement, as this then creates two single-stranded tails at the junction site that have an effective repulsion between them. Accounting for this barrier is important to capture the dependence of the displacement rate on toehold length (which oxDNA very accurately does) because it increases the probability of invader dissociation compared to a landscape where there is no initial barrier to displacement [30].
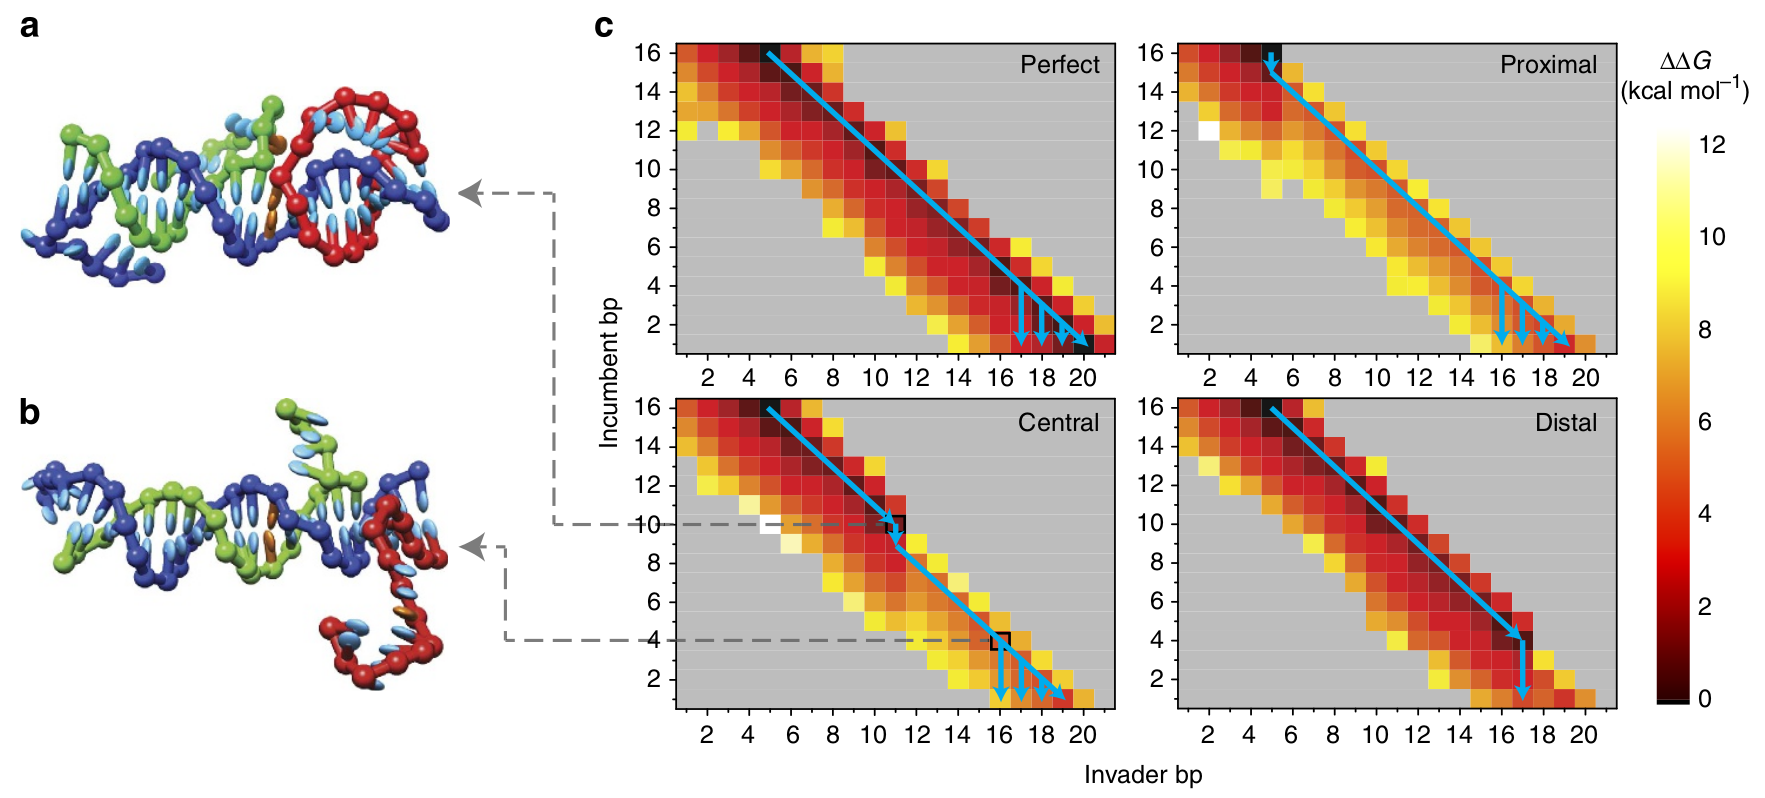
In Fig. 8(c) we also show landscapes for sequences where the displacement creates a duplex that contains a mismatch [31]. Incorporation of this mismatch leads to an additional barrier that needs to be overcome for the displacement reaction to reach completion. When incorporation of the mismatch occurs early in the displacement process, close to the toehold, the rate of displacement is significantly reduced (by a factor of about 1000 compared to the fully complementary invader sequence) because this additional barrier increases the likelihood that the invader strand will dissociate from the target strand rather than surmount the barrier and complete displacement. By contrast, when the mismatch is at the distal end relative to the toehold, it only has a relatively small effect on the displacement rate (a reduction by a factor of roughly 2), because by that point the invading strand is likely to complete displacement anyway, rather than dissociate, because it has already formed 17 base pairs with the target. The use and positioning of such mismatches thus provides an additional means to control the dynamics of displacement reactions.
4 Conclusions
This chapter provides some examples of how free-energy landscapes computed using a coarse-grained DNA model can provide important insights into the biophysics of DNA and the properties of the DNA assemblies used in DNA nanotechnology. Furthermore, given that the model used (oxDNA) has been parameterized to reproduce accurately the thermodynamics and mechanics of DNA both in its double-stranded and single-stranded forms, these landscapes can provide quantitative insights into relative rates. Such predictions can be supplemented by direct calculations of the rates by simulations (we have generally used the forward flux-sampling approach [9]; note that if one knows the free-energy change for the reaction from the free-energy landscape and one has computed the rate in one direction, the rate in the other direction simply follows from these two quantities). Although these rate calculations have revealed interesting and sometimes subtle dynamical effects [16, 29, 32], they have also confirmed the utility of Eq. 2 in capturing the most substantial effects on the relative rates.
Although the illustrative examples shown here are for relatively small systems, it is feasible to compute the full assembly landscapes including all relevant pathways for small DNA nanostructures, such as the DNA tetrahedron developed by the Turberfield group [33]. For larger nanostructures, such as DNA origami [34] and DNA brick systems [35], such computations are not feasible. However, the landscapes for key or archetypal processes in the assembly of these objects can be computed; for example, these can be used to parameterize kinetic models of assembly at the domain level, as has been done for 2D DNA brick systems [36].
Free-energy landscapes associated with mechanical deformations of very large DNA systems are also feasible using the oxDNA model. For example, free-energy landscapes for the bending of DNA origami rods that are equivalent to Fig. 6(a) have now been computed using umbrella sampling [37]. Similarly, metadynamics has also been successfully applied to study the mechanics of DNA origami [38].
References
- [1] B. Peters, Reaction coordinates and mechanistic hypothesis tests, Annu. Rev. Phys. Chem. 67 (2016) 669–690.
- [2] T. E. Ouldridge, A. A. Louis, J. P. K. Doye, Structural, mechanical and thermodynamic properties of a coarse-grained DNA model, J. Chem. Phys. 134 (2011) 085101.
- [3] P. Šulc, F. Romano, T. E. Ouldridge, L. Rovigatti, J. P. K. Doye, A. A. Louis, Introducing sequence-dependent interactions into a coarse-grained DNA model, J. Chem. Phys. 137 (2012) 135101.
- [4] B. E. K. Snodin, F. Randisi, M. Mosayebi, P. Šulc, J. S. Schreck, F. Romano, T. E. Ouldridge, R. Tsukanov, E. Nir, A. A. Louis, J. P. K. Doye, Introducing improved structural properties and salt dependence into a coarse-grained model of DNA, J. Chem. Phys. 142 (2015) 234901.
- [5] J. SantaLucia, Jr., D. Hicks, The thermodynamics of DNA structural motifs, Annu. Rev. Biophys. Biomol. Struct. 33 (2004) 415–40.
- [6] S. Brahmachari, J. F. Marko, DNA mechanics and topology, Vol. 1092 of Adv. Exp. Med. Biol., Springer, 2018, pp. 11–39.
- [7] B. E. K. Snodin, J. S. Schreck, F. Romano, A. A. Louis, J. P. K. Doye, Coarse-grained modelling of the structural properties of DNA origami, Nucleic Acids Res. 47 (2019) 1585–1597.
- [8] J. Kästner, Umbrella sampling, WIRES: Comp. Mol. Sci. 1 (2011) 932–942.
- [9] R. J. Allen, C. Valeriani, P. R. ten Wolde, Forward flux sampling for rare event simulations, J. Phys.: Condens. Matter 21 (2009) 463102.
- [10] P. G. Bolhuis, C. Dellago, Practical and conceptual path sampling issues, Eur. Phys. J. Spec. Top. 106 (2015) 2409–2427.
- [11] O. Valsson, P. Tiwary, M. Parrinello, Enhancing important fluctuations: Rare events and metadynamics from a conceptual viewpoint, Annu. Rev. Phys. Chem 67 (2016) 159–184.
- [12] G. M. Torrie, J. P. Valleau, Non-physical sampling distributions in monte carlo free-energy estimation: Umbrella sampling, J. Comput. Phys. 23 (1977) 187–199.
- [13] S. Kumar, J. M. Rosenberg, D. Bouzida, R. H. Swendsen, P. A. Kollman, The weighted histogram analysis method for free-energy calculations on biomolecules. I. The method, J. Comput. Chem. 13 (1992) 1011–1021.
- [14] D. Chandler, Introduction to Modern Statistical Mechanics, Oxford University Press, Oxford, 1987.
- [15] R. M. Dirks, J. S. Bois, J. M. Schaeffer, E. Winfree, N. A. Pierce, Thermodynamic analysis of interacting nucleic acid strands, SIAM Rev. 49 (2007) 65–88.
- [16] T. E. Ouldridge, P. Šulc, F. Romano, J. P. K. Doye, A. A. Louis, DNA hybridization kinetics: zippering, internal displacement and sequence dependence, Nucleic Acids Res. 41 (2013) 8886–8895.
- [17] R. Andrews, DNA hybridisation kinetics using single-molecule fluorescence imaging, Essays Biochem. 65 (2021) EBC20200040.
- [18] J. X. Zhang, J. Z. Fang, W. Duan, L. R. Wu, A. W. Zhang, N. Dalchau, B. Yordanov, R. Petersen, A. Phillips, D. Y. Zhang, Predicting DNA hybridization kinetics from sequence, Nat. Chem. 10 (2018) 91–98.
- [19] M. Mosayebi, F. Romano, T. E. Ouldridge, A. A. Louis, J. P. K. Doye, The role of loop stacking in the dynamics of DNA hairpin formation, J. Phys. Chem. B 118 (2014) 14326–14335.
- [20] F. Romano, A. Hudson, J. P. K. Doye, T. E. Ouldridge, A. A. Louis, The effect of topology on the structure and free energy landscape of DNA kissing complexes, J. Chem. Phys. 136 (2012) 215102.
- [21] M. Mosayebi, A. A. Louis, J. P. K. Doye, T. E. Ouldridge, Force-induced rupture of a DNA duplex: From fundamentals to force sensors, ACS Nano 9 (2015) 11993–12003.
- [22] M. T. Woodside, P. C. Anthony, W. M. Behne-Parks, K. Larizadeh, D. Herschlag, S. M. Block, Direct measurement of the full, sequence-dependent folding landscape of a nucleic acid, Science 314 (2006) 1001–1004.
- [23] R. M. Harrison, F. Romano, T. E. Ouldridge, A. A. Louis, J. P. K. Doye, Coarse-grained modelling of strong DNA bending i: Thermodynamics and comparison to an experimental “molecular vice” (arXiv:1506.09005).
- [24] N. B. Becker, A. Rosa, R. Everaers, The radial distribution function of worm-like chains, Eur Phys. J. E 32 (2010) 53–69.
- [25] T. E. Tomov, R. Tsukanov, M. Liber, R. Masoud, N. Plavner, E. Nir, Rational design of DNA motors: Fuel optimization through single-molecule fluorescence assisted by DNA origami, J. Am. Chem. Soc. 117 (2013) 11932–11942.
- [26] D. C. Khara, J. S. Schreck, T. E. Tomov, T. E. Ouldridge, J. P. K. Doye, E. Nir, DNA bipedal motor walking dynamics: An experimental and theoretical study of the dependency on step size, Nucleic Acids Res. 46 (2018) 1553–1561.
- [27] R. M. Harrison, F. Romano, T. E. Ouldridge, A. A. Louis, J. P. K. Doye, Identifying physical causes of apparent enhanced cyclization of short DNA molecules with a coarse-grained model, J. Chem. Theor. Comput. 15 (2019) 4660–4672.
- [28] Y. Gao, L. K. Wolf, R. M. Georgiadis, Secondary structure effects on DNA hybridization kinetics: a solution versus surface comparison, Nucleic Acids Res. 34 (2006) 3370–3377.
- [29] J. S. Schreck, T. E. Ouldridge, F. Romano, A. A. Louis, J. P. K. Doye, DNA hairpins primarily promote duplex melting rather than inhibiting hybridization, Nucleic Acids Res. 43 (2015) 6181–6190.
- [30] N. Srinivas, T. E. Ouldridge, P. Šulc, J. M. Schaeffer, B. Yurke, A. A. Louis, J. P. K. Doye, E. Winfree, On the biophysics and kinetics of toehold-mediated DNA strand displacement, Nuc. Acids Res. 41 (2013) 10641–10658.
- [31] R. R. F. Machinek, T. E. Ouldridge, N. E. C. Haley, J. Bath, A. J. Turberfield, Programmable energy landscapes for kinetic control of DNA strand displacement, Nat. Commun. 5 (2014) 5324.
- [32] V. Kočar, J. Schreck, S. Čeru, H. Gradišar, N. Bašić, T. Pisanki, J. P. K. Doye, R. Jerala, Design principles for rapid folding of knotted DNA nanostructures, Nat. Commun 7 (2016) 10803.
- [33] R. P. Goodman, I. A. T. Schaap, C. F. Tardin, C. M. Erben, R. M. Berry, C. F. Schmidt, A. J. Turberfield, Rapid chiral assembly of rigid DNA building blocks for molecular nanofabrication, Science 310 (2005) 1661–1665.
- [34] P. W. K. Rothemund, Folding DNA to create nanoscale shapes and patterns, Nature 440 (2006) 297–302.
- [35] Y. Ke, G. Bellot, N. V. Voigt, E. Fradkov, W. M. Shih, Two design strategies for enhancement of multilayer-DNA-origami folding: underwinding for specific intercalator rescue and staple-break positioning, Chem. Sci. 3 (2012) 2587–2597.
- [36] P. Fonseca, F. Romano, J. S. Schreck, T. E. Ouldridge, J. P. K. Doye, A. A. Louis, Multi-scale coarse-graining for the study of assembly pathways in DNA-brick self assembly, J. Chem. Phys. 148 (2018) 134910.
- [37] C. K. Wong, C. Tang, J. S. Schreck, J. P. K. Doye, Characterizing the free-energy landscapes of DNA origamis (arXiv:2108.06517).
- [38] W. T. Kaufhold, W. Pfeifer, C. E. Castro, L. Di Michele, Probing the mechanical properties of DNA nanostructures with metadynamics (arXiv:2110.01477).