Optically loaded Strontium lattice clock with a single multi-wavelength reference cavity
Abstract
We report on the realization of a new compact strontium optical clock employing a two-dimensional magneto-optical-trap (2D-MOT) as cold atomic source and a multi-wavelength cavity as frequency stabilization system. All needed optical frequencies are stabilized to a zero-thermal expansion high finesse optical resonator, and can be operated without frequency adjustments for weeks. We present the complete characterization of the apparatus. Optical control of the atomic source allows us to perform low-noise clock operation without atomic signal normalization. Long- and short-term stability tests of the clock have been performed for the 88Sr bosonic isotope by means of interleaved clock operation. Finally, we present the first preliminary accuracy budget of the system.
I Introduction
Optical lattice clocks (OLCs) based on neutral atoms are at the forefront of frequency metrology, exceeding current SI primary frequency standards of more than two orders of magnitude both in stability Campbell2017 ; Schioppo2017 and accuracy Beloy2021 . Therefore OLCs are suitable candidates for the future redefinition of the unit of time Riehle2015 . Among several candidates, strontium is one of the most widespread atomic species in metrological and ultra-cold research laboratories. Because of its simple electronic structure and its commercial accessible cooling transitions, it finds successful application for optical clocks Ushijima2015 ; Schwarz2020 , quantum control and quantum simulation Madjarov2019 ; Young2020 , probing new physics beyond the standard model Miyake2019 and chronometric geodesy Grotti2018 ; Takamoto2020 ; Bothwell2021 .
OLCs are essentially composed by three main parts: i) the optical local oscillator, with its local frequency reference usually consisting of an ultra-stable passive optical resonator: ii) the atomic frequency discriminator, which is a complex ultra-cold atomic apparatus to cool and trap atoms in tens of -deep optical lattices; iii) and a self-referenced optical frequency comb for frequency measurement and comparison.
Concerning the preparation of the atomic frequency discriminator, efficient laser cooling and trapping of ultra-cold atoms requires additional sub-systems for laser frequency stabilization and, in the case of the narrow 1S0 – 3P1 Sr intercombination transition, spectral narrowing. This makes an OLC a rather complex system. Previous approaches to build compact and transportable OLCs tackled this problem by simplifying the frequency stabilization scheme either by employing a monolithic multicavity Nevsky:13 , by sub-harmonic frequency dissemination of remote frequency references on a telecom network and subsequent optical phase-locked loops Ohmae2021 , or by employing a single multi-color ultrastable cavity Milani2017 . Furthermore, fast loading rates of the atomic sample are realized by employing Zeeman slowers or direct line-of-sight collimated atomic sources, whose collisions with trapped atoms limits both the trapping lifetime and the systematic uncertainty Gibble13 if an in-vacuum shutter is not employed.
In this work we present a Sr optical atomic clock apparatus which simplifies the atomic frequency discriminator system. We employ an optically-controlled cold atomic beam source based on a sideband-enhanced two dimensional magneto-optical trap (2D-MOT) Barbiero2020 , and a multi-wavelength frequency stabilization system, which also provides the short-term stability to the clock laser source. We study the stability and reliability of the apparatus by employing the bosonic 88Sr isotope, which possess the highest natural abundance, by means of the magnetic field-induced spectroscopy (MIS) method Taich2006 .
The paper is organized as follows: we first describe the multi-wavelength frequency stabilization system (Sec.II), its stability performances and its use for the clock laser stabilization. Then we present the atomic cooling and trapping apparatus (Sec.III) where we perform efficient two-stage magneto-optical trapping (MOT) and loading into a “magic-wavelength” optical lattice Takamoto2005 . Finally, we show the results of the Sr optical lattice clock operating on the forbidden 1S0 – 3P0 transition by the magnetic-field induced spectroscopy method (Sec.IV).
II Compact multi-wavelength frequency stabilization system
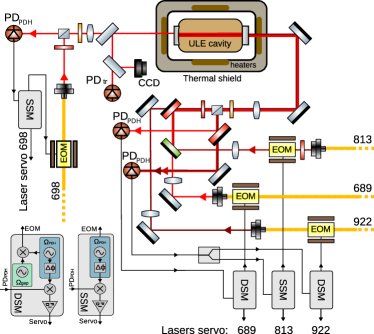
Our multi-wavelength frequency stabilization system is schematically shown in Fig. 1. The core of the system consists of a monolithic, cylindrical optical cavity of length = 10 cm and diameter = 5 cm, made by ULE Corning . The high-reflectivity coating of the ULE mirrors features three peaks at 922, 813 and 689 nm. These correspond to the three main cooling and trapping wavelengths. The highest design finesse, about , is reached for the narrow 1S0 – 3P1 intercombination transition wavelength at 689 nm, while the other two wavelengths (first cooling stage and lattice trapping) have finesse of .
The cavity sits on a V-shaped support over 4 viton balls inside a stainless-steel vacuum tank. This, in turn, is thermally decoupled from the optical table by two teflon supports. High-vacuum (about ) is mantained by a 20 L/s ion pump. The temperature of the cavity is actively stabilized to its zero-CTE point at by means of one polymide thermofoil heater and two silicon rubber heaters attached to the three sides of the cylindrical-shaped vacuum system. Several layers of polyurethane foam ensures thermal insulation. A digital proportional-integral-derivative servo loop keeps the vacuum tank temperature at the desired value within 5 mK.
Photothermal effects and residual temperature fluctuations can further limit the frequency stability of a laser locked to the optical cavity. These effects have been considered and described in the following sections.
II.1 Cooling and trapping lasers frequency stabilization
The two lasers needed for laser cooling of 88Sr at 461 nm and 689 nm are frequency referenced to the multi-wavelength cavity by means of the dual-sideband offset locking technique Thorpe2008 . This modified version of the Pound-Drever-Hall (PDH) technique allows us to tune the carrier frequency independently from the cavity resonance by shifting the modulation frequency . The PDH signal is extracted by demodulating the photodiode signal at the second sideband . Together with the lattice laser at 813 nm, all these three laser beams are sent to the same side of the cavity and share the same optical path and polarization optics, as shown in Fig. 1. The 689 nm reflected beam is separated from the other two beams by another short-pass mirror and then detected with a PDH photodetector. For the other two wavelengths, the error signal is generated from the photocurrent of the same photodiode by frequency demodulation at their respective frequencies.
The laser for the narrow 1S0 – 3P1 intercombination transition is a commercial extended-cavity diode laser (ECDL, Toptica DLPRO). It is partially sent to the multi-wavelength cavity through a polarization-maintaining (PM) optical fiber and phase modulated by a fiber-coupled, wideband, electro-optic modulator (EOM, Jenoptik PM705).
The dual sideband modulation is generated by electronic mixing of two RF oscillators at and respectively, so that the carrier has no phase modulation at . Each offset sideband takes typically of the total power sent to the cavity, which is about . This corresponds to a modulation index nearly equal to . The correction frequency is then fed back to both the ECDL’s piezotransducer for low frequency corrections, and to the diode current modulation input through a passive electrical network. Typical servo bandwidths of are achieved, so that the laser low-frequency instability is dominated by the instability of the cavity.
The light necessary for the 1S0 – 1P1 transition is generated by a frequency-duplicated commercial diode laser (LEOS Solutions). We take a pick-off of the sub-harmonic decoupled from the main beam by an optical isolator and we send it to the multi-wavelength cavity from a PM fiber and a fiber-EOM. The offset sideband frequency is tuned to while the second sideband is at . About of optical power is sent to the cavity with a carrier-to-offset sideband power ratio of . In this case the correction signal is fed back only to the ECDL’s piezotransducer for slow correction of the seed wavelength.
The lattice laser (Ti:Sapph) at is frequency stabilized to the multi-wavelength cavity with standard PDH technique on the nearest cavity resonance to the known magic frequency Akatsuka08 , with a stability exceeding .
II.2 Clock laser frequency stabilization
The clock laser at is also a commercial ECDL (Toptica DLPRO) delivering up to of optical power. It is currently frequency stabilized to the multi-wavelength cavity, entering from the opposite side of the cavity with respect to the and the other cooling lasers, as shown in Fig. 1. In order to avoid unwanted cross-talks with the close 689 nm laser light transmitted from the cavity, the input circular polarization is carefully tuned with opposite sign. We send of optical power phase modulated at , far from any harmonics of the other RF frequencies.
The clock laser is locked to cavity with the standard PDH technique. The servo loop is similar to the one described for the laser, with correction sent to both the diode current and the ECDL piezotransducer. In this case the control bandwidth exceeds , with the in-loop error signal reaching the detector noise floor () up to 20 kHz.
II.3 Stability results
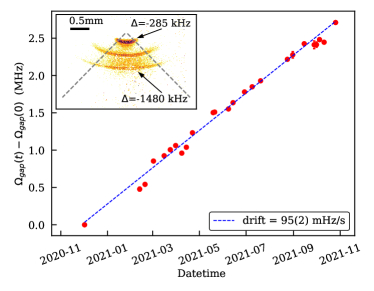
The frequency stability of an optical resonator of ULE, which is temperature-stabilized to its zero-coefficient of thermal expansion (CTE) point, is limited by the aging of the spacer material, resulting is a slow drift Haefner2015 . We developed a method to track this long-term drift with respect to the resonance transition 1S0 – 3P1 necessary for the second-stage ultra-cold MOT of the atomic sample (see Sec. III). We infer the 1S0 – 3P1 resonant frequency by imaging the red MOT with respect to the offset sideband frequency and then fitting the transverse dimension of the atomic cloud, which linearly depends on the cooling frequency detuning Katori1999 as shown in the inset of Fig.2. The main panel of Fig. 2 reports the recorded values of at which the 689 nm laser is on resonance with respect to the 1S0 – 3P1 transition over a period of 11 months. We infer an average drift rate of (or in relative units). This low drift value allows us to prepare and manipulate ultra-cold samples of Sr atoms without any frequency adjustment for weeks.
The stability of the multi-wavelength cavity as frequency reference is limited by vibration-induced length fluctuations induced by axial and transverse cavity accelerations and . This can be parametrized as Hall1999
| (1) |
where is the cavity spacer density, and are the Poisson ratio and Young modulus respectively, and parametrizes the acceleration transmissivity due to the cavity support geometry, ranging from 0 to 1 Nazarova_2006 . No antivibration measures are taken for our cavity, so that for typical ambient seismic noise we can estimate the induced frequency instability. Assuming a typical environmental acceleration noise spectral density Fiori2004 ; Tarallo2011 up to few hundred Hz, and a sensitivity coefficient = 0.5, the expected vibrations-limited fast linewidth is expected to be about 10 Hz.
An important detrimental effect that could limit the frequency stability of a laser, and in particular the clock laser, to the multi-wavelength cavity is the length fluctuations due to other lights’ intensity noise. While we do not expect that this effect limits our clock laser, due to the non-compensated vibration noise, it is interesting to evaluate this effect for future implementations of the system with higher frequency stability requirements. To estimate the transmitted intensity noise from the other lasers to the clock light, we modulated the amplitude of the RF power generating the offset sidebands for the and lights and we looked at the corresponding frequency shift with respect to a high-stability optical oscillator Barbiero2021 . From a linear fit of the cavity frequency shifts against the transmitted power, we infer cavity shift coefficients of and respectively. The shift measurement for the 922 nm light is compatible with zero. These results can be explained as due to the heating of the dielectric mirror coating generated by the intracavity optical power at different wavelengths Bergquist1992 ; Tarallo2011 . For our system, this results in a frequency instability for an intra-cavity relative intensity noise of .
The short-term stability of the multi-wavelength frequency stabilization system is best studied for clock laser by looking at its effect on the clock spectroscopy and the clock stability via the Dick effect Quessada_2003 . This is described in detail in Sec. IV.2.
III Cooling, trapping and probing apparatus
A schematic overview of our atomic cooling and trapping apparatus is shown in Fig. 3. It consists of two main parts, the 2D-MOT atomic source and the science cell setup.
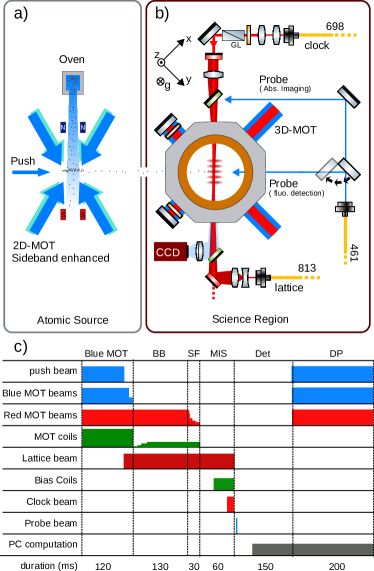
The cold atomic source of this apparatus, as well as the details on the complete vacuum system, has been extensively described in Barbiero2020 . Here we briefly recall the main properties of the system. A cold, bright atomic beam is generated by a two-frequency 2D-MOT transversely loaded from a collimated Sr oven (typically operated at ), with an average longitudinal velocity of and a transverse temperature of less than . This allows us to achieve a loading rate in the science chamber up to , tunable by changing the optical power of the push beam.
Such cold atomic beam is then cooled and trapped in the science cell, where three-dimensional magneto-optical cooling and trapping is performed before loading the atomic ensemble into the optical lattice for clock spectroscopy. The overall procedure for probing the 1S0 – 3P0 transition by means of MIS technique is depicted in the Fig. 3(c).
III.1 Laser cooling of 88Sr atoms
In the science chamber, the atoms from the atomic source are loaded in the “Blue MOT” operated on the 1S0 – 1P1 at for . We typically apply a total intensity (in units of the resonant saturation intensity) and a magnetic field gradient of . Switching off the push beam interrupts the atomic flux. The MOT is operated for additional 20 ms. This covers both the time-of-flight of the remaining atoms from the 2D-MOT, and a short MOT phase () at reduced intensity () to further cool down the collected sample. At the end we collect up to at . All the laser beams at 461 nm and the magnetic field gradient are then switched off, and we use a mechanical shutter to completely turn off the blue light.
The second cooling stage is performed on the 1S0 – 3P1 intercombination transition (“Red” MOT Katori1999 ) at 689 nm. We initially employ about of optical power () with a Broad-Band (BB) spectrum to cover the majority of the Doppler spectrum of the atoms released from the Blue MOT. A double-pass acousto-optic modulator (AOM) yields the broadened spectrum with an FM frequency of , modulation depth of and a minimum detuning of from the atomic resonance. During the BB Red MOT phase, the magnetic field gradient is ramped up to in . The atomic density and cloud dimensions reach their stationary values in . At the end of the BB phase, we trap up to at .
Finally, the temperature of the atomic sample is further reduced by a Single-Frequency (SF) red MOT phase. Here the optical power is exponentially ramped down from to () in . At the end of this cooling stage, we trap below . Also for the 689 nm light, a mechanical shutter is used to avoid residual stray light going to the atoms in the optical lattice.
During the whole Red MOT, the optical lattice beam is turned on, so that the atoms overlapped to the lattice beam remain trapped and ready for clock spectroscopy at the switching off of the red beams and the magnetic field gradient. The total duration of the cooling and trapping is about 300 ms.
III.2 Magic-wavelength optical lattice
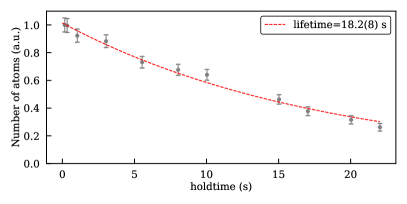
The optical lattice trap is realized with of optical power at the magic wavelength of , delivered with a PM optical fiber. The beam is shaped to produce a beam waist of about in correspondence of the red MOT center. The lattice axis is orthogonal to the gravity direction as shown in Fig.3. The lattice retro-reflection dichroic mirror is carefully aligned maximizing the amount of power coupled back to the fiber collimator. Up to can be loaded in the lattice trap with a measured lifetime of , as plotted in Fig. 4. This value is dominated by the off-resonant scattering ( Grimm1999 ), therefore vacuum-limited lifetime can be as high as . This exceptionally long lattice lifetime is a consequence of the 2D MOT loading that allows us to completely turn off the atomic flux during lattice spectroscopy, and also maintaining much higher differential vacuum between the two chambers in comparison to a classic Zeeman slower Drscher2018 .
Time-of-flight absorption imaging measurements of the atomic sample show temperatures lower that in both the transverse directions, while the axial free-expansion of the atomic cloud is parallel to the imaging beam, thus the axial temperature is not measurable with this method. The transverse size of the optical lattice can be extracted from temperature measurements Grimm1999 , and it is about . The axial dimension is not accessible by the imaging system, and it is roughly estimated equal to twice the Red MOT radius, about .
The optically-controlled atomic source combined with the cooling and trapping process yields a lattice population fluctuation as low as for maximum loading rate, which nearly doubles at low loading rates. This number fluctuation is nearly half of the one observed when the 461 nm laser was frequency stabilized to an atomic vapor Barbiero2020 .
III.3 Magnetic field-induced spectroscopy setup
Magnetic field-induced spectroscopy is enabled by an homogeneous bias magnetic field applied by inverting the current of one of the MOT coils, thus switching from anti-Helmholtz to Helmholtz configuration. The bias magnetic field is directed along the gravity direction and orthogonal to the lattice beam propagation direction.
The clock laser beam at 698 nm is directed towards the atoms from the dichroic retro-reflection lattice mirror (high-reflective at 813 nm and high-transmissive, , at the clock wavelength). The clock laser beam is shaped to have a waist of , i.e. three times the lattice beam waist, to ensure high homogeneity on the atoms. Clock light standing waves are avoided by using a second dichroic mirror along the optical path of the input lattice beam, as depicted in Fig. 3(b). We carefully align the clock beam to the atoms by maximizing the amount of power injected to the fiber collimator of the lattice beam. Linear polarization parallel to the magnetic field is ensured by a Glan-Thomson polarizer placed before the lattice retro-reflection mirror. Finally, power and duration of the clock laser pulse are controlled by an AOM before the input fiber.
A second AOM driven by an externally-referenced RF oscillator (working around 345 MHz), is used to tune the frequency of the clock laser for clock spectroscopy scans and frequency stabilization by FM modulation. The RF oscillator is directly controlled by an analog output generated by the experiment control system Barbiero2019 .
III.4 Atomic detection setup
Atomic detection and diagnostics is performed by the imaging system. It consists of a CCD camera (Stingray F-201, 1624 1234 pixels and pixel size) and an achromatic lens displaced to get a numerical aperture of and magnification factor of . A probe beam, resonant with the 1S0 – 1P1 strong transition, can be either sent to the CCD camera for absorption imaging of the atomic sample, or directed orthogonally to the absorption axis for fluorescence detection by means of a removable mirror. The absorption imaging optical path is integrated along the lattice direction by means of two dichroic mirrors. Residual light from the lattice and clock laser beams are then blocked by an interference filter peaked at , mounted in front of the CCD camera.
While absorption imaging is best suited for the atomic sample diagnostics (atomic cloud dimension, temperature and calibrated atomic count), we perform fast fluorescence imaging for clock spectroscopy. In this case, the probe beam pulse has a duration of and optical power of , while its linear polarization maximizes the atomic fluorescence towards the CCD. The CCD camera exposure time is , while the image is downloaded to the computer control in less than . Only of the total CCD array is employed to speed-up the data download and processing. Within the same image we define two regions of interest (ROIs) with equal areas. One of the ROIs covers the majority of the atomic cloud and provides the photon counts, the other is placed at the corner of the image and provides the background signal of the CCD. The difference between the ROIs counts provides the fluorescence counts. The detected fluorescence signal is maximized by releasing the atoms from the lattice and probing the atoms after of free fall.
Almost are spent by the computer control to manage the CCD data processing and to generate the feedback signal to keep the system on the resonance of the 1S0 – 3P0 transition. This represents the current limit for the duration of the experimental cycle. To further shorten the clock cycle, we are planning to implement a parallel processing of the CCD data within the preparation time of the atoms in the optical lattice trap.
IV Results
IV.1 Resolved sideband spectroscopy
We perform high resolution MIS of the 88Sr clock transition 1S0 – 3P0 in the Lamb-Dicke regime with motion resolved from the carrier. An example of the sideband spectrum is presented in Fig. 5. Here the bias coils are driven at maximum current and a pulse duration of is employed to maximize the excitation of the motional sidebands. With a typical lattice optical power of , we measure an axial trapping frequency of , implying a lattice depth = , where = is the lattice recoil energy. The Lamb-Dicke parameter associated to our lattice trap depth is .
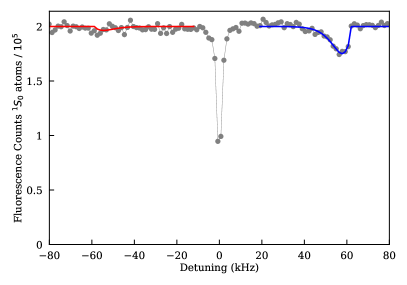
We also measure the apparent axial () and radial () temperatures of the atomic sample from the shape and the relative areas of the first-order motional sidebands Blatt2009 . The resulting temperatures are and . Compared to time-of-flight temperature measurement, the apparent radial temperature is slightly higher (), implying either the simplicity of the fitting function which does not include any broadening effect, or an underlying heating mechanism due to photon-assisted collisions.
IV.2 Narrow-line spectroscopy and clock stability test
High-resolution Rabi spectroscopy is realized by exciting the clock transition at the actual pulse for each configuration of magnetic field and probe intensity. The resulting linewidth can be narrowed by decreasing either (or both) the bias magnetic field or the probe power. Furthermore, because of collisional dephasing, narrow lines have to be obtained by lowering the lattice site density reducing the number of loaded atoms.
The inset of Fig. 6 shows a narrow-line spectrum obtained by sweeping the clock light frequency for a 3 kHz span with bias coil current = 3 A and clock power of 2.3 mW and with atoms in the lattice for 8 ms. The resulting resonance has a full-width half-maximum of and shows a contrast.
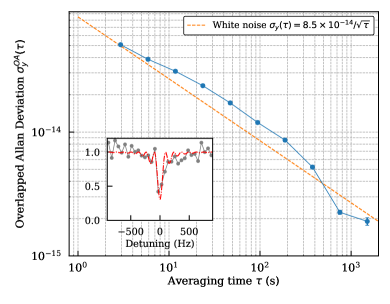
Clock operation is enabled by locking the clock laser frequency to an absorption feature, by means of two sequential pulses separated in frequency by an amount . The frequency-shifting key (FSK) modulation depth is chosen to roughly match the FWHM of the atomic resonance. The stability of the clock operation is studied by interleaving between two values of some clock parameters. Clock operations were carried on for several hours without unlocks or severe glitches. We have not observed any effect related to the long-term drift of our multi-wavelength cavity which would degrade the number of atoms loaded in the lattice. A typical interleaved stability in fractional units is shown in Fig. 6. The resulting overlapping Allan deviation decreases asymptotically as . This means that the single-operated clock, i.e. with half averaging cycle time measurement noise, has an average asymptotic stability of .
The white-noise-limited clock instability can be due to the local oscillator instability via the Dick effect Quessada_2003 , or by shot-to-shot fluctuations of the non-normalized number of lattice atoms. The former should be particularly limiting for our clock because of the low duty cycle (about 1.3% for a Rabi-limited resonance and 10 ms pulse). If we assume a Flicker noise floor similar to that of Ref. Pizzocaro2012 and a white-noise of limited by vibration noise, we get a Dick-limited Allan deviation of at , nearly as much as the measured data.
IV.3 Clock frequency shifts
Understanding the main sources of uncertainty is necessary to calibrate and test the stability of our apparatus. We have performed a preliminary evaluation of the systematic effects in our 88Sr optical clock by interleaved frequency measurements. The typical measurement duration is 15 minutes for each point. The main sources of systematic shifts and their uncertainties are summarized in Table 1.
| Effect | Shift | Uncertainty |
|---|---|---|
| AC Zeeman | -243.7 | 3.7 |
| Probe light | -105.8 | 5.3 |
| Lattice light | 0 | 5.4 |
| Density | 1.9 | 0.2 |
| BBR | -1.90 | 0.01 |
| Frequency chain | 0 | 0.02 |
| Total: | -349.6 | 8.4 |
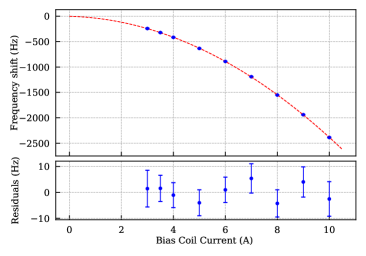
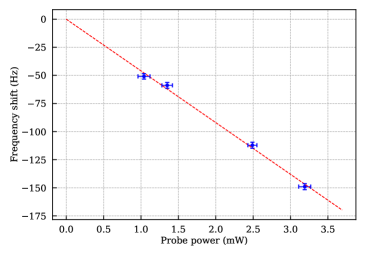
Because of the artificial coupling of the two clock levels in the bosonic clock, the two most important contributions to the uncertainty budget are the quadratic Zeeman shift and the light shift from the clock laser. The associated shift coefficient are very well known for Sr both theoretically and experimentally Taich2006 , thus we use these values to calibrate the bias magnetic field and the probe intensity. The results are shown in Fig. 7. The quadratic Zeeman shift can be expressed as a quadratic function of the bias coils current with an offset , , with Nicholson2015 . The measured bias coils current calibration coefficient is = 0.972(7) mT/A, so that for a typical value of the bias coils current ( = 3 A), the quadratic Zeeman shift induced by a bias field of is resolved with an uncertainty of 3.7 Hz. The probe light shift is calibrated with a linear function resulting in a frequency shift of , implying a probe beam width of . Thus, we can express the effective Rabi frequency as function of the bias coil current and probe power by means of the respective induced shifts as Taich2006
| (2) |
where .
The scalar light shift from the 813 nm lattice laser was estimated by interleaving different values of its power. The measured uncertainty at typical working lattice depth is about 5.4 Hz due to statistical uncertainty.
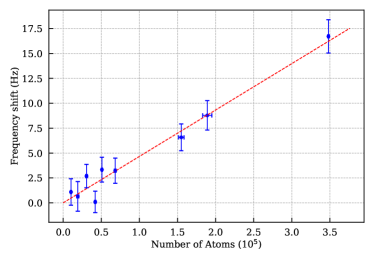
Another important source of systematic uncertainty in bosonic 88Sr clocks is the density shift due to collisions Lisdat2009 . We performed interleaved frequency shift measurements by changing the push power of our atomic source, thus tuning the lattice loading at will, as shown in Fig. 8. Measurements spans between and 88Sr atoms, while both the trap depth and the atomic temperature are kept constant. Narrow-line spectroscopy with atoms results in a frequency uncertainty of 0.2 Hz. The resulting density shift coefficient is
| (3) |
where is the number of occupied lattice sites, is the average volume occupied by the atoms in each lattice site. This depends on the lattice depth and the atomic temperatures and , as measured from the sideband spectroscopy (see Sec. IV.1) and calculated according to Ref. Swallows12 . The uncertainty in the density coefficient is mainly due to the axial dimension estimation of the atomic sample due to the alignment of our imaging system. Compared with previous measurements Lisdat2009 , we found a discrepancy of a factor 3 for 111We recalculated the coefficient from Lisdat2009 using the correct expressions for and according to Swallows12 . The new value is Hz m3 assuming a temperature of 4 K. The discrepancy can be eliminated assuming a temperature of 2 K..
Another environmental source of frequency shift is the blackbody radiation (BBR) due to the surrounding ambient temperature Porsev2006 . An accurate evaluation of this effect is beyond the scope of this work. We point out that the MOT/bias coils are not thermally controlled, but due to the low duty cycle their effect is negligible compared to thermal fluctuations of the laboratory, which are currently controlled only within 0.5 K. The projected uncertainty in the BBR shift is in relative units, which is completely negligible at the current level of accuracy.
Finally, all the frequency chain driving the AOMs used for clock spectroscopy is referenced to a H-maser used for the realization of UTC(IT) timescale. The estimated uncertainty due to residual phase noise after phase-locked loop to the external reference is evaluated below 0.3 Hz at 1 s. This results in an uncertainty of Hz for typical interleaved clock averaging times.
In summary, the total frequency accuracy is , or in relative units. It is mainly limited by the statistical uncertainty in the determination of the quadratic Zeeman shift and the probe and lattice Stark shifts.
V Conclusion
We have described a novel apparatus for a Sr optical lattice clock based on an optically-controlled cold atomic source and a multi-wavelength frequency stabilization system. These ingredients enable long periods of operation with low maintenance and high stability. Thanks to our 2D-MOT based atomic source, we have demonstrated a lifetime of in the optical lattice, remarkably longer than those obtained with Zeeman slowers.
A single reference cavity is able to properly stabilize all the lasers, resulting in an efficient and compact stabilization unit. The multi-wavelength stabilization method offers an ultimate limit on the clock laser instability at the level of without any laser amplitude stabilization.
The resulting system is simpler and more cost effective than previous realizations, making this design suitable for applications in challenging real-world environments Takamoto2020 and for industrial grade system.
Our optical clock has shown a long-term frequency instability as low as , estimated by means of interleaved clock operation. Such limited stability is primarily affected by the short local oscillator coherence time caused by environmental vibration noise. Stable operation dominated by white frequency noise has been proved by interleaved frequency measurements for measurement times of several hours.
Technical frequency shifts have been resolved with less than uncertainty, limited by the short coherence time of the local oscillator and by the relatively short averaging time.
The system described in this work offers much room for improvements, both regarding the short-term clock stability and the long-term clock operation. The short-term stability would immediately benefit from adding a commercially-available anti-vibration system for the reference cavity and by reducing the cycle dead-time by implementing a parallel data processing of the CCD data. These two simple changes should lower the clock instability by more than a factor 10. Long-term clock operation would require an active compensation of the multi-wavelength drift affecting the lattice loading process and the addition of automated locking algorithms for all the necessary lasers. Finally, a complete accuracy assessment of the system will require a better control of the room temperature and all clock components in order to correctly quantify the impact of the BBR shift.
Immediate gain in frequency stability can also be obtained by optical frequency comb-assisted spectral purity transfer Hagemann13 using the more stable optical local oscillator available for INRIM’s Yb clock Barbieri2019 . Fast and stable clock operations are also key ingredients to study quantum-enhanced technologies to be implemented in the newly designed science cell Tarallo20 . The upgraded system can also test active generation of a frequency standard using its sideband-enhanced cold atomic beam Liu2020 .
Acknowledgment
We thank F. Bregolin and G. Barontini for careful reading of the manuscript, and M. Bober for useful discussions. We acknowledge funding of the project EMPIR-USOQS; EMPIR projects are co-funded by the European Union’ Horizon 2020 research and innovation program and the EMPIR participating states. We also acknowledge funding from the QuantERA project Q-Clocks.
References
- (1) S. L. Campbell, R. B. Hutson, G. E. Marti, A. Goban, N. D. Oppong, R. L. McNally, L. Sonderhouse, J. M. Robinson, W. Zhang, B. J. Bloom, and J. Ye, “A fermi-degenerate three-dimensional optical lattice clock,” Science, vol. 358, no. 6359, pp. 90–94, Oct. 2017. [Online]. Available: https://doi.org/10.1126/science.aam5538
- (2) M. Schioppo, R. C. Brown, W. F. McGrew, N. Hinkley, R. J. Fasano, K. Beloy, T. Yoon, G. Milani, D. Nicolodi, J. Sherman et al., “Ultrastable optical clock with two cold-atom ensembles,” Nature Photonics, vol. 11, no. 1, pp. 48–52, 2017.
- (3) K. Beloy, M. I. Bodine, T. Bothwell, S. M. Brewer, S. L. Bromley, J.-S. Chen, J.-D. Deschênes, S. A. Diddams, R. J. Fasano, T. M. Fortier, Y. S. Hassan, D. B. Hume, D. Kedar, C. J. Kennedy, I. Khader, A. Koepke, D. R. Leibrandt, H. Leopardi, A. D. Ludlow, W. F. McGrew, W. R. Milner, N. R. Newbury, D. Nicolodi, E. Oelker, T. E. Parker, J. M. Robinson, S. Romisch, S. A. Schäffer, J. A. Sherman, L. C. Sinclair, L. Sonderhouse, W. C. Swann, J. Yao, J. Ye, X. Zhang, and B. A. C. O. N. B. Collaboration*, “Frequency ratio measurements at 18-digit accuracy using an optical clock network,” Nature, vol. 591, no. 7851, pp. 564–569, 2021. [Online]. Available: https://doi.org/10.1038/s41586-021-03253-4
- (4) F. Riehle, “Towards a redefinition of the second based on optical atomic clocks,” Comptes Rendus Physique, vol. 16, no. 5, pp. 506–515, 2015, the measurement of time / La mesure du temps. [Online]. Available: https://www.sciencedirect.com/science/article/pii/S1631070515000638
- (5) I. Ushijima, M. Takamoto, M. Das, T. Ohkubo, and H. Katori, “Cryogenic optical lattice clocks,” Nature Photonics, vol. 9, no. 3, pp. 185–189, Feb. 2015. [Online]. Available: https://doi.org/10.1038/nphoton.2015.5
- (6) R. Schwarz, S. Dörscher, A. Al-Masoudi, E. Benkler, T. Legero, U. Sterr, S. Weyers, J. Rahm, B. Lipphardt, and C. Lisdat, “Long term measurement of the sr87 clock frequency at the limit of primary cs clocks,” Physical Review Research, vol. 2, no. 3, Aug. 2020. [Online]. Available: https://doi.org/10.1103/physrevresearch.2.033242
- (7) I. S. Madjarov, A. Cooper, A. L. Shaw, J. P. Covey, V. Schkolnik, T. H. Yoon, J. R. Williams, and M. Endres, “An atomic-array optical clock with single-atom readout,” Physical Review X, vol. 9, no. 4, Dec. 2019. [Online]. Available: https://doi.org/10.1103/physrevx.9.041052
- (8) A. W. Young, W. J. Eckner, W. R. Milner, D. Kedar, M. A. Norcia, E. Oelker, N. Schine, J. Ye, and A. M. Kaufman, “Half-minute-scale atomic coherence and high relative stability in a tweezer clock,” Nature, vol. 588, no. 7838, pp. 408–413, Dec. 2020. [Online]. Available: https://doi.org/10.1038/s41586-020-3009-y
- (9) H. Miyake, N. C. Pisenti, P. K. Elgee, A. Sitaram, and G. K. Campbell, “Isotope-shift spectroscopy of the s01p13 and s01p03 transitions in strontium,” Physical Review Research, vol. 1, no. 3, Nov. 2019. [Online]. Available: https://doi.org/10.1103/physrevresearch.1.033113
- (10) J. Grotti, S. Koller, S. Vogt, S. Häfner, U. Sterr, C. Lisdat, H. Denker, C. Voigt, L. Timmen, A. Rolland, F. N. Baynes, H. S. Margolis, M. Zampaolo, P. Thoumany, M. Pizzocaro, B. Rauf, F. Bregolin, A. Tampellini, P. Barbieri, M. Zucco, G. A. Costanzo, C. Clivati, F. Levi, and D. Calonico, “Geodesy and metrology with a transportable optical clock,” Nature Physics, vol. 14, no. 5, pp. 437–441, Feb. 2018. [Online]. Available: https://doi.org/10.1038/s41567-017-0042-3
- (11) M. Takamoto, I. Ushijima, N. Ohmae, T. Yahagi, K. Kokado, H. Shinkai, and H. Katori, “Test of general relativity by a pair of transportable optical lattice clocks,” Nature Photonics, vol. 14, no. 7, pp. 411–415, Apr. 2020. [Online]. Available: https://doi.org/10.1038/s41566-020-0619-8
- (12) T. Bothwell, C. J. Kennedy, A. Aeppli, D. Kedar, J. M. Robinson, E. Oelker, A. Staron, and J. Ye, “Resolving the gravitational redshift within a millimeter atomic sample,” 2021.
- (13) A. Nevsky, S. Alighanbari, Q.-F. Chen, I. Ernsting, S. Vasilyev, S. Schiller, G. Barwood, P. Gill, N. Poli, and G. M. Tino, “Robust frequency stabilization of multiple spectroscopy lasers with large and tunable offset frequencies,” Opt. Lett., vol. 38, no. 22, pp. 4903–4906, Nov 2013. [Online]. Available: http://www.osapublishing.org/ol/abstract.cfm?URI=ol-38-22-4903
- (14) N. Ohmae, M. Takamoto, Y. Takahashi, M. Kokubun, K. Araki, A. Hinton, I. Ushijima, T. Muramatsu, T. Furumiya, Y. Sakai, N. Moriya, N. Kamiya, K. Fujii, R. Muramatsu, T. Shiimado, and H. Katori, “Transportable strontium optical lattice clocks operated outside laboratory at the level of 10 -18 uncertainty,” Advanced Quantum Technologies, p. 2100015, may 2021.
- (15) G. Milani, B. Rauf, P. Barbieri, F. Bregolin, M. Pizzocaro, P. Thoumany, F. Levi, and D. Calonico, “Multiple wavelength stabilization on a single optical cavity using the offset sideband locking technique,” Optics Letters, vol. 42, no. 10, p. 1970, may 2017.
- (16) K. Gibble, “Scattering of cold-atom coherences by hot atoms: Frequency shifts from background-gas collisions,” Phys. Rev. Lett., vol. 110, p. 180802, May 2013. [Online]. Available: https://link.aps.org/doi/10.1103/PhysRevLett.110.180802
- (17) M. Barbiero, M. G. Tarallo, D. Calonico, F. Levi, G. Lamporesi, and G. Ferrari, “Sideband-enhanced cold atomic source for optical clocks,” Physical Review Applied, vol. 13, no. 1, Jan. 2020. [Online]. Available: https://doi.org/10.1103/physrevapplied.13.014013
- (18) A. V. Taichenachev, V. I. Yudin, C. W. Oates, C. W. Hoyt, Z. W. Barber, and L. Hollberg, “Magnetic field-induced spectroscopy of forbidden optical transitions with application to lattice-based optical atomic clocks,” Phys. Rev. Lett., vol. 96, p. 083001, Mar 2006. [Online]. Available: https://link.aps.org/doi/10.1103/PhysRevLett.96.083001
- (19) M. Takamoto, F.-L. Hong, R. Higashi, and H. Katori, “An optical lattice clock,” Nature, vol. 435, no. 7040, pp. 321–324, may 2005.
- (20) Corning, “See corning technical broshure.” [Online]. Available: www.corning.com/ule.
- (21) J. I. Thorpe, K. Numata, and J. Livas, “Laser frequency stabilization and control through offset sideband locking to optical cavities,” Optics Express, vol. 16, no. 20, p. 15980, sep 2008.
- (22) T. Akatsuka, M. Takamoto, and H. Katori, “Optical lattice clocks with non-interacting bosons and fermions,” Nature Physics, vol. 4, no. 12, pp. 954–959, 2008. [Online]. Available: https://doi.org/10.1038/nphys1108
- (23) S. Häfner, S. Falke, C. Grebing, S. Vogt, T. Legero, M. Merimaa, C. Lisdat, and U. Sterr, “8 × 10^-17 fractional laser frequency instability with a long room-temperature cavity,” Optics Letters, vol. 40, no. 9, p. 2112, may 2015.
- (24) H. Katori, T. Ido, Y. Isoya, and M. Kuwata-Gonokami, “Magneto-optical trapping and cooling of strontium atoms down to the photon recoil temperature,” Phys. Rev. Lett., vol. 82, pp. 1116–1119, Feb 1999. [Online]. Available: https://link.aps.org/doi/10.1103/PhysRevLett.82.1116
- (25) J. L. Hall, M. S. Taubman, and J. Ye, “Laser stabilization,” in HANDBOOK OF OPTICS, Bass, Ed. New York: McGraw-Hill, 2001, vol. 4, ch. 27.
- (26) T. Nazarova, F. Riehle, and U. Sterr, “Vibration-insensitive reference cavity for an ultra-narrow-linewidth laser,” Applied Physics B, vol. 83, no. 4, pp. 531–536, may 2006.
- (27) F. Acernese, P. Amico, N. Arnaud, D. Babusci, R. Barillé, F. Barone, L. Barsotti, M. Barsuglia, F. Beauville, M. A. Bizouard, C. Boccara, F. Bondu, L. Bosi, C. Bradaschia, L. Bracci, S. Braccini, A. Brillet, V. Brisson, L. Brocco, D. Buskulic, G. Calamai, E. Calloni, E. Campagna, F. Cavalier, G. Cella, E. Chassande-Mottin, F. Cleva, T. Cokelaer, C. Corda, J. P. Coulon, E. Cuoco, V. Dattilo, M. Davier, R. D. Rosa, L. D. Fiore, A. D. Virgilio, B. Dujardin, A. Eleuteri, D. Enard, I. Ferrante, F. Fidecaro, I. Fiori, R. Flaminio, J. D. Fournier, S. Frasca, F. Frasconi, L. Gammaitoni, A. Gennai, A. Giazotto, G. Giordano, G. Guidi, H. Heitmann, P. Hello, P. Heusse, L. Holloway, S. Kreckelbergh, P. L. Penna, V. Loriette, M. Loupias, G. Losurdo, J. M. Mackowski, E. Majorana, C. N. Man, F. Marion, F. Martelli, A. Masserot, L. Massonnet, M. Mazzoni, L. Milano, J. Moreau, F. Moreau, N. Morgado, F. Mornet, B. Mours, J. Pacheco, A. Pai, C. Palomba, F. Paoletti, R. Passaquieti, D. Passuello, B. Perniola, L. Pinard, R. Poggiani, M. Punturo, P. Puppo, K. Qipiani, J. Ramonet, P. Rapagnani, V. Reita, A. Remillieux, F. Ricci, I. Ricciardi, G. Russo, S. Solimeno, R. Stanga, A. Toncelli, M. Tonelli, E. Tournefier, F. Travasso, H. Trinquet, M. Varvella, D. Verkindt, F. Vetrano, O. Veziant, A. Viceré, J. Y. Vinet, H. Vocca, and M. Yvert, “Properties of seismic noise at the virgo site,” Class. Quantum Grav., vol. 21, no. 5, pp. S433–S440, feb 2004. [Online]. Available: https://doi.org/10.1088/0264-9381/21/5/008
- (28) M. G. Tarallo, N. Poli, M. Schioppo, D. Sutyrin, and G. Tino, “A high-stability semiconductor laser system for a 88 sr-based optical lattice clock,” Applied Physics B, vol. 103, no. 1, pp. 17–25, 2011.
- (29) M. Barbiero, M. G. Tarallo, F. Rullo, M. Risaro, C. Clivati, D. Calonico, and F. Levi, “Inrim sr optical clock: an optically loaded apparatus for high-stability metrology,” in Proceedings of the “2021 Joint Conference of the European Frequency and Time Forum and IEEE International Frequency Control Symposium (EFTF/IFCS)”, 2021, p. 7233.
- (30) J. Bergquist, W. Itano, and D. Wineland, “Laser stabilization to a single ion,” in Frontiers in Laser Spectroscopy, T. Hansch and M. Inguscio, Eds. North Holland, 1992, pp. 359–376.
- (31) A. Quessada, R. P. Kovacich, I. Courtillot, A. Clairon, G. Santarelli, and P. Lemonde, “The dick effect for an optical frequency standard,” Journal of Optics B: Quantum and Semiclassical Optics, vol. 5, no. 2, pp. S150–S154, apr 2003.
- (32) R. Grimm, M. Weidemüller, and Y. B. Ovchinnikov, “Optical dipole traps for neutral atoms,” Advances in Atomic, Molecular and Optical Physics, vol. 42, pp. 95–170, 2000.
- (33) S. Dörscher, R. Schwarz, A. Al-Masoudi, S. Falke, U. Sterr, and C. Lisdat, “Lattice-induced photon scattering in an optical lattice clock,” Physical Review A, vol. 97, no. 6, Jun. 2018. [Online]. Available: https://doi.org/10.1103/physreva.97.063419
- (34) M. Barbiero, “Novel techniques for a strontium optical lattice clock,” Ph.D. dissertation, Politecnico of Turin, 2019. [Online]. Available: http://hdl.handle.net/11583/2750550
- (35) S. Blatt, J. W. Thomsen, G. K. Campbell, A. D. Ludlow, M. D. Swallows, M. J. Martin, M. M. Boyd, and J. Ye, “Rabi spectroscopy and excitation inhomogeneity in a one-dimensional optical lattice clock,” Phys. Rev. A, vol. 80, p. 052703, Nov 2009. [Online]. Available: https://link.aps.org/doi/10.1103/PhysRevA.80.052703
- (36) M. Pizzocaro, G. A. Costanzo, A. Godone, F. Levi, A. Mura, M. Zoppi, and D. Calonico, “Realization of an ultrastable 578-nm laser for an yb lattice clock,” IEEE transactions on ultrasonics, ferroelectrics, and frequency control, vol. 59, no. 3, pp. 426–431, 2012.
- (37) T. L. Nicholson, S. L. Campbell, R. B. Hutson, G. E. Marti, B. J. Bloom, R. L. McNally, W. Zhang, M. D. Barrett, M. S. Safronova, G. Strouse, W. L. Tew, and J. Ye, “Systematic evaluation of an atomic clock at 2 10-18 total uncertainty,” Nature Communications, vol. 6, 2015.
- (38) C. Lisdat, J. S. R. V. Winfred, T. Middelmann, F. Riehle, and U. Sterr, “Collisional losses, decoherence, and frequency shifts in optical lattice clocks with bosons,” Physical Review Letters, vol. 103, no. 9, p. 090801, aug 2009.
- (39) M. D. Swallows, M. J. Martin, M. Bishof, C. Benko, Y. Lin, S. Blatt, A. M. Rey, and J. Ye, “Operating a 87Sr optical lattice clock with high precision and at high density,” IEEE Transactions on Ultrasonics, Ferroelectrics, and Frequency Control, vol. 59, no. 3, pp. 416–425, 2012.
- (40) We recalculated the coefficient from Lisdat2009 using the correct expressions for and according to Swallows12 . The new value is Hz m3 assuming a temperature of 4 K. The discrepancy can be eliminated assuming a temperature of 2 K.
- (41) S. G. Porsev and A. Derevianko, “Multipolar theory of blackbody radiation shift of atomic energy levels and its implications for optical lattice clocks,” Physical Review A, vol. 74, no. 2, p. 020502, 2006.
- (42) C. Hagemann, C. Grebing, T. Kessler, S. Falke, N. Lemke, C. Lisdat, H. Schnatz, F. Riehle, and U. Sterr, “Providing short-term stability of a laser to optical clocks,” IEEE Transactions on Instrumentation and Measurement, vol. 62, no. 6, pp. 1556–1562, 2013.
- (43) P. Barbieri, C. Clivati, M. Pizzocaro, F. Levi, and D. Calonico, “Spectral purity transfer with 5 × 10-17 instability at 1 s using a multibranch er:fiber frequency comb,” Metrologia, vol. 56, no. 4, p. 045008, jul 2019. [Online]. Available: https://doi.org/10.1088/1681-7575/ab2b0f
- (44) M. G. Tarallo, “Toward a quantum-enhanced strontium optical lattice clock at inrim,” EPJ Web of Conferences, vol. 230, p. 00011, 2020. [Online]. Available: http://dx.doi.org/10.1051/epjconf/202023000011
- (45) H. Liu, S. B. Jäger, X. Yu, S. Touzard, A. Shankar, M. J. Holland, and T. L. Nicholson, “Rugged mhz-linewidth superradiant laser driven by a hot atomic beam,” Phys. Rev. Lett., vol. 125, p. 253602, Dec 2020. [Online]. Available: https://link.aps.org/doi/10.1103/PhysRevLett.125.253602