Ultra-broadband photonic sampling of optical waveforms
Direct access to the electric field of light[1] provides a subcycle view of the polarization response of matter[2], thus enabling sensitive metrology in physics[3, 4, 5, 6, 7], chemistry[8], and medicine[9, 10]. Optical-field sampling techniques take advantage of some process that lasts much less than an optical cycle of the measured light wave. Most of them rely on the generation of free electrons either by a weak extreme ultraviolet pulse[11, 12, 13] or by a strong optical pulse[14, 15, 16, 17, 18, 19]. The ability of such techniques to detect weak signals is limited by undesirable effects associated with ionization. An alternative is all-optical methods, where the fast process is a nonlinear wave mixing. Such photonic methods may rely on extreme ultraviolet[20, 21, 22] or optical pulses [23, 24, 25, 26]. They typically have better sensitivity[23, 27, 10], but smaller bandwidth. Here we propose generalized heterodyne optical-sampling techniques (GHOSTs), which overcome the bandwidth limit through controlling light-pulse waveforms.
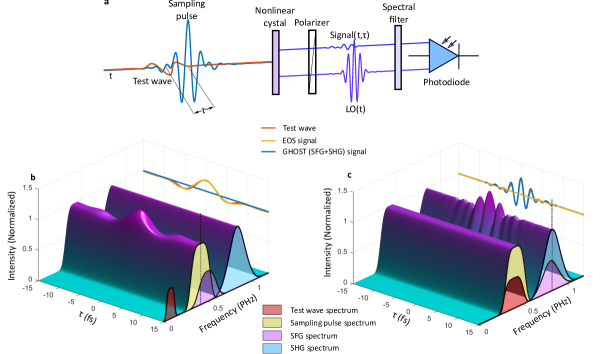
Let us review the fundamental form of nonlinear-optics-based field-sampling techniques that exist for the infrared and terahertz domains (see Fig. 1). In these techniques, the field that is being sampled (test field) undergoes nonlinear wave mixing with a sampling pulse that creates a temporal gate. The outcome of this nonlinear interaction is referred to as heterodyne signal or, for brevity, simply signal, even though this is not yet the outcome of the measurement. This signal is first made to interfere with the local oscillator (LO), which is what the sampling pulse becomes after transmission through the same nonlinear medium in the absence of the test field. In a spectral region where the signal and the LO overlap, the spectral intensity of their superposition depends on the delay between the test and sampling pulses. Two prominent examples of such measurement techniques are electro-optic sampling (EOS)[23, 24] and air-biased-coherent-detection (ABCD)[25, 26]. In EOS, the signal is produced from sum and difference frequency generation between the test waveform and sampling pulse, and the LO is provided by the unperturbed sampling pulse [28, 24]. In ABCD, the signal is the result of four-wave mixing, summing two photons from the sampling pulse and subtracting one from the test waveform, while the LO is provided by field-induced second harmonic generation: a bias applied to the nonlinear medium allows it to combine two sampling-pulse photons even if the medium is centrosymmetric. The phase of the nonlinearly-created local oscillator is modulated by changing the direction of the bias field. This modulation creates sidebands of the LO which interfere with the signal, thus enabling heterodyne detection of pulses over a continuous range from the THz through the mid infrared.[25].
In addition to the spectral overlap between the signal and the LO, these schemes had to satisfy two key requirements: 1: only one photon from the test waveform is involved in the generation of the signal, and 2: the same number of photons from the sampling pulse is involved in forming the LO and signal. The former one is necessary for linear detection of the field. The latter one ensures that the interference between the signal and the LO is insensitive to the carrier-envelope phase (CEP) of the sampling pulse, which is known as the global phase[29] for arbitrary waveforms. If requirement 2 is satisfied, the phase cancels during heterodyne detection, meaning that sampling pulses with unstable CEP can be used. When both these requirements are fulfilled, the interference between the signal and local oscillator has an amplitude and phase determined by the test waveform, and varying the delay between the pulses while recording the resulting intensity measures the electric field of the test waveform.
Requirement 2 is responsible for the primary limit on the maximum detection frequency of the techniques: since the signal and LO wavelengths must match, and the signal frequency is shifted by the frequency of the test waveform, it cannot exceed the bandwidth of the local oscillator. However, the emergence of CEP-stabilized mode-locked laser oscillators allows us to bypass this restriction. For example, using second harmonic generation to form the LO for a signal based on sum-frequency generation, i. e., adding one more photon from the sampling pulse to the LO of EOS, increases the frequency of the detection band by the carrier frequency of the sampling pulse. We label this GHOST as SFG+SHG. A -fs sampling pulse at 400 THz carrier frequency and 200-THz bandwidth, capable of detecting 0-200 THz via EOS, could in principle detect 100-700 THz via SFG+SHG (Fig. 1) or 900-1500 THz via DFG+SHG. Other GHOSTs, on the other hand, may in principle be used to detect even higher spectral components. Employing CEP-stable pulses, the detection bandwidth and spectral ranges can be expanded and tailored by choosing appropriate combinations of GHOSTs, and detection frequencies (see SI). The price that one pays for this is that the phases of the LO and signal experience a different phase shift upon a change of the CEP of the sampling pulse. As a result, a phase shift is applied to the measured waveform, where is the number of sampling pulse photons summed over to arrive at the signal, is the number summed over to obtain the LO, and is 1 or -1 depending on the mixing process, and is the CEP of the sampling pulse (for further details, see SI).
In both EOS and ABCD, , while in the SFG+SHG GHOST, . This has a straightforward interpretation in the time domain: in any linear electric-field measurement, the detected waveform is the convolution of the true electric field with the response function of the detection system. The addition of an unbalanced photon in the detection scheme causes this response function to oscillate in time, which allows for the detection of more rapidly varying fields, but repeated measurements of fields with reproducible (CEP-stabilized) waveforms will average to zero if is not stabilized.
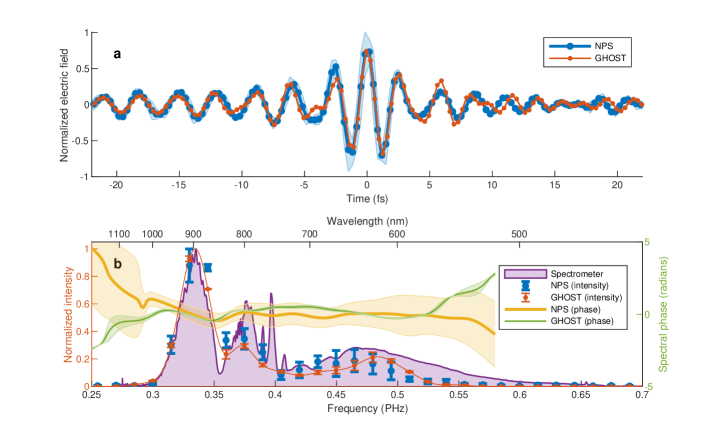
To confirm the validity of the concept, we experimentally investigated the “SFG/DFG+THG” GHOST, where sum-frequency generation (SFG) and difference-frequency generation (DFG) together form the heterodyne signal, while third-harmonic generation (THG) forms the local oscillator (see SI for further details). As a nonlinear medium that possesses both and nonlinearities, we chose a thin quartz crystal (see SI for details) for its low absorption and dispersion. For detection, we used a bandpass filter that transmitted light between 0.83 PHz and 0.86 PHz (see SI). Even though this frequency range is in the middle of the second harmonic of the sampling pulse, the orientations of the crystal and the polarizer were chosen such that only the nonlinearity contributed to the local oscillator. We benchmarked this implementation of GHOST against nonlinear photoconductive sampling (NPS)[18], which is a field-sampling technique where temporal gating is achieved through highly nonlinear photoinjection of charge carriers. Both GHOST and NPS measurements were performed using a 2.7-fs sampling pulse[18], and we used theoretical response functions to retrieve time-dependent electric field from the raw measured data (see SI for details). The benchmarking results are shown in Fig. 2. In the time domain (Fig. 2a), the two waveforms have very similar shapes: the Pearson correlation coefficient between the waveforms is . Note that GHOST measurements show much smaller stochastic fluctuations—the peak standard deviation is 10 times smaller than that in the NPS measurements. Also in the frequency domain (Fig. 2b), we see that spectral intensities and spectral phases have much smaller fluctuation in the GHOST measurement, as compared to the NPS one. The spectra of both electric-field waveforms agree well with the spectrum obtained with a calibrated grating spectrometer (Ocean Optics).
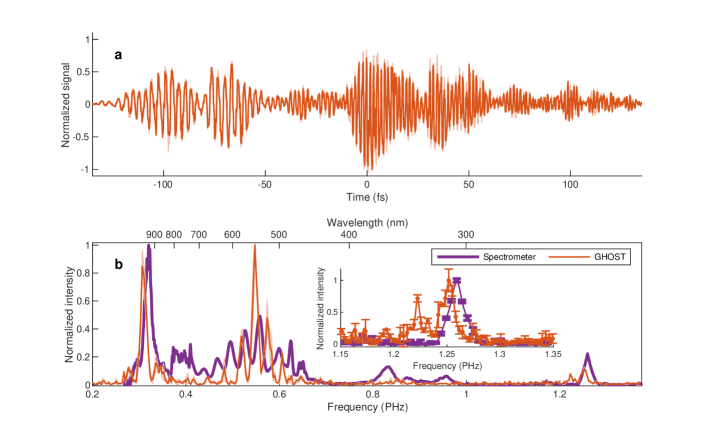
The benchmarking results shown in Fig. 2 confirm only the validity of the SFG+THG GHOST — to validate the DFG+THG GHOST, the spectrum of the test pulse must extend well above the frequencies that reach the photodiode. As a simple estimation, let us take 0.3 PHz as the lowest frequency present in the sampling pulse and 0.8 PHz as the detection frequency. In this case, we expect the spectral range covered by the DFG+THG GHOST to begin at 1.1 PHz. So, we upconverted the test pulse in a 100 µm BBO crystal, obtaining pulses with a spectrum that extended up to 1.25 PHz (see section 4 of SI). We plot the GHOST waveform in Fig. 3a (here, no attempt is made to account for the theoretical response function). In Fig. 3b, we compare the spectrum of the detected waveform with the spectrum that we measured with a grating spectrometer. The inset displays the spectral range that is relevant to the DFG+THG GHOST. While there are discrepancies between the two spectra, and a careful benchmarking in this spectral range is yet to be done, we conclude that our implementation of GHOST is capable of optical-field sampling at frequencies that exceed 1 PHz.
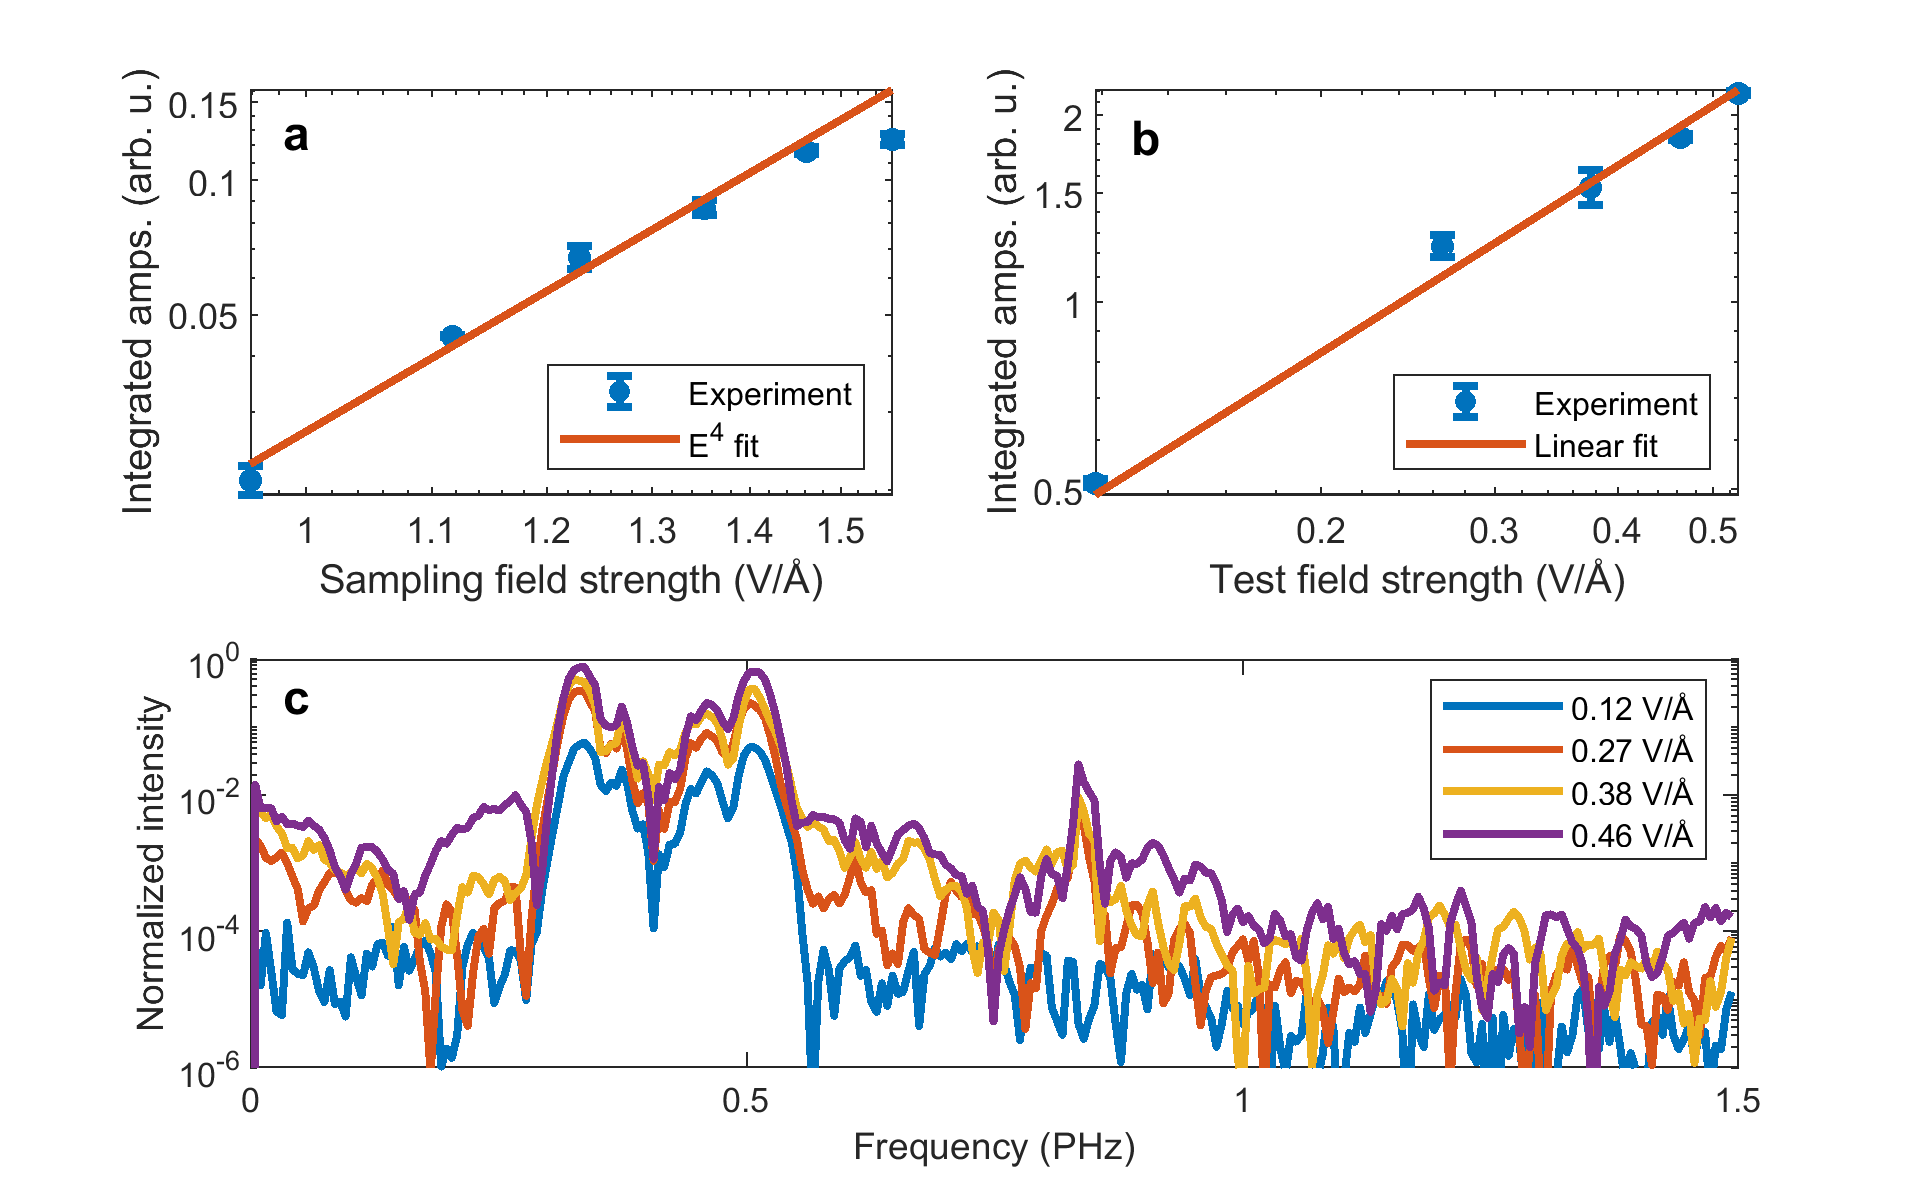
As an additional verification that we indeed implemented the SFG/DFG+THG GHOST, we investigated how the measured waveforms depend on the peak strengths of the incident sampling and test pulses. The results are show in Fig. 4. As expected, the amplitudes of measured waveforms scale as the fourth power of the peak sampling field, . Indeed, each photon in the heterodyne signal emerges with the involvement of one photon from the sampling pulse, while each photon in the local oscillator emerges from a three-photon nonlinear process. Thus, the electric field of the heterodyne signal scales linearly with , the electric field of the local oscillator scales as , and the interference between the two fields makes the intensity oscillate with an amplitude that is proportional to . We observe this dependence up to sampling fields as strong as 1.5 V/Å (see Fig. 4a). At this field strength, multiphoton photoinjection of charge carriers becomes significant. According to Fig. 4b, the amplitude of the measured waveforms scales linearly up to test fields as strong as 0.5 V/Å. Nevertheless, Fig. 4c shows that already the 0.27-V/Å test pulse produces a waveform that has high-frequency components that are absent in the waveform measured with the 0.12-V/Å test pulse. From Fig. 4c, we can also estimate a typical signal-to-noise ratio (SNR) of our measurements. By comparing the noise baseline with the peak signal strength, we obtain an intensity SNR of approximately 30 dB independently of the test-field strength, which indicates that, in these measurements, the noise was dominated by the fluctuations of laser intensity. Future improvements (e.g., using a balanced detection scheme) may further improve the SNR.
In summary, generalized heterodyne optical-sampling techniques present a promising approach for measuring electric fields of broadband laser pulses. We studied one particular combination of nonlinear optical processes: “SFG/DFG + THG”, where the nonlinearity mixed the sampling and test waves, thus generating a heterodyne signal, while the third harmonic of the sampling pulse provided a local oscillator. This fidelity of this technique was much higher than that of nonlinear photoconductive sampling. In principle, petahertz bandwidth is achievable with GHOST. The spectral response of GHOST can be tailored for a particular application through the choice of nonlinear processes and the frequency range that reaches the photodetector. Any medium that exhibits the required nonlinearities, such as solids or gases, could be used for waveform sampling. Since they rely on low-order nonlinearities, GHOSTs can be used with a broad variety of laser systems that produce pulses with a stabilized carrier-envelope phase.
Direct time-domain measurements of light-matter interaction with sub-cycle resolution are at the forefront of attosecond science. These new techniques for direct electric field measurement present new opportunities for highly sensitive time-resolved spectroscopy and for the extension of field-resolved metrology to new regimes of both wavelength and intensity. The flexibility offered in terms of signal photon energy, detection band, and nonlinear optical processes provides an opportunity for field measurements to be integrated into a variety of new investigations.
Acknowledgements
This research is based upon work supported by the US Air Force Office of Scientific Research under award number FA9550-16-1-0073. This work was partially supported by the Air Force Office of Scientific Research (MURI, grant FA9550-14-1-0389 and grant FA9550-16-1-0156), by the Munich Centre for Advanced Photonics, and by the IMPRS-APS. N.K. was partially supported by the FISR-CNR project “TECNOMED—Tecnopolo di nanotecnologia e fotonica per la medicina di precision”. The authors thank Matthew Weidman for helpful discussions and Ferenc Krausz for initiating the research that created the prerequisites for this study as well as for helpful discussions.
Author contributions statement
D.Z. proposed the concept and performed the measurements with the support of N.K. The data analysis was performed by D.Z., N.K. and V.S.Y. The theoretical simulations were conducted by D.Z. and N.K with the support of V.S.Y. The manuscript was written by N.K, D.Z and V.S.Y.
Methods
The laser system used for the experiments (more details in section 1 of SI) comprises a Ti:sapphire oscillator (Rainbow 2, Spectra Physics), followed by chirped pulse amplification to 1 mJ pulse energy at 3 kHz repetition rate, further spectral broadening in a hollow-core fiber and a chirped mirror compressor.
The experimental data acquisition (more details in section 2 of SI) was performed with a dual-phase lock-in amplifier (SR-830, Stanford Research Systems) as well as with a grating spectrometer (Ocean optics).
References
- [1] Kienberger, R. et al. Atomic transient recorder. \JournalTitleNature 427, 817–821, DOI: 10.1038/nature02277 (2004).
- [2] Sommer, A. et al. Attosecond nonlinear polarization and light–matter energy transfer in solids. \JournalTitleNature 534, 86–90, DOI: 10.1038/nature17650 (2016).
- [3] Hohenleutner, M. et al. Real-time observation of interfering crystal electrons in high-harmonic generation. \JournalTitleNature 523, 572–575, DOI: 10.1038/nature14652 (2015).
- [4] Kuehn, W. et al. Coherent ballistic motion of electrons in a periodic potential. \JournalTitlePhys. Rev. Lett. 104, 146602, DOI: 10.1103/PhysRevLett.104.146602 (2010).
- [5] Gaal, P. et al. Internal motions of a quasiparticle governing its ultrafast nonlinear response. \JournalTitleNature 450, 1210–1213, DOI: 10.1038/nature06399 (2007).
- [6] Ulbricht, R., Hendry, E., Shan, J., Heinz, T. F. & Bonn, M. Carrier dynamics in semiconductors studied with time-resolved terahertz spectroscopy. \JournalTitleReviews of Modern Physics 83, 543–586, DOI: 10.1103/revmodphys.83.543 (2011).
- [7] Schlaepfer, F. et al. Attosecond optical-field-enhanced carrier injection into the gaas conduction band. \JournalTitleNature Physics 14, 560–564, DOI: 10.1038/s41567-018-0069-0 (2018).
- [8] Kowalewski, M., Bennett, K., Rouxel, J. R. & Mukamel, S. Monitoring nonadiabatic electron-nuclear dynamics in molecules by attosecond streaking of photoelectrons. \JournalTitlePhys. Rev. Lett. 117, 043201, DOI: 10.1103/PhysRevLett.117.043201 (2016).
- [9] Huber, M. et al. Stability of person-specific blood-based infrared molecular fingerprints opens up prospects for health monitoring. \JournalTitleNature Communications 12, DOI: 10.1038/s41467-021-21668-5 (2021).
- [10] Pupeza, I. et al. Field-resolved infrared spectroscopy of biological systems. \JournalTitleNature 577, 52–59, DOI: 10.1038/s41586-019-1850-7 (2020).
- [11] Hentschel, M. et al. Attosecond metrology. \JournalTitleNature 414, 509–513, DOI: 10.1038/35107000 (2001).
- [12] Itatani, J. et al. Attosecond streak camera. \JournalTitlePhys. Rev. Lett. 88, 173903, DOI: 10.1103/PhysRevLett.88.173903 (2002).
- [13] Goulielmakis, E. et al. Direct measurement of light waves. \JournalTitleScience 305, 1267–1269, DOI: 10.1126/science.1100866 (2004). https://science.sciencemag.org/content/305/5688/1267.full.pdf.
- [14] Thunich, S., Ruppert, C., Holleitner, A. W. & Betz, M. Field-resolved characterization of femtosecond electromagnetic pulses with 400 thz bandwidth. \JournalTitleOpt. Lett. 36, 1791–1793, DOI: 10.1364/OL.36.001791 (2011).
- [15] Schiffrin, A. et al. Optical-field-induced current in dielectrics. \JournalTitleNature 493, 70–74, DOI: 10.1038/nature11567 (2012).
- [16] Park, S. B. et al. Direct sampling of a light wave in air. \JournalTitleOptica 5, 402–408, DOI: 10.1364/OPTICA.5.000402 (2018).
- [17] Kubullek, M. et al. Single-shot carrier–envelope-phase measurement in ambient air. \JournalTitleOptica 7, 35, DOI: 10.1364/optica.7.000035 (2020).
- [18] Sederberg, S. et al. Attosecond optoelectronic field measurement in solids. \JournalTitleNature Communications 11, 430, DOI: 10.1038/s41467-019-14268-x (2020).
- [19] Zimin, D. et al. Petahertz-scale nonlinear photoconductive sampling in air. \JournalTitleOptica 8, 586, DOI: 10.1364/optica.411434 (2021).
- [20] Kim, K. T. et al. Petahertz optical oscilloscope. \JournalTitleNature Photonics 7, 958–962, DOI: 10.1038/nphoton.2013.286 (2013).
- [21] Wyatt, A. S. et al. Attosecond sampling of arbitrary optical waveforms. \JournalTitleOptica 3, 303–310, DOI: 10.1364/OPTICA.3.000303 (2016).
- [22] Carpeggiani, P. et al. Vectorial optical field reconstruction by attosecond spatial interferometry. \JournalTitleNature Photonics 11, 383–389, DOI: 10.1038/nphoton.2017.73 (2017).
- [23] Leitenstorfer, A., Hunsche, S., Shah, J., Nuss, M. C. & Knox, W. H. Detectors and sources for ultrabroadband electro-optic sampling: Experiment and theory. \JournalTitleApplied Physics Letters 74, 1516–1518, DOI: 10.1063/1.123601 (1999).
- [24] Keiber, S. et al. Electro-optic sampling of near-infrared waveforms. \JournalTitleNature Photonics 10, 159–162, DOI: 10.1038/nphoton.2015.269 (2016).
- [25] Karpowicz, N. et al. Coherent heterodyne time-domain spectrometry covering the entire “terahertz gap”. \JournalTitleApplied Physics Letters 92, 011131, DOI: 10.1063/1.2828709 (2008). https://aip.scitation.org/doi/pdf/10.1063/1.2828709.
- [26] Dai, J., Xie, X. & Zhang, X.-C. Detection of broadband terahertz waves with a laser-induced plasma in gases. \JournalTitlePhysical Review Letters 97, DOI: 10.1103/physrevlett.97.103903 (2006).
- [27] Riek, C. et al. Direct sampling of electric-field vacuum fluctuations. \JournalTitleScience 350, 420–423, DOI: 10.1126/science.aac9788 (2015). https://science.sciencemag.org/content/350/6259/420.full.pdf.
- [28] Porer, M., Ménard, J.-M. & Huber, R. Shot noise reduced terahertz detection via spectrally postfiltered electro-optic sampling. \JournalTitleOpt. Lett. 39, 2435–2438, DOI: 10.1364/OL.39.002435 (2014).
- [29] Hassan, M. T. et al. Optical attosecond pulses and tracking the nonlinear response of bound electrons. \JournalTitleNature 530, 66–70, DOI: 10.1038/nature16528 (2016).