Improving the Low-Energy Transient Sensitivity of AMEGO-X using Single-Site Events
Abstract
AMEGO-X, the All-sky Medium Energy Gamma-Ray Observatory eXplorer, is a proposed instrument designed to bridge the so-called “MeV gap” by surveying the sky with unprecedented sensitivity from 100 keV to about one GeV. This energy band is of key importance for multi-messenger and multi-wavelength studies but it is nevertheless currently under-explored. AMEGO-X addresses this situation by proposing a design capable of detecting and imaging gamma rays via both Compton interactions and pair production processes. However, some of the objects that AMEGO-X will study, such as gamma-ray bursts and magnetars, extend to energies below 100 keV where the dominant interaction becomes photoelectric absorption. These events deposit their energy in a single pixel of the detector. In this work we show how the 3500 cm2 effective area of the AMEGO-X tracker to events between 25 keV to 100 keV will be utilized to significantly improve its sensitivity and expand the energy range for transient phenomena. Although imaging is not possible for single-site events, we show how we will localize a transient source in the sky using their aggregate signal to within a few degrees. This technique will more than double the number of cosmological gamma-ray bursts seen by AMEGO-X, allow us to detect and resolve the pulsating tails of extragalactic magnetar giant flares, and increase the number of detected less-energetic magnetar bursts —some possibly associated with fast radio bursts. Overall, single-site events will increase the sensitive energy range, expand the science program, and promptly alert the community of fainter transient events.
1 Introduction
Gamma-ray observations have played a central role in multi-messenger astronomy. The detection of the gamma-ray burst GRB 170817A by Fermi-GBM shortly after the gravitational wave signal GW170817 (Abbott et al., 2017), and the gamma-ray flare from the blazar TXS 0506+056 seen by Fermi-LAT in coincidence the high-energy neutrino IceCube-170922A (Aartsen et al., 2018) resulted in unique insights which would not have been possible otherwise. In the near future, gamma-ray transients will also be critical for attaining counterparts to gravitational wave signals and understanding the details of neutron star mergers (Burns et al., 2019). Gamma-ray observations also provide critical information needed to understand the physics of cosmic ray acceleration and the sources that produce these energetic charges (Orlando, 2017; Resconi et al., 2017; Ojha et al., 2019; Orlando et al., 2019; Venters et al., 2019a, b).
Despite this success, there is a portion of the gamma-ray spectrum that remains relatively unexplored. The so-called “MeV gap”, from approximately 0.1 MeV to 100 MeV, has not been studied with the same sensitivity as the neighboring energies, lagging behind by more than order of magnitude in flux. There is also great discovery potential in this energy range, in part due to the fact that some classes of AGN (e.g., Fossati et al., 1998; Paliya et al., 2019; Venters et al., 2019b; Rani et al., 2019; Meyer et al., 2019), magnetars in quiescence (e.g., Mereghetti, 2008; Turolla et al., 2015; Wadiasingh et al., 2019), rotation-powered pulsars (e.g., Kuiper & Hermsen, 2015; Harding et al., 2019) and topical systems involving pulsar winds and leptonic pevatrons (de Jager et al., 1996; Dubus, 2013; Kargaltsev et al., 2013, 2015; Slane, 2017; An et al., 2017; Gelfand et al., 2019; Di Mauro et al., 2019; van der Merwe et al., 2020; An et al., 2020; Clark et al., 2021; Wadiasingh et al., 2021; An, 2021) have a peak energy output in the 0.1-100 MeV band. Moreover, MeV observations can be constraining to some models and sectors of particle dark matter (e.g., Caputo et al., 2019; Fortin et al., 2021).
AMEGO-X111https://asd.gsfc.nasa.gov/amego-x is a proposed mission capable of surveying the sky with unprecedented sensitivity at these energies (Fleischhack, 2021), more than an order of magnitude better compared to its predecessors (Schönfelder et al., 1984). As explained in Section 2, AMEGO-X is equipped with a silicon pixel tracker and a cesium iodide scintillator calorimeter, tuned to detect gamma-ray photons both through Compton scattering interactions (100 keV to 10 MeV) and electron-positron pair production (10 MeV to 1 GeV). Two or more hits on either the tracker or the calorimeter allow for distinguishing between these two types of events, and for the reconstruction of the direction and energy of the incident photon. AMEGO-X builds upon the AMEGO concept (McEnery et al., 2019), with a reduced energy threshold, improved sensitivity at GeV energies, and a smaller and lighter detector.
The science enabled by AMEGO-X is vast and varied. While the measurements in the MeV band will be crucial, some of the sources of interest have a spectral distribution that extends below the energy threshold for Compton events. As discussed in Section 4, the energy output of some of these sources peaks below 200 keV. This is the case of some gamma-ray burst (GRBs), magnetar giant flare (MGFs) tails, and recurrent magnetar short bursts —such as those associated with a fast radio burst in SGR 1935+2154 (Gruber et al., 2014; Collazzi et al., 2015; Mereghetti et al., 2020; Bochenek et al., 2020; CHIME/FRB Collaboration et al., 2020; Burns et al., 2021; Svinkin et al., 2021; Hurley et al., 2005; Li et al., 2021; Younes et al., 2021; Hurley et al., 1999; Mazets et al., 1999a; Feroci et al., 1999). Extending the energy range of AMEGO-X to lower energies will significantly enhance its capacity to study these different source classes.
In this work we demonstrate that it is possible to extend the energy range of AMEGO-X down to 25 keV using single-site events (SSE). These are events that produce a single hit, in most cases due to photoelectric absorption. The cross section for this type of interaction increases rapidly below 200 keV.
We show in Section 3 how the large effective area between 25 keV and 100 keV allows us to achieve a competitive performance for transient events of up to 100 s duration. Moreover, despite the fact that, by definition, SSE leave no tracks and therefore event-by-event direction reconstruction is not possible, we show how the spatial distribution of the SSE in the detector can be used to constrain the location of a burst like GRB 170817A to within a 2∘ radius.
Leveraging the information from SSE will enhance the AMEGO-X capabilities overall. It will enlarge the observable volume and increase the rate of detected GRBs and other transients, supporting the multi-wavelength and multi-messenger efforts of the astronomy and astroparticle communities. We will be able to measure energy spectra down to tens of keV, improving our ability to reject or support theoretical models. This spectral extension will assist AMEGO-X in its goal of significantly improving our knowledge of transient sources in the MeV band.
2 The AMEGO-X mission
The AMEGO-X Gamma-Ray Telescope (GRT) consists of a silicon pixel Tracker, a hodoscopic Cesium Iodide (CsI) Calorimeter, surrounded by a plastic anti-coincidence detector (ACD), as shown in Figure 1 (a). The GRT consists of four identical detection towers each with a Tracker and Calorimeter Module. The Tracker Module has 40 layers, each measuring cm2 and separated by 1.5 cm, composed of monolithic complementary metal-oxide-semiconductor (CMOS) active pixel sensors (APS). The Calorimeter consists of 4 layers, each with 25 mm3 CsI bars, modelled after the Fermi-LAT calorimeter.
To operate as a telescope sensitive to Compton scattering and pair production interactions across four decades of energy, AMEGO-X requires a large instrumented area, with high stopping power, and good position and energy resolution in the sensitive detector volumes. The GRT design is similar to Fermi-LAT, although it is optimized for the low MeV range with a 3D position-sensitive Tracker and does not have conversion foils (Atwood et al., 2009). Specifically, the main functionality of the Tracker is to measure the energy and position of gamma-ray Compton scatter and pair-conversion charged-particle interactions with high precision. As seen in Figure 1 these type of interactions are denominated Compton events —either tracked (TC) or untracked (UC), depending on whether or not the direction of the scattered electron can be determined— and pair events (P) respectively. The AMEGO-X instrument is further described in Fleischhack (2021).
AMEGO-X leverages more than 10 years of development in CMOS monolithic APS technology from the ground-based particle physics experiments (Perić et al., 2021). The Tracker detectors are based on the AstroPix project (Brewer et al., 2021) which has optimized the ATLASPix detector design (Peric, 2012) for gamma-ray applications. Each AMEGO-X Tracker layer contains an array of 380 AstroPix cm APS chips, each with pixels, where the pixel size is mm2. The APS are 0.5 mm thick and operate at full depletion. Each interaction within the Tracker is recorded as the energy deposited (25-700 keV) and the pixel location (0.5 mm3 resolution). The low detector threshold of 25 keV allowed by the Tracker APS and the ability to obtain three-dimensional spatial information are two key features of the AstroPix detector that enabled this work.
The main trigger criteria requires at least two detected hits on either the tracker or the calorimeter, resulting from Compton or pair-production interactions. At energies below the Compton regime (100 keV), photons predominantly undergo photoelectric absorption and their energy is deposited in a single pixel. With the high gamma-ray backgrounds at these energies and no imaging capabilities, single-site events (SSE) are dominated by background for most observations and are not continously recorded due to prohibitively high data rates (see Section 3.2). SSE are instead saved into a temporary buffer, and short duration (100 seconds) readouts are initiated when the on-board Transient Alert (TA) logic identifies a significant rate increase above the background.
The AMEGO-X on-board TA logic is based on Fermi-GBM algorithms (Paciesas et al., 2012). This capability allows to measure emission down to 25 keV and expands the portfolio of astrophysical phenomena beyond the previously conceived sensitivity to include lower-energy transients, especially GRBs, giant magnetar flares, and magnetar short bursts, as discussed in Section 4. AMEGO-X will send rapid alerts via the Tracking and Data Relay Satellite System (TDRSS) Demand Access within 30 seconds to the Gamma-ray Coordinates Network (GCN) enabling multi-wavelength follow-up.
3 Single-site events performance
The response of the AMEGO-X instrument has been simulated using the Medium-Energy Gamma-ray Astronomy library (MEGAlib) software package222Available at https://megalibtoolkit.com/home.html, a standard tool in MeV astronomy (Zoglauer et al., 2006). MEGAlib is based on GEANT4 (Agostinelli et al., 2003) and is able to simulate the emission from a source, the passage of particles through the spacecraft and their energy deposits in the detector. It also performs event reconstruction, imaging analysis and allows to estimate the background rates from different expected components.
The knowledge of the effective area and the expected background is critical to understand the advantages of utilizing SSE over only considering Compton and pair events. We estimate the sensitivity ratio between these two cases for various spectral hypotheses which leads to the realization that some types of studies are only possible when SSE are considered, as described in Section 4.
In this section we also describe the expected localization performance for burst-like events using the aggregate signal from SSE. This will allow AMEGO-X to provide sky localization information —critical for multi-messenger and multi-wavelength detection— even for soft-spectrum sources with a low signal in the Compton channel.
3.1 Effective area
The ability to perform imaging analysis reduces the background and increases the sensitivity of an instrument. Although this is not an option for SSE, the increase in background with respect to Compton and pair events is well compensated by the large effective area to this type of events. Each tracker layer has a physical area of approximately 6400 cm2, and together they efficiently absorb these low-energy photons.
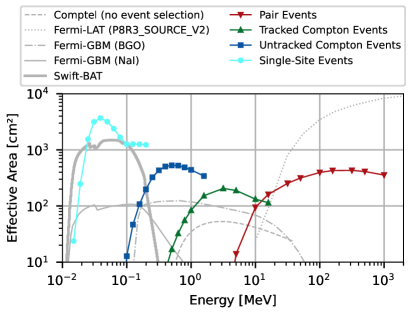
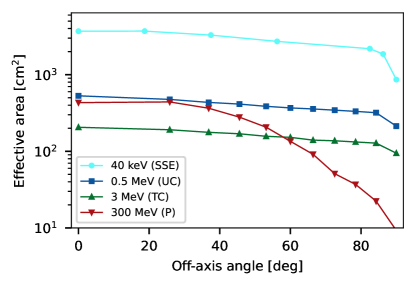
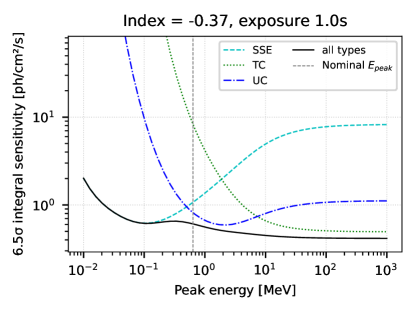
Figures 2 and 3 show the effective area for the various types of events AMEGO-X will be able to detect (see Section 2), as a function of energy and the off-axis angle, respectively. The effective area for SSE peaks at about 40 keV with 3700 cm2. This is about an order of magnitude greater than the effective area for UC events, the lowest energy events for which imaging is possible. In the 30-200 keV range, AMEGO-X’s effective area is more than an order of magnitude greater than a single NaI detector of Fermi-GBM. Although the Fermi-GBM utilizes 12 such detectors, they have different pointings and therefore in all cases the total effective area always falls below that of AMEGO-X. This exemplifies why AMEGO-X will be able to detect fainter sources in this energy range compared to current detectors.
3.2 Background
We use MEGAlib to predict and simulate the average background AMEGO-X will observe during flight, including both instrumental and astrophysical components. The background simulations included prompt and delayed (activation-induced radioactive decays inside the instrument) emission from primary cosmic-ray electrons and positrons (Mizuno et al., 2004), protons and helium nuclei (Kruglanski et al., 2010), extra-galactic diffuse gamma-ray emission (Gruber et al., 1999), and Albedo emission, i.e. secondary particles produced in the Earth’s atmosphere, including neutrons (Kole et al., 2015), electrons and positrons (Alcaraz et al., 2000; Mizuno et al., 2004), X-ray and gamma-ray photons (Türler, M. et al., 2010; Mizuno et al., 2004; Abdo et al., 2009; Harris et al., 2003), and protons (Mizuno et al., 2004). Cosmic-ray electrons and protons trapped in the Earth’s geomagnetic field (Kruglanski et al., 2010) only contribute via delayed emission, as their prompt emission is negligible outside the SAA, inside of which data-taking will be paused. The current AMEGO-X background model does not yet include the Galactic diffuse component. We assumed a 575 km orbit with an inclination of 6∘.
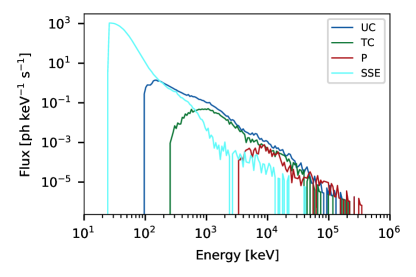
Figure 4 shows the expected measured background spectra for the four different event types. The statistical fluctuations are due to the short simulation time. In general, calculation of the SSE background is very computationally expensive, and so we use a simulation time of 60 seconds for this event type (a long enough exposure to cover short and long GRBs) and 1 hr for the rest. For SSE the background counts rate between 25 - 100 keV is 23 kHz. For comparison, the background counts rate for UC events in the energy range 25 - 100 keV (100 keV - 1 MeV) is 2 Hz ( 330 Hz).
3.3 Sensitivity
In order to estimate the sensitivity we define the signal-to-noise ratio (SN) as
| (1) |
where is the number of signal counts and is the number of background counts. The SN is computed for each event type, and then sum in quadrature if needed. We chose a conservative threshold for detection corresponding to a false alarm rate of yr-1. For a point-like source, we have and , where is the energy-integrated gamma-ray particle flux, averaged over the observing time , is the spectrum-averaged effective area determined from simulations, and is the background rate, also determined from simulation. and depend on the event type in question (SSE or UC). For a given signal-to-noise ratio and event type , and fixed spectral shape, we can solve for to determine the minimum flux that would produce a detection.
We estimate the sensitivity for a fiducial 1 s burst at 30∘ off-axis as using only SSE between 25 keV and 100 keV. In Section 4 we discuss in detail the sensitivity for various realistic models of GRBs and magnetars.
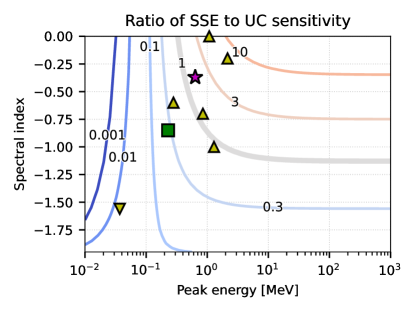
The gain in sensitivity by including SSE events in a given analysis depends on the spectral characteristics of the source. Figure 5 shows the ratio between SSE and UC sensitivity for bursts with characteristic Comptonized energy spectra modeled as
| (2) |
where is the peak energy, is the low-energy spectral index and is the arbitrary pivot energy. In general, the analysis of sources with either keV or benefit significantly from the inclusion of SSE, as well as some other combinations. Observe that the Comptonized form in Eq. 2 is well suited to describing many GRB and magnetar burst spectra.
3.4 Localization
AMEGO-X is capable of reconstructing the direction of a single photon if its passage through the instrument leaves at least two energy deposits 25 keV, whether on two or more tracker layers, or on a single tracker layer and the calorimeter. These photons typically have an energy 100 keV and interact due to either Compton scattering or pair production. Using this information AMEGO-X will localize a transient source (5 between 120 keV and 1 MeV, 1 s in duration) within a radius (90% cont).
Single-site events, on the other hand, are primarily due to photoelectric interactions and by definition lack any track. The only information recorded is their deposited energy, time, and location in the tracker. While an event-by-event direction reconstruction is therefore impossible, we can use the aggregate information of multiple SSE to estimate the sky location of the source that produced them.
The method is similar to those employed by other count-based detectors, such as BATSE (Briggs et al., 1999) and Fermi-GBM (Connaughton et al., 2015), and relies on the change in relative acceptance of each detector as a function of the incoming direction. BATSE and GBM relied primarily on the different pointing of each detector — with an approximately a cosine angular response. These missions also take into account the scattering and attenuation by the different spacecraft structures, although it was not the dominant source of leverage when fitting the source location. The opposite is true for AMEGO-X. Even though all layers in the tracker are pointing towards the same direction, their mutual shadowing leads to abundant directional information, as shown in Figure 6. A similar principle was followed by POLAR (Wang et al., 2021).
The localization sky maps are obtained through a maximum likelihood analysis. It compares the number of detected events at various spatial coordinates in the tracker to the expectation from a source located at a given sky coordinate, and finds the best match. We construct the test statistic —called a C-stat estimator in other contexts (Cash, 1979)—
| (3) |
where
-
•
is the Poisson probability of observing events given a source with a flux ;
-
•
is the estimated number of background events;
-
•
is the expected excess given a source spectral hypothesis, per flux unit. It is a function of the sky coordinate of the hypothetical source.
The index runs through all the different tracker locations where a hit can be found in the tracker. Each pixel of each tracker layer can be considered as a individual detector. Although the tracker pixel size is 1 mm, it was sufficient to divide each of the 40 tracker layers (80cm80cm) into a 32x32 grid, uniformly spaced along each dimension (as in Figure 6).
The unitary expected excess values are obtained from look-up tables previously filled using simulations. The -th element of each table contains the differential effective area for events arriving from a given sky location. The differential effective area equals the total effective area of the instrument multiplied by the fraction of the events detected in the -th tracker location. We use a HEALPix sky pixelization (Gorski et al., 2005) to describe the incoming direction, although other schemes are also possible.
The value is computed for each sky location —the flux is considered a nuisance parameter for this purpose. A sky location confidence interval is then obtained based on Wilk’s theorem (Wilks, 1938) and considering two degrees of freedom —i.e. a 90% containment corresponds to TS with respect to the maximum, which we confirmed for our case through simulations. This calculation was done for simulated sources injected at various sky locations, using the estimated background presented in Section 3. The expected performance is shown in Figure 7.
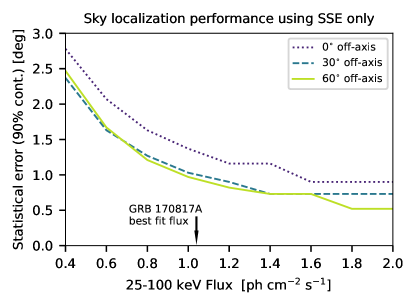
In addition to the expected statistical errors showed in Figure 7, the main source of systematics that can contribute to the localization unertainty consists of the inaccuracies of the look-up tables used to obtain the expected excess counts as a function of the incoming direction. This can be mitigated by a meticulous calibration campaign on ground. Other sources of systematics include the mismodeling of the source spectrum using a parametric shape, as well as possible errors simulating the effect of photons scattered by the Earth’s atmosphere (Connaughton et al., 2015; Palit et al., 2021). During flight, these systematic errors can be studied and mitigated by performing both a cross-calibration with other instruments, and a self-calibration with higher-energy photons that do produce tracks in the detector.
4 Science enabled by utilizing single-site events
4.1 Gamma-Ray Bursts
Gamma-Ray Bursts (GRBs) are a class of transient events characterized by a highly variable pulse-like signal in gamma-rays, known as the prompt phase, followed by a smoothly decaying emission at various wavelengths, called the afterglow. The prompt emission can last from s in the case of bursts classified as short GRBs (SGRBs), up to hundreds of seconds for long GRBs (LGRBs). It is generally believed that most LGRBS result from the core-collapse supernovae, while the progenitors of SGRBs are compact object mergers, such as binary neutrons stars (BNS) and neutron star - black hole binaries (Levan et al., 2016).
In recent years short GRBs have played a key role in the development of multi-messenger astronomy after the simultaneous detection of GRB170817a and the gravitational wave (GW) event GW 170817 (Abbott et al., 2017), confirming BNS mergers as a type of progenitor. Questions still remain about the physics of neutron stars, jet formation and structure, acceleration mechanisms and the existence of other progenitor types. In order to answer them we need a higher number of such joint GRB-GW detections, followed by extensive observations of the afterglow.
AMEGO-X can make use of its large field of view and on-board Transient Alert system to send rapid alerts with precise localization information to other detectors. Since the emission of GRBs typically peaks at hundreds of keV, with a median energy peak of 200 keV (Gruber et al., 2014), it is expected that SSE will play a major role in the detection and analysis of the majority of this type of transient phenomena by AMEGO-X.
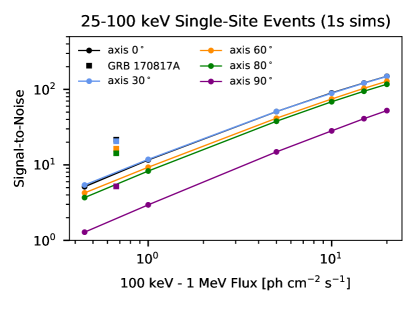
In order to investigate this we first calculate the sensitivity using SSE alone. We use a fiducial model for SGRBs based on the average properties of the GRBs detected by GBM (von Kienlin et al., 2020). The model consists of a Comptonized spectrum —described in Section 3— with and 636 keV. We use a flat lightcurve lasting 1 s. The choice of a Comptonized spectral form with two free parameters is made for simplicity. Yet we note that it is preferred over the well-known Band model (a modified broken power law with 4 parameters: Band et al., 1993) for many of the bursts in the most recent Fermi-GBM spectral catalog in Poolakkil et al. (2021). Thus the Comptonized form is suitable for developing a general sense of the utility of SSE in enhancing the AMEGO-X low energy sensitivity.
As shown in Figure 8, we vary the flux and find where , defining our detection threshold. The estimated sensitivity is between 100 keV and 1 MeV (corresponding to between 50 keV and 300 keV). We also simulated GRB170817A using the best fit parameters and 229 keV (Goldstein et al., 2017). A similar event will be detected with high SN for the majority of the field of view. Figure 9 also puts the SSE sensitivity of GRBs in perspective with the Compton-only sensitivity by taking the SGRB fiducial model and varying the peak energy.
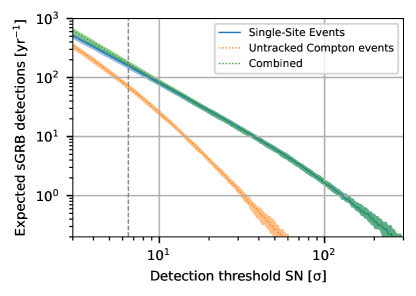
The increase in sensitivity for peak energies below hundreds of keV will be reflected in the number of detections. We quantify this by using empirical distributions of GRB peak energies, spectral indices and flux values based on Fermi-GBM observations (von Kienlin et al., 2020), extended below the threshold based on the Swift-BAT observations (Lien et al., 2016). We assumed that the observed logN-logS curve reflects the intrinsic GRB flux distribution, and considered a power law with an exponential cutoff spectrum. Based on these assumptions, we synthesized more than events, convolved them with the response of the instrument, and computed the SN for each simulated event for both single-site and Compton events. As opposed to BATSE and Fermi-GBM, which use scintillators, AMEGO-X does not require a minimum of two detectors to trigger in order to avoid false detections, mostly from phosphorescence events. This allows us to use the full effective area of the detector to trigger on-board.
We find that by utilizing SSE, AMEGO-X will be able to detect 200 short GRBs, more than doubling the number of detections compared to using only Compton events. As shown in Figure 10 not only will the overall number of detections will increase, but the use of SSE will improve the signal-to-noise ratio overall allowing for more detailed spectral and time-dependent analyses.
4.2 Magnetar giant flares and short bursts
Magnetars are highly magnetized ( G), young neutron stars (NSs) that display a wide range of radiative activity (Mereghetti, 2008; Turolla et al., 2015). Among the different dramatic variability exhibitions, magnetar giant flares (MGFs) are the most energetic. They are characterized by a short ( ms), bright ( erg), hard spike immediately followed by a erg/s minutes-long quasi-thermal ( keV) pulsating tail modulated by the spin-period of the magnetar: these signatures have been observed for all three nearby events reported in Mazets et al. (1979), Mazets et al. (1999b) and Hurley et al. (2005); Palmer et al. (2005).
In distant events only the prompt spike is currently detectable by wide-field GRB instruments and thus MGFs resemble cosmological short GRBs. As opposed to Galactic MGFs, which saturate all viewing detectors during the prompt emission, characterization is possible for extragalactic ones. The recently determined intrinsic volumetric rate of MGFs places MGFs as the dominant channel for extragalactic gamma-ray transients (Burns et al., 2021). Moreover, the 2020 MGF from the Sculptor galaxy (Svinkin et al., 2021; Roberts et al., 2021) revealed a peak energy of 1.5 MeV and a spectral index 0, resulting in a harder spectrum compared to typical cosmological short GRBs: this would explain the small number (only 4 in 27 years) of extragalactic MGFs detected so far by GRB monitors, which have trigger systems optimized to detect the latter kind of short GRBs (see Figure 3 of Negro & Burns, 2021). Given these spectral characteristics, the majority of the AMEGO-X sensitivity to MGFs comes from UC events, as shown in Figure 5 (yellow upward pointing triangles).
Considering the intrinsic rate of MGFs found by Burns et al. (2021), we estimate that AMEGO-X will detect 1 to 19 local MGFs within 25 Mpc for a 3 year mission. The detection of just six MGFs, either Galactic or extragalactic, would double the current statistics of the known population (we exclude the first MGF from the LMC in 1979 which was not accounted for in the intrinsic rate computation of Burns et al., 2021). This increase would improve the current statistical uncertainty on the average index of the power law spectral fits for MGF initial spikes, thereby better securing the intrinsic energetics distribution for MGFs, and consequently reducing the volumetric rate uncertainty of MGFs by 40%. Such an improvement is crucial to determining the favoured formation channel: only progenitors —e.g. core-collapse supernovae— with comparable or higher rates could form magnetars. Furthermore, a more stringent constraining of the cosmic MGF rate would help determine whether or not there is more than one MGF per magnetar during its active lifetime: this could then help identify the first class of repeating short GRBs ever observed.
For nearby MGFs with a few Mpc, the observation and characterization of MeV-GeV afterglows of MGFs enables the determination of the outflow/jet bulk Lorentz factor via pair creation transparency arguments (Roberts et al., 2021). Assuming an event like the 2004 MGF from SGR1806-20 (GRB 041227), we estimate the maximum distance AMEGO-X would have detected the tail. We rely on the spectral and time evolution study reported in Hurley et al. (2005), which gives a blackbody (BB) spectral shape with temperatures decreasing with time between 9 keV and 4 keV (see Figure 1(b) of that paper). In Figure 11 we show, for both SSE and UC events, the maximum distance for a given exposure time that AMEGO-X would have detected the tail of GRB 041227 at 5 significance: the advantage of SSE is clear. For the brightest part of the tail (between 30 and 200 seconds after the main peak), considering an exposure of 0.5 seconds, which would be enough to detect the periodicity due to the star rotation, AMEGO-X would detect the emission from the tail at a distance of 700 kpc with SSE; with UC events only, this distance drops to 20 kpc, which is about the distance of SGR 1806-20. During the fainter, latter half of the tail, after 270 s after the initial spike, the temperature drops to an average of 5.1 keV, and SSE would contribute to observations of similar tail portions only out to a distance of about 160 kpc. With an integration time of 10 seconds, time for which we can assume a stable background, AMEGO-X would recover the tail of a MGF from a magnetar in the Andromeda Galaxy (about 765 kpc away), which would be a first.
The blackbody spectral fit in Hurley et al. (2005) for the GRB 041227 tail, however, significantly underestimates the measured spectrum above 30 keV, where an additional power-law (PL) component would better represent the data. This additional component would further improve the AMEGO-X SSE sensitivities, resulting in an extension of the distance range for detectability of MGF tails. Such additional PL component was even more evident in the MGF tail from SGR 1900+14 in 1998 (Feroci et al., 1999): the BB component was peaking at higher temperatures and the additional PL component was dominant above 100-200 keV with a spectral index steepening with time, and disappearing after about 200 seconds. Assuming the spectrum measured in the first 67 seconds of the events by Feroci et al. (1999), namely an optically thin thermal bremsstrahlung (OTTB) component with kT25 keV, plus a power law with index 1.5, the 5 detectability as function of the source distance and exposure time is reported in the left panel of Figure 11 (dotted lines). AMEGO-X SSE events would allow the detection of such a tail emission out to Mpc with an exposure of 0.5 seconds, and with an exposure of 10 seconds it would detect it out to Mpc. In the right panel of Figure 11, for reference, the cumulative distribution of galaxies is presented as a function of the distance from Earth. Clearly, the enhancement of AMEGO-X sensitivity enables the extension of observations of MGF tails to more host galaxies. MGFs tails may also appear unassociated with the initial hard spike in the particular case that the latter is due to a collimated outflow (Roberts et al., 2021) directed outside our field of view. Accordingly, population studies of potential “orphan” tails enables independent constraints for outflow collimation, thereby significantly enhancing the SSE contribution to AMEGO-X extragalactic MGF science.
In addition to the MGFs, magnetars also produce much more numerous short duration (0.05-0.5 s) bursts with much lower luminosity (peak luminosity ranging between erg/s, with a power-law event energy distribution). In April 2020, the magnetar SGR 1935+2154 entered an active state, producing a “burst storm” with more than 200 bursts in about a thousand seconds (see e.g. Younes et al. (2020)). A few hours after the peak of the storm, a hard X-ray burst (FRB-X) was observed contemporaneously with a fast radio burst (FRB, Mereghetti et al., 2020; Li et al., 2021; Bochenek et al., 2020; CHIME/FRB Collaboration et al., 2020). Li et al. (2021) reported the time integrated (-+) spectrum of the FRB-associated burst to be well represented by a soft cutoff-power-law (CPL) with photon index of 1.5 and energy cutoff around 84 keV (corresponding to a peak energy of 37 keV). This spectrum is somewhat steeper and extends to high energies relative to spectra of other bursts in the same epoch (Younes et al., 2021). Note that despite the temporal association, it is unclear whether FRB-X and the FRB are causally connected.
Figure 5 highlights the clear benefit SSE will bring to the AMEGO-X mission for such a soft, fast (1 s integration time) transient. Assuming the best-fit CPL model reported in Li et al. (2021), the energy-integrated flux between 10 and 100 keV is about 77.5 ph/cm2/s, while AMEGO-X minimum flux detectable at 6.5 (considering 1 s exposure) is 50 ph/cm2/s for UT events and 0.5 ph/cm2/s forSSE. The latter consideration means that AMEGO-X could detect bursts which are a factor dimmer than the FRB-associated burst from SGR 1935+2154. This is particularly interesting since several additional, dimmer FRBs have been observed from SGR 1935+2154 (Kirsten et al., 2020; Zhang et al., 2020). Identifying and collecting a much larger sample of magnetar short bursts afforded by sensitive wide-field monitoring capability of AMEGO-X SSEs, in concert with wide-field radio facilities in the 2020s, will help solve the mystery of why not all magnetar short bursts produce FRBs. Moreover, millisecond time-offsets between the radio and hard X-rays, as observed in SGR 1935+2154 by INTEGRAL (Mereghetti et al., 2020), will also help inform on the burst mechanism.
Magnetar bursts have a rate of about a few thousand per decade in Fermi-GBM (Collazzi et al., 2015; Lin et al., 2020a), but are highly clustered in time in specific sources and exhibit statistical behavior and unpredictability similar to earthquakes (Cheng et al., 1996; Göǧüş et al., 1999). The short bursts are typically characterized by spectral fits employing double blackbodies of similar luminosities, with a hot component at keV and a cooler component at keV (Israel et al., 2008; van der Horst et al., 2012; Younes et al., 2014; Lin et al., 2020b). Thus, magnetar short bursts are expected to be readily observable in the SSE channel with AMEGO-X, with a higher rate than GBM. Short bursts have also exhibited quasi-periodic oscillations (QPOs) (e.g., Huppenkothen et al., 2014) that will be important to identify in SSEs.
5 Summary and conclusions
In this paper it has been shown that the performance of AMEGO-X at low energies is significantly improved by utilizing photons that deposit all their energy in a single tracker pixel, further advancing its science goals. Using single-site events (SSE) we lower the AMEGO-X detection energy threshold and achieve a continuous sensitivity to transient events over five orders of magnitude, from 25 keV to 1 GeV.
While SSE events leave no tracks, we have demonstrated that we can use the aggregate signal from a transient source to provide a competitive sky localization and support the multi-wavelength and multi-messenger efforts of the community. An event similar to GRB170817A would be localized to within a 2∘ radius.
We find an integrated flux sensitivity (6.5) between 25 keV and 100 keV of . Employing SSE gives a significant benefit for studying transient sources with peak energies below a few hundred keV or with an otherwise soft spectrum. It more than doubles the number of detected gamma-ray bursts that AMEGO-X will detect and allows a better understanding of the source spectral and time-dependent properties.
SSE capability will open the possibility for many interesting studies relating to magnetar giant flares (MGFs). The tails of MGFs can be detected up to a distance of kpc with a time resolution of 0.5 s, enough to observe the periodicity due to the star rotation. Integrating for AMEGO-X could detect a bright MGF tail like the one in 2004 from SGR 1806-20 as far as the Andromeda Galaxy. The achieved sensitivity also enables the detection of soft gamma-ray bursts associated with FRBs that are about 100 times dimmer than the one associated with SGR 1935+2154 in April 2020.
Using SSE allows us to exploit the full potential of AMEGO-X and contribute to an exciting and successful mission.
References
- Aartsen et al. (2018) Aartsen, M., Ackermann, M., Adams, J., et al. 2018, Science, 361, eaat1378, doi: 10.1126/science.aat1378
- Abbott et al. (2017) Abbott, B. P., Abbott, R., Abbott, T. D., et al. 2017, The Astrophysical Journal Letters, 848, L12, doi: 10.3847/2041-8213/aa91c9
- Abdo et al. (2009) Abdo, A. A., Ackermann, M., Ajello, M., et al. 2009, Phys. Rev. D, 80, 122004, doi: 10.1103/PhysRevD.80.122004
- Agostinelli et al. (2003) Agostinelli, S., Allison, J., Amako, K., et al. 2003, Nuclear Instruments and Methods in Physics Research Section A: Accelerators, Spectrometers, Detectors and Associated Equipment, 506, 250, doi: https://doi.org/10.1016/S0168-9002(03)01368-8
- Alcaraz et al. (2000) Alcaraz, J., Alpat, B., Ambrosi, G., et al. 2000, Physics Letters B, 484, 10, doi: https://doi.org/10.1016/S0370-2693(00)00588-8
- An (2021) An, H. 2021, arXiv e-prints, arXiv:2111.02575. https://arxiv.org/abs/2111.02575
- An et al. (2017) An, H., Romani, R. W., Johnson, T., Kerr, M., & Clark, C. J. 2017, ApJ, 850, 100, doi: 10.3847/1538-4357/aa947f
- An et al. (2020) An, H., Romani, R. W., Kerr, M., & Fermi-LAT Collaboration. 2020, ApJ, 897, 52, doi: 10.3847/1538-4357/ab93ba
- Atwood et al. (2009) Atwood, W. B., Abdo, A. A., Ackermann, M., et al. 2009, ApJ, 697, 1071, doi: 10.1088/0004-637X/697/2/1071
- Band et al. (1993) Band, D., Matteson, J., Ford, L., et al. 1993, ApJ, 413, 281, doi: 10.1086/172995
- Barthelmy et al. (2005) Barthelmy, S. D., Barbier, L. M., Cummings, J. R., et al. 2005, Space Sci. Rev., 120, 143, doi: 10.1007/s11214-005-5096-3
- Bochenek et al. (2020) Bochenek, C. D., et al. 2020, Nature, 587, 59–62, doi: 10.1038/s41586-020-2872-x
- Brewer et al. (2021) Brewer, I., Negro, M., Striebig, N., et al. 2021, Nuclear Instruments and Methods in Physics Research Section A: Accelerators, Spectrometers, Detectors and Associated Equipment, 1019, 165795, doi: https://doi.org/10.1016/j.nima.2021.165795
- Briggs et al. (1999) Briggs, M. S., Pendleton, G. N., Kippen, R. M., et al. 1999, The Astrophysical Journal, 122, 503, doi: 10.1086/313221
- Burns et al. (2019) Burns, E., Zhu, S., Hui, C. M., et al. 2019, BAAS, 51, 260. https://arxiv.org/abs/1903.04472
- Burns et al. (2021) Burns, E., Svinkin, D., Hurley, K., et al. 2021, The Astrophysical Journal Letters, 907, L28, doi: 10.3847/2041-8213/abd8c8
- Caputo et al. (2019) Caputo, R., Linden, T., Tomsick, J., et al. 2019, BAAS, 51, 78. https://arxiv.org/abs/1903.05845
- Cash (1979) Cash, W. 1979, ApJ, 228, 939, doi: 10.1086/156922
- Cheng et al. (1996) Cheng, B., Epstein, R. I., Guyer, R. A., & Young, A. C. 1996, Nature, 382, 518, doi: 10.1038/382518a0
- CHIME/FRB Collaboration et al. (2020) CHIME/FRB Collaboration, Andersen, B. C., Bandura, K. M., et al. 2020, Nature, 587, 54, doi: 10.1038/s41586-020-2863-y
- Clark et al. (2021) Clark, C. J., Nieder, L., Voisin, G., et al. 2021, MNRAS, 502, 915, doi: 10.1093/mnras/staa3484
- Collazzi et al. (2015) Collazzi, A. C., Kouveliotou, C., van der Horst, A. J., et al. 2015, ApJS, 218, 11, doi: 10.1088/0067-0049/218/1/11
- Connaughton et al. (2015) Connaughton, V., Briggs, M. S., Goldstein, A., et al. 2015, The Astrophysical Journal, 216, 32, doi: 10.1088/0067-0049/216/2/32
- de Jager et al. (1996) de Jager, O. C., Harding, A. K., Michelson, P. F., et al. 1996, ApJ, 457, 253, doi: 10.1086/176726
- Di Mauro et al. (2019) Di Mauro, M., Manconi, S., & Donato, F. 2019, BAAS, 51, 183. https://arxiv.org/abs/1903.05699
- Dubus (2013) Dubus, G. 2013, A&A Rev., 21, 64, doi: 10.1007/s00159-013-0064-5
- Feroci et al. (1999) Feroci, M., Frontera, F., Costa, E., et al. 1999, ApJ, 515, L9, doi: 10.1086/311964
- Feroci et al. (1999) Feroci, M., Frontera, F., Costa, E., et al. 1999, The Astrophysical Journal, 515, L9, doi: 10.1086/311964
- Fleischhack (2021) Fleischhack, H. 2021, PoS, ICRC2021, 649, doi: 10.22323/1.395.0649
- Fortin et al. (2021) Fortin, J.-F., Guo, H.-K., Harris, S. P., Sheridan, E., & Sinha, K. 2021, J. Cosmology Astropart. Phys, 2021, 036, doi: 10.1088/1475-7516/2021/06/036
- Fossati et al. (1998) Fossati, G., Maraschi, L., Celotti, A., Comastri, A., & Ghisellini, G. 1998, MNRAS, 299, 433, doi: 10.1046/j.1365-8711.1998.01828.x
- Gelfand et al. (2019) Gelfand, J., Wadiasingh, Z., Kargaltsev, O., et al. 2019, BAAS, 51, 513
- Goldstein et al. (2017) Goldstein, A., Veres, P., Burns, E., et al. 2017, ApJL, 848, L14, doi: 10.3847/2041-8213/aa8f41
- Gorski et al. (2005) Gorski, K. M., Hivon, E., Banday, A. J., et al. 2005, The Astrophysical Journal, 622, 759, doi: 10.1086/427976
- Göǧüş et al. (1999) Göǧüş , E., Woods, P. M., Kouveliotou, C., et al. 1999, ApJ, 526, L93, doi: 10.1086/312380
- Gruber et al. (2014) Gruber, D., Goldstein, A., von Ahlefeld, V. W., et al. 2014, The Astrophysical Journal, 211, 12, doi: 10.1088/0067-0049/211/1/12
- Gruber et al. (1999) Gruber, D. E., Matteson, J. L., Peterson, L. E., & Jung, G. V. 1999, ApJ, 520, 124, doi: 10.1086/307450
- Harding et al. (2019) Harding, A., Kerr, M., Ajello, M., et al. 2019, BAAS, 51, 379. https://arxiv.org/abs/1904.00052
- Harris et al. (2003) Harris, M. J., Share, G. H., & Leising, M. D. 2003, Journal of Geophysical Research: Space Physics, 108, doi: https://doi.org/10.1029/2003JA009958
- Huppenkothen et al. (2014) Huppenkothen, D., D’Angelo, C., Watts, A. L., et al. 2014, ApJ, 787, 128, doi: 10.1088/0004-637X/787/2/128
- Hurley et al. (1999) Hurley, K., Cline, T., Mazets, E., et al. 1999, Nature, 397, 41, doi: 10.1038/16199
- Hurley et al. (2005) Hurley, K., et al. 2005, Nature, 434, 1098
- Hurley et al. (2005) Hurley, K., Boggs, S. E., Smith, D. M., et al. 2005, Nature, 434, 1098, doi: 10.1038/nature03519
- Israel et al. (2008) Israel, G. L., Romano, P., Mangano, V., et al. 2008, ApJ, 685, 1114, doi: 10.1086/590486
- Kargaltsev et al. (2015) Kargaltsev, O., Cerutti, B., Lyubarsky, Y., & Striani, E. 2015, Space Sci. Rev., 191, 391, doi: 10.1007/s11214-015-0171-x
- Kargaltsev et al. (2013) Kargaltsev, O., Rangelov, B., & Pavlov, G. G. 2013, arXiv e-prints, arXiv:1305.2552. https://arxiv.org/abs/1305.2552
- Kirsten et al. (2020) Kirsten, F., Snelders, M. P., Jenkins, M., et al. 2020, Nature Astronomy, 5, 414–422, doi: 10.1038/s41550-020-01246-3
- Kole et al. (2015) Kole, M., Pearce, M., & Muñoz Salinas, M. 2015, Astroparticle Physics, 62, 230–240, doi: 10.1016/j.astropartphys.2014.10.002
- Kruglanski et al. (2010) Kruglanski, M., de Donder, E., Messios, N., et al. 2010, in 38th COSPAR Scientific Assembly, Vol. 38, 8
- Kuiper & Hermsen (2015) Kuiper, L., & Hermsen, W. 2015, MNRAS, 449, 3827, doi: 10.1093/mnras/stv426
- Levan et al. (2016) Levan, A., Crowther, P., de Grijs, R., et al. 2016, Space Science Reviews, 202, 33
- Li et al. (2021) Li, C. K., Lin, L., Xiong, S. L., et al. 2021, Nature Astronomy, 5, 378. https://arxiv.org/abs/2005.11071
- Lien et al. (2016) Lien, A., Sakamoto, T., Barthelmy, S. D., et al. 2016, ApJ, 829, 7, doi: 10.3847/0004-637X/829/1/7
- Lin et al. (2020a) Lin, L., Göğüş, E., Roberts, O. J., et al. 2020a, ApJ, 902, L43, doi: 10.3847/2041-8213/abbefe
- Lin et al. (2020b) Lin, L., Göğüş, E., Roberts, O. J., et al. 2020b, ApJ, 893, 156, doi: 10.3847/1538-4357/ab818f
- Maldera et al. (2019) Maldera, S., Wood, M., Caputo, R., et al. 2019, Fermi LAT Performance. Updated on May 30, 2019. Retrieved on November 2, 2021. https://www.slac.stanford.edu/exp/glast/groups/canda/lat_Performance.htm
- Mazets et al. (1999a) Mazets, E. P., Cline, T. L., Aptekar’, R. L., et al. 1999a, Astronomy Letters, 25, 635. https://arxiv.org/abs/astro-ph/9905196
- Mazets et al. (1999b) —. 1999b, Astronomy Letters, 25, 635. https://arxiv.org/abs/astro-ph/9905196
- Mazets et al. (1979) Mazets, E. P., Golentskii, S. V., Ilinskii, V. N., Aptekar, R. L., & Guryan, I. A. 1979, Nature, 282, 587, doi: 10.1038/282587a0
- McEnery et al. (2019) McEnery, J., Horst, A. v. d., Dominguez, A., et al. 2019, Bulletin of the AAS, 51. https://baas.aas.org/pub/2020n7i245
- Meegan et al. (2009) Meegan, C., Lichti, G., Bhat, P. N., et al. 2009, The Astrophysical Journal, 702, 791–804, doi: 10.1088/0004-637x/702/1/791
- Mereghetti (2008) Mereghetti, S. 2008, A&A Rev., 15, 225, doi: 10.1007/s00159-008-0011-z
- Mereghetti et al. (2020) Mereghetti, S., Savchenko, V., Ferrigno, C., et al. 2020, ApJ, 898, L29, doi: 10.3847/2041-8213/aba2cf
- Meyer et al. (2019) Meyer, E., Finke, J., Younes, G., et al. 2019, BAAS, 51, 291. https://arxiv.org/abs/1903.07553
- Mizuno et al. (2004) Mizuno, T., Kamae, T., Godfrey, G., et al. 2004, The Astrophysical Journal, 614, 1113, doi: 10.1086/423801
- Negro & Burns (2021) Negro, M., & Burns, E. 2021, PoS, ICRC2021, 630, doi: 10.22323/1.395.0630
- Ojha et al. (2019) Ojha, R., Zhang, H., Kadler, M., et al. 2019, BAAS, 51, 431. https://arxiv.org/abs/1903.05765
- Orlando (2017) Orlando, E. 2017, Monthly Notices of the Royal Astronomical Society, 475, 2724, doi: 10.1093/mnras/stx3280
- Orlando et al. (2019) Orlando, E., Grenier, I., Tatischeff, V., et al. 2019, BAAS, 51, 151. https://arxiv.org/abs/1903.05660
- Paciesas et al. (2012) Paciesas, W. S., Meegan, C. A., von Kienlin, A., et al. 2012, ApJS, 199, 18, doi: 10.1088/0067-0049/199/1/18
- Palit et al. (2021) Palit, S., Anumarlapudi, A., & Bhalerao, V. 2021, Journal of Astrophysics and Astronomy, 42, 1
- Paliya et al. (2019) Paliya, V. S., Ajello, M., Marcotulli, L., et al. 2019, arXiv e-prints, arXiv:1903.06106. https://arxiv.org/abs/1903.06106
- Palmer et al. (2005) Palmer, D. M., Barthelmy, S., Gehrels, N., et al. 2005, Nature, 434, 1107, doi: 10.1038/nature03525
- Peric (2012) Peric, I. 2012, Journal of Instrumentation, 7, C08002, doi: 10.1088/1748-0221/7/08/c08002
- Perić et al. (2021) Perić, I., Andreazza, A., Augustin, H., et al. 2021, IEEE Journal of Solid-State Circuits, 56, 2488, doi: 10.1109/JSSC.2021.3061760
- Poolakkil et al. (2021) Poolakkil, S., Preece, R., Fletcher, C., et al. 2021, ApJ, 913, 60, doi: 10.3847/1538-4357/abf24d
- Rani et al. (2019) Rani, B., Zhang, H., Hunter, S. D., et al. 2019, BAAS, 51, 348. https://arxiv.org/abs/1903.04607
- Resconi et al. (2017) Resconi, E., Coenders, S., Padovani, P., Giommi, P., & Caccianiga, L. 2017, Monthly Notices of the Royal Astronomical Society, 468, 597, doi: 10.1093/mnras/stx498
- Roberts et al. (2021) Roberts, O. J., et al. 2021, Nature, 589, 207, doi: 10.1038/s41586-020-03077-8
- Schönfelder et al. (1984) Schönfelder, V., Diehl, R., Lichti, G. G., et al. 1984, IEEE Transactions on Nuclear Science, 31, 766, doi: 10.1109/TNS.1984.4333363
- Schönfelder et al. (1993) Schönfelder, V., Aarts, H., Bennett, K., et al. 1993, ApJS, 86, 657, doi: 10.1086/191794
- Slane (2017) Slane, P. 2017, in Handbook of Supernovae, ed. A. W. Alsabti & P. Murdin (Springer), 2159, doi: 10.1007/978-3-319-21846-5_95
- Svinkin et al. (2021) Svinkin, D., et al. 2021, Nature, 589, 211, doi: 10.1038/s41586-020-03076-9
- Türler, M. et al. (2010) Türler, M., Chernyakova, M., Courvoisier, T. J.-L., et al. 2010, A&A, 512, A49, doi: 10.1051/0004-6361/200913072
- Turolla et al. (2015) Turolla, R., Zane, S., & Watts, A. L. 2015, Reports on Progress in Physics, 78, 116901, doi: 10.1088/0034-4885/78/11/116901
- van der Horst et al. (2012) van der Horst, A. J., Kouveliotou, C., Gorgone, N. M., et al. 2012, ApJ, 749, 122, doi: 10.1088/0004-637X/749/2/122
- van der Merwe et al. (2020) van der Merwe, C. J. T., Wadiasingh, Z., Venter, C., Harding, A. K., & Baring, M. G. 2020, ApJ, 904, 91, doi: 10.3847/1538-4357/abbdfb
- Venters et al. (2019a) Venters, T., Hamaguchi, K., Brandt, T. J., et al. 2019a, BAAS, 51, 396. https://arxiv.org/abs/1903.04634
- Venters et al. (2019b) Venters, T., Ajello, M., Brandt, T. J., et al. 2019b, BAAS, 51, 485. https://arxiv.org/abs/1903.04639
- von Kienlin et al. (2020) von Kienlin, A., Meegan, C. A., Paciesas, W. S., et al. 2020, ApJ, 893, 46, doi: 10.3847/1538-4357/ab7a18
- Wadiasingh et al. (2021) Wadiasingh, Z., van der Merwe, C. J. T., Venter, C., Harding, A. K., & Baring, M. G. 2021, arXiv e-prints, arXiv:2108.01705. https://arxiv.org/abs/2108.01705
- Wadiasingh et al. (2019) Wadiasingh, Z., Younes, G., Baring, M. G., et al. 2019, BAAS, 51, 292. https://arxiv.org/abs/1903.05648
- Wang et al. (2021) Wang, Y.-H., Sun, J.-C., Kole, M., et al. 2021, Nuclear Instruments and Methods in Physics Research Section A: Accelerators, Spectrometers, Detectors and Associated Equipment, 988, 164866, doi: https://doi.org/10.1016/j.nima.2020.164866
- Wilks (1938) Wilks, S. S. 1938, The Annals of Mathematical Statistics, 9, 60 , doi: 10.1214/aoms/1177732360
- Younes et al. (2021) Younes, G., Baring, M., Kouveliotou, C., et al. 2021, Nat Astron, 5. https://doi.org/10.1038/s41550-020-01292-x
- Younes et al. (2014) Younes, G., Kouveliotou, C., van der Horst, A. J., et al. 2014, ApJ, 785, 52, doi: 10.1088/0004-637X/785/1/52
- Younes et al. (2020) Younes, G., Güver, T., Kouveliotou, C., et al. 2020, The Astrophysical Journal Letters, 904, L21, doi: 10.3847/2041-8213/abc94c
- Younes et al. (2021) Younes, G., Baring, M. G., Kouveliotou, C., et al. 2021, Nature Astronomy, 5, 408. https://arxiv.org/abs/2006.11358
- Zhang et al. (2020) Zhang, C. F., Jiang, J. C., Men, Y. P., et al. 2020, The Astronomer’s Telegram, 13699, 1
- Zoglauer et al. (2006) Zoglauer, A., Andritschke, R., & Schopper, F. 2006, NAR, 50, 629, doi: 10.1016/j.newar.2006.06.049