Measuring Geometric Similarity Across Possible Plans for Automated Redistricting
| Gilvir Gill |
| Stony Brook University |
1. Introduction
Congressional districts in the United States are typically drawn following the decennial census by state legislatures or independent commissions, and the process of redistricting can have a major effect on electoral outcomes. As most states will be required to redraw their districts in 2021, gerrymandering, the politically or racially motivated manipulation of districting plans, has become an increasingly relevant issue. Since [chen2013], common techniques for exposing gerrymandering have used computers to generate large numbers of random district plans, comparing an enacted plan to the set of all possible ones. Among these, randomized region growing and recursive cluster merging ([chen2015]) have historically been popular. With [mattingly2014redistricting], the new gold standard has become using Markov chain Monte Carlo (MCMC) to draw random samples from a distribution. Additional innovations have been made on MCMC approaches for redistricting analysis, most notably the spanning-tree recombination approach from [deford2019recombination]. Other approaches, such as the one used in this paper, modify these sampling approaches to bias transitions towards higher-scoring solutions by introducing an objective function that quantifies legal and political guidelines for redistricting. However, due to randomization shortcomings and lack of deep comparison of these different techniques, automated redistricting and sampling approaches remain open problems. And while previous work such as [deford2019recombination] tends to compare groups of redistricting plans by outcome (for example, distributions of minority populations through each of the final districts, Polsby-Popper compactness, or projected electoral results), there is still a need for methods to compare plans purely on their geometry.
This paper attempts to make some progress in allowing comparisons between different distributions and sampling techniques, by presenting a graph-topological measure for comparing the geometry of any given pair of congressional plans. This measure has an intuitive and interpretable definition, being equal to the percentage of the state’s area or population that remain in the same congressional district across the two plans, and is shown to be computationally efficient and therefore feasible to calculate for a large number of redistricting plans.
2. Objective Functions and Measures for Redistricting
An objective function approximates how well a given districting plan satisfies state-specific constraints and gives a simple mechanism to adapt to differing legal doctrine on redistricting across states. For instance, in compliance with state and federal guidelines, commissions consider racial demographics in the process to ensure fair representation, though recent studies challenge that approach ([chen_stephanopoulos_2020]). Additionally, states will often require, formally or informally, that new redistricting plans be similar to the currently enacted plans. This could either require commissions to qualitatively consider a geometric similarity in the plans, or could involve requirements such as minimizing the number of people who are moved to a new district between two plans. In both of these cases, an old plan and a new enacted plan ought to allocate electoral precincts to districts to maximize the intersection of some precinct-level quality, usually area or population.
However, there is a lack of clear guidelines on what similarity means in the context of two sets of plans, whereas concepts such as compactness and partisan fairness have well-defined measures (Polsby-Popper scores and efficiency gap, respectively).
We address the lack of a robust mathematical formulation for cross-plan similarity by defining a new measure and corresponding algorithm that makes use of bipartite maximum-weight matching, and present an example use-case. Specifically, we consider how the geometry and demographics of a state determine the pair-wise similarity between two plans drawn from the optimal recombination approach. For example, states such as Texas and North Carolina are topologically thin in their westernmost sections, and any compact districts containing El Paso and Western North Carolina are largely predetermined compared to any one part of Georgia, where no section of the state tends to extend out. This, in turn, could increase the expected similarity between two arbitrary plans.
3. Methodology
We propose the following measure for similarity in districts: Let be the sum of the area of the electoral precincts (or a smaller unit, such as census blocks) shared by districts and from separate districting plans. For two given plans, with not necessarily the same number of districts, and (where ; the number of districts in each plan need not be the same), reorder the indices for to minimize the following function, where is the total area of the state:
Considering the minimum value of across all possible pairings of districts in and is akin to finding the mapping from old district numbers to new district numbers such that the largest portion of the state’s area will stay in the same district between two different plans. If the redistricting plans are not renumbered, the similarity measure becomes effectively useless; one randomly sampled plan may have District 1 assigned to the northwest region of a state, for example, while another randomly sampled plan could have District 1 assigned to the southeast.
Alternatively, we can replace with a population intersection function to get the district number mapping that keeps the most people possible in their current congressional district given a set of equal-population boundaries. This would likely be a more interesting measure on states such as New York, where a majority of the state’s population resides in a small region of the state, and would be more in line with informal guidelines that incumbents keep the largest possible chunk of their constituents between redistrictings.
We can find these best mappings in , where is the larger number of districts and the total number of electoral precincts in the state, by adding each precinct’s area to entries in a matrix for each intersection and then using a bipartite maximum-weight matching algorithm (see [hopcroft1973] or newer). Note that this problem is sometimes described as a linear sum assignment problem (as in [crouse2016])—finding a boolean cost-matrix :
Where the matrices have the additional restrictions that each row is assigned exactly one column, while every column is assigned exactly zero or one rows. The resulting matrix therefore has the property that if and only if districts and would be assigned the same district numbers in a naming system that maximizes the portion of the state kept under the same district number.
This new measure of similarity accounts for the randomness in labeling for district plans, supports comparison between plans with different numbers of districts (important if the number of districts changes due to shifting demographics), and only requires polynomial time.
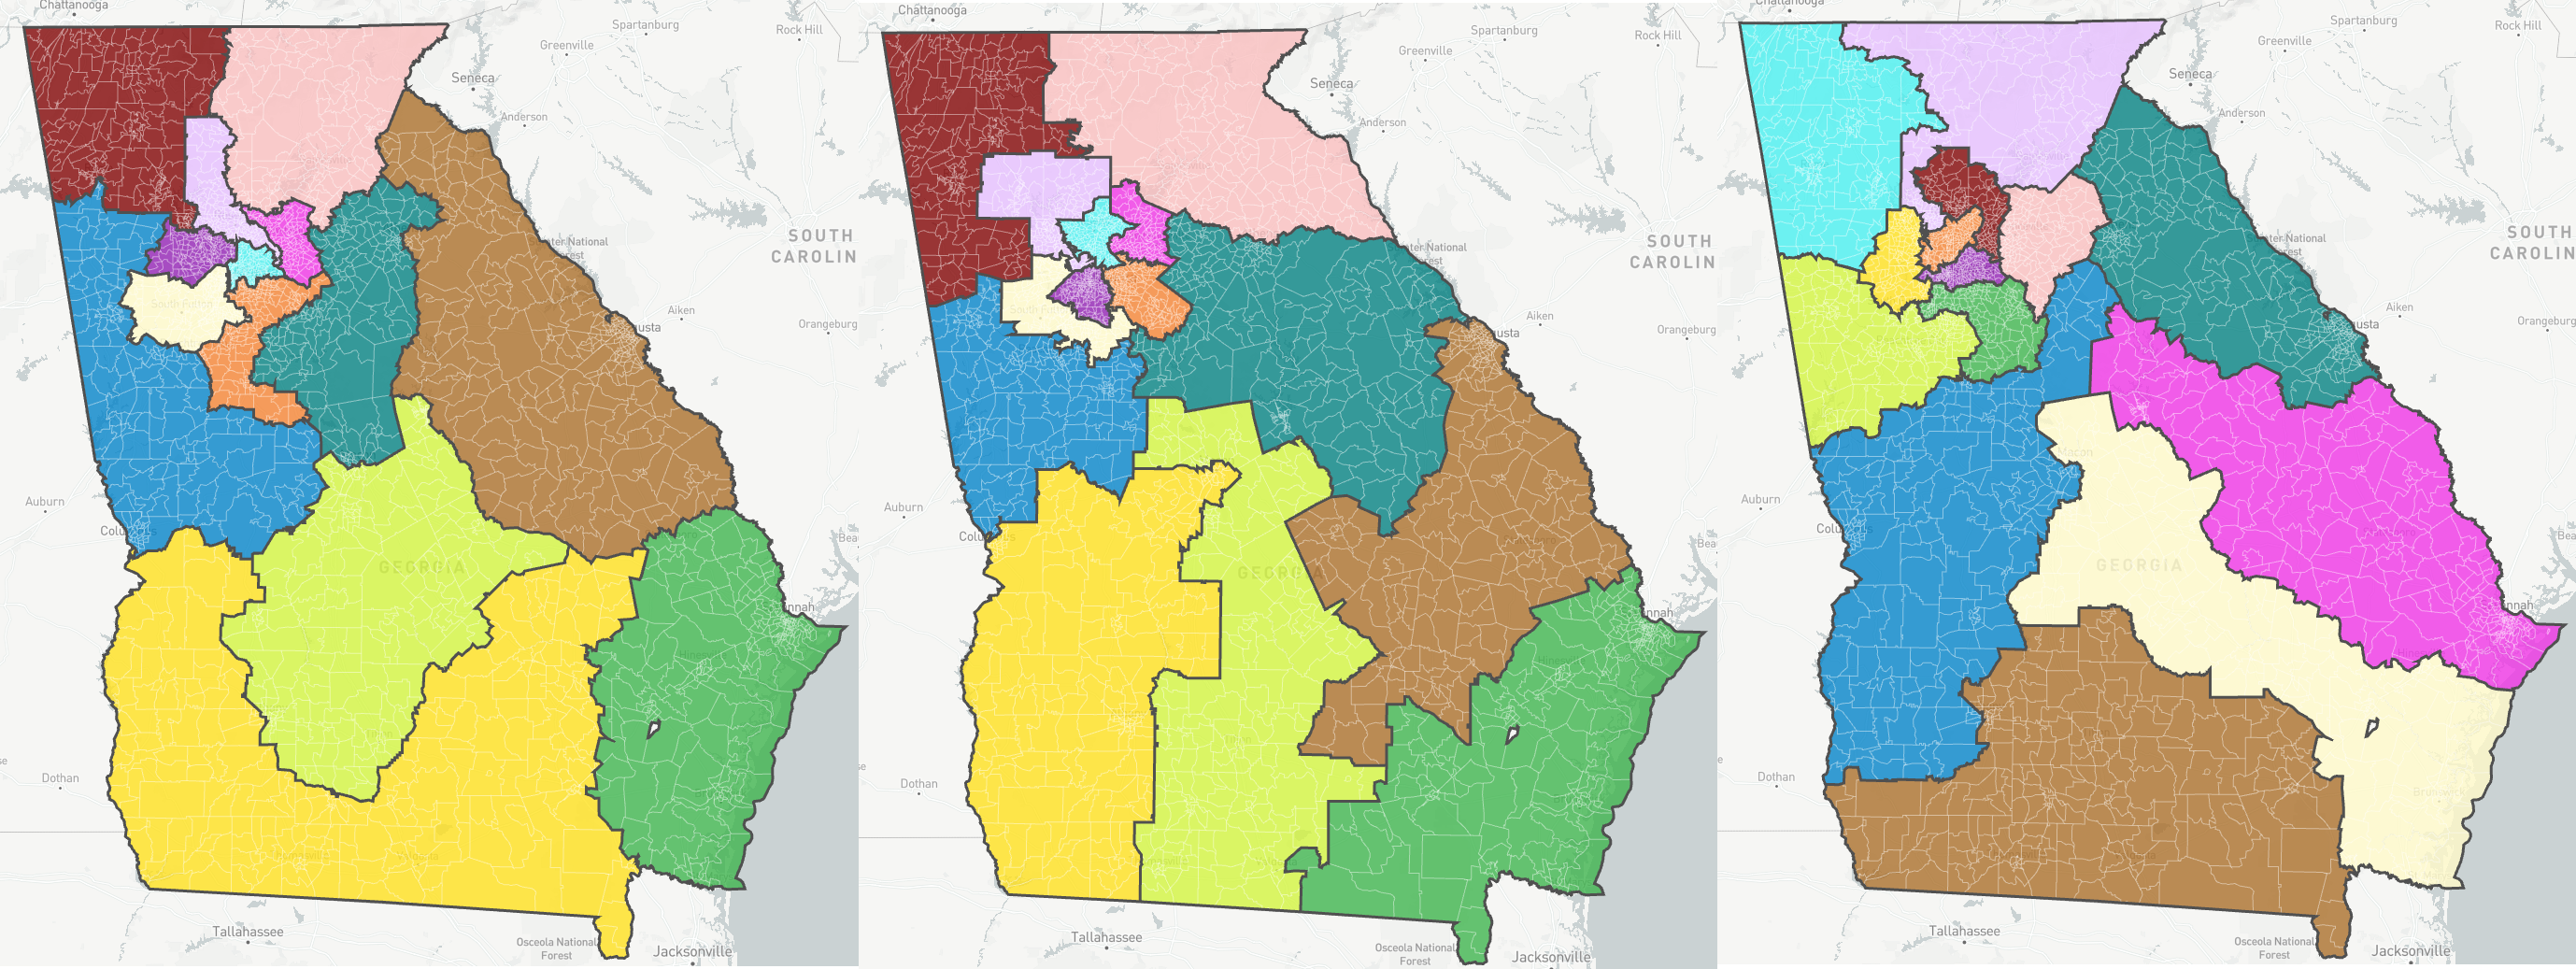
Maximizing this measure has desirable graphical consequences, in addition to its potential for quantifying similarity and incumbency advantage. For example, bipartite maximum-weight matching is used in the Stony Brook PoliTech Automated Redistricting System (ARS) to keep district numbers and colors consistent between existing plans and algorithmically generated ones (see Figure 1).
In order to highlight a potential use-case for the measure in quantifying similarity, we generate a set of districting plans, and calculate the similarity score across all pairs of plans. In this introductory report, we perform our analysis on an a modified version of the MCMC recombination approach that attempts to optimize population equality more aggressively by taking the highest scoring transition with respect to a population-equality objective function, rather than being concerned with staying true to the underlying distribution of plans that meet a set of requirements. This approach randomly chooses two neighboring districts, merges them into a larger cluster, and splits that cluster into two new districts that are more population-equal. For splitting the clusters, we use the approach from [deford2019recombination], generating a random spanning-tree and taking a cut along the tree to ensure that we split the cluster into two new contiguous districts. However, rather than using a random tree cut probabilistically or taking the first cut within a given threshold, we check all cuts to find one that best optimizes our population equality. In future analysis, we plan to use this measure to compare this modified recombination approach to the traditional MCMC approach. However, since these results were focused on observing the differences between states rather than between algorithms, we have left this analysis out.
We run the algorithm across eight states with differing geometries and congressional delegation sizes, seeding them with the recursive merging algorithm from [chen2015], generating runs in parallel (each with recombinations, where is the number of districts), and computing the similarity scores with the new measure.
4. Analysis and Results
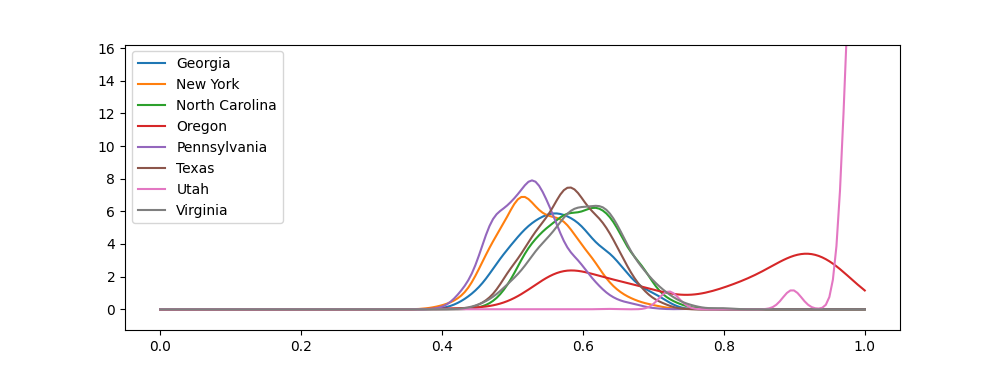
Running the algorithm with a sample of 1225 pairs per each of the eight states, I find that most states have a mean similarity between 0.5 and 0.6. The lack of similarity scores less than 0.4 is not surprising, largely due to the nature of maximal matching; for example, consider that the theoretic minimum similarity score on the set of all ways to split a circle radially into four equal pieces is 0.5. Oregon and Utah have mean area similarity scores of 0.776 and 0.97, respectively, indicating shortcomings of an optimal recombination approach on states with a small number of congressional districts compared to a truly random approach. North Carolina and Texas have higher mean similarities than Georgia and Pennsylvania (0.598, 0.583; 0.567, 0.526, respectively), showing that our initial theories on the influence of topological bottlenecks may hold. However, without first quantifying geometric features of states and normalizing for variables such as population density and clustering, we cannot draw further conclusions. With more resources and time, applying this measure could give meaningful information about the geometric factors that decide the intrinsic similarity between plans. Notably, it is not the specific takeaways from this analysis that are important, but rather, a demonstration of how this measure could be useful for understanding inherent biases in both the geometry and graph-topology of a state, and the behavior of redistricting algorithms at large.
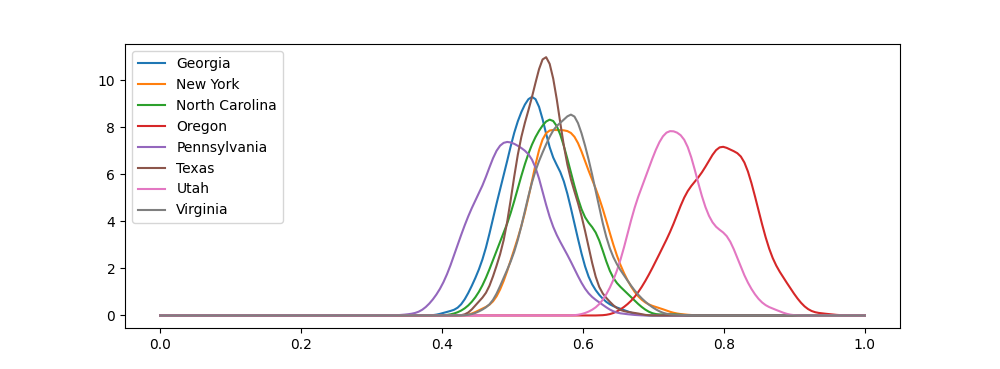
Regardless, disparities between population and area similarity are interesting to note. For states such as Utah and Oregon, a disproportionate number of electoral precincts relative to area are found in cities such as Portland and Salt Lake City, which make up a smaller. The disparity could therefore potentially be explained by the minimal impact of variance in these cities on the overall compactness score, which in turn affects optimization and thresholds in recombination. However, further study in this area is once again required.
5. Future Analysis
The calculation of this measure may be an important indicator of how state geometry and population distributions affect redistricting. On its own, the average of similarity scores approximately shows what portion of a reasonable redistricting is already predetermined geometrically. On the level of individual pairs of plans, the measure provides a mechanism for cleverly assigning consistent district identifiers, which can then allow further comparison in other areas, such as shifts in electoral outcomes across districts modified by the redistricting process.
In future analysis, we plan to explore how similarity score correlates with gaps in representation between the popular vote and the elected delegation, and to further study what variables determine the score in the first place (for example, compactness and the number of districts). Additionally, the sample size of plans () should be increased significantly to the order of thousands of plans, and should be sampled from a first-cut recombination distribution more in line with previous literature. Finally, the computational efficiency of this new similarity measure demonstrates its potential as a term in an objective function for optimal redistricting algorithms, and we will explore this use case further in future work