∎
22email: zainab.husain@ku.ac.ae
33institutetext: A. Al Zaabi 44institutetext: Electrical and Computer Eng. Department - Khalifa University (KUST) - Abu Dhabi, U.A.E.
44email: amna.alzaabi@ku.ac.ae
55institutetext: H. Hildmann66institutetext: Intel. Aut. Sys. Group - Netherlands Organisation for Applied Scientific Research (TNO)
66email: hanno.hildmann@tno.nl 77institutetext: F. Saffre88institutetext: Technical Research Centre of Finland (VTT) - Espoo, FI
88email: fabrice.saffre@vtt.fi
99institutetext: D. Ruta1010institutetext: Etisalat - BT Innovation Center (EBTIC) - Khalifa University (KUST) - Abu Dhabi, U.A.E.
1010email: dymitr.ruta@ku.ac.ae
1111institutetext: A. F. Isakovic1212institutetext: Colgate University - Physics and Astronomy Dept. - Hamilton, NY, USA
1212email: iregx137@gmail.com / aisakovic@colgate.edu
††thanks: ICT Fund for Bio-Inspired Computing
Search and Rescue in a Maze-like Environment with Ant and Dijkstra Algorithms
Abstract
With the growing reliability of modern Ad Hoc Networks, it is encouraging to analyze potential involvement of autonomous Ad Hoc agents in critical situations where human involvement could be perilous. One such critical scenario is the Search and Rescue effort in the event of a disaster where timely discovery and help deployment is of utmost importance. This paper demonstrates the applicability of a bio-inspired technique, namely Ant Algorithms (AA), in optimizing the search time for a near optimal path to a trapped victim, followed by the application of Dijkstra’s algorithm in the rescue phase. The inherent exploratory nature of AA is put to use for a faster mapping and coverage of the unknown search space. Four different AA are implemented, with different effects of the pheromone in play. An inverted AA, with repulsive pheromones, was found to be the best fit for this particular application. After considerable exploration, upon discovery of the victim, the autonomous agents further facilitate the rescue process by forming a relay network, using the already deployed resources. Hence, the paper discusses a detailed decision making model of the swarm, segmented into two primary phases, responsible for the search and rescue respectively. Different aspects of the performance of the agent swarm are analyzed, as a function of the spatial dimensions, the complexity of the search space, the deployed search group size, and the signal permeability of the obstacles in the area.
Keywords:
Search and Rescue, Ant Algorithms, Ant Colony Optimization, Maze exploration, UAVs, Drones, Civil Security, Public Safety, Smart City1 Introduction
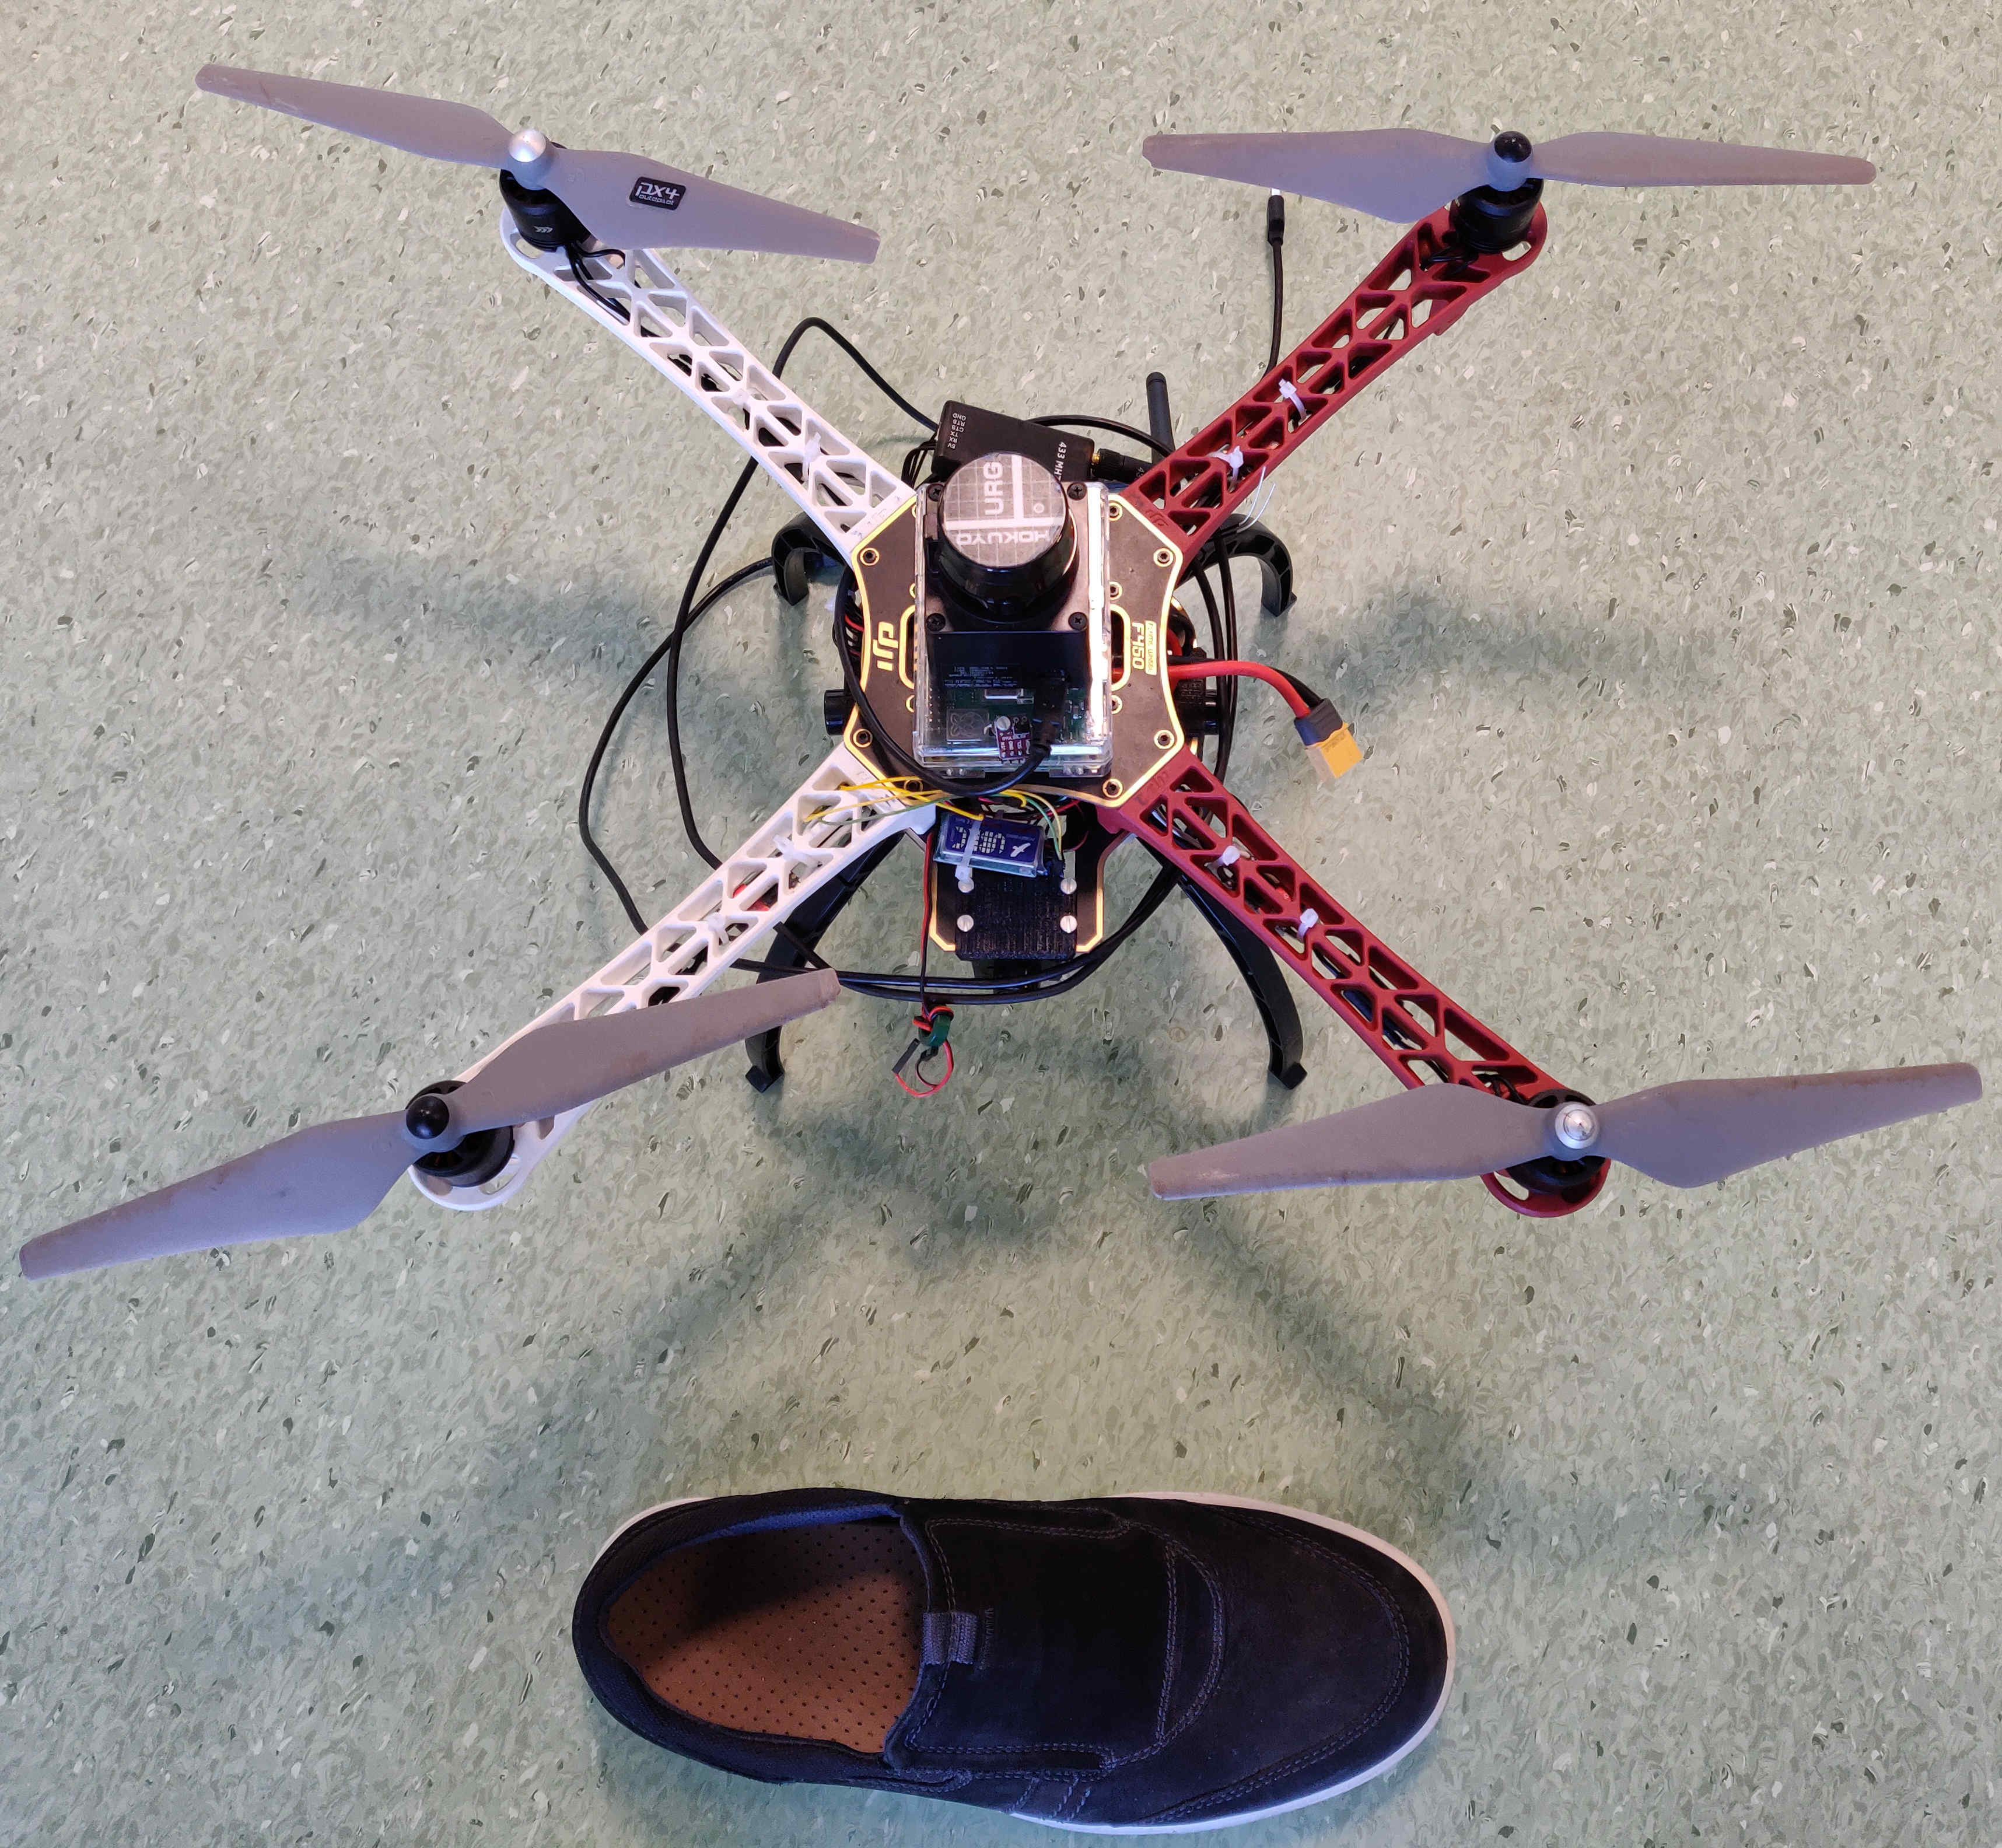
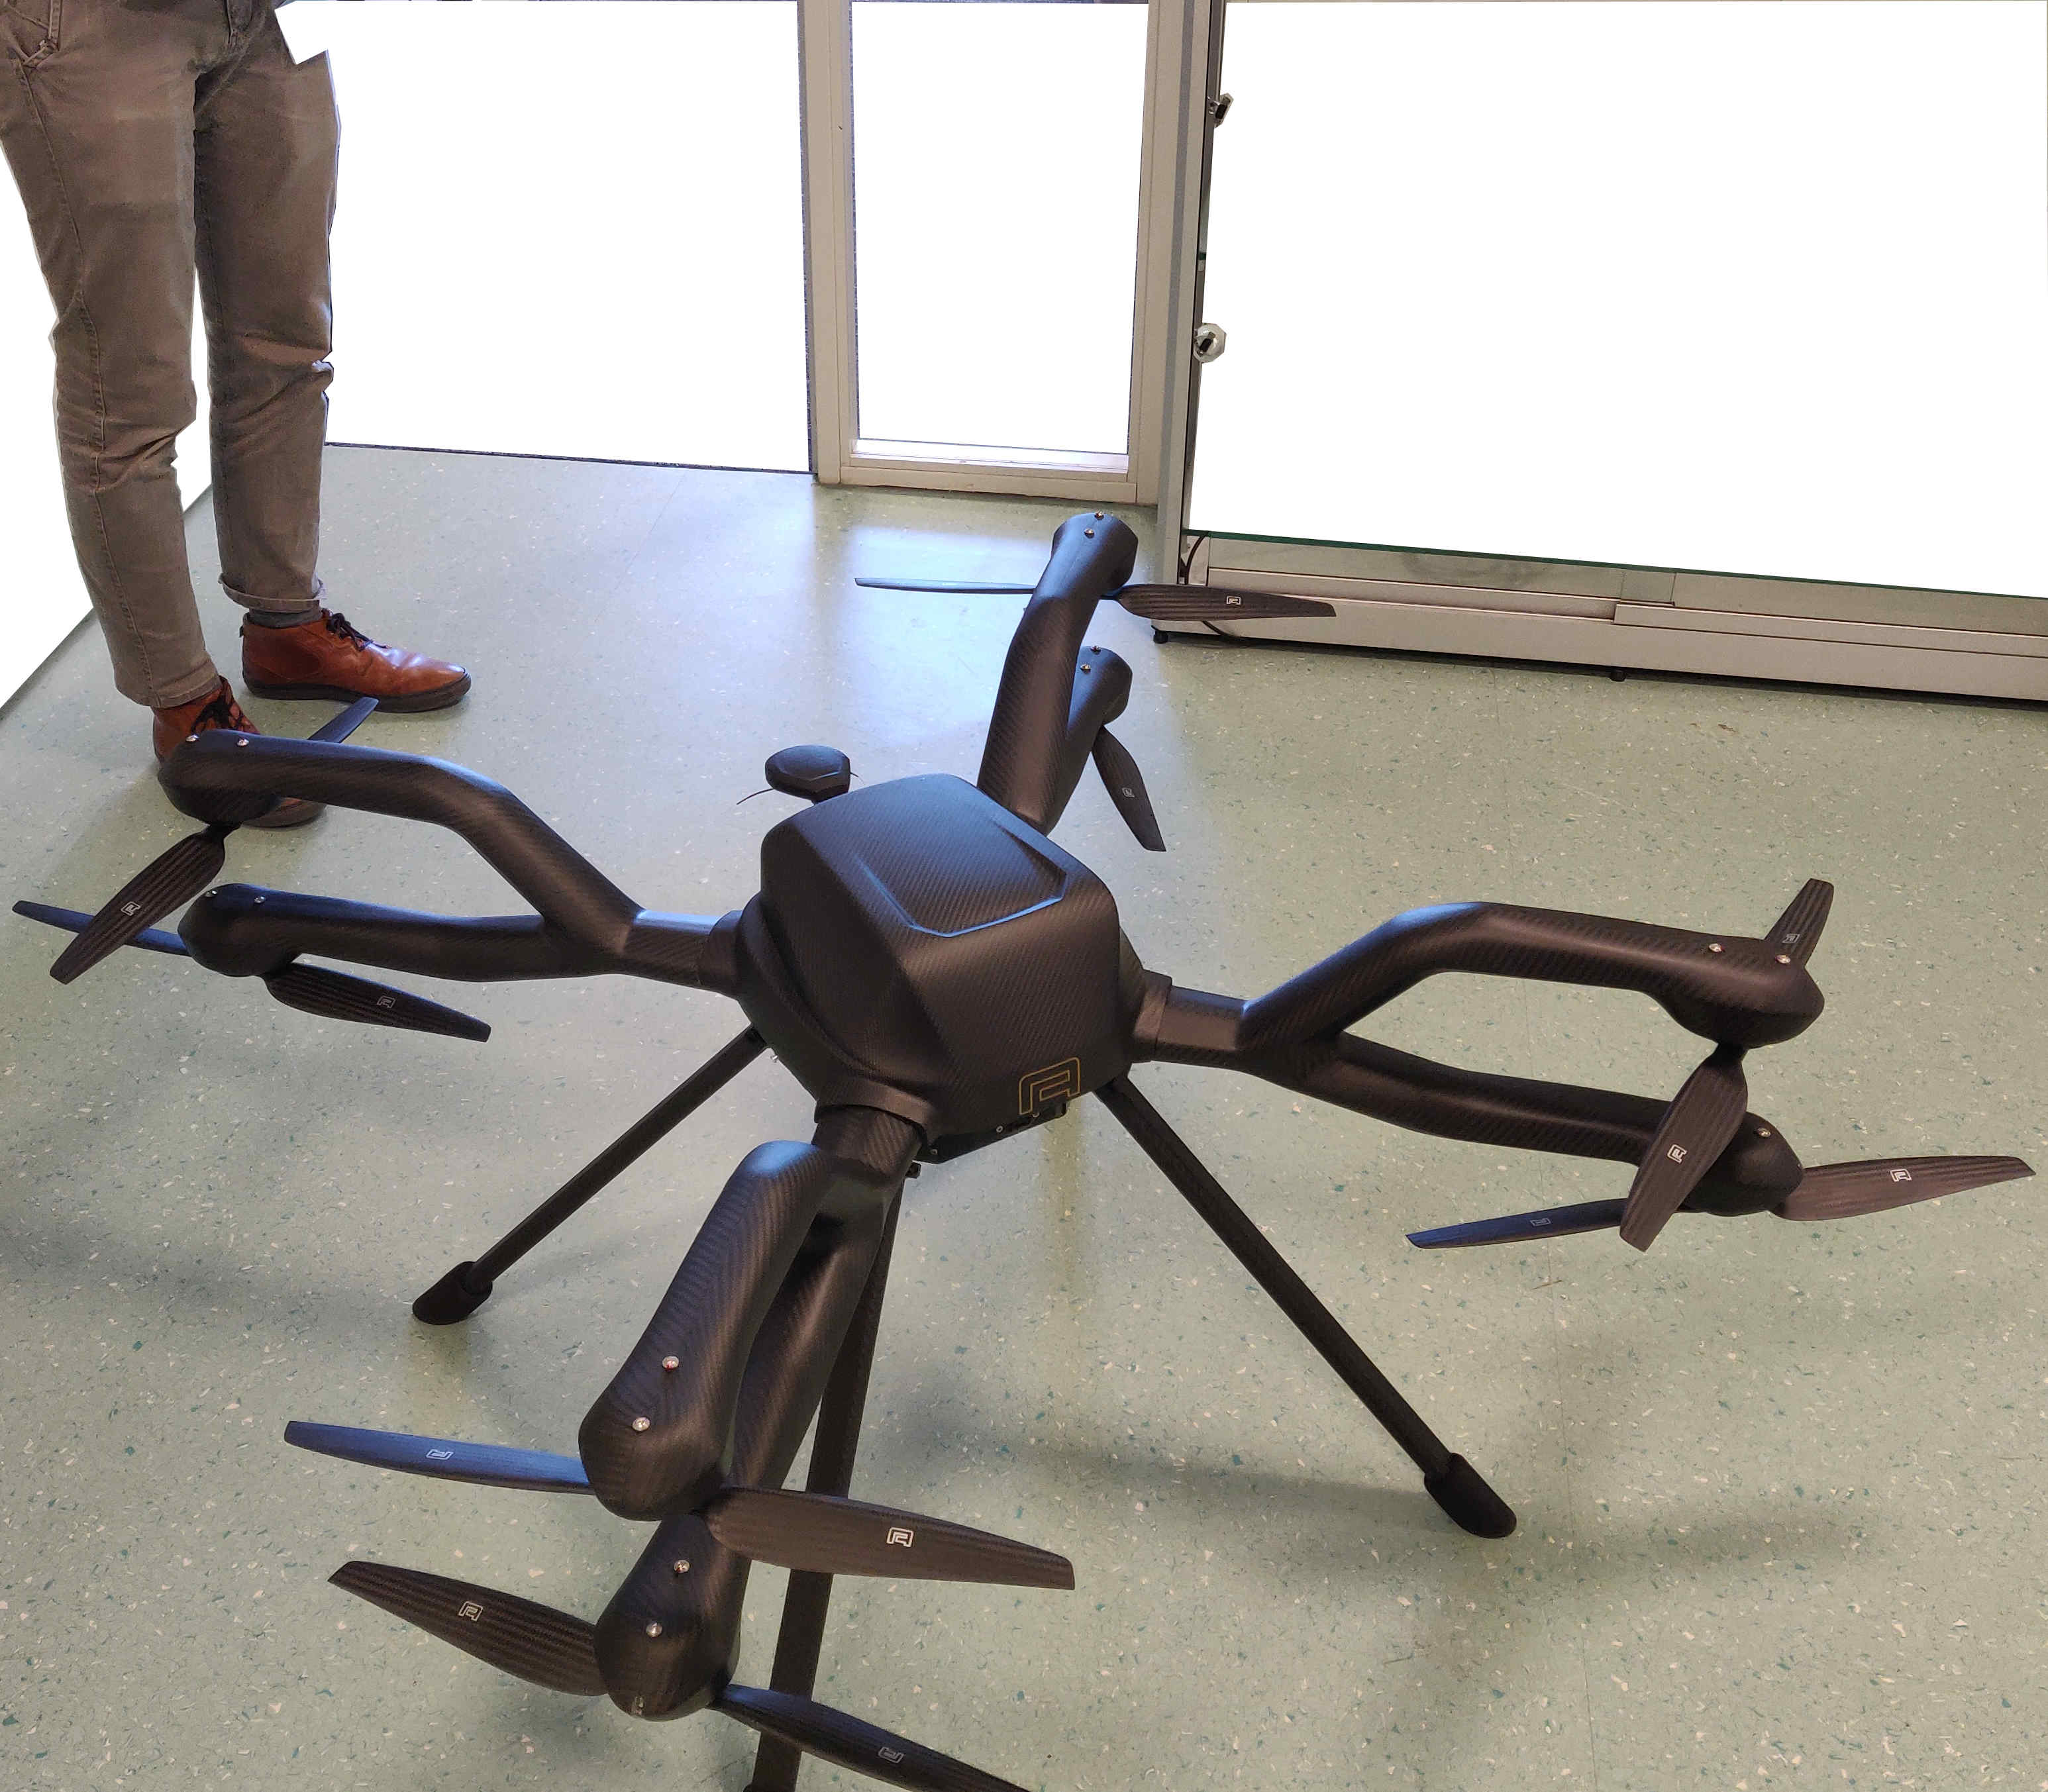
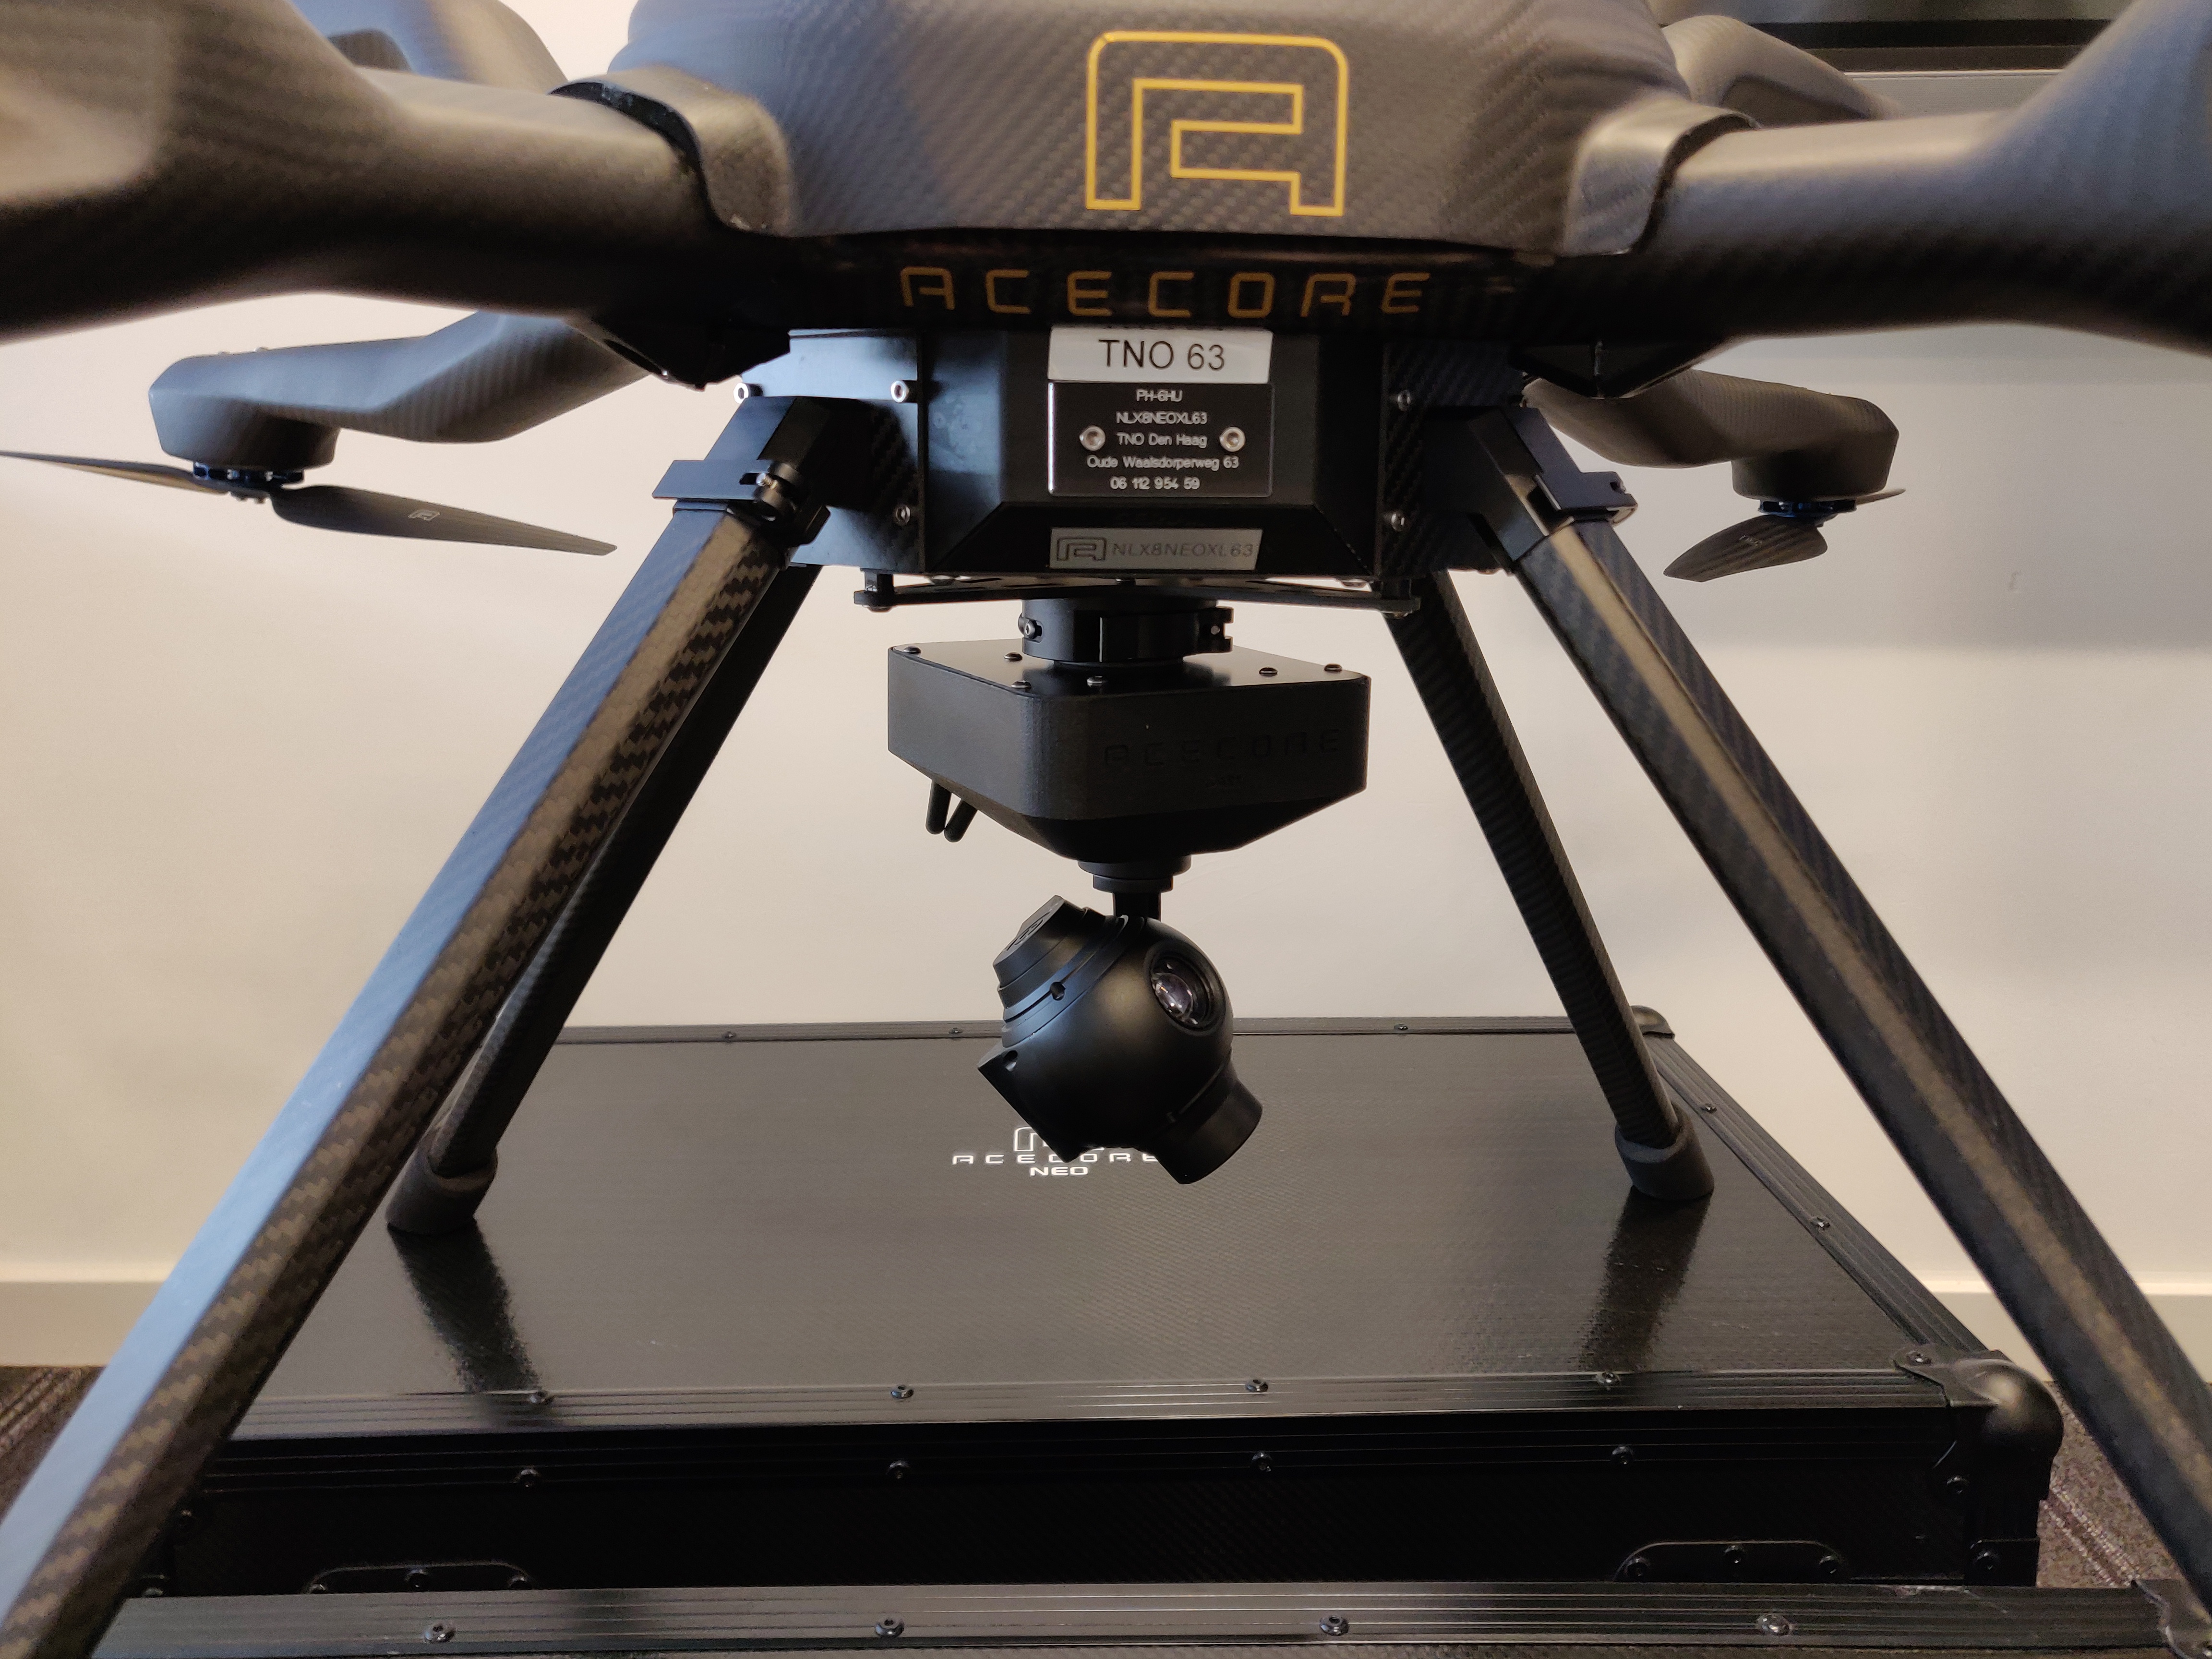
Drones are on their way to become a pervasive technology. They have been around for quite some time (The US military used drones as far back as the Vietnam War (Broad, 1981)) but have recently become commercially available for civilian use and even hobbyists. Todays UAVs are technological advanced devices capable of autonomous flight operations (Hildmann and Kovacs, 2019), making the remote piloting an option, not a requirement. Drones come in all kinds of shapes and forms as well as vastly different prices, depending on their intended use the required specifications (American Red Cross, 2015).
The use of drones as mobile and airborne sensing platforms in general (Hildmann and Kovacs, 2019), and with a focus on disaster response and civil defense in specific (Hildmann et al., 2019), has been discussed in the literature. Especially for data collection purposes, autonomous UAVs are increasingly a viable alternative to using human labor, with key application areas being precision agriculture, civil defense such as fire fighting, traffic management, to locate victims in the aftermath of a disaster.
Many applications can benefit from the use of (semi-)automated aerial devices due to the reduced cost and the ease of access these devices have (Hildmann et al., 2021). UAVs are especially useful for civil defense and disaster response, because they are (a) expendable, (b) fast moving and (c) capable of moving in 3D space. The latter is extremely beneficial when existing infrastructure has been wiped out as drones are quite capable of transporting and operating communication infrastructure, making them well suited to form dynamic communication and sensing networks (Boubeta-Puig et al., 2018).
Natural disasters often result in significant loss of communication and data-collection infrastructure. The use of swarms (formations of multiple UAVs that can to some extent operate as a single operational unit) is a topic that receives increasing attention. Be it to act as mobile sensor networks, to monitor personnel or victims or for tracking and surveillance tasks in general, the benefits of being able to deploy such systems quickly is evident.
2 Background
We now provide some background for Search and Rescue (SAR) operations (Section 2.1) and the use of wireless and mobile / ad-hoc networks in this context (Section 2.2) and argue that drone based wireless networks have great potential for this application domain. Finally we briefly elaborate on the problem of finding the shortest path between certain nodes in a network and argue for the benefits of nature-inspired heuristics to do so (Section 2.3).
2.1 Indoor Search and Rescue (SAR) operations for swarms of drones
Until recently, the majority of Search and Rescue (SAR) applications assumed, for practical reasons, autonomously operating ground-based robots because – for 2D environments – solutions have been proposed for collision free movement of a team of robots (Li et al., 2020c) or the movement of a team while in formation (Li et al., 2020b). This article targets drones but also simplifies the environment to be 2D. UAVs are proposed in the literature for e.g., the handling of materials that are either themselves dangerous for humans or are located in dangerous or inaccessible environments. The flexibility of drones makes them well suited to serve as mobile / aerial urban sensing platforms for Search and Rescue operations or for aerial tracking, especially in inaccessible environments and for the detection of victims or victims’ life signs.
2.1.1 Swarm (Multi-agent) Search and Rescue (SAR) operations
Of course the use of drones is not restricted to disasters, but as such events often result in partial or total loss of existing communication and data-collection infrastructure and cause substantial damage to buildings, drones have been deployed to provide situational awareness (SA), deliver (medical) supplies and monitor human personnel in the field, e.g., for fire fighters.
More recently, the drop in cost for units as well as the operation thereof has made the operation of multiple drones, acting as a single larger collective a realistic scenario for e.g., aerial tracking. Hussein et al. (2014) have investigated SAR operations with ground based robot swarms using actual devices. The topic of performing SAR operations using autonomous agents has been an area of widespread research and several avenues are available for R&D, including this work. There is still room for improvement in terms of optimizing the search algorithm for specific metrics such as the speeding up of the rescue.
Considering temporal and spatial uncertainties in a disaster struck search space (subject to continuous changes), heuristic techniques, rather than classic, deterministic ones are worth exploring in expectation of a better performance in such unstable environments (Saffre and Hildmann, 2021).
2.1.2 Path planning in maze-like environments
From an optimization point of view, the search in an ambiguous environment can be modeled as a maze solving problem where the maze walls denote the presence of unknown obstacles on the way to the rescue target. Path planning through a prior known environment (“global path planning”) is a well documented research topic, with several of its main issues having been addressed. Maneuvering a maze with only local information of the search space is called “local path planning”, which is performed on the go during the maze solving process. Search in an unknown or uncertain environment is similar to a local path planning problem where heuristic techniques (cf. Section 2.3) can be employed to optimize the search process (Bonabeau et al., 1999).
2.1.3 Communication routing
In the literature, communication services have been identified as an integral functionality of swarms and indeed, this can be of significant benefit while a relief team is deployed to reach the victim at the rescue site.
This requires a routing algorithm, that can engineer a reverse route between the already dispersed search agents, under relevant communication constraints. There is a large number of such constraints and challenges for inter-UAV communication, we refer to Gupta et al. (2016) for an overview over the literature.
2.1.4 Summary
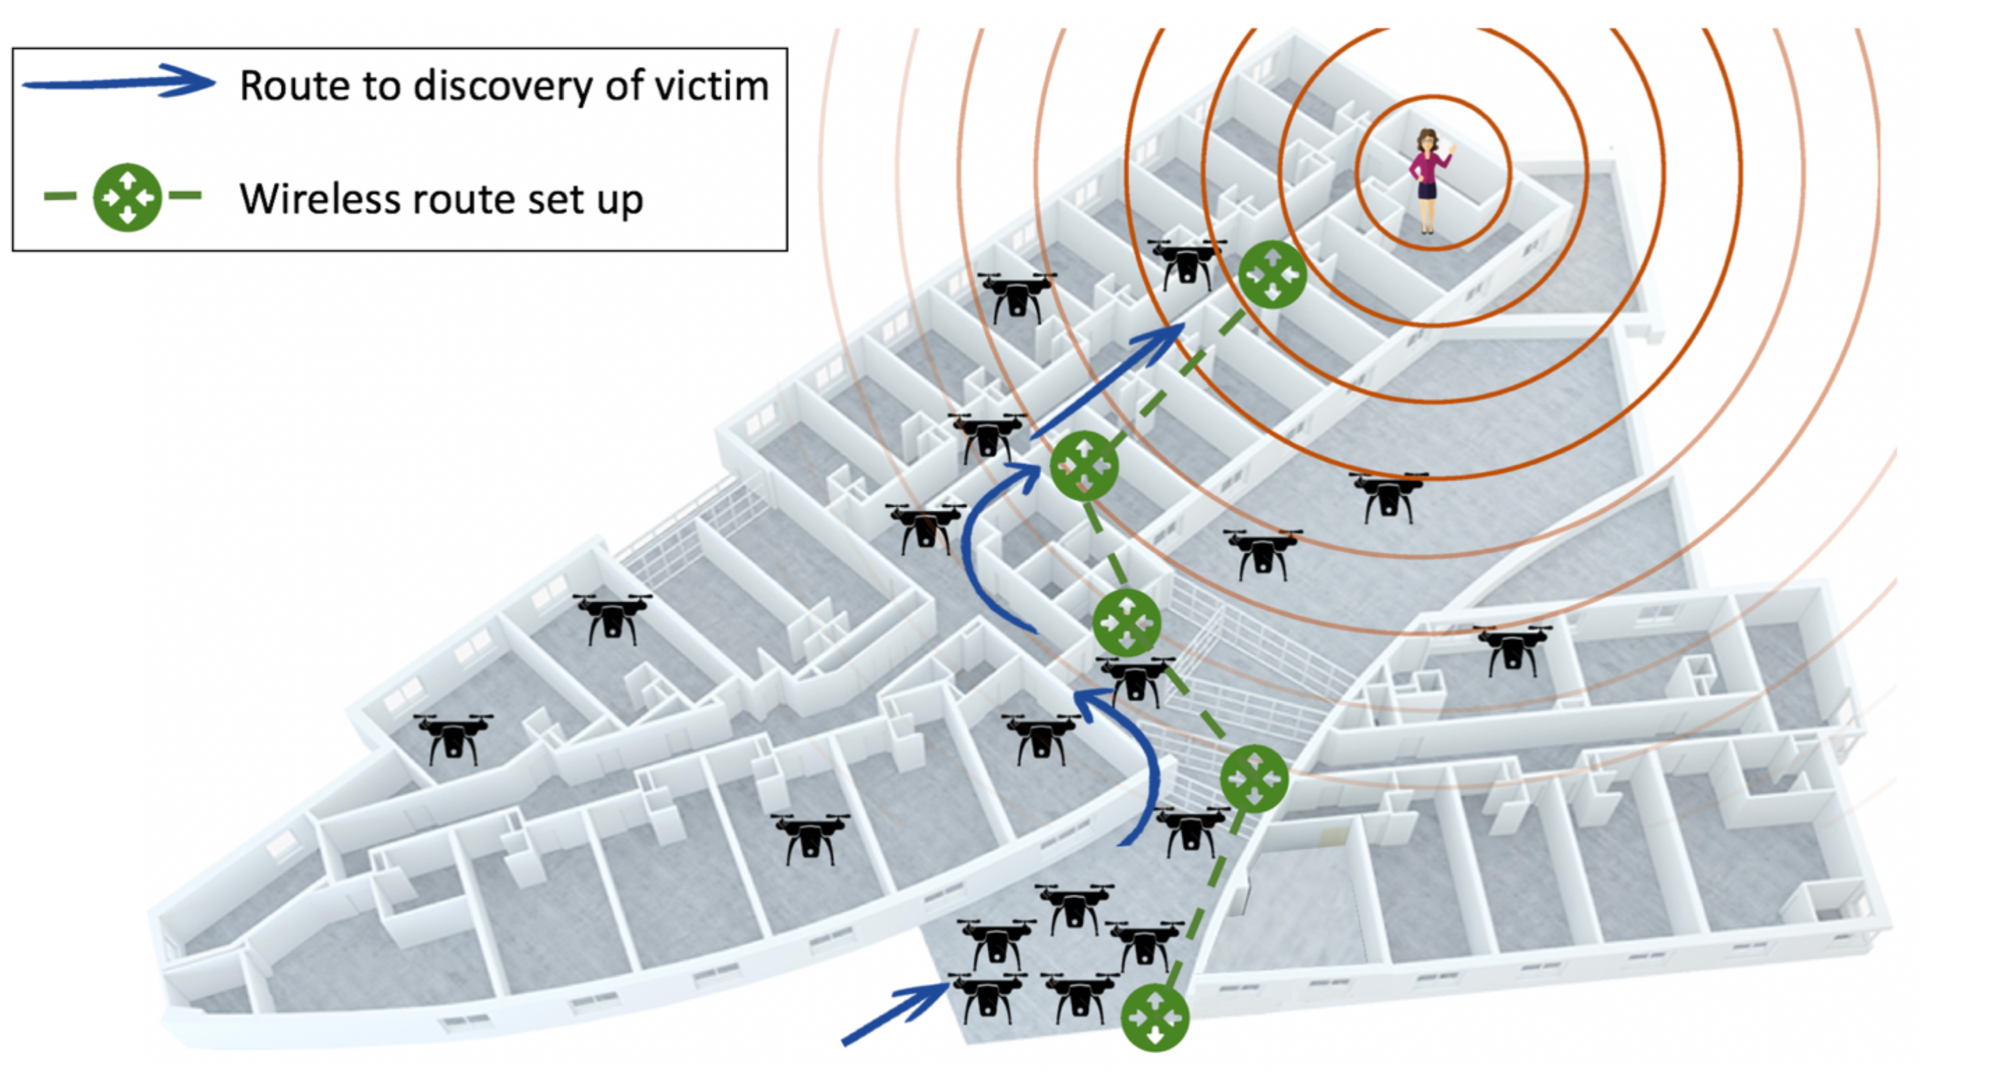
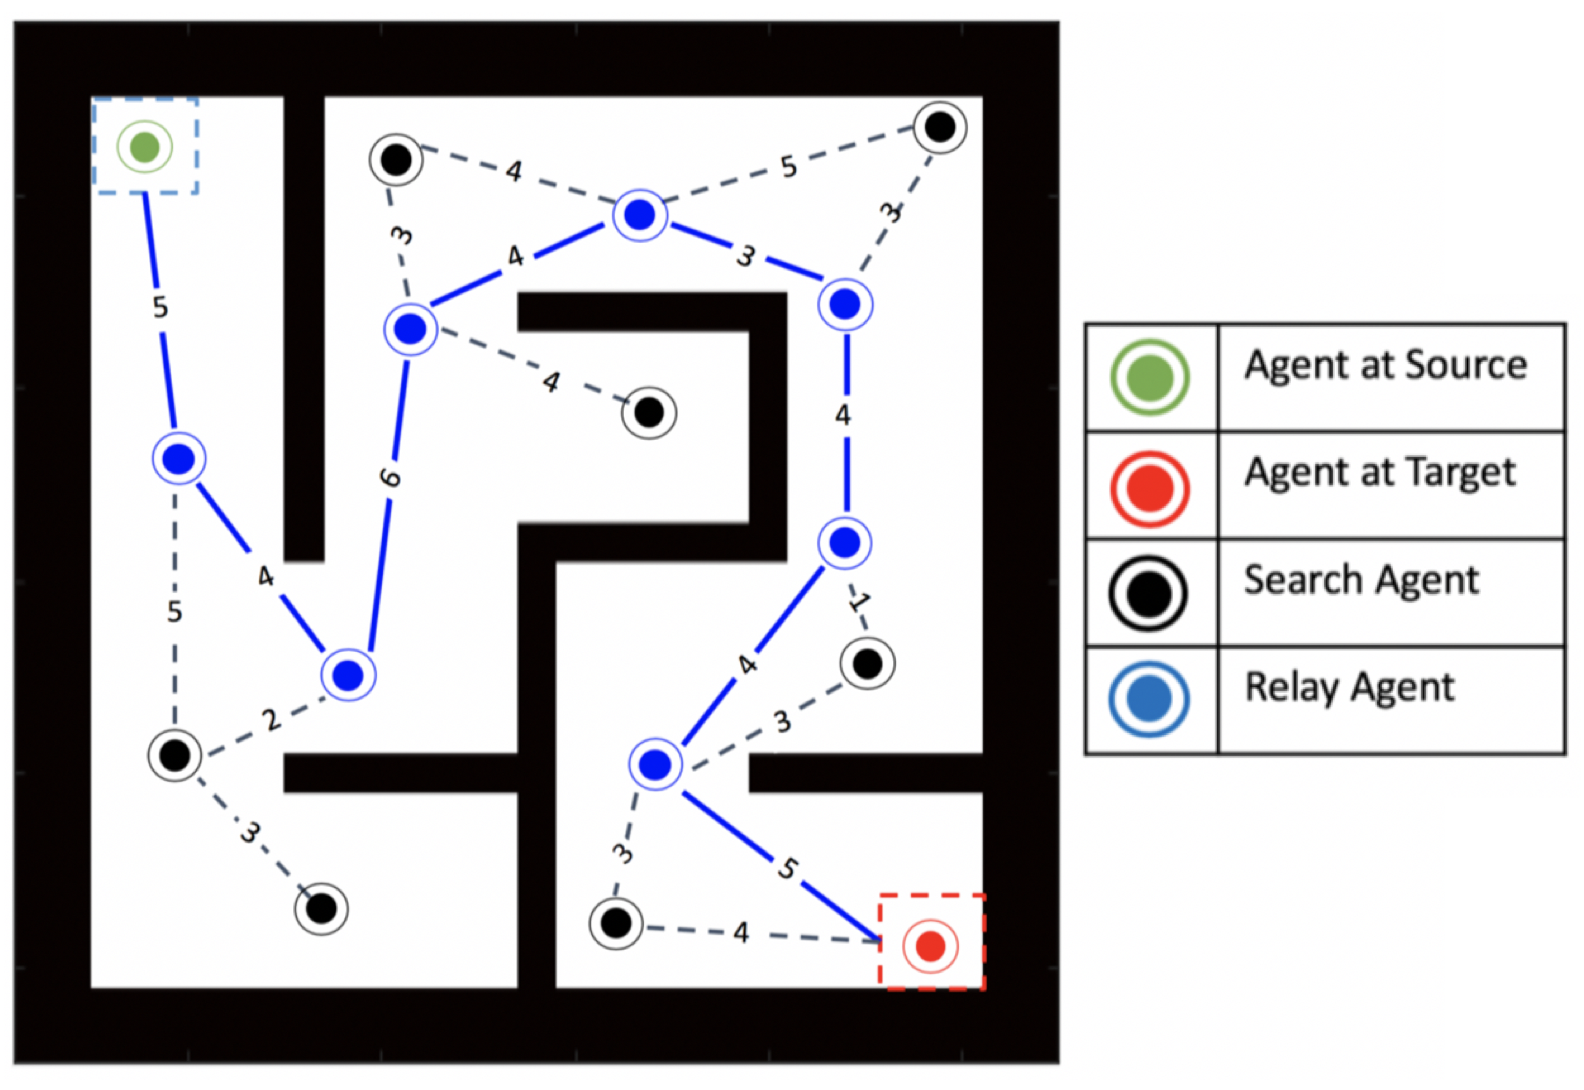
The search part of the SAR scenario is depicted in Figure 2, where the agents maneuver a complex indoor setting to reach a target partially guiding the search using a beacon signal. Once the location of the target has been determined, the scattered agents realign to form the shortest possible relay link back to the starting point (base station). All unused agents return to the base, to prevent over-utilization of resources.
2.2 Wireless Sensor Networks (WSN) in SAR for swarms of drones
2.2.1 Mobile Wireless Networks
Mobile wireless networks have the potential to upgrade existing IT and communication infrastructure as, and where, needed. Communication networks have to be dimensioned to accommodate peak demands, which implies that outside those periods there is redundancy in the system. Given this redundancy, the ability to dynamically allocate additional capacity can dramatically increase the cost efficiency of the utilized resources.
2.2.2 Mobile Wireless Sensor Networks (MWSN) in SAR
In case of an emergency situation, especially in SAR operations, fast, cost-efficient and simple deployment is a crucial factor when it comes to saving lives and reducing economic damage (Eledlebi et al., 2020). Especially when the environment under considerations may have been altered or have suffered damage, the ability to deploy sensing capabilities alongside other equipment may facilitate real-time planning based on the gather information. The more adaptive and reactive a deployment process into such an environment is, the more efficient as well as safer it can be realized. Self-organization is increasingly applied to this end due to the fact that decentralized operations further reduce the need for communication infrastructure and speed up the decision making.
2.2.3 UAVs as nodes in mobile networks
The literature considers the use of UAVs as mobile nodes in communication networks or as parts of dynamic networks Hildmann and Kovacs (2019) to provide communication support and mobile communication infrastructure, such as a drone-based (mobile) wireless sensor network (WSN) or wireless local area network (WLAN) in which communication is realized node-to-node (N2N) using ad-hoc routing for messages between nodes and generally, applications where the topology of the network is dynamic and adaptive.
2.2.4 UAVs in Search and Rescue operations
Disaster response operations increasingly first deploy autonomous technology prior to dispatching human personnel. Drones can provide a first situational assessment and indeed, Spezzano (2019) highlights the ability to sense as an integral basic functionality of drones. Furthermore, the deployment of a UAVs (be it as single units or as a swarm) to act as a nodes in, or to entirely constitute, a cell network (Bupe et al., 2015) has been discussed in the literature.
For indoor operations, assets may have to operate in the absence of - or under the assumption of unreliable or compromised - communication infrastructures (Lee et al., 2015). Establishing a reliable means to communicate is often one of the first steps in deployment. Timely and efficient creation of infrastructure is often crucial but hampered by the uncertainty of the condition of the environment. The collision-free deployment process into an indoor environment (Trivedi et al., 2017) can be complicated.
2.3 Nature-inspired approaches to finding the shortest path
Cooperation and self-organizing collective behaviour (Camazine et al., 2001) has been studied to identify the underlying guiding principles, and has been successfully used them to increase the accuracy of models and to improve algorithms, cf. Navlakha and Bar-Joseph (2011). One of the defining characteristics of approaches based on e.g. the foraging behaviour of social insects is their distributed nature. Distributed collective sensing has been shown to be possible using only rudimentary cognition and being cost-effective for computational agents (Berdahl et al., 2013). Global goals can be achieved by locally processing the agents’ (limited) view on the world. Computer scientists have studied models from theoretical biology and applied the underlying principles to computationally hard (Sleegers et al., 2020) problems, often in the form of so-called heuristics (Pearl, 1984), which can find very good solutions in extremely short time. For a compilation of nature-inspired approaches (including the algorithms) we suggest Brownlee (2011) (available online for free111http://www.cleveralgorithms.com/).
2.3.1 Deterministic versus heuristic search
| Ref | LP | HT | Algorithm Used |
| (Wang et al., 2017) | Improved ACO | ||
| (Malone et al., 2017) | Artificial Potential Field Method | ||
| (Atten et al., 2016) | Multi Pheromones for tracking targets | ||
| (Cao, 2016) | Improved ACO Heuristic Function | ||
| (Krentz et al., 2015) | Simple ACO | ||
| (Fossum et al., 2014) | Repellent Pheromone for coverage | ||
| (Deepak et al., 2014) | Advanced PSO | ||
| (Wang and Wang, 2013) | Genetic Algorithm with ACO | ||
| (Aurangzeb et al., 2013) | Hybrid ACO w. Random- + RL based-Search | ||
| (Buniyamin et al., 2011) | Point Bug Algorithm | ||
| (Wang et al., 2011) | Dijkstra Algorithm | ||
| (Ahuja, 2010) | Fuzzy Logic with Counter ACO | ||
| (Gong et al., 2009) | PSO in partially known environments | ||
| (Sauter et al., 2005) | Combination of multiple pheromones |
Deterministic techniques have been successfully applied to path planning (Mac et al., 2016; Yang, 2009). Some prominent techniques include searches on Visibility Graphs (VG) and Voronoi diagrams (VD) (Leena and Saju, 2014), Cell Decomposition Method (Mac et al., 2016), and gradient techniques like the Artificial Potential Field Method (Bounini et al., 2017; Khatib, 1986; Sutantyo et al., 2010), amongst others. Deterministic techniques, like the simple Wall Follower Algorithm, work optimally in maze search problems, provided the algorithm has complete knowledge of the search space beforehand (Hanafi et al., 2013). When used in dynamic or unknown environments, deterministic techniques could end up in infinite loops or stuck in local optima, which could impede performance in SAR operations. Table 1 summarizes the research in the field of maze solving using deterministic and heuristic approaches for both local and global path planning, which particularly impacted our thinking.
2.3.2 The Dijkstra Algorithm
Dijkstra’s algorithm is a well-known search algorithm, developed by a Dutch computer scientist Edsger Dijkstra in 1959 (Nagatani et al., 2011), that can be applied on a graph. The algorithm is one of the solutions on Single-Source Shortest Path problem (SSSP) with directed or undirected graphs that has edges with non-negative weights (Ma and Mao, 2018). Dijkstra’s algorithm follows the greedy approach and finds the optimal path with the least total cost (shortest path from source to destination) (Xiaowei and Xiaoguang, 2016).
The algorithm begins with a graph with nodes, u or v, weighted edges connecting nodes denoted as (u,v) and weights as CostMatrix(u,v). The initiation of values and related steps before starting the path finding are:
-
•
An array holding all edges costs (distance) where all values are initiated to infinity except the first value(distance(source)) which is set to zero.
-
•
An array that contains all the nodes that have been visited during the search which by the end contains all nodes in the graph (denoted visited). Then, the algorithm proceeds as follows:
-
•
Until the array contains all nodes, we take the node with the least distance(v) (starting with the source because distance(source) = zero).
-
•
Node v is then added to the visited array indicating that it has been visited.
-
•
Update distance values of adjacent nodes (u) to the node v.
-
•
If distance(v) + CostMatrix(u,v) distance(u), then there is a new minimal distance founded for u, so distance(u) is updated with the new minimal value. Otherwise, no changes are made to distance(u). Finally, after the algorithm visited all nodes in the graph and the smallest distance to each node is found, distance will now contain the shortest path tree from the source node (Mondada et al., 2002).
Dijkstra’s main advantage is its efficiency; its weakness are (i) the potentially large computational time and (ii) the inability to account for negative edges in the (search) graph. A brief, non-exhaustive summary of examples in the literature on using Dijkstra is shown in Table 2.
| Reference | Cost Function | Alg. | |
| Ma and Mao (2018) | Distance, Gas Concentration | D, ACO | |
| Fawzy et al. (2017) | Energy | D | |
| Gupta et al. (2016) | Distance | D | |
| Fadzli et al. (2015) | Energy, Difficulty, Distance | D | |
| Liu et al. (2012) | Distance | FD | |
| Rai and Chinghtam (2011) | Distance | D, ACO | |
| Yazici et al. (2006) | Distance | D + others |
2.3.3 Ant Colony Optimization (ACO)
In nature, several insects and animals have an inert sense of swarming together to accomplish a task more efficiently. Swarming, when used as a means for collaborating can help optimize both, the time and the energy spent. Social insects such as ants effectively cooperate using stigmergy, i.e., the ability to use the environment as shared memory / means of indirect communication to quickly determine a short path to some attractor.
The object of attraction in our case it is the search beacon, cf. Section 3.3.1. Agents initially construct paths towards the beacon and deposit a pheromone along their path. As time goes on, more direct paths have been used more frequently and are thus incentivized: the probability of an ant taking a particular path is represented by its density function given by
| (1) |
where c is the degree of attraction to an unexplored path (the random element), is the bias to using a pheromone rich path, and A and B are the 2 paths to choose from at a fork . It is empirically demonstrated that and c often provide the best fit to experimentally observed behavior.
3 Search and Rescue in Maze-like environments
3.1 Modelling the problem
3.1.1 Indoor search and rescue operations: a maze exploration problem
By the very nature of the intended application domain, the environment for an indoor search-and-rescue operation is (at least partly) unknown.
Locating a specific position of a victim, reaching it and maintaining the path from that location to return to the entry point in such an environment is often, and aptly, modeled as a maze solving problem. The randomness of the maze walls can represent the random placement of obstacles in the area of interest. Therefore, the task of maze solving is essentially a path planning problem in an unknown environment. The main issues associated with maze solving include redundancy in found path Tjiharjadi and Setiawan (2016); Rivera (2012); Aurangzeb et al. (2013), and premature convergence while finding local optima Bounini et al. (2017) Zhangqi et al. (2011). Several studies have attacked these problems using different path optimization techniques.
Therefore, we used a collection of mazes with different layouts, sizes and complexities. The mathematical model as well as a measure capturing the complexity of these mazes are presented in Section 4.1.1.
3.1.2 The physical accessibility
Mazes as a concept are rich with historical connotations, but abstractly speaking can be seen as environments with obstacles, commonly oriented such that elongated hallways or paths are created. In contrast to a labyrinth, mazes have branching points, that is, there are locations where the next step (which does not reverse the previous step, i.e., going back) can be in more than one direction. This gives rise to the most commonly known property of mazes, namely that the finding of a specific location or the retracing one’s steps to return to the entry point, can be challenging. While there are many variations on this theme, in the simplest form (and, as it turns out, a sufficiently general description) a maze is a collection of locations combined with a accessibility relation that determines, for any two locations, whether they are directly connected. Due to this, mazes can be represented as graphs (Diestel, 2017).
3.1.3 The signal accessibility
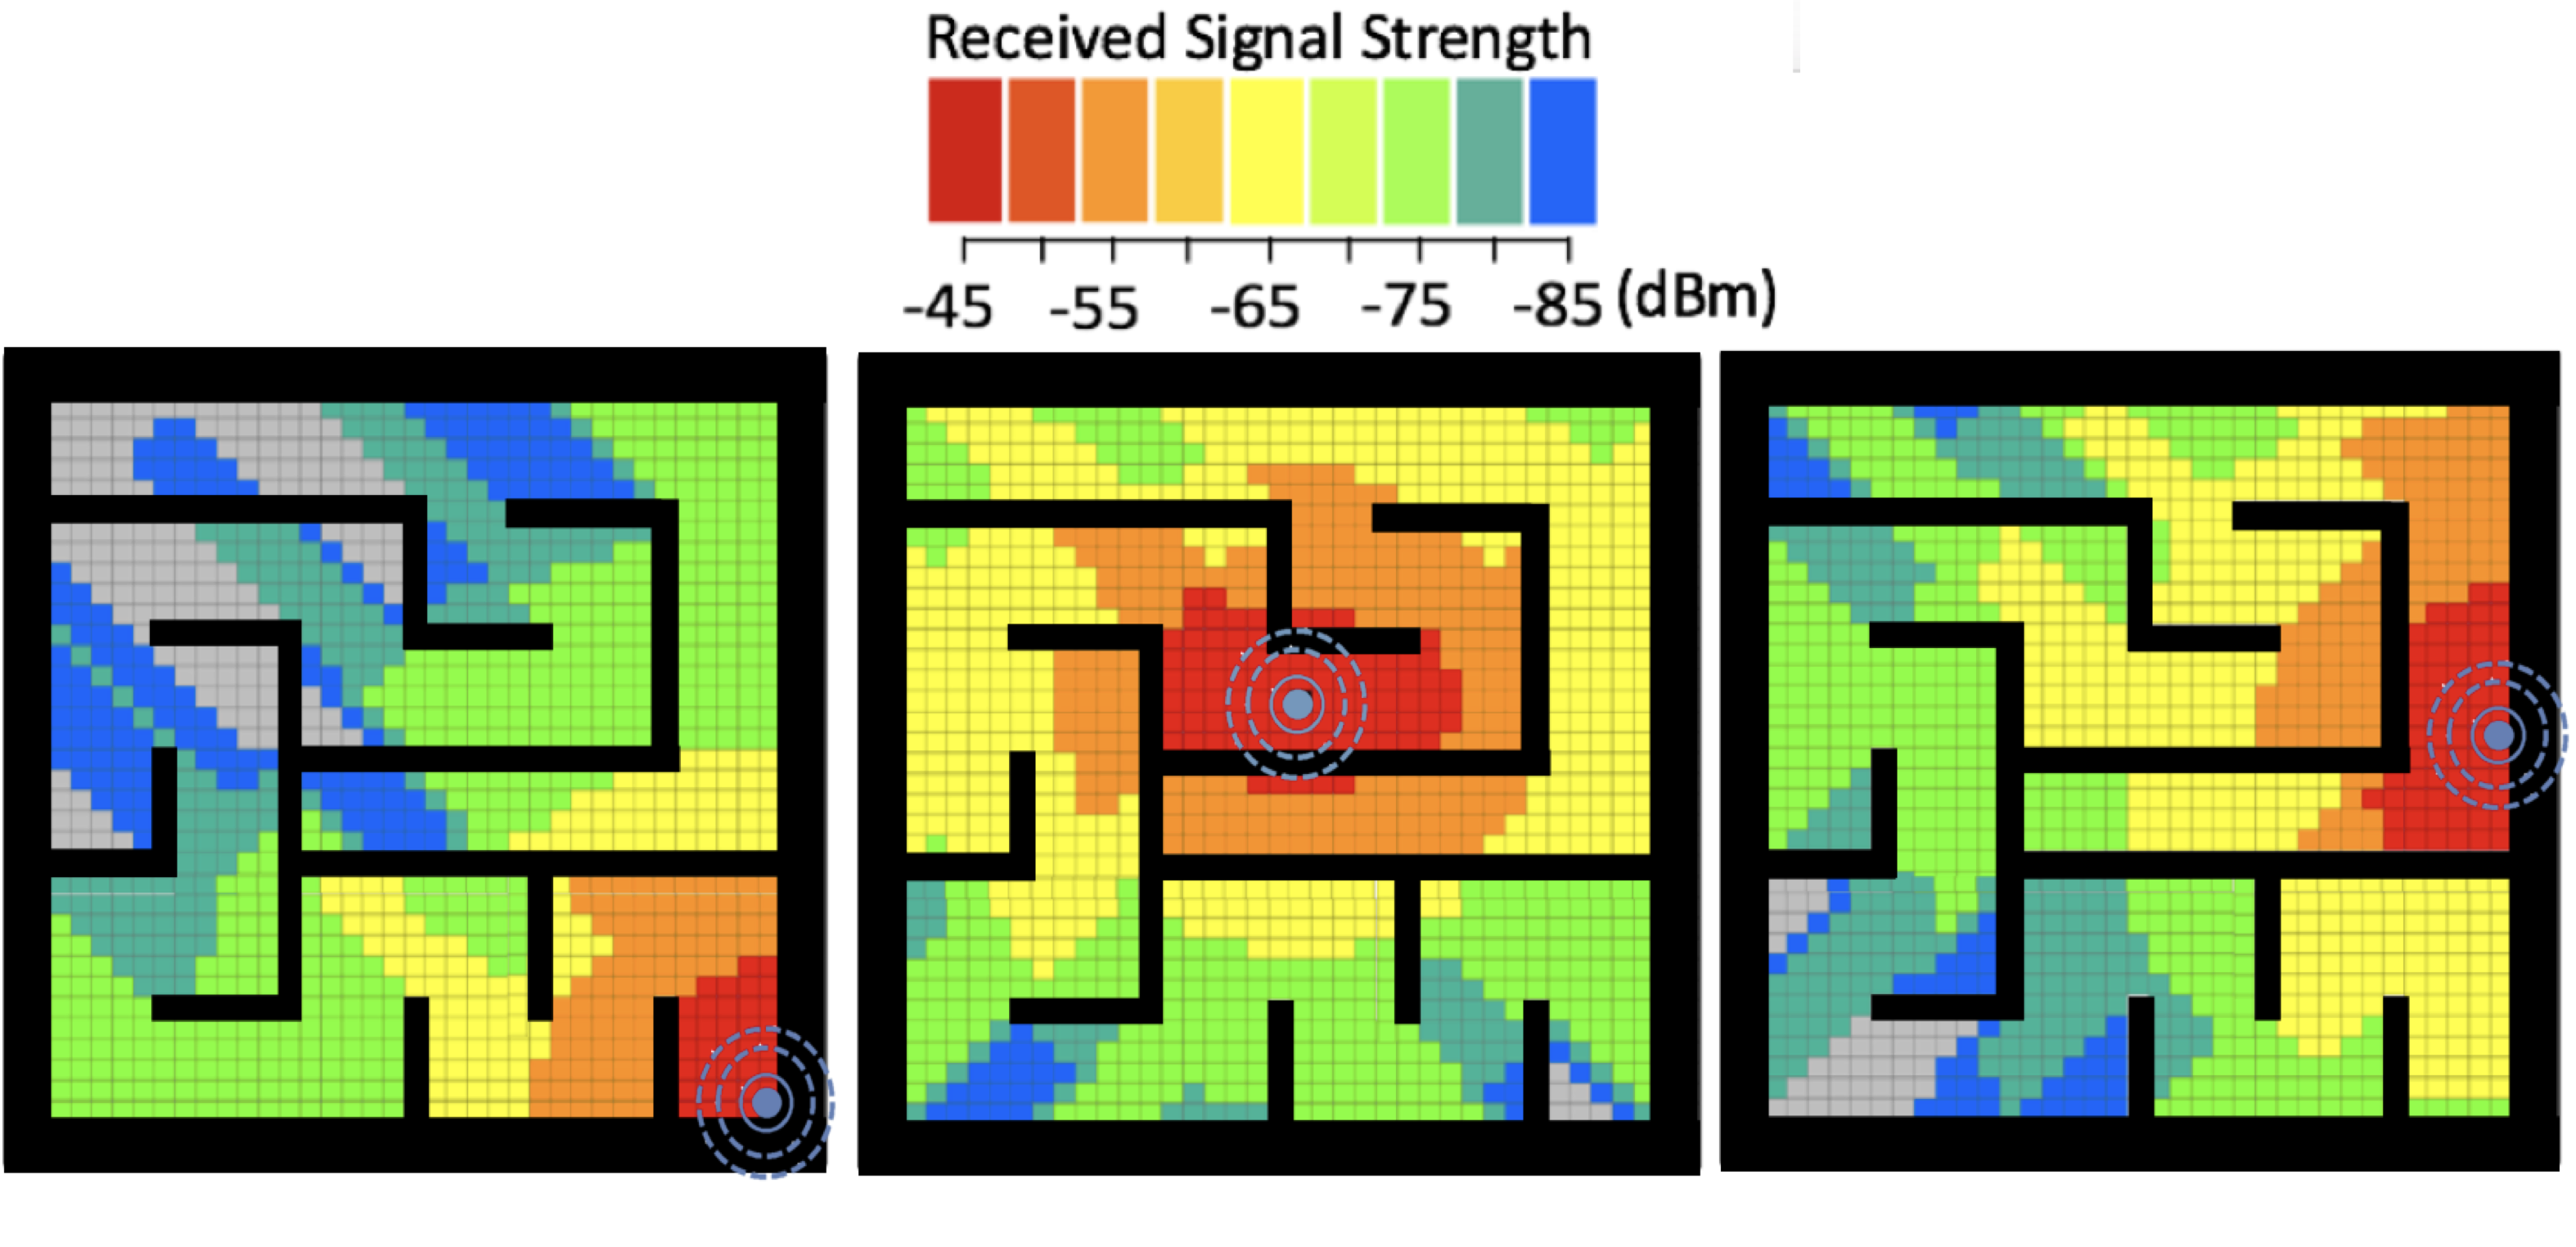
While walls (obviously) block passage for humans entirely, their impact on signals is continuous, as radio signals can penetrate walls and other objects to a certain extent. In the absence of blocking obstacles, a radio signal can be expected to extend outwards from the source homogeneously, with its strength decreasing with distance to the signal source or beacon.
3.2 Search, and Rescue: a problem of two sequential phases
Figure 4 (on the next page) depicts the maze solving equivalent of the situation in Figure 2, where the target is assumed to be at the “end”, or a far corner, of the maze, and the agents are required to solve the maze and set up a reverse route, without any prior knowledge of its topology. This is the analogy that will be used throughout the course of this paper. Several tests are carried out by varying different aspects of the maze, such as maze dimensions and complexity, and the size of the search group.
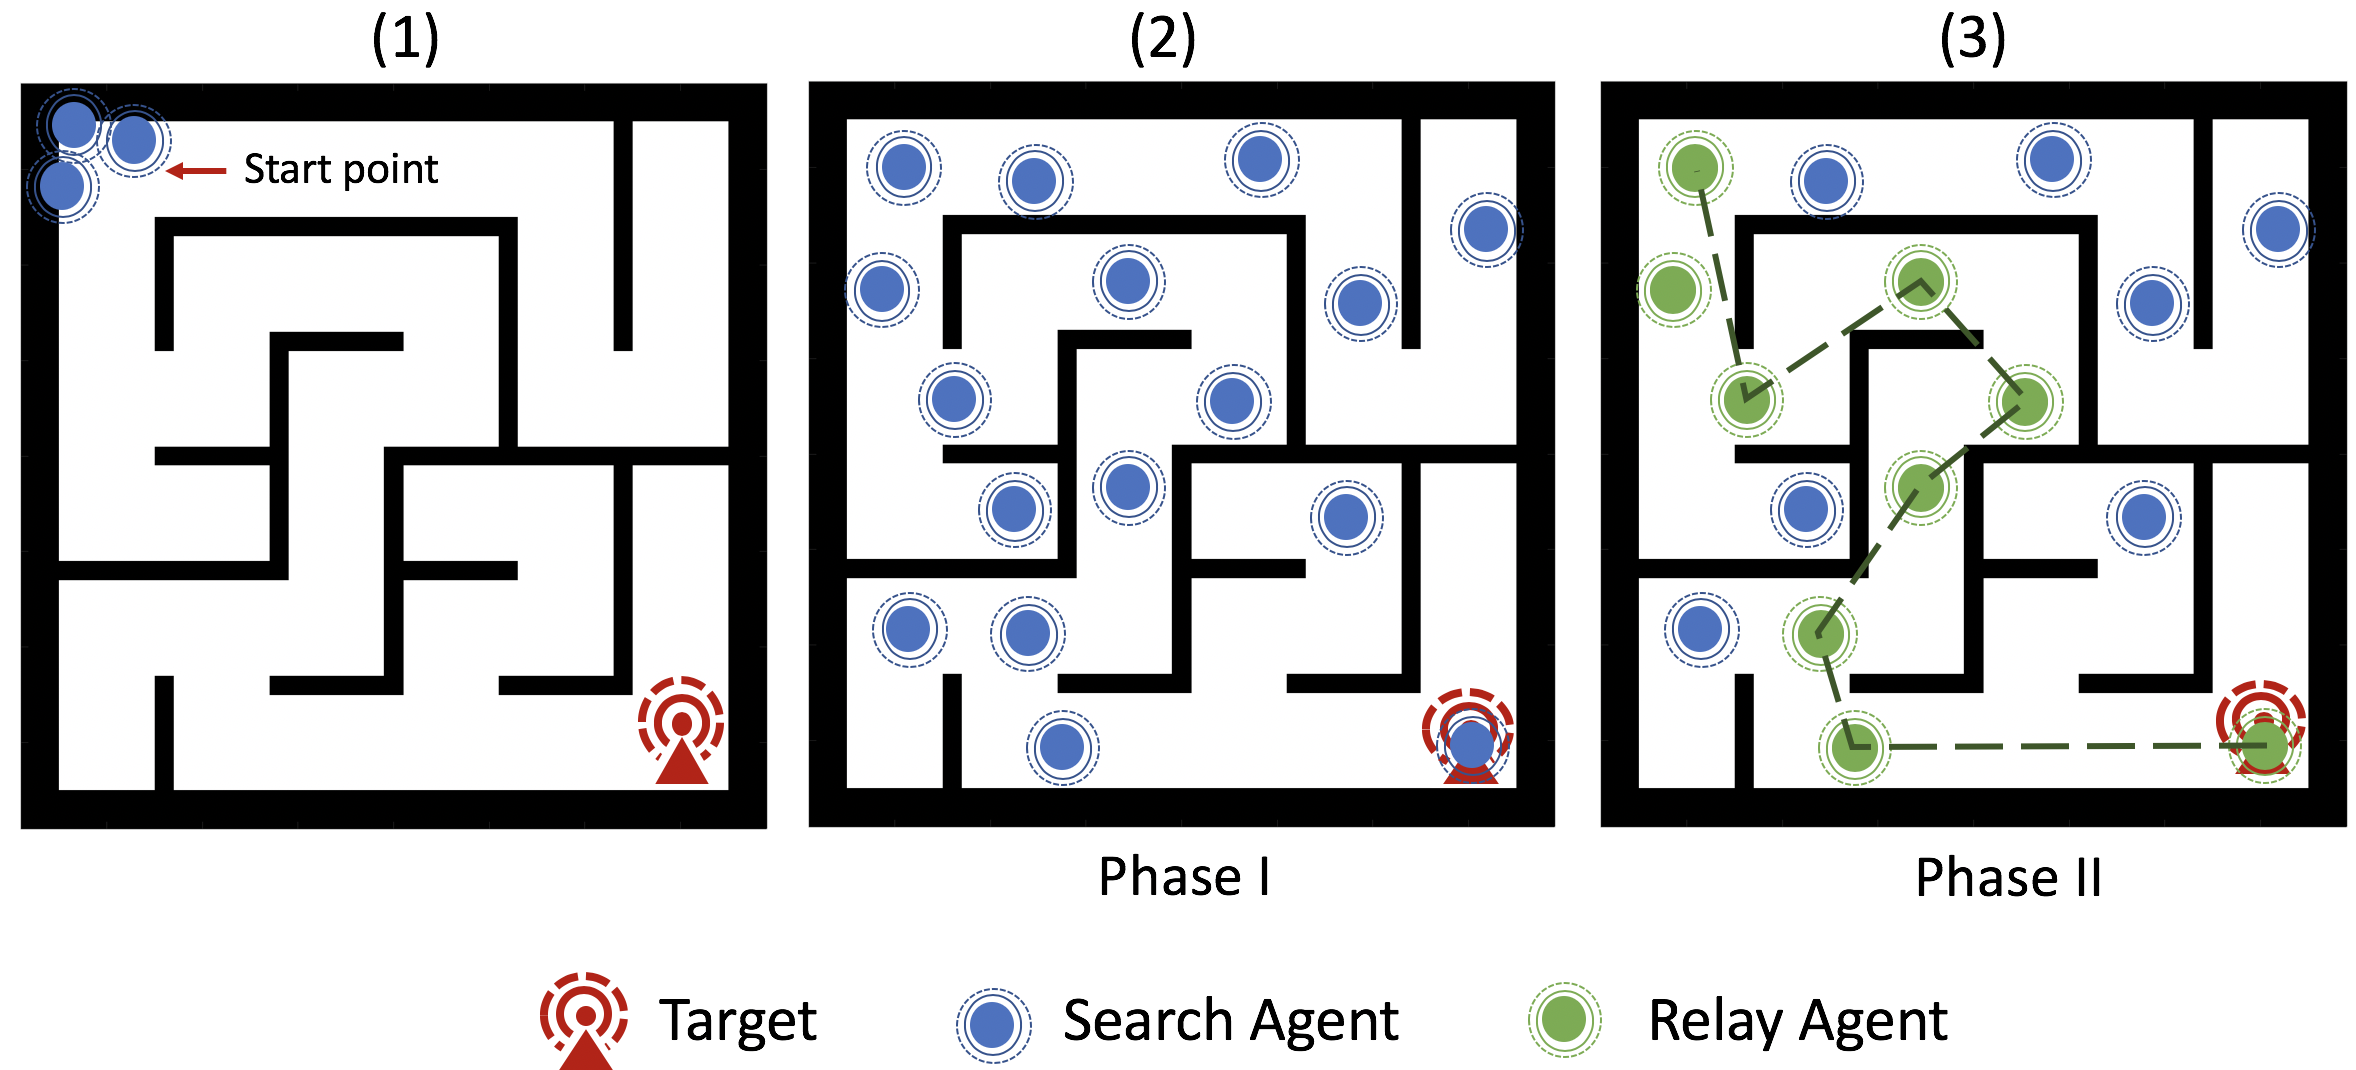
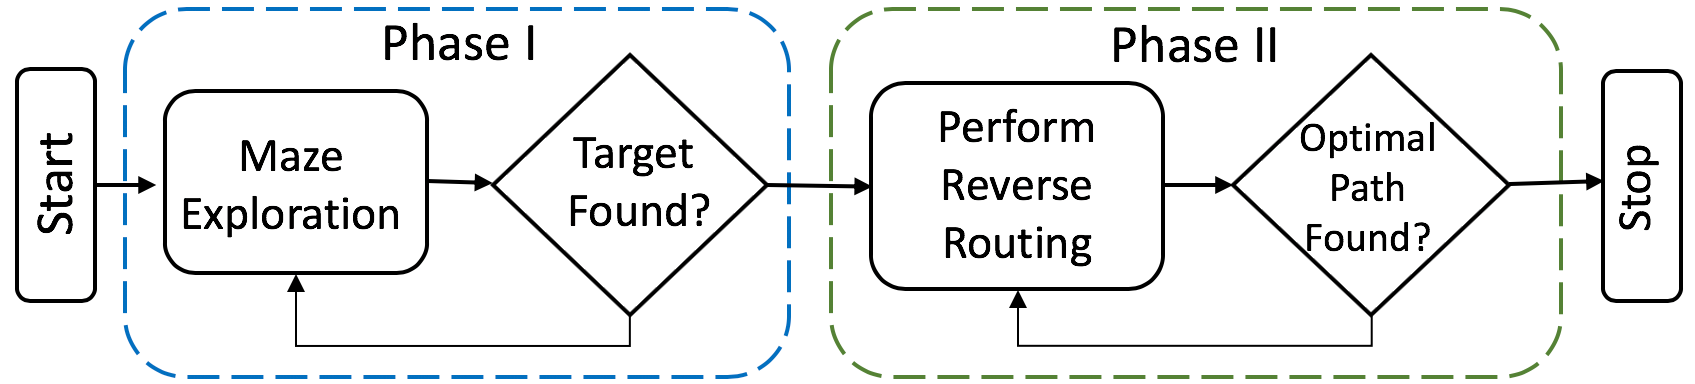
Therefore, the SAR operation is translated into a two-phase process, where the search agents first collaboratively search the area to locate the victim, and upon discovery, shift to relay mode where a temporary relay network is set up using a subset of the originally scattered search agents, to complete the rescue operation. Figure 5 shows the flow of control between the different sections of the algorithm through the search process.
3.2.1 Phase I (Search): Maze exploration
For the purpose of designing a path planning strategy for SAR, we prioritize finding a good path fast over finding the absolute shortest path. The path is further shortened in Phase II, during reversing routing in the Rescue Phase. Our ultimate focus is on the search time, rather than path length.
Therefore, in Phase I, a swarm of robots are injected into the search space. Each robots marks its explored territory in pheromone maps, local copies of which are shared between robots within a communication range. These pheromone map updates signal other robots to avoid already mapped/explored areas, quickening the overall exploration while shortening the search time.
3.2.2 Phase II (Rescue): Signal routing and victim extraction
Once the agents find the victim, they stop the exploration and the agent at the target finds a relaying route leading back to source node in order to pass the target’s information. This is done by finding and setting up the shortest possible link between the agents that are injected in the area. Among the possible methods to find the most optimal path, we employ a simple variant of the Dijkstra Algorithm that uses the distance as the cost variable. As a route is calculated backwards to the source, the selected next-hop agents are kept fixed in position to form a relay network to assist the rescue operation.
3.3 Solving Phase I (Search): Maze exploration
The first phase of the Search and Rescue operation starts with the search agents rapidly exploring the maze, partially guided by the strength of the received beacon signal, as well as influenced by the movement of fellow agents.
3.3.1 The Approach
A general procedure for the implementation of an ant system was introduced in Section 2.3.3. The AA local path planning based algorithm applies the ACO probability density function at each step to determine the next best step using:
| (2) |
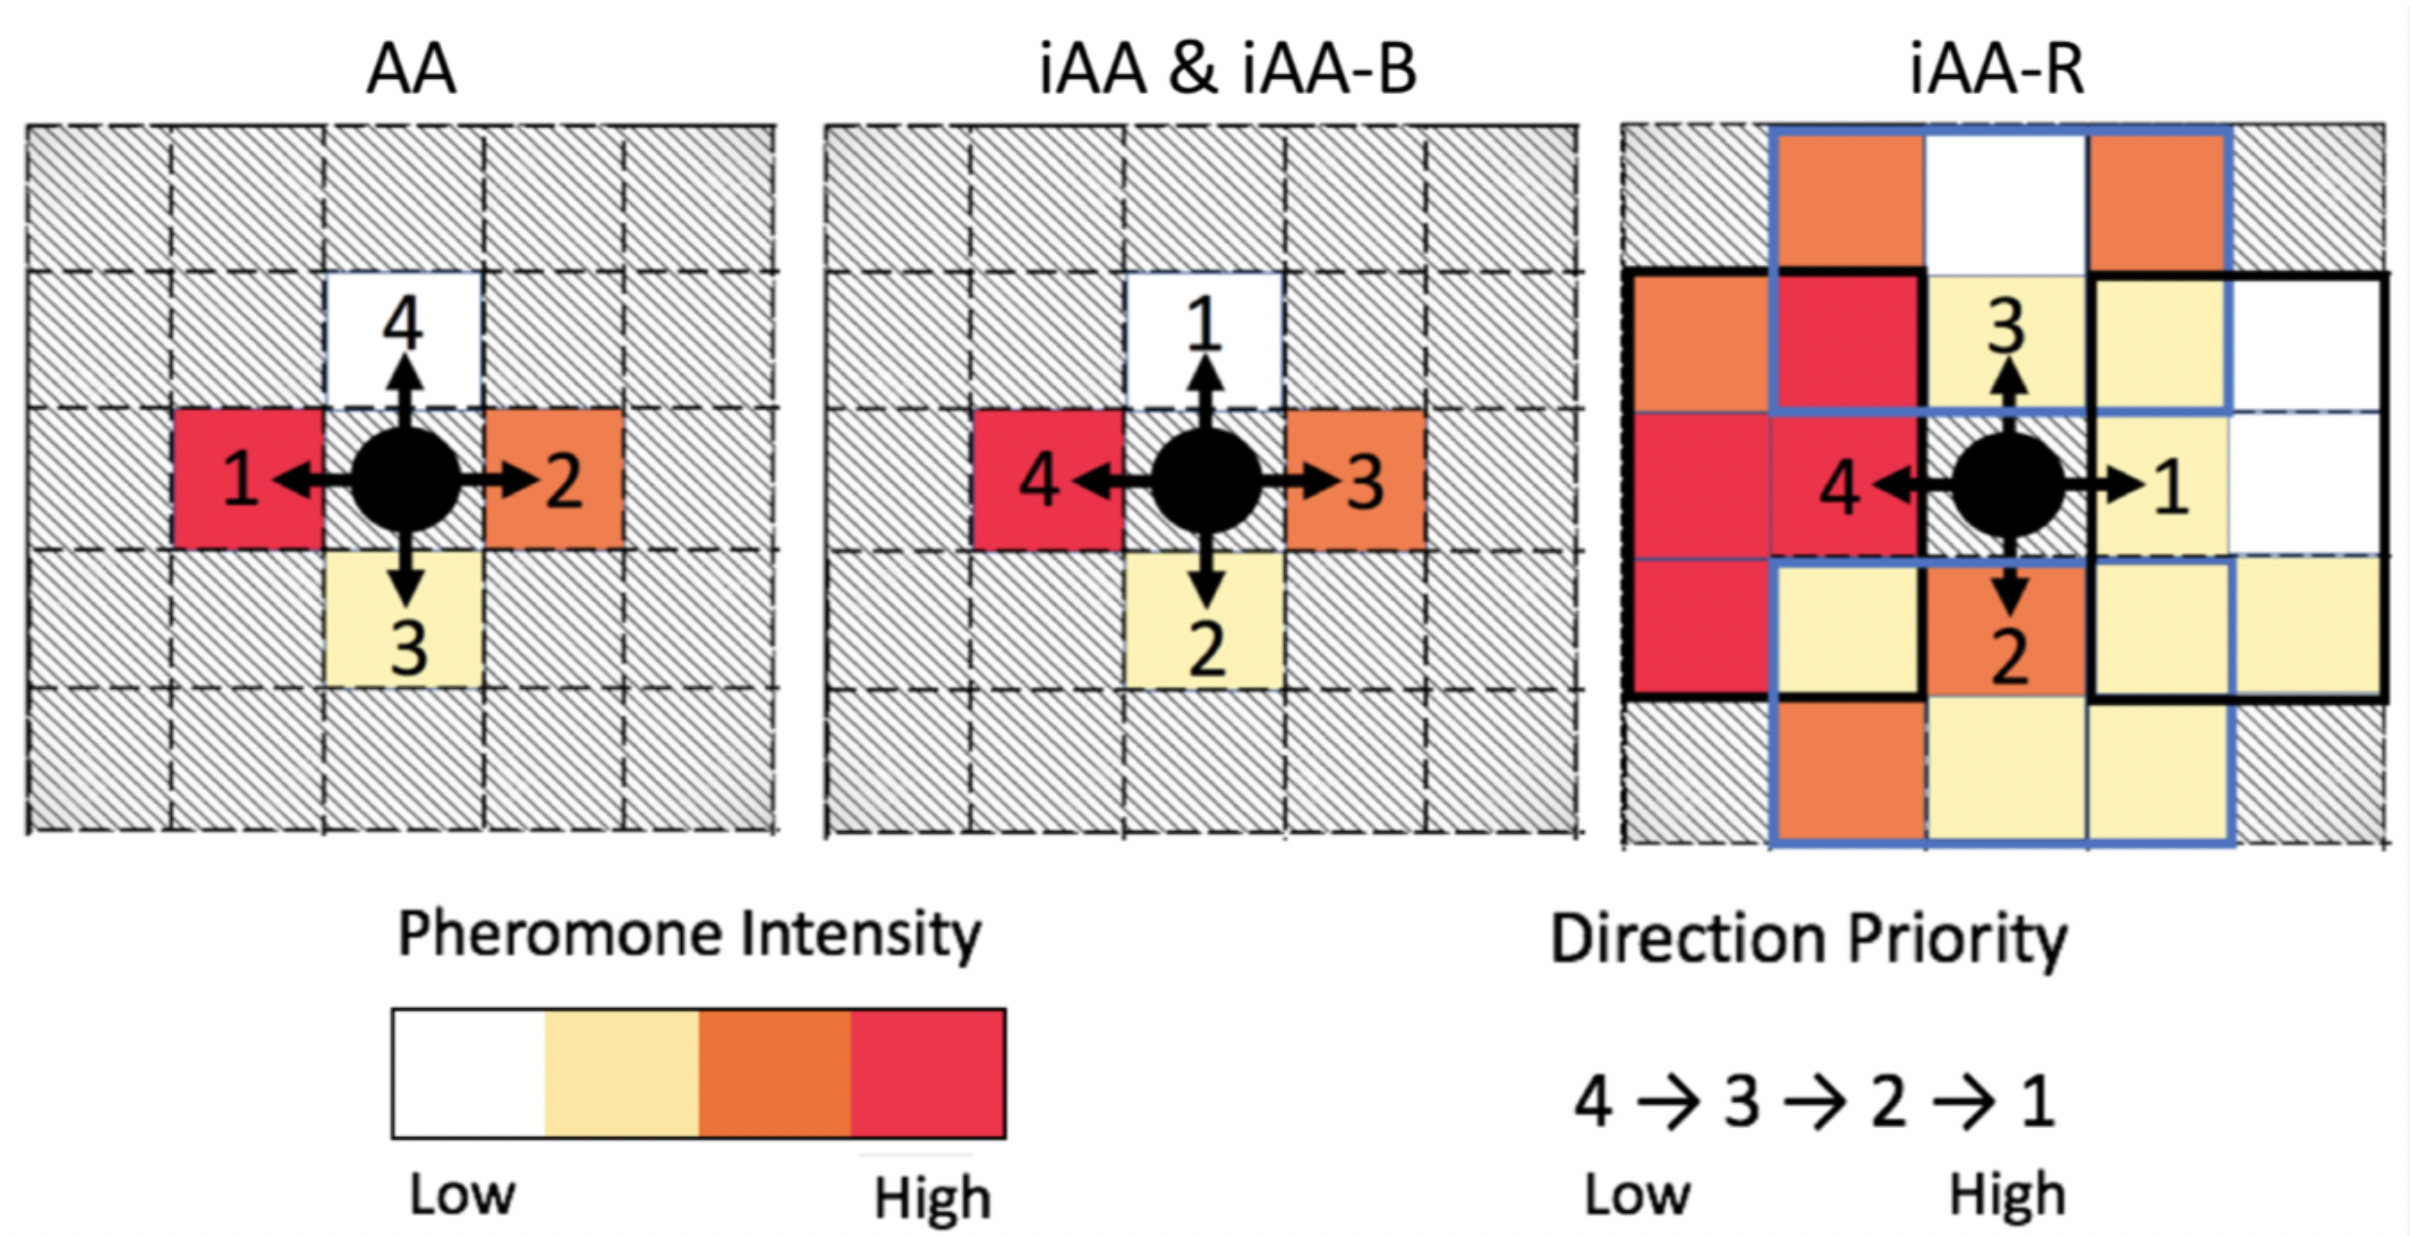
where is the probability of moving in direction , is the amount of pheromone in block . The summation () in Eq. 2 is over the 5 possible directions of movement (cf. Figure 6) with the direction being remaining stationary. Also, is the degree of attraction to an unexplored path, and is the bias in using a pheromone concentrated path. An example of AA parameter values would be , and , as demonstrated in Engelbrecht (2006).
With AA, however, ants were noticed to be clustering together, due to the attractive nature of pheromone which makes ants follow each other with little randomness. To counter this effect, and to quicken exploration, an inverted AA (iAA) model was developed with repulsive pheromones, encouraging ants to venture into unexplored territory. The probability density function used for decision making in iAA is
| (3) |
With promising initial results, 2 new versions of iAA, namely inverted-AA with beacon initialization (iAA-B) and inverted-AA with an increased sensing range (iAA-R) were also developed. The iAA-R was developed to test the effect of a longer sensing range on the speed of convergence of the solution.
The different models differ only in terms of the Probability Density Function used to generate the roulette wheel distribution in the algorithm. Figure 6 visualizes the decision making based on the pheromone levels for all 4 models.
3.3.2 The Algorithm
The pheromone used to implement the AA based algorithms is virtual, stored as matrices in individual agents and shared between agents. The pheromone matrix helps the agents keep track of the pheromone intensities, while at the same time, helps them roughly map out the explored area.
As each agent explores the search space individually, their pheromone matrices would differ. Hence, when 2 agents pass by each other, they exchange their copies of the matrix, to combine their search results, and come up with more inclusive version of the search space and pheromone intensities.
3.4 Solving Phase II (Rescue): Signal routing and victim extraction
In a Search and Rescue, once the trapped person, or the target is located, the MANet nodes reorganize themselves into a relay network to inform the base station of the target coordinates and call for help. In this phase, for computation purposes, the scattered MANet nodes can be treated like a graph : a data structure consisting of two sets , where is the set of vertices and is the set of edges connecting any two vertices in the graph.
A graph is usually represented as a diagram where vertices are symbolized as points and edges as lines connecting its end vertices (West et al., 2001).
Graphs have two main traversal approaches: Depth First Search (DFS) and Breadth First Search (BFS). DFS approach starts graph traversing at an initial node which is called a root and then goes down one path (branch) till the end of it, then it backtracks until the root and goes for another path to explore it. That is done until the graph is fully traversed. On the other hand, BFS starts at an initial root node then moves layer by layer in the graph where a node is explored first with its neighbors then explores node in the next layer. These layers are called depth-levels (West et al., 2001).
3.4.1 The Approach
A graph is formed after exploration with agents as nodes and the edges are links between agents. Links represent Line-of-Sight and Transmission Range. From this graph and its adjacency matrix (the weights of the edges) we generate the Cost Matrix. The weights of the edges are evaluated based on the Euclidean distance between two agents ( and ) defined in the following equation:
| (4) |
In an ideal scenario, on a successful conclusion of Phase I, the agents would be already interspersed in the maze (or search space) with no big voids or obstacles between them and a path, back to the origin, can be easily found using the classic Dijkstra algorithm. However, the presence of obstacles or non-uniformity in the arrangement of the agents, in the form of large voids that disrupt communication links, a position based algorithm is proposed find a feasible complete path. The algorithm focuses on stopping the agents in the right locations to achieve a better spread of the agents in the environment.
3.4.2 The Algorithm
To keep track of the diffusion of agents through the maze, we make use of a an individual measure of depth. In a tree data structure, the depth of a node is simply the number of edges from the tree’s root to the node itself (Giannopoulou, 2009) and therefore easily calculated.
In the maze-routing problem, the same concept can be applied where the tree’s root is the source and the depth there will have the value . As the agents move away from the point of origin, some of them will lose direct access to the source either because of maximum range constraint or because of line-of-sight if walls break connections. As a rule, agents will chose from all connected nodes that with the lowest depth, and then sets its own depth to this . The individual depth of agents that concurrently and iteratively apply this rule is the number of hops to the entry point (explicitly identifying the path).
Figure 8 shows a flowchart of the working of the system in Phase II. The Laststopped agent shown, is the one that was last chosen to be stopped by a previous stopped node and has to choose an agent from the nearby set of agents which abide by the following requirements:
-
•
It is within the transmission range (TRange) of the Laststopped Agent.
-
•
There are no obstacles in between it and the Laststopped.
In Figure 8 the first agent has depth of (i.e., it can see the source). The other agent has depth of (i.e., one hop away from the source). The next agent to be chosen is the one with the lowest depth (here: depth ). After the node is stopped (within communication range and not blocked by obstacles) the search ends and Dijkstra is used to find an optimal return path.
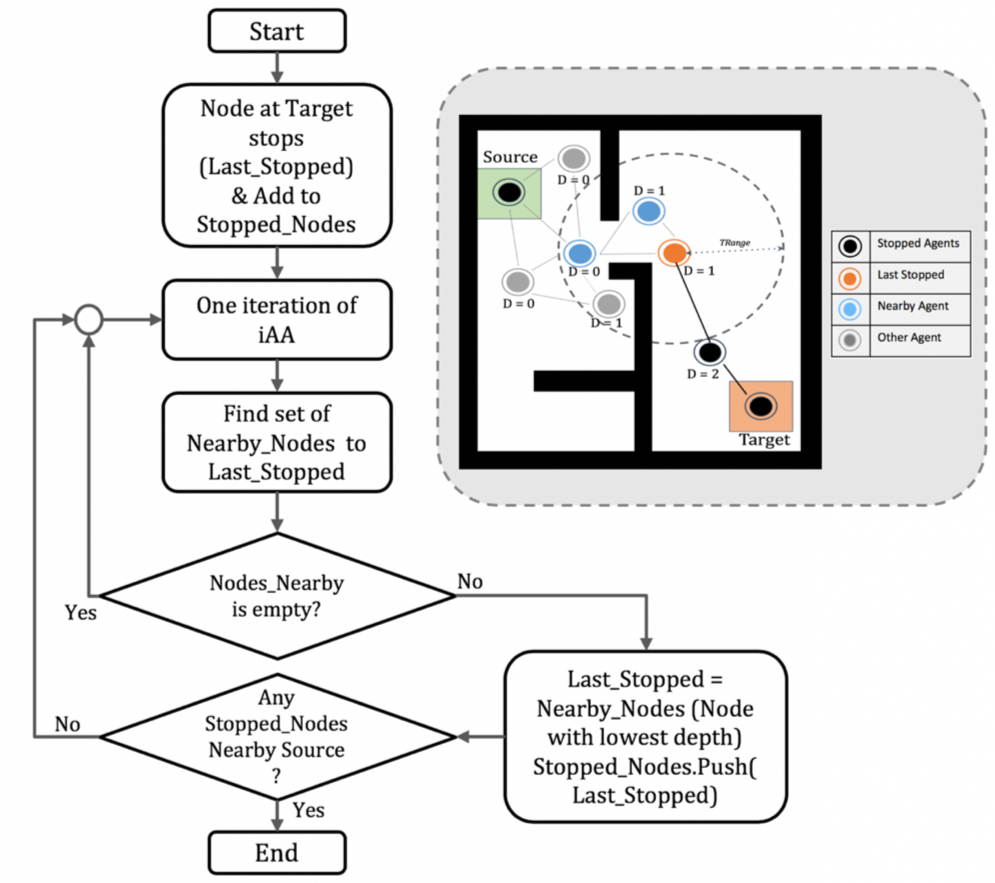
The solution proposed is considered a semi-distributed model. At first the agents move in a distributed manner for the exploration part, then when the target is located the agents will broadcast a message that target is located back to source which will then find the shortest path in a centralized fashion.
If no path is constructed at first the agents will continue with the proposed improvement that is distributed. Agents will communicate when target is found and then the graph is constructed where source and target are included in it, if not, then the agent at target try to construct a path by searching for agents nearby until source is part of this path. Finally, the source can communicate to agents which agents form the optimal path. Figure 8 explains how the agents communicate when target is located.
3.4.3 Routing
For a simple simulation, we can assume the walls are impenetrable to the signal exchanged between the agents, and that the agent should have line of sight requirement to establish a connection to other agents. Figure 9 shows the scenario where a path initially is not constructed when the target is reached because there is no subgraph connecting the source to target.
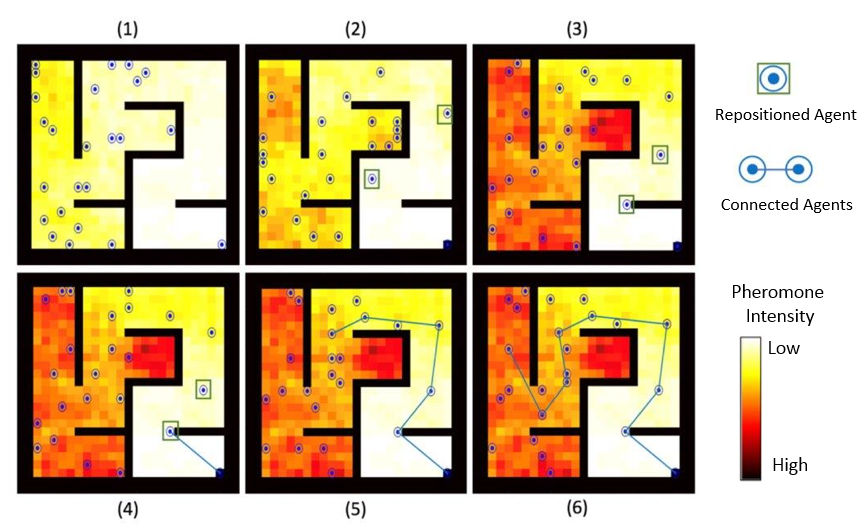
In Figure 9 (1) the target is found (node circled in green); however, when calculating the distances which is the cost matrix and finding the possible connections, there is no path found between source and target nodes. The exploration continues using the iAA except for the node at target as it stops and tries to connect to nearby nodes (Figure 9 (2)). When a node is nearby the stopped node (Figure 9 (3)) it is able now to connect to it and it stops it.
The last stopped node identifies nearby nodes. Then, the model continues doing the same with every node connected in the sub-graph until one of the nodes is nearby the source (Figure 9 (6)). After reaching this state, Dijkstra re-runs, to ensure path optimality.
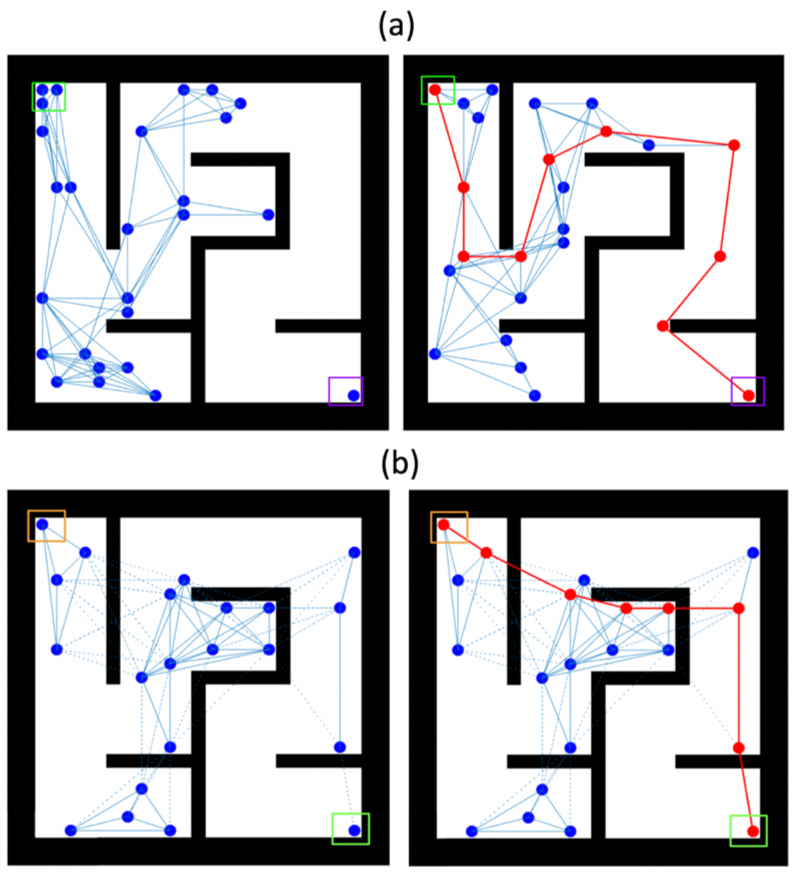
Figure 10 (a) shows the situation of the agents before and after the routing performed. The agents marked in red are the part of the developed relay network. The remaining agents can be called back to the base station without affecting the performance of the relay.
4 Materials and Methods
4.1 Modelling choices
4.1.1 Maze size and complexity
As stated above, we model a collection of mazes with different layouts, sizes and complexities. To simplify the computation and implementation of the system, the mazes were discretized using the grid method similar in Yang (2009). The maze is decomposed into a grid, where the unit grid size is the same as the agent size, thereby making the step size equal to a unit grid.
This discretization helps visualize the system as a matrix which makes computation of signal reception, agent localization, and move generation easier. Naturally, future work would address the situations where the size of the agent and the size of the grid unit are not equal. Figure 11 shows examples.
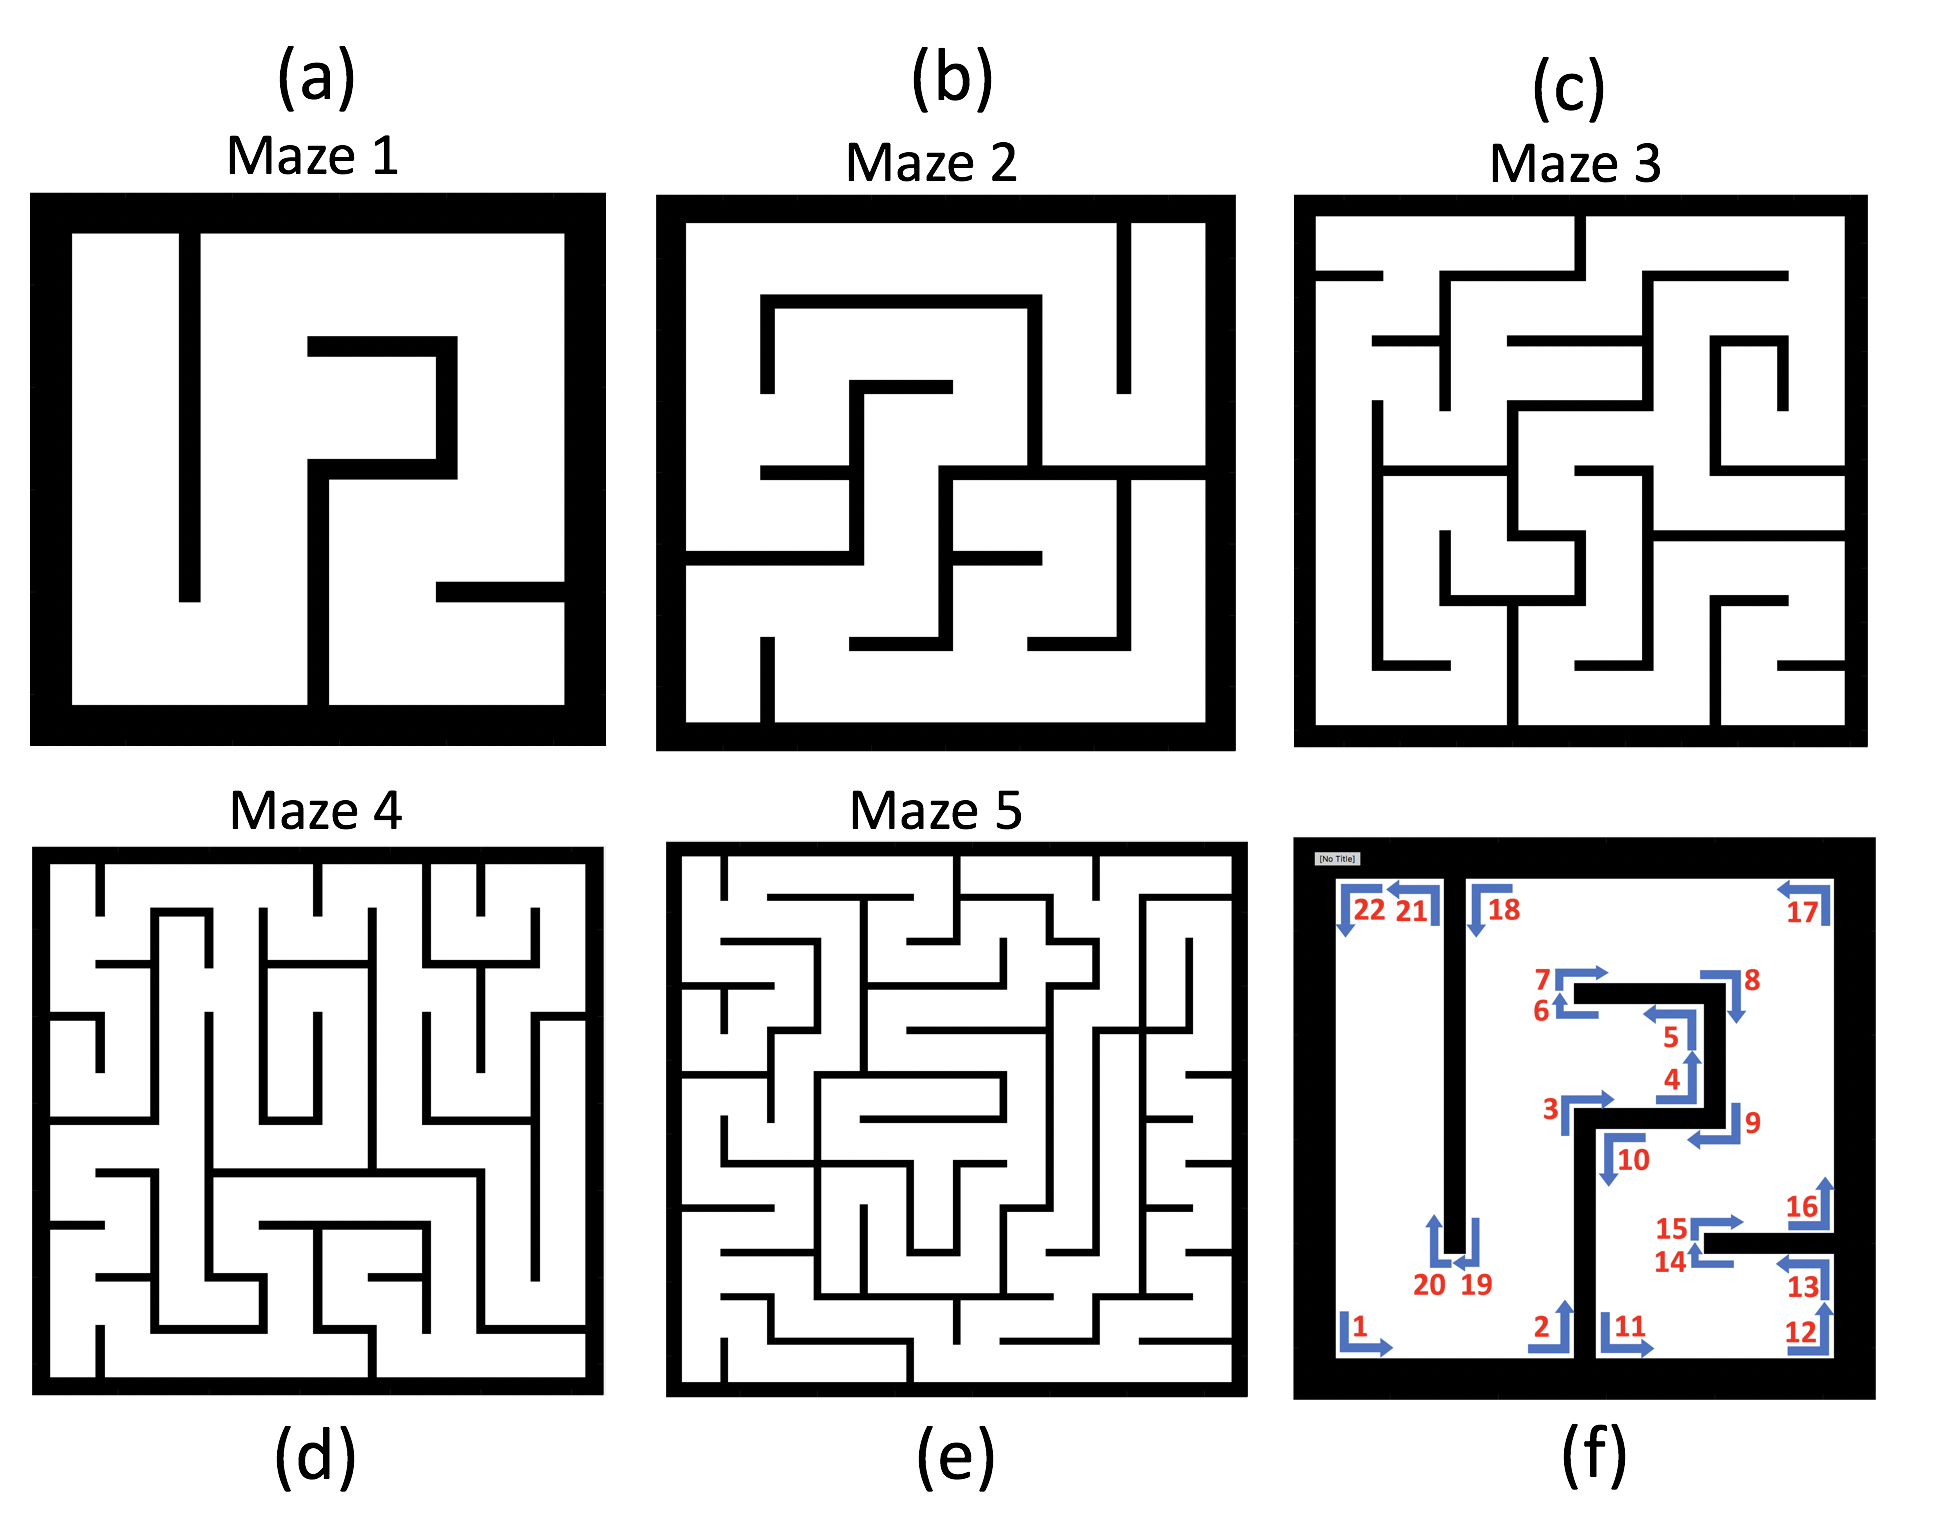
For each of the 5 types of mazes, 10 different layouts were generated randomly. Table 3 summarizes these maze sizes and provides a comparison of the respective complexities. We define maze complexity as the number of 90 degree turns an agents can make. Table 3 provides the values for our mazes.
| Dimensions | Complexity | |
| Maze 1 (M1) | 27 27 | 22 |
| Maze 2 (M2) | 39 39 | 47 |
| Maze 3 (M3) | 51 51 | 81 |
| Maze 4 (M4) | 63 63 | 129 |
| Maze 5 (M5) | 75 75 | 210 |
4.1.2 Signal progression through obstacles
To model indoor signal propagation, the ITU model, proposed by the International Telecommunication Union, described in Rappaport et al. (1996), was modified through the addition of the term to account for attenuation caused by the internal walls/obstacles to the following form:
| (5) |
where is the wall attenuation factor (for brick wall) (Wilson, 2002), is the wall count encountered, MHz is the frequency channel of communication for standard Wi-Fi, and d is the distance, in meters, from the beacon source (Rappaport et al., 1996). Figure 3 shows the signal propagation for different beacon placements.
In real life situations, a radio wave is usually able to propagate through obstacles (depending on the thickness and material of the obstacle), but the signal strength significantly reduces due to a phenomenon called path loss for which we use the ITU model to model an indoor beacon propagation. This path loss, can be in effect simulated by artificially lengthening a link across a wall. Accordingly, Equation 5 is rewritten to calculate the re-interpreted distance between the agents as:
| (6) |
This value is then fed into the Cost Matrix (introduced in a simplified form in Section 3.4.1). Due to this, the Cost Matrix represents the new weight of the edge between 2 nodes and the Dijkstra algorithm, as we already described, is ran to find the shortest path from the target back to the source with the possibility that the signal will penetrate the walls. A visual representation of how walls can affect signal strength was shown in Figure 3; the impact of allowing sufficiently strong signals into the path even though the signal goes through a wall can be seen in Figure 10, where the top version does not include signals that pass through walls, while the bottom does.
4.2 Data collection
Searching in an obstacle course such as a maze with a heuristic technique such as an Ant Algorithm is a process “rich in randomness”, leading to excessively random search statistics (in terms of run time, number of steps, etc.). Therefore, in order to properly assess the performance of our implemented techniques, we carry out simulations on a collection of mazes with different layouts, sizes and complexities, each with 50 repetitions averaged out to realize the extent and appropriateness of the variations in the results. Figure 11 on page 11 shows the 5 different maze complexities that were simulated, with Table 3 (on the same page) providing a comparison of the complexity values for these types. For each of these 5 types a total of 10 different layouts were generated to further gauge the affect of the randomness.
To study the impact of AA on the autonomous ants’ led search in the maze, a simple ACO based algorithm along with a standard random search were implemented for comparison.
A set of experiments were set up to simulate AA and iAA algorithms with variable group sizes ranging between 100 and 600, with 100 unit increments.
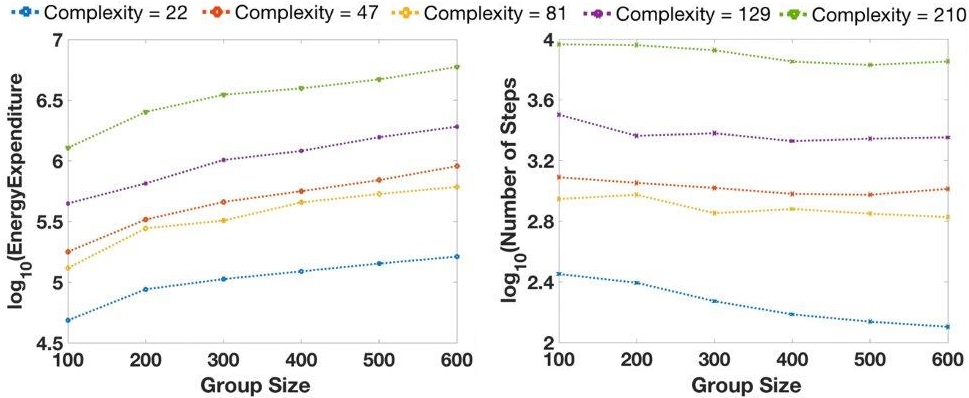
Figure 12 (a) and (b) visualize the trend of the energy expenditure for 5 different maze complexities (measured, as shown in Figure 11, in terms of 90 degree turns encountered) of 22, 47, 81, 129 and 210 (cf. Table 3). There is a 30% average increase in energy expenditure in solving the least and most complex mazes for the same group size. The decrease in number of steps needed to solve the maze is more obvious in the larger mazes, with an approximate 27% decrease in the largest maze. The energy expenditure increases almost linearly with an increase in the number of agents in the search group.
| Direction | Cost |
| Hover | 0.5 |
| Forward | 1 |
| 90∘ turn | 1.5 |
| Backward | 2 |
We note that the entries in the Table 4, while commonsensical, are somewhat arbitrary and it is relatively easy to imagine a practical situation where a different cost applies to specific directions choices. This, in turn, introduces some quantitative changes to the output in Figure 10.
4.3 Performance measures
4.3.1 Benchmark comparison
As a benchmark, we compared the performance of our solution with another study that used ACO coupled with Fuzzy Logic and also presented results in terms of number of moves needed to solve the maze Ahuja (2010). For the purpose of benchmark comparison, we set up mazes to the other study with the same sizes of and units. See Section 5.1.1 for the results.
4.3.2 Cumulative effort (steps)
We equate the cumulative work of the swarm to the number of steps taken by them. Agents act once per iteration but we only count this if it resulted in displacing the agent (i.e., we ignore the action of staying put). The summation of the steps taken by all agents in all iterations leading to the discovery of the target is the measure of the cumulative effort of the team of agents.
4.3.3 Estimated energy cost
Similar to the above, is the energy expenditure of the swarm, for example due to the limitations in search agents’ battery lifetime. The agents’ battery powers both its mechanical and communication functions, which means a faster depletion of the portable energy source and makes the issue crucial in the success of the operation. As elaborated below, the energy expenditure of each possible change to the ongoing linear forward motion (which itself is represented as “one step forward”) is accounted for through a modification of the forward motion by a multiplicative factor, presented in Table 4. The cost for moving backward is highest, as we envision the backward motion as a complete halt followed by a reversal in direction, which would require the maximum energy.
4.3.4 Assumptions and considerations
Considering all agents expend comparable amount of energy for communication with each other, we approximate it as a constant for a particular group size and neglect it in energy calculations to simplify simulations at this stage of analysis. The assumption is that knowing a group size allows designers to add the energy needed for the communication as an additive constant.
The main variable component in energy consumption between agents of a group is the directed motion of the search agents through their consecutive steps. Continuing in the same direction of motion is always cheaper than introducing a displacement in direction. As our agents are limited to a four-directional motion (in addition to an option to hover), the only direction changes possible are a 90∘, to either side, or a 180∘ turn, meaning a backward motion. Considering the different amounts of energy needed to slow down (control speed), and change direction in each motion possible, a motion based cost system was developed as shown in Table 4.
5 Results and Discussion
5.1 Phase I: Maze exploration
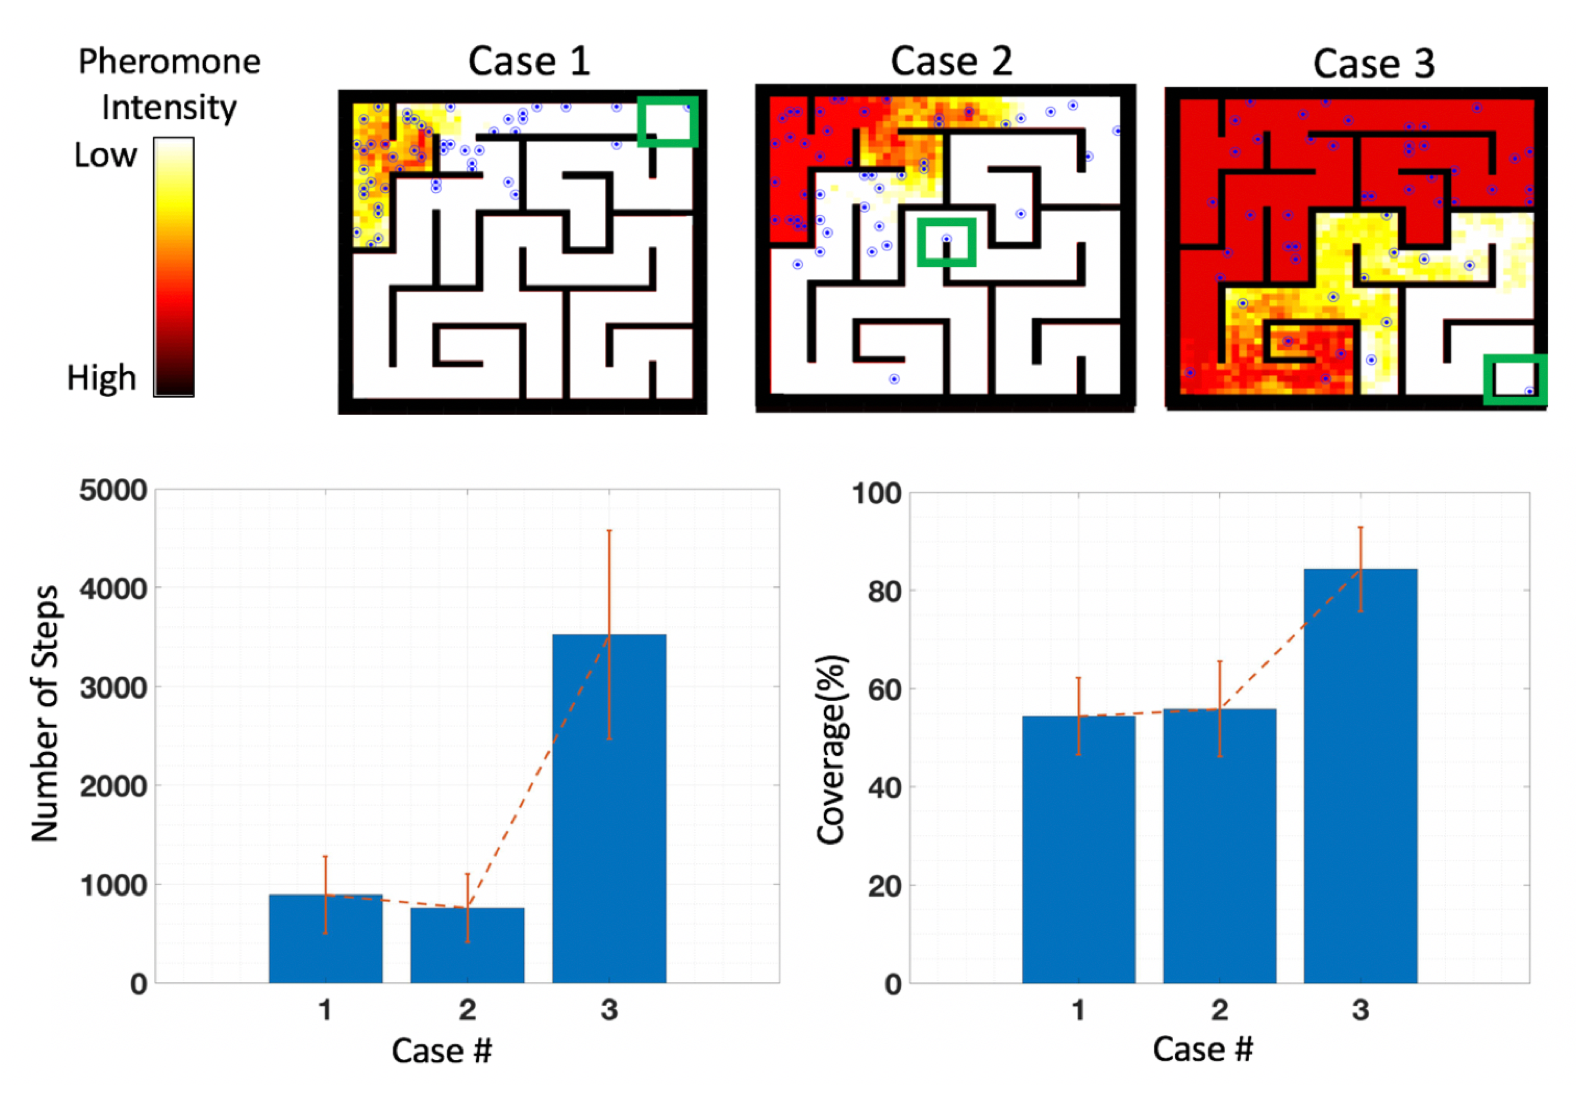
Although maze exploration was not a key motive for the research, it is of interest to discuss how well the heuristic part of the iAA system covers the maze during the search, as the mapping ability could lead to other applications in the search process. As can be expected, the search results in almost a complete exploration (more than 80%) of the search space, in a special case depicted by Case 3 in Figure 13, when the target is located at the very end of the perfect maze. Exploration is much lower in cases where the target was located either close to the start or midway through the maze, but is still above 50%, which implies that the iAA technique could also be used for that purpose.
5.1.1 Benchmark comparison
The performance of our iAA model was poorer than the benchmarked technique for both maze sizes, when tested with search group sizes of 2 agents and 5 agents, which is very small size for a swarm, as can be seen in Figure 14. We emphasize we chose such small groups to make a comparison with the closest relevant reference. However, our iAA algorithm was quicker to converge and needed fewer steps, when the group size was increased to just 10 agents. A likely reason for the better performance in our system is due to the poor exploration capability of small groups sizes, such as those with 2-5 agents.
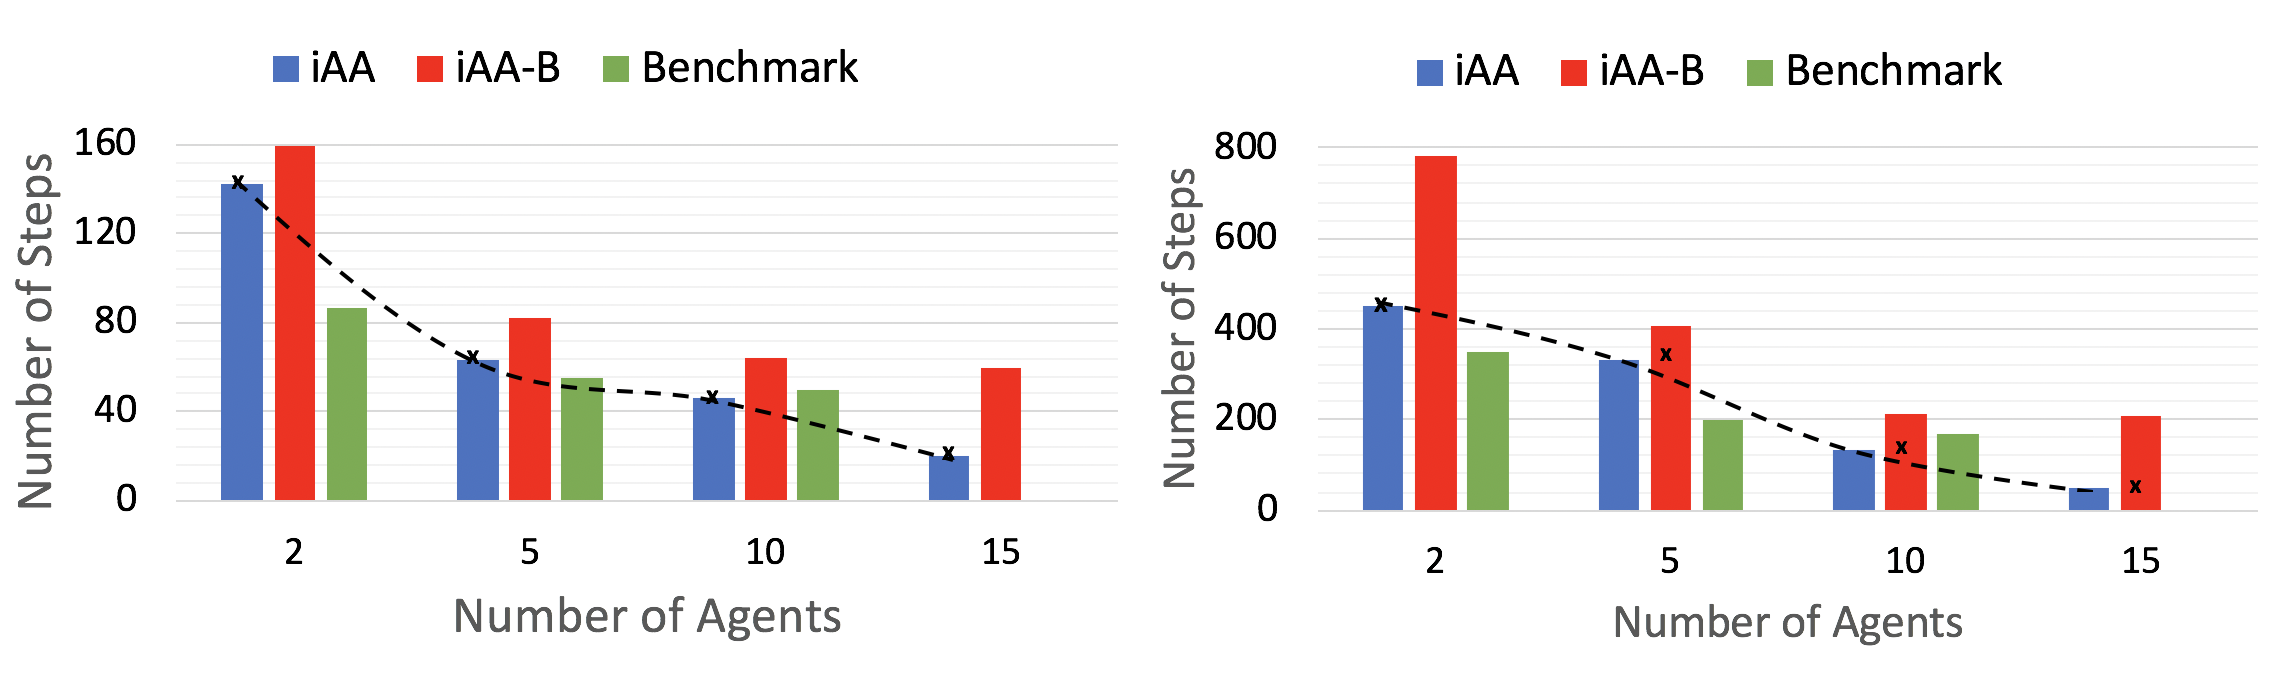
For the maze sizes used, at least 7-10 agents would be necessary to promote quicker exploration that would lead to better results, as can be seen from the extrapolation of the trends in the results in Figure 14. These small group sizes were tested only for comparison with the results presented in the benchmark. The slope of our solution, between different agent group sizes (measured by the number of agents in a group, cf. Figure 14), is more favorable than the benchmark, as can be seen from Figure 14. iAA also shows a qualitatively same behavior in a larger maze (right panel of Figure 14) with quantitatively better performance with 10 or more agents (quantitatively better than in the case of the smaller maze). Therefore, the more the agents, and the bigger the maze, the more likely our proposed system is to outperform the benchmark study. Lastly, we point out that our iAA-B model performs less well, as could have been guessed from data in Figure 7 by extrapolating from large search group used in that study towards much smaller ones (in other words, the comparison of the performance between iAA and iAA-B holds across the large set of values of the number of search agents parameter).
5.1.2 Cumulative effort (steps)
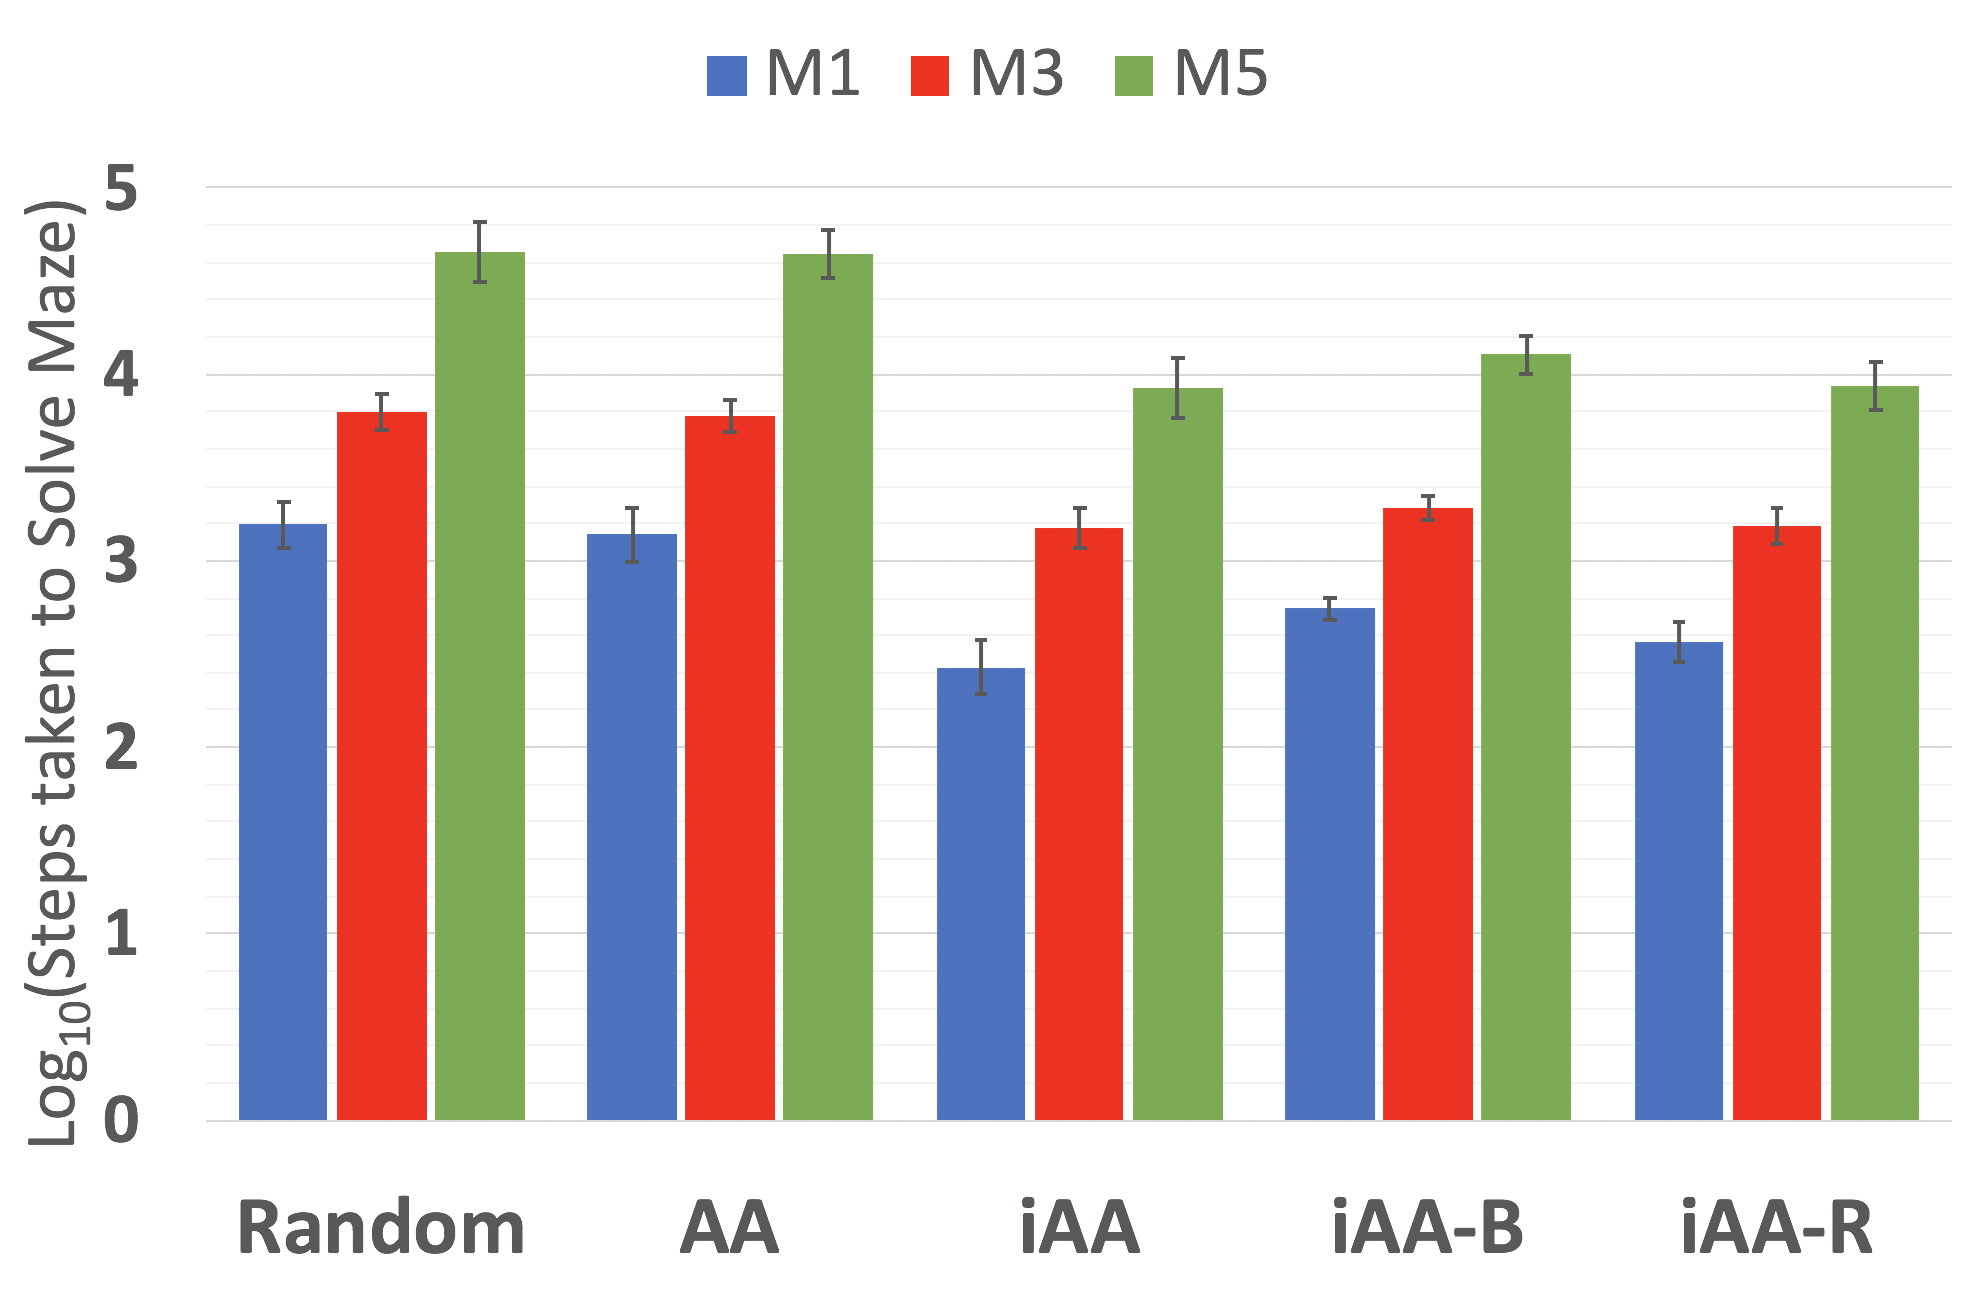
Figure 15 (previous page) shows a comparison between the performances of the 5 models (when simulated with 100 ants each on the 3 mazes, with 30 repetitions each). The pure AA based model did not introduce much of an improvement, compared to a purely random solution. This lack of improvement can be attributed to the clustering effect of pheromone in pure AA that is likely limiting the exploration of the maze. iAA is the best performing algorithm among the 5, closely followed by the performance of iAA-R.
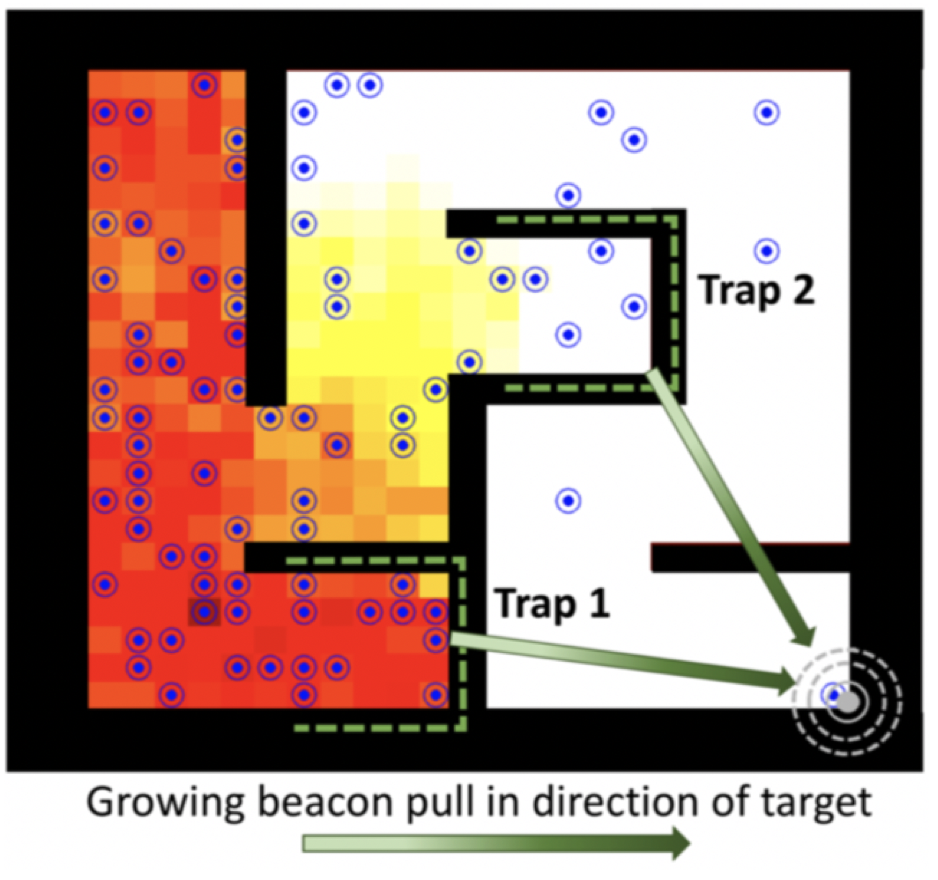
Contrary to expectations, iAA-B did not positively add to the performance of the iAA algorithm with its beacon initialization that was supposed to better guide the ants to the target. This is due to a trapping effect noticed in the simulation, as illustrated in Figure 16, where ants get trapped in nooks of the maze while being pulled towards the target.
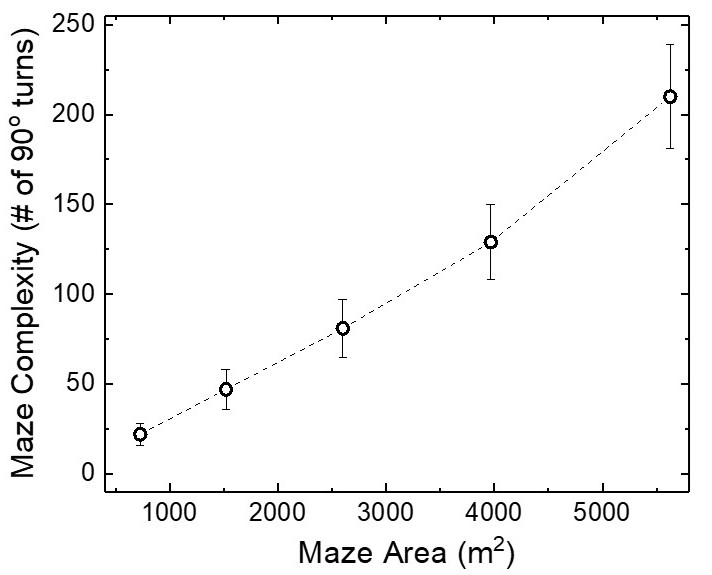
As shown in Figure17(a), the growth in maze complexity is weakly supra-linear with the increase in maze size (cf. Table 3 on page 3). The performance of the iAA strategy, measured by the number of necessary steps, in Figure 17(b), with a fixed search group size, initially grows very fast with the increase in maze area, but appears to approach a saturation-like behavior, above a certain maze size. Based on this and insights from related numerical experiments, this point of near saturation determines the optimal maze size and complexity problem that can be solved by a search group of 100 agents.
The weakly supra-linear dependence of the maze complexity on the maze size is to be expected, given that the number of “topological” choices (e.g. how to get around the maze), grows faster than the size itself. This can be checked through simple counting, by developing versions of Figure 11(f) while allowing the maze size to increase. The suggestion of the existence of the optimal size of the search agent group (Figure 17(b)) for a fixed maze size (while averaged overall a number of configurations at a fixed size), implies the presence of the non-linear dependence of the Number of Steps on the Number of Agents.
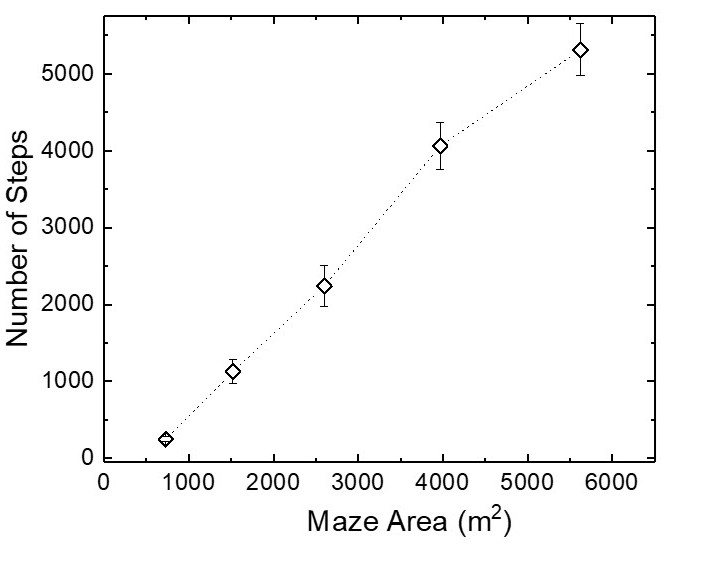
Based on our numerical experiments it appears that the Search Task (Phase I) could have “too few” or “too many” agents, which is understandable in the context of the ant agent repellent action.
5.1.3 Estimated energy cost
5.2 Phase II: Signal routing and victim extraction
To study the impact of changing the number of agents on the final solution in Dijkstra-based Phase II (the “rescue” part in SAR), the three performance metrics variables were generated - the total cost, the number of hops, and the number of steps, in all cases as function of the number of agents. These metrics are shown in Figure 18. Here, number of steps implies the number of iterations of the algorithm execution to find a solution, while number of hops refers the number of logical hops in the relay network formed.
For the steps count, one can intuitively assume that a small number of agents requires more steps to achieve the task then it slowly decreases as the number of agents increases and converges to a certain value. The reason is that is fewer agents will need more time to form the shortest path as the probability for it to have more voids and go through the proposed search with stopping algorithm is higher. The number of agents is not strongly affecting the time of reaching the target as it depends on what path agents will follow. For the total cost, it decreases slightly when increasing the number of agents.
By observing the simulation examples figure, one can deduce that the path looks almost the same; however, for the larger agents’ population the dependence is more smooth. Furthermore, the total cost when penetrable walls are considered is much less than impenetrable. The number of steps is also lower for penetrable walls but not by the same factor as the cost difference.
We have analyzed the performance for two different maze types, M1 and M2. As we have seen earlier in the paper, both size (area) and complexity of the maze play role in the performance (for Phase I).
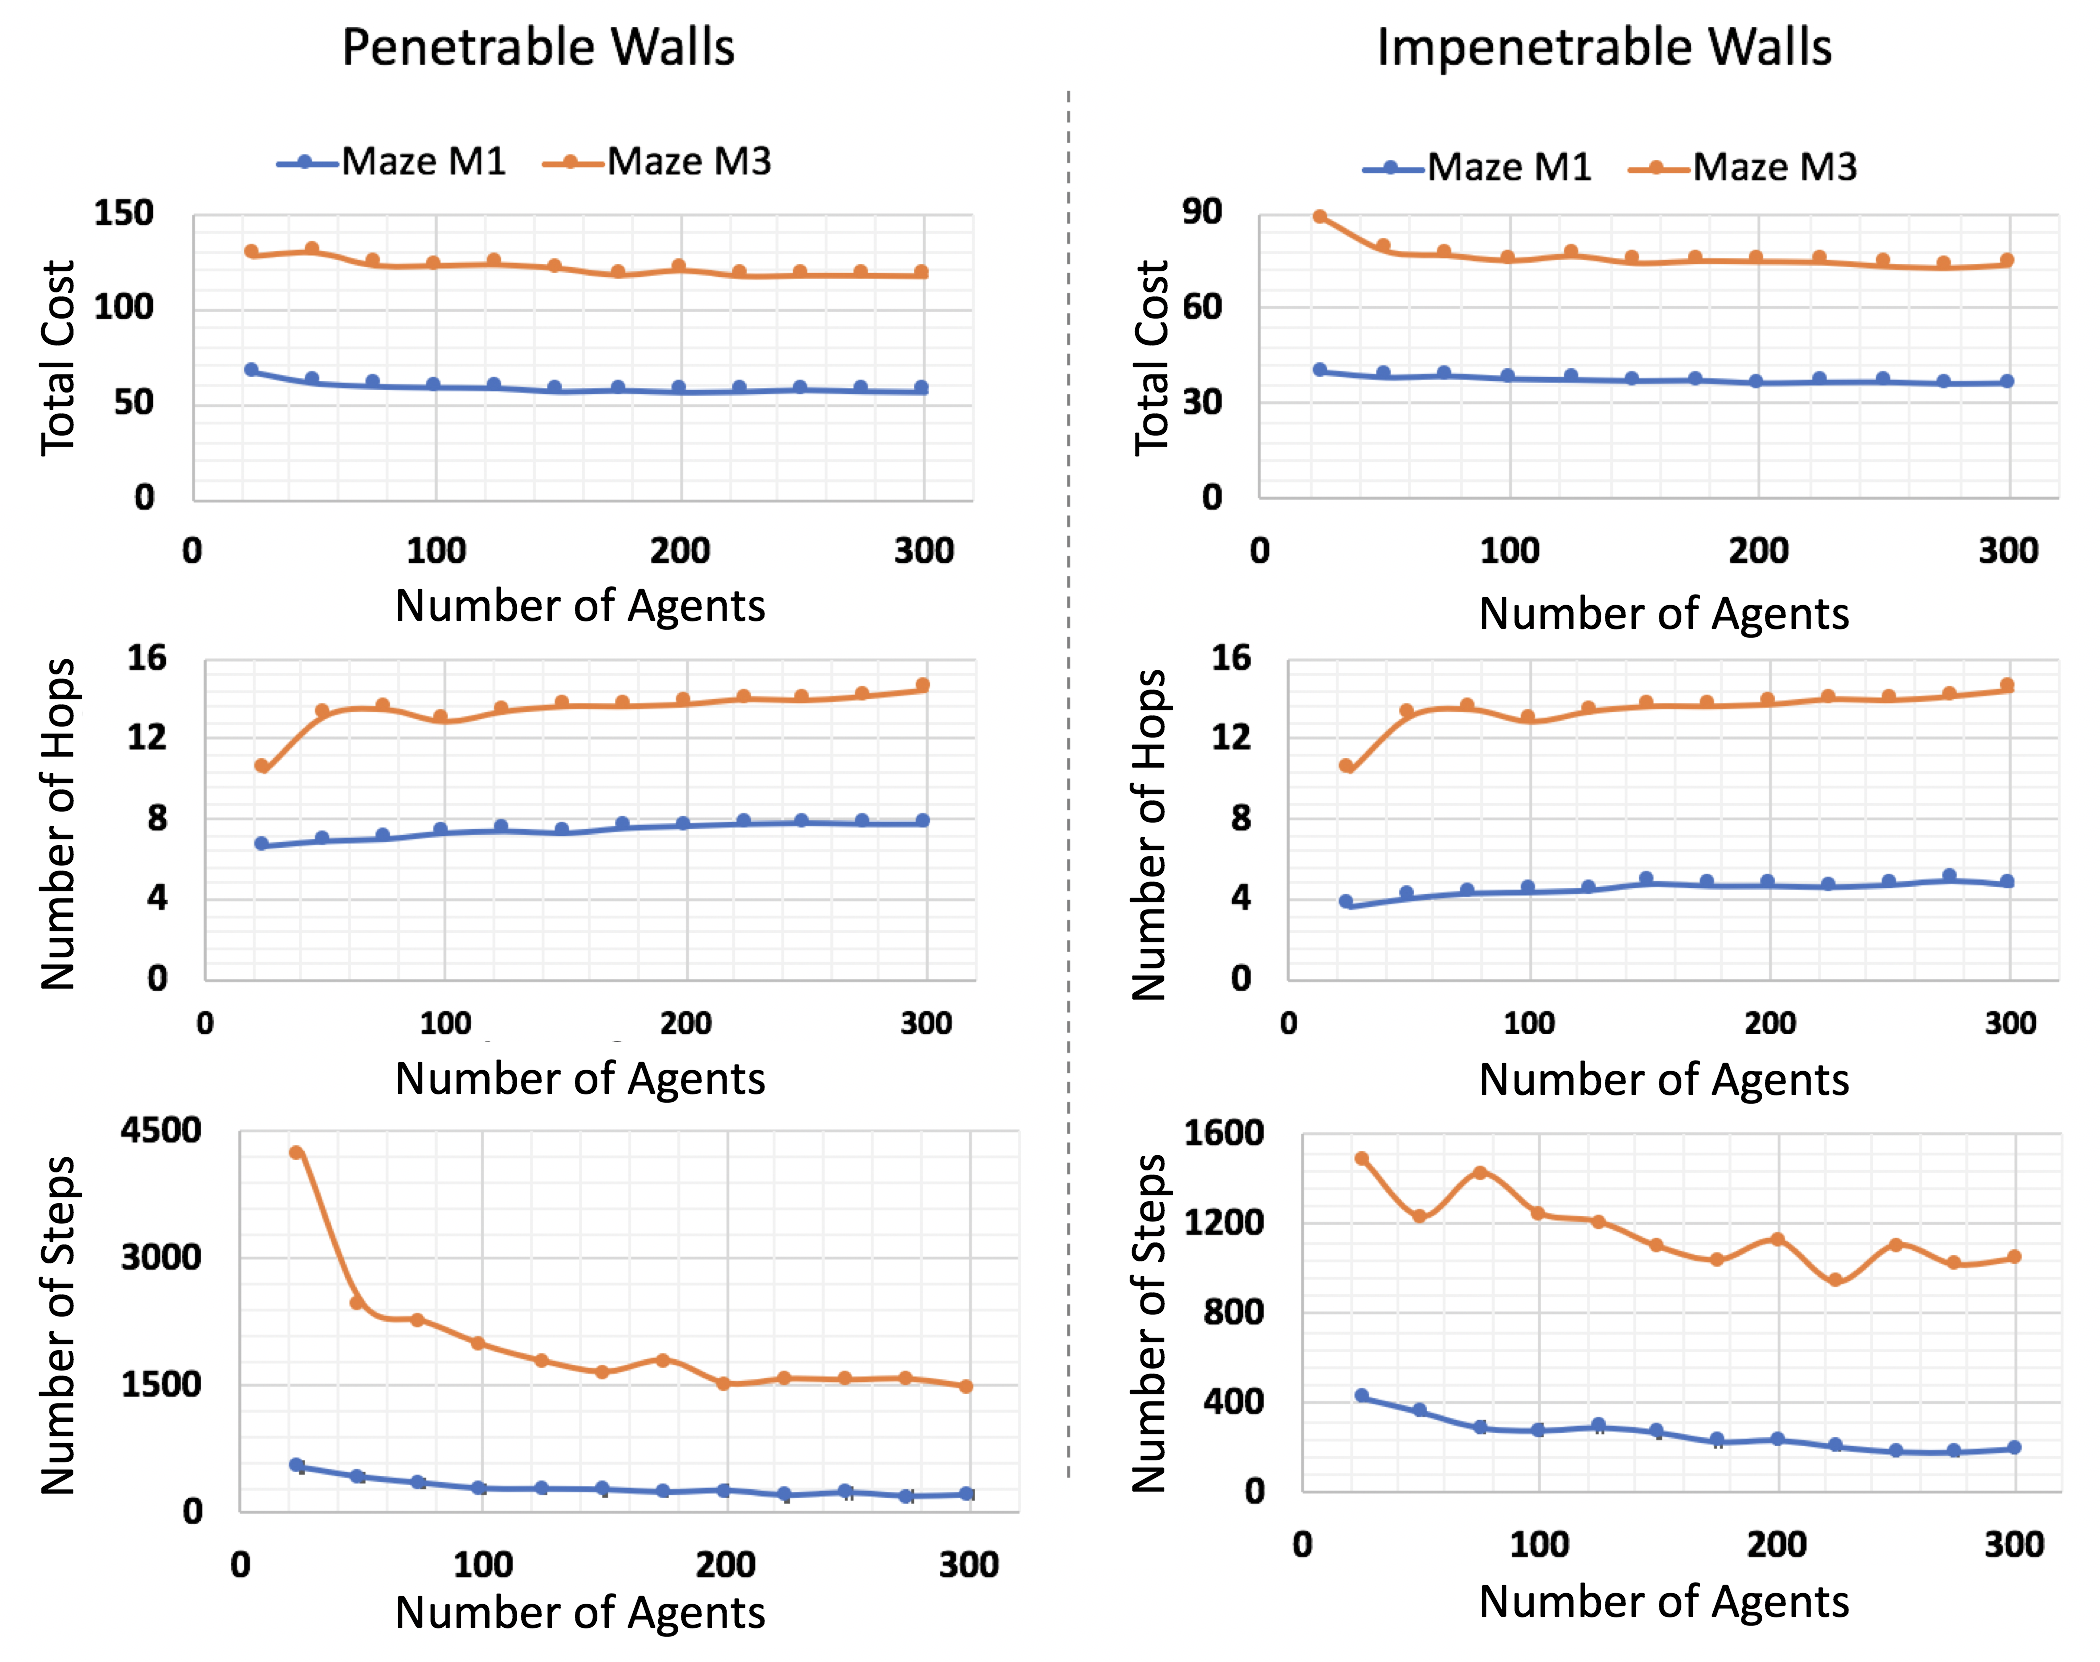
Figure 18 shows that both parameters are relevant in the performance of Dijkstra-based reverse routing. The dependence is neither simply linear nor smooth, as evidenced by non-monotonous behavior of the number of Steps and Hops for maze M3 (it being more complex) than for the maze M1.
6 Conclusion and Future work
6.1 Conclusion
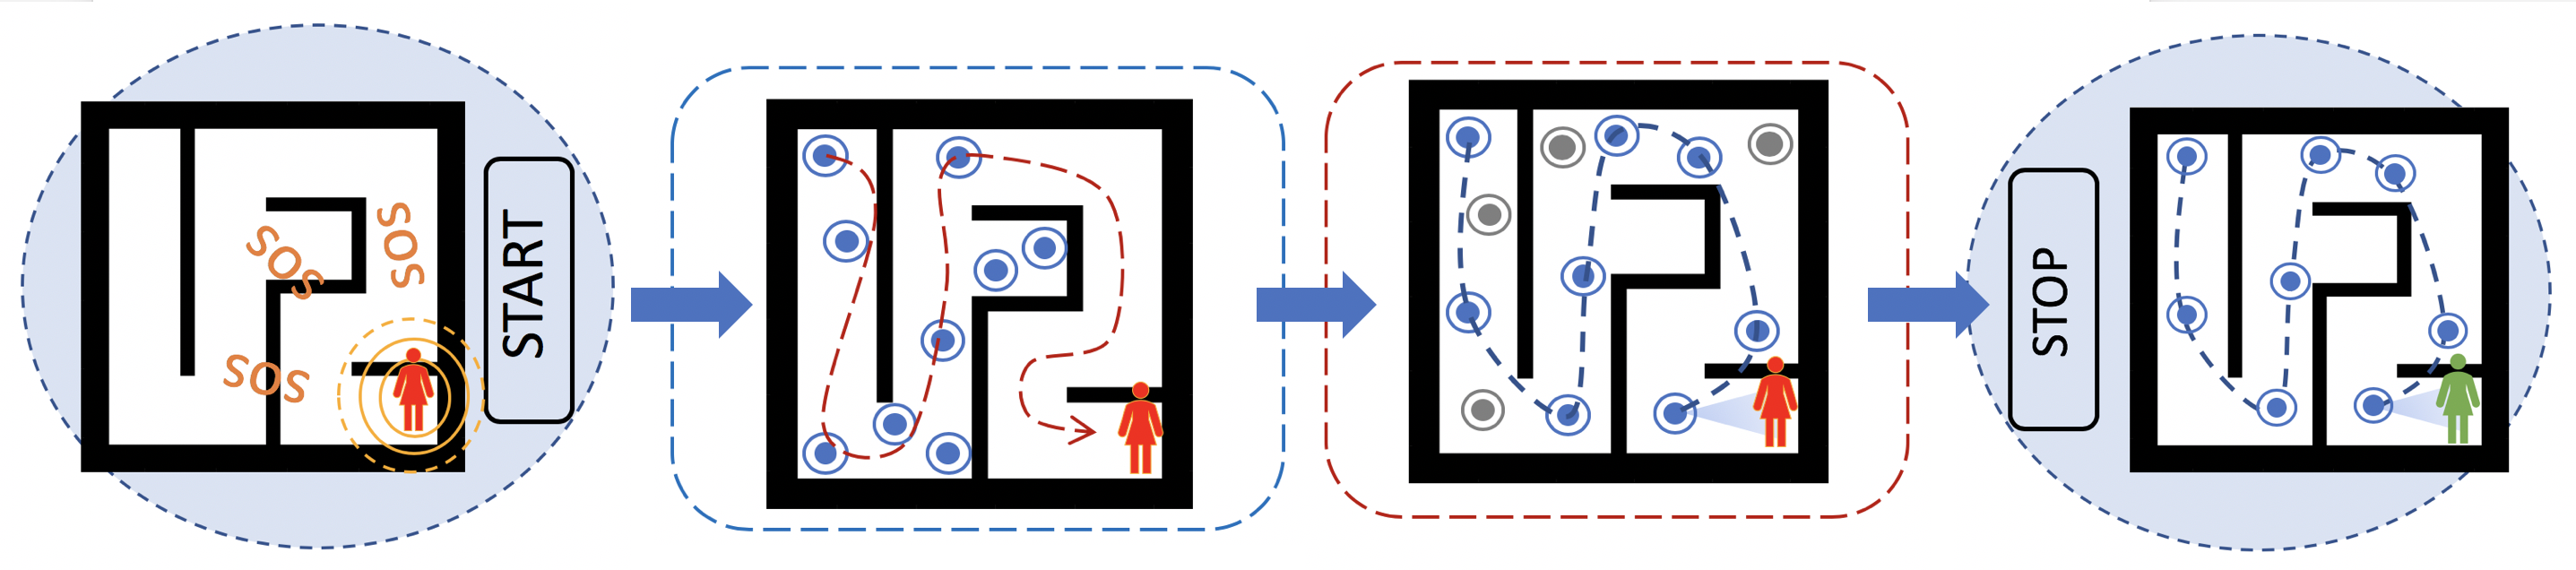
A summary of the SAR performed in 2 phases, is summarized pictorially in Figure 19. The search starts with a victim being trapped in the maze-like environment, broadcasting an SOS signal. In Phase I, the search agents pro-actively explore the environment in search of the victim, using the iAA algorithm. Once the victim is spotted, the agents switch to the Phase II, and find the shortest routing path to communicate information about the victim’s location to the base station, relying on specific implementation of Dijkstra algorithm and the results of the Phase-I search. Three different forms of the Ant Algorithm were explored and tested, to be able to devise the optimal search method.
The influence of the maze size and complexity, as well as the number of the search agents are studied, together with the study of energy resources’ dependence on problem and environment parameters. In ongoing efforts, we study the dynamic (time-varied) injection of the agents as a possible path towards additional performance improvement. We are in contact with the agencies that may use this approach in their SAR training.
6.2 Future Work
In Section 4.1.1 we stated that we simplified the computation and implementation of the system by discretizing a grid method similar to the one used in Yang (2009). Naturally, future work would address the situations where the number of agents (swarm size) and the size of the grid unit are not equal.
Furthermore, the simulation is a 2D representation of the world. Extending this to a 3D model (both for the signal propagation through obstacles as well as with the layout and structure of the building in mind) will be subject to application driven need to do so. The presented implementation and performance evaluation suffices to argue for the approach in theory, a real-world implementation will have to address a number of engineering issues as well as account for the 3D nature of the world. As we acknowledged before, there is a very active community working on all sorts of approaches related to e.g., path finding for multiple devices (Atzmon et al., 2020), collision free movement of a swarm (Li et al., 2020c), movement in formation (Li et al., 2020b) or through narrow spaces or bottlenecks (Li et al., 2020a). Whether it be in 2D or 3D, we fully expect that any deployed solution using our approach will consist of a merger of multiple techniques, tailored to the specific problem at hand (Eledlebi et al., 2020). As we discuss in (Hildmann et al., 2021), applying nature inspired solutions for the sake of it, while popular, is problematic. Future work will consider the practical aspects of implementing and deploying our solution for a swarm of UAVs and reflect on how our approach can best be combined with both, nature-inspired (Berlinger et al., 2021) as well not nature-inspired, approaches to further optimize performance.
Finally, in future work we would like to allocate some time to investigating the complexity of the mazes further. Preliminary investigations where we compared optimal path lengths in randomly created mazes yielded results that informed the work presented in this article, however, the results themselves were omitted, mainly for the sake of brevity. A real-world study of mazes and operational environments for SAR swarms is required for work targeting the actual deployment of a drone swarm.
Acknowledgements.
We acknowledge the UAE ICTFund grant “Bio-inspired Self-organizing Networks”, and we thank Prof. Sami Muhaidat (KUST) for his advice about path loss models. We thank Prof. Patrick Grosfils (Universite Libre de Bruxelles) and Prof. R. Mizouni (KUST) on encouraging exchanges.References
- Ahuja (2010) Ahuja M (2010) Fuzzy Counter Ant Algorithm for maze problem. Master’s thesis, University of Cincinnati
- American Red Cross (2015) American Red Cross (2015) Drones for disaster response and relief operations. Measure (32 Advisors Company) www.issuelab.org/resources/21683/21683.pdf, Report
- Atten et al. (2016) Atten C, Channouf L, Danoy G, Bouvry P (2016) UAV fleet mobility model with multiple pheromones for tracking moving observation targets. In: 19th European Conference on the Applications of Evolutionary Computation, 2016 (March 30- April 1), Portugal, Springer, pp 332–347
- Atzmon et al. (2020) Atzmon D, Stern R, Felner A, Sturtevant NR, Koenig S (2020) Probabilistic robust multi-agent path finding. In: Proceedings of the 30th International Conference on Automated Planning and Scheduling (ICAPS), AAAI Press, pp 39–37
- Aurangzeb et al. (2013) Aurangzeb M, Lewis FL, Huber M (2013) Efficient, swarm-based path finding in unknown graphs using Reinforcement Learning. In: Control and Automation (ICCA), 2013 10th IEEE International Conference on, IEEE, pp 870–877
- Berdahl et al. (2013) Berdahl A, Torney CJ, Ioannou CC, Faria JJ, Couzin ID (2013) Emergent sensing of complex environments by mobile animal groups. Science 339(6119):574–576, DOI 10.1126/science.1225883
- Berlinger et al. (2021) Berlinger F, Gauci M, Nagpal R (2021) Implicit coordination for 3d underwater collective behaviors in a fish-inspired robot swarm. Science Robotics 6(50), DOI 10.1126/scirobotics.abd8668
- Bonabeau et al. (1999) Bonabeau E, Dorigo M, Theraulaz G (1999) Swarm Intelligence: From Natural to Artificial Systems. SFI Studies on the Sciences of Complexity, Oxford University Press, USA
- Boubeta-Puig et al. (2018) Boubeta-Puig J, Moguel E, Sánchez-Figueroa F, Hernández J, Preciado JC (2018) An Autonomous UAV Architecture for Remote Sensing and Intelligent Decision-making. IEEE Internet Computing 22(3):6–15, DOI 10.1109/MIC.2018.032501511
- Bounini et al. (2017) Bounini F, Gingras D, Pollart H, Gruyer D (2017) Modified Artificial Potential Field method for online path planning applications. In: Intelligent Vehicles Symposium (IV), 2017 IEEE, IEEE, pp 180–185
- Broad (1981) Broad WJ (1981) The U.S. flight from pilotless planes. Science 213(4504):188–190, DOI 10.1126/science.213.4504.188
- Brownlee (2011) Brownlee J (2011) Clever Algorithms: Nature-inspired Programming Recipes. Lulu.com
- Buniyamin et al. (2011) Buniyamin N, Ngah W, Sariff N, Mohamad Z (2011) A simple local path planning algorithm for autonomous mobile robots. International Journal of Systems Applications, Engineering & Development 5(2):151–159
- Bupe et al. (2015) Bupe P, Haddad R, Rios-Gutierrez F (2015) Relief and emergency communication network based on an autonomous decentralized UAV clustering network. In: SoutheastCon 2015, pp 1–8, DOI 10.1109/SECON.2015.7133027
- Camazine et al. (2001) Camazine S, Deneubourg JL, Franks NR, Sneyd J, Theraulaz G, Bonabeau E (2001) Self-Organization in Biological Systems. Princeton Univ Press.
- Cao (2016) Cao J (2016) Robot global path planning based on an Improved Ant Colony Algorithm. Journal of Computer and Communications 4(02):11
- Deepak et al. (2014) Deepak B, Parhi DR, Raju B (2014) Advance particle swarm optimization-based navigational controller for mobile robot. Arabian Journal for Science and Engineering 39(8):6477–6487
- Diestel (2017) Diestel R (2017) Graph Theory: 5th edition. Springer Graduate Texts in Mathematics, Springer-Verlag, © Reinhard Diestel
- Eledlebi et al. (2020) Eledlebi K, Hildmann H, Ruta D, Isakovic AF (2020) A hybrid voronoi tessellation/genetic algorithm approach for the deployment of drone-based nodes of a self-organizing wireless sensor network (wsn) in unknown and gps denied environments. Drones 4(3), DOI 10.3390/drones4030033
- Eledlebi et al. (2020) Eledlebi K, Ruta D, Hildmann H, Saffre F, Alhammadi Y, Isakovic AF (2020) Coverage and energy analysis of mobile sensor nodes in obstructed noisy indoor environment: A voronoi-approach. IEEE Transactions on Mobile Computing pp 1–1, DOI 10.1109/TMC.2020.3046184
- Engelbrecht (2006) Engelbrecht AP (2006) Fundamentals of Computational Swarm Intelligence. John Wiley & Sons
- Fadzli et al. (2015) Fadzli SA, Abdulkadir SI, Makhtar M, Jamal AA (2015) Robotic indoor path planning using dijkstra. In: 2015 2nd International Conference on Information Science and Security (ICISS), IEEE, pp 1–4
- Fawzy et al. (2017) Fawzy AE, Shokair M, Saad W (2017) Balanced and energy-efficient multi-hop techniques for routing in wireless sensor networks. IET Networks 7(1):33–43
- Fossum et al. (2014) Fossum F, Montanier JM, Haddow PC (2014) Repellent pheromones for effective swarm robot search in unknown environments. In: Swarm Intelligence (SIS), 2014 IEEE Symposium on, IEEE, pp 1–8
- Giannopoulou (2009) Giannopoulou AC (2009) Tree-depth of graphs: Characterisations and obstructions. PhD thesis, PhD thesis, National and Kapodistrian University of Athens
- Gong et al. (2009) Gong D, Lu L, Li M (2009) Robot path planning in uncertain environments based on particle swarm optimization. In: Evolutionary Computation, 2009. CEC’09. IEEE Congress on, IEEE, pp 2127–2134
- Gupta et al. (2016) Gupta L, Jain R, Vaszkun G (2016) Survey of important issues in uav communication networks. IEEE Communications Surveys Tutorials 18(2):1123–1152, DOI 10.1109/COMST.2015.2495297
- Gupta et al. (2016) Gupta N, Mangla K, Jha AK, Umar M (2016) Applying dijkstra’s algorithm in routing process. Int J New Technol Res 2(5):122–124
- Hanafi et al. (2013) Hanafi D, Abueejela YM, Zakaria MF (2013) Wall follower autonomous robot development applying fuzzy incremental controller. Intelligent Control and Automation 4(01):18
- Hildmann and Kovacs (2019) Hildmann H, Kovacs E (2019) Review: Using unmanned aerial vehicles (uavs) as mobile sensing platforms (msps) for disaster response, civil security and public safety. Drones 3(3), DOI 10.3390/drones3030059
- Hildmann et al. (2019) Hildmann H, Kovacs E, Saffre F, Isakovic AF (2019) Nature-inspired drone swarming for real-time aerial data-collection under dynamic operational constraints. Drones 3(3), DOI 10.3390/drones3030071
- Hildmann et al. (2021) Hildmann H, Eledlebi K, Saffre F, Isakovic AF (2021) Internet of Drones, Springer, chap The swarm is more than the sum of its drones - A swarming behaviour analysis for the deployment of drone-based wireless access networks in GPS-denied environments and under model communication noise. Studies in Systems, Decision and Control
- Hussein et al. (2014) Hussein A, Adel M, Bakr M, Shehata OM, Khamis A (2014) Multi-robot task allocation for search and rescue missions. Journal of Physics: Conference Series 570(5):052,006, DOI 10.1088/1742-6596/570/5/052006
- Khatib (1986) Khatib O (1986) Real-time obstacle avoidance for manipulators and mobile robots. In: Cox IJ WG (ed) Autonomous Robot Vehicles, Springer, New York, NY, pp 396–404
- Krentz et al. (2015) Krentz T, Greenhagen C, Roggow A, Desmond D, Khorbotly S (2015) A modified Ant Colony Optimization algorithm for implementation on multi-core robots. In: Swarm/Human Blended Intelligence Workshop (SHBI), 2015, IEEE, pp 1–6
- Lee et al. (2015) Lee KS, Ovinis M, Nagarajan T, Seulin R, Morel O (2015) Autonomous patrol and surveillance system using unmanned aerial vehicles. In: 2015 IEEE 15th International Conference on Environment and Electrical Engineering (EEEIC), pp 1291–1297, DOI 10.1109/EEEIC.2015.7165356
- Leena and Saju (2014) Leena N, Saju K (2014) A survey on path planning techniques for autonomous mobile robots. IOSR Journal of Mechanical and Civil Engineering (IOSR-JMCE) 8:76–79
- Li et al. (2020a) Li J, Gange G, Harabor D, Stuckey PJ, Ma H, Koenig S (2020a) New techniques for pairwise symmetry breaking in multi-agent path finding. In: Proceedings of the 30th International Conference on Automated Planning and Scheduling (ICAPS), AAAI Press, pp 193–201
- Li et al. (2020b) Li J, Sun K, Ma H, Felner A, Kumar TKS, Koenig S (2020b) Moving Agents in Formation in Congested Environments, International Foundation for Autonomous Agents and Multiagent Systems, Richland, SC, p 726–734
- Li et al. (2020c) Li J, Tinka A, Kiesel S, Durham JW, Kumar TKS, Koenig S (2020c) Lifelong Multi-Agent Path Finding in Large-Scale Warehouses, International Foundation for Autonomous Agents and Multiagent Systems, Richland, SC, p 1898–1900
- Liu et al. (2012) Liu H, Stoll N, Junginger S, Thurow K (2012) A floyd-dijkstra hybrid application for mobile robot path planning in life science automation. In: Automation Science and Engineering (CASE), 2012 IEEE Int. Conf. on, IEEE, pp 279–284
- Ma and Mao (2018) Ma X, Mao R (2018) Path planning for coal mine robot to avoid obstacle in gas distribution area. Int J of Advanced Robotic Systems pp 1–6
- Mac et al. (2016) Mac TT, Copot C, Tran DT, De Keyser R (2016) Heuristic approaches in robot path planning: A survey. Robotics and Autonomous Systems 86:13–28
- Malone et al. (2017) Malone N, Chiang HT, Lesser K, Oishi M, Tapia L (2017) Hybrid dynamic moving obstacle avoidance using a stochastic reachable set-based potential field. IEEE Transactions on Robotics 33(5):1124–1138
- Mondada et al. (2002) Mondada F, Floreano D, Guignard A, Deneubourg JL, Gambardella L, Nolfi S, Dorigo M (2002) Search for rescue: an application for the swarm-bot self-assembling robot concept. Technical report, LSA2-I2S-STI
- Nagatani et al. (2011) Nagatani K, Kiribayashi S, Okada Y, Tadokoro S, Nishimura T, Yoshida T, Koyanagi E, Hada Y (2011) Redesign of rescue mobile robot quince. In: Safety, Security, and Rescue Robotics (SSRR), 2011 IEEE International Symposium on, IEEE, pp 13–18
- Navlakha and Bar-Joseph (2011) Navlakha S, Bar-Joseph Z (2011) Algorithms in nature: the convergence of systems biology and computational thinking. Mol Syst Biol 7
- Pearl (1984) Pearl J (1984) Heuristics: Intelligent Search Strategies for Computer Problem Solving. Series in Artificial Intelligence, Addison-Wesley
- Rai and Chinghtam (2011) Rai R, Chinghtam TS (2011) A hybrid framework for robot path planning and navigation using aco and dijkstra’s algorithm. In: International Symposium on Devices MEMS, Intelligent Systems & Communication (ISDMISC)
- Rappaport et al. (1996) Rappaport TS, et al. (1996) Wireless Communications: Principles and Practice, vol 2. Prentice Hall, New Jersey, iSBN: 9780133755367
- Rivera (2012) Rivera G (2012) Path planning for general mazes. Master’s thesis, Missouri University of Science and Technology
- Saffre and Hildmann (2021) Saffre F, Hildmann H (2021) Adaptive behaviour for a self-organising video surveillance system using a genetic algorithm. Algorithms 14(3), DOI 10.3390/a14030074
- Sauter et al. (2005) Sauter JA, Matthews R, Parunak HVD, Brueckner SA (2005) Performance of digital pheromones for swarming vehicle control. In: Proceedings of the Fourth International Joint Conference on Autonomous Agents and Multiagent Systems, ACM, pp 903–910
- Sleegers et al. (2020) Sleegers J, Olij R, van Horn G, van den Berg D (2020) Where the really hard problems aren’t. Operations Research Perspectives 7:100,160, DOI https://doi.org/10.1016/j.orp.2020.100160
- Spezzano (2019) Spezzano G (2019) Editorial: Special issue “swarm robotics”. Applied Sciences 9(7), DOI 10.3390/app9071474
- Sutantyo et al. (2010) Sutantyo DK, Kernbach S, Levi P, Nepomnyashchikh VA (2010) Multi-robot searching algorithm using lévy flight and artificial potential field. In: Safety Security and Rescue Robotics (SSRR), 2010 IEEE Int. Ws. on, IEEE, pp 1–6
- Tjiharjadi and Setiawan (2016) Tjiharjadi S, Setiawan E (2016) Design and implementation of a path finding robot using Flood Fill algorithm. International Journal of Mechanical Engineering and Robotics Research 5(3):180–185
- Trivedi et al. (2017) Trivedi A, Srinivasan D, Sanyal K, Ghosh A (2017) A survey of multiobjective evolutionary algorithms based on decomposition. IEEE Transactions on Evolutionary Computation 21(3):440–462
- Wang et al. (2011) Wang H, Yu Y, Yuan Q (2011) Application of dijkstra algorithm in robot path-planning. In: Mechanic Automation and Control Engineering (MACE), 2011 Second International Conference on, IEEE, pp 1067–1069
- Wang et al. (2017) Wang L, Luo C, Li M, Cai J (2017) Trajectory Planning of an Autonomous Mobile Robot by Evolving Ant Colony System. International Journal of Robotics and Automation 32(4)
- Wang and Wang (2013) Wang R, Wang Z (2013) Robot path planning for mobile robot based on Improved Ant Colony Algorithm. Applied Mechanics and Materials 385-386:717–720
- West et al. (2001) West DB, et al. (2001) Introduction to Graph Theory, vol 2. Prentice Hall, Upper Saddle River, NJ, USA, ISBN: 978-0130144003
- Wilson (2002) Wilson R (2002) Propagation losses through common building materials 2.4 GHz vs 5 GHz. Magis Networks Inc: San Diego, CA, USA
- Xiaowei and Xiaoguang (2016) Xiaowei F, Xiaoguang G (2016) Multi-uavs cooperative control in communication relay. In: Signal Processing, Communications and Computing (ICSPCC), 2016 IEEE International Conference on, IEEE, pp 1–5
- Yang (2009) Yang XS (2009) Firefly algorithms for multimodal optimization. Stochastic Algorithms: Functions and Applications (SAGA) 5792:169–178
- Yazici et al. (2006) Yazici A, Sipahioglu A, Parlaktuna O, Gurel U (2006) A heuristic-based route planning approach for a homogeneous multi-robot team. In: Computer Aided Control System Design, 2006 IEEE International Conference on Control Applications, 2006 IEEE International Symposium on Intelligent Control, 2006 IEEE, IEEE, pp 1237–1242
- Zhangqi et al. (2011) Zhangqi A, Xiaoguang Z, Qingyao H (2011) Mobile robot path planning based on parameter optimization ant colony algorithm. Procedia Engineering 15:2738–2741