Investigation of the effect of surface phosphate ester dispersant on viscosity by coarse-grain modeling of BaTiO3 slurry
Abstract
To understand the role of phosphate ester dispersant, we investigated the rheology of a BaTiO3 slurry. For the model case, a coarse-grain molecular dynamics (CGMD) simulation was performed with the butyral polymer didodecyl hydrogen phosphate (DHP), in the toluene/ethanol solvent. By systematically analyzing the effect of DHP from an atomic-scale first principle and from all-atom MD to micro-scale CGMD simulation, we investigated how the adsorption of a DHP dispersant on a BaTiO3 surface affects the microstructure rheology of a BaTiO3 slurry. The first-principle and all-atom MD simulation suggests that DHP molecules prefer to locate near the BaTiO3 surface. CGMD simulation shows a reduction in viscosity with an increase in dispersants, suggesting that the dispersant population near the BaTiO3 surface plays a key role in controlling the rheology of the BaTiO3 slurry. In this study, we propose an approach for understanding the BaTiO3 slurry with molecular-level simulations, which would be a useful tool for efficient optimization of slurry preparation.
I Introduction
With the development of electronic equipment, including mobile phones and that for electric vehicles, and the rapid increase in its production quantities in the past several decades, multilayer ceramic capacitors (MLCCs) play an increasingly important role in today’s electronics industry kishi2003base ; hong2019perspectives . At the same time, the higher performance of such devices and equipment has increased the demand for miniaturization and high volumetric capacitance density and reliability of MLCCs. MLCCs are made by alternately stacking numerous ceramic dielectric layers and metal electrodes, and significant effort is invested not only in investigating the effects of the componentsakabe2002dielectric ; gong2012electrical ; li2021colossal and grain sizebuscaglia2020size ; zhu2021grain of the BaTiO3-based material on the dielectric properties, but also in improving the process of producing the thin layers. As a result, the dielectric layer has now reached a thickness of less than a few micrometers in the latest MLCCsbuscaglia2020size ; suzuki2020effect ; okuma2021microstructural ; suzuki2021suppressive . In these very thin MLCCs, highly controlled microstructure homogeneity is required for high reliability and improved manufacturing yield. For instance, microstructure heterogeneity has been reported to cause degradation of MLCCs; by visualizing electrically degraded areas in MLCCs, Sada et al.sada2017analysis showed that a thinner dielectric layer caused early failure. Nagayoshi et al.nagayoshi2020analyses reported that some large grains were observed in the degraded areas. Samantaray et al.samantaray2012electrode ; samantaray2012electrode02 showed by the finite element method th at electrode porosity and roughness in MLCCs could lead to a higher local electric field and leakage current. Heath et al.heath2019electric calculated the electric field at the interface between the dielectric layer and the electrode and showed that the largest enhancement of field occurred in the sharper-pointed part of the electrode. In the production of MLCCs, the ceramic particles used as the raw materials of the dielectric layer are usually dispersed in organic solvent. Thus, it is important that the slurry be made to be well dispersed, stable and uniform and have appropriate rheological characteristics for tape casting, so that the green sheets are sufficiently homogeneous and smoothchu2008dispersion . Accordingly, in general, a dispersant, binder, plasticizer and deformer are added to the slurry. However, the appropriate amount of each organic additive depends on the kind of such organic additives and media, and their combination, making slurry preparation optimization necessarymikeska1988non ; bhattacharjee1993polyvinyl ; tseng2003effect ; iwata2019effect .
With recent improvements in simulation performance, theoretical analysis by numerical simulation has become one of the trends for reducing this optimization difficulty. Enabling the creation of a computational connection between the rheological characteristic of the slurry and the dispersion and aggregation states of the particles would be useful, because slurry is often practically evaluated by measuring viscosity, which is fast and easy to performchu2008dispersion ; mikeska1988non ; bhattacharjee1993polyvinyl ; tseng2003effect ; iwata2019effect ; dong2017optimization ; iwata2020determination ; ding2020optimization . The adsorption of dispersant for various particles was also studied by molecular dynamics (MD) simulations and density functional theory (DFT) calculations because the behavior of dispersant close to the solid surface plays a major role in predicting the rheological characteristic of a slurrychen2007adsorption ; zhao2017effect ; chun2021first . Numerous experiments and theoretical simulations have been performed for the optimization of slurry preparation, but a molecular-level exploration of the microstructure–rheology relationship is still lacking. The main obstacle in connecting molecular-level surface interaction and the microstructure–rheology relationship is the limitation of computational time of the atomistic simulation.
To bridge the molecular-level surface interaction to microstructure rheology, a CG modelgrest1986molecular ; kremer1990dynamics provides a significantly large and long time-scale simulation with reasonable computational cost. There are two main approaches for constructing the CG model. The top-down approach fits the CG model to reproduce experimental data, whereas the bottom-up approach fits the interaction force and parameter to reproduce the configuration of an atomistic MD simulationtrement2014conservative ; reith2003deriving . The CG model is applied to understand the frictionkreer2001frictional , polymer meltpadding2002time ; spyriouni2007coarse ; guerrault2004dissipative ; harmandaris2005molecular , viscositywang2019implicit ; maurel2012multiscale ; li2012nanoparticle ; wendt2019effect and many other propertiesghoufi2012coarse ; hagita2019two ; harton2010immobilized ; qian2008temperature . However, application of the CG model to the solid–polymer interface is still challenging, because there is neither a universal parameter for the atomistic simulation of the polymer–solid interface, nor detailed experimental information. Thus, both top-down and bottom-up approaches have difficulty generating a CG model of the polymer–solid interface. Due to the difficulty in applying the CG model to the polymer–solid interface, the CG model has been applied to only a few types of systems such as silicandoro2011interface ; ghanbari2012interphase ; bogoslovov2008effect ; ghanbari2012interphase ; ndoro2012interface , aluminakacar2013structure , goldjohnston2013hierarchical , and graphene or graphiteeslami2013thick ; daoulas2005detailed ; pandey2014multiscale . To the best of our knowledge, no CG study has applied the method to aBaTiO3-based slurry to understand the relationship between molecular-level surface interaction and microstructure rheology.
The purpose of this study was to fill the gap between molecular-level surface interaction and the microstructure rheology of a BaTiO3-based slurry by a systematic analysis from atomistic scale molecular adsorption to micro-scale rheology. The present work presents a systematic approach that connects the different level and scale of simulations by using quantum-level DFT, all-atom MD, and CGMD simulations. First, the adsorption energy of a dispersant on a BaTiO3 surface is simulated with a DFT simulation, generating a force-field parameter for all-atom MD simulation. The distributions of the dispersant, binder and solvent near the BaTiO3 surface are then evaluated to understand how the dispersant affects the structure of the interface. Finally, by using the distributions on the BaTiO3 interface, a CGMD force-field parameter is prepared, and the model is applied to predict the rheology of the BaTiO3-based slurry to understand how the local adsorption of dispersant affects the rheology.
II Theoretical method and computational detail
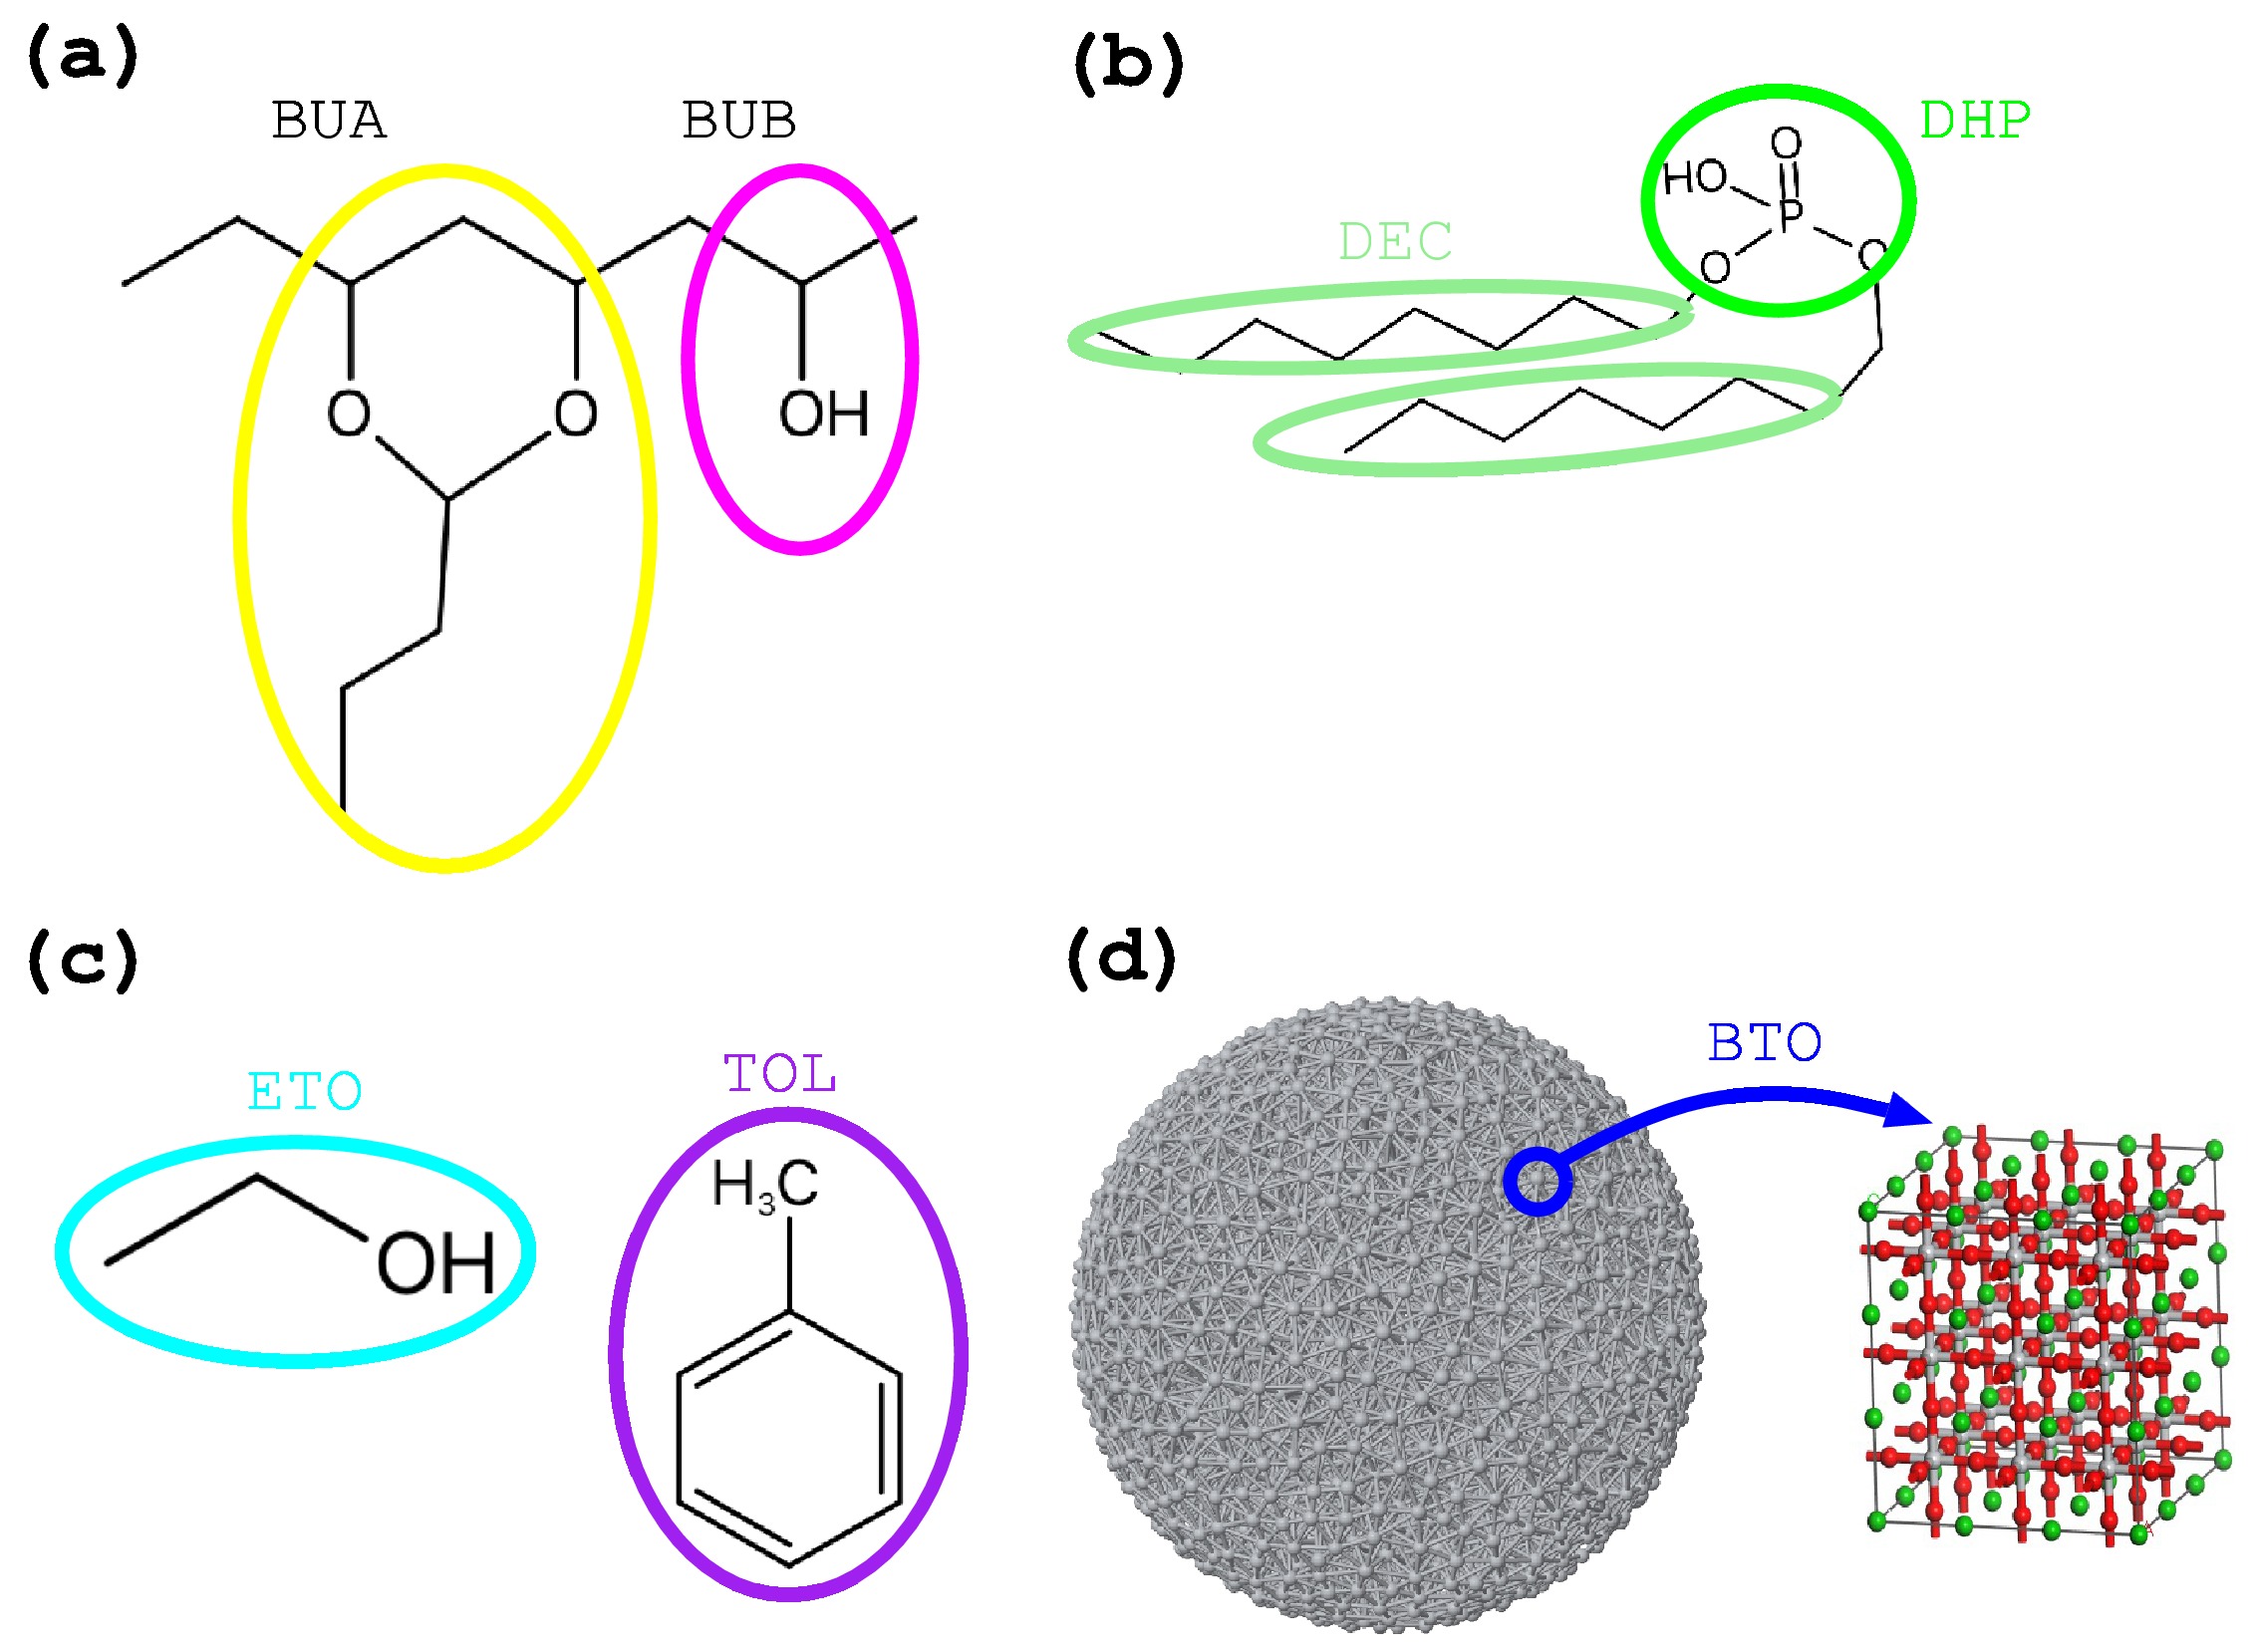
To investigate the relationship between the molecular-level surface interaction and the microstructure rheology of a BaTiO3-based slurry, one of the most popular combinations of binder, dispersant and solvent was selected as the model casevinothini2006optimization . The molecular structures and compositions used in our simulation are listed in Figure 1 and Table 1. The butyral polymer is used for binder, and the molecular structure is shown in Figure 1-(a) (Throughout this study, we denote the molecular structure as BUA and BUB for simplicity). As for the dispersant, didodecyl hydrogen phosphate (DHP) was used (Figure 1-(b)). As for the solvent molecules, we used toluene (TON) and ethanol (ETO) as solvent of the BaTiO3 slurry (Figure 1-(c) and (d)). For BaTiO3 particles, a cubic crystal structure was used (Figure 1-(d)). In the CGMD simulation model, the group of atoms in a molecule are simplified into one particle. The correspondence between the molecular structure and simplified particle used in the CGMD simulation is listed in the colored open circles in Figure 1. To construct the CG model for BaTiO3, we treat the BaTiO3 particle as a rigid sphere (Figure 1-(d)), with the radius set at 2, 8 and 15 nm, respectively. The rigid sphere is then divided into a mesh, and the contact points are treated as the interaction sites for CG model.
To systematically analyze the role of the DHP dispersant on the rheology of the slurry, three types of analysis were performed. First, the interaction energies between the BaTiO3 surface and the respective molecules were estimated with the first-principle simulation. Because the first-principle simulation is limited relatively small size, it can take account only the change of potential energy with single z-direction (1D). In order to consider the 3D effect (such as molecular rotation and translation), it is necessary to perform MD simulation. Thus, secondly, we performed an all-atom MD simulation to statistically analyze the structure of the interface of the BaTiO3 slurry by generating a force field to reproduce the first principle interaction energies. For this purpose, we evaluated the distribution of each type of molecule near the BaTiO3 [001] surface terminated with OH. The size of simulation model in all-atom MD is still limited, and all-atom MD can take account only the molecular distribution close to the solid surface. Thus it is necessary to extend the scale of simulation to evaluate rheology of slurry. Finally, from the obtained distributions of the respective molecules near the BaTiO3 surface, the Boltzmann inversion methodreith2003deriving ; guerrault2004dissipative was used to obtain the parameter of the CG model (See detail in section II-D), and we evaluated how the interface geometry affects the rheology of the BaTiO3 slurry.
II.1 First-principle simulation to investigate the interaction energy of the BaTiO3 surface
A first-principle simulation (DFT) was performed using the Quantum Espresso softwareqe01 ; qe02 with a Perdew–Burke–Ernzerhof functionalPBE01 ; PBE02 . We used ultrasoft pseudopotentialsultrasoft and the cutoff energy for the plane-wave basis set was taken to be 300 Ry. A default convergence criterion of 1.0D-4 a.u was used for the geometry optimizations, and 1.0D-6 a.u for the self-consistent field calculations of the electronic states.
First, geometry optimizations were performed to determine the interaction energy between the BTO surface and the respective molecules (BUA, BUB, DHP, ETO and TON). The geometry optimizations were performed with 24 different initial geometries, in which we rotated the respective molecules 12 times by 30 degrees around the - and -axes. The most stable geometry was then selected among the 24 different molecular orientations, and the potential energy surface (PES) along the direction was evaluated to obtain the interaction energy between the organic molecules and the BaTiO3 surface. For surface model, we used BaTiO3 [001] surface terminated by OHeglitis2015comparative ; wegmann2004xps .
II.2 All-atom MD simulation to obtain the distribution of molecules on the BaTiO3 surface
All the MD simulations were performed with the LAMMPS softwareLammpsPack To evaluate the distribution of respective molecules near the BaTiO3 surface, we performed an all-atom MD simulation. For this purpose, three different systems were investigated, in which different compositions of organic bulk models were generated: a) 1000 TON, 1000 ETO and 1000 DHP, b) 1500 BUA and 1500 DHP, and c) 1500 BUB and 1500 DHP, respectively. To statistically sample the distribution of the interface structure, five different initial geometries were randomly generated for bulk-organic molecules using packmolmartinez2009packmol , and were equilibrated by 1 ns. The final geometry of the MD simulation was then used for the organic bulk model. The organic bulk models were merged with the BaTiO3 cubic crystal, generating the initial geometry of the interface models. Finally, a 2-ns MD simulation was performed using the interface models, and the final 1-ns trajectory was used for molecular distribution analysis. The molecular distributions were used to construct the CG model to evaluate the rheology of the BaTiO3-based slurry (See section II-D for detail).
The force-field parameter for the respective molecules (BUA, BUB, DHP, ETO and TON) was prepared using the general AMBER force field (GAFF), and the atomic charges were estimated with restrained electrostatic potential (RESP). To make the RESP charge, DFT with the Becke three-parameter hybrid exchange functional combined with the Lee–Yang–Parr correlation functional (B3LYP)cite31 ; cite32 was used, and the 6-31G(d,p) basis set was applied. The Quantum Mechanic (QM) calculation was performed with GAMESSGAMESS1 ; GAMESS2 ; GAMESS3 . Note that the nonbonding parameters between the BaTiO3 surface and respective molecules were determined to reproduce the interaction energy changes along the z-axis, which were obtained by the above first-principle simulation (See section III-A for detail).
II.3 CG MD simulation for predicting the rheology of the BaTiO3 slurry
To understand how the polymer–solid interface affects the rheology of the BaTiO3 slurry, three different slurry model compositions were investigated (see TABLE 1). The length of polymer chain was set at 100, where the composition of BUA and BUB was 63 and 37, respectively. Thus, the molecular weight of the polymer chain was 10789. The CG model for the butyral polymer was generated by a beads-and-spring modelgrest1986molecular . To reproduce the geometry of polymer, the length of spring is set 7.0 Å for BUA, 5.6 Å for BUB, and 6.3 Å between BUA and BUB. Likewise the spring between DHP and DEC is set 5.7 Å. The force constant of the spring is set 300 kcal/mol.
| model01 | model02 | model03 | |
|---|---|---|---|
| BTO | 0.30 | 0.20 | 0.10 |
| PVB | 0.28 | 0.28 | 0.28 |
| DHP | 0.03 | 0.13 | 0.23 |
| TOL | 0.24 | 0.24 | 0.24 |
| ETO | 0.15 | 0.15 | 0.15 |
First, the initial simulation models were randomly generated using packmolmartinez2009packmol , where the density of the slurry model was set at 0.8 g/cm3, which nearly corresponds to TOL ETO solvent densities. A CG MD simulation was then performed until the stable radial distribution function (RDF) was obtained, which took about 5 ns of simulation time. The time step for the equilibration is 5 fs. NVT-MD was performed with Nose-Hoover’s thermostatnose1984molecular ; nose1984unified , and the temperature was set to 300 K. The final geometry and velocity were used to obtain the viscosity of the respective models. The viscosity was obtained using the SLLOD method implemented in the LAMMPS softwareevans1984nonlinear ; daivis2006simple . The MD simulation is performed with the SLLOD equation of motion as follows:
| (4) | ||||
| (8) |
, where , , are particle index, xyz axis, and shear rate. In this study, the viscosity was evaluated with several different values of from 0.1 to 5.0. , , and are position, velocity, and force of the respective particles. is particle weight. Then the viscosity may be calculated from the stress tensor as follows:
| (9) |
To obtain the viscosity of the slurry model, we also performed a 5-ns MD simulation, and a final 1-ns simulation result was used for the viscosity evaluation.
II.4 CG pair interaction potential
The pair interaction parameters of the CG model were determined using the Boltzmann inversion methodreith2003deriving ; guerrault2004dissipative , where the potentials between particle type and () are determined by RDF ( from the all-atom MD simulation:
| (10) | ||||
| (11) |
, , and are Boltzmann constant, temperature, and scaling factor, and we use . is number of iteration step. is the RDF estimated by all atom MD simulation, while is the RDF estimated by CGMD simulation using . Thus, it is necessary to estimate for all pair of and . Because we have six different particle types for organic molecules (Figure 1), 21 different combination of RDFs are necessary to evaluate with all-atom MD simulation. The all-atom MD models for generating the RDFs and the comparison with the RDF of final CGMD simulation is shown in supporting information.
For the pair interaction between organic molecules, the RDFs for each pair of molecules were estimated by 1 ns MD simulations, and a final 500-ps trajectory was used. The pair interaction parameters between BaTiO3 and the molecular interface were determined by the molecular distributions along the z-axis, which were obtained in the previous subsection (See also section III-B for detail).
III Results and discussion
III.1 Interaction energy between organic molecules and the BaTiO3 surface
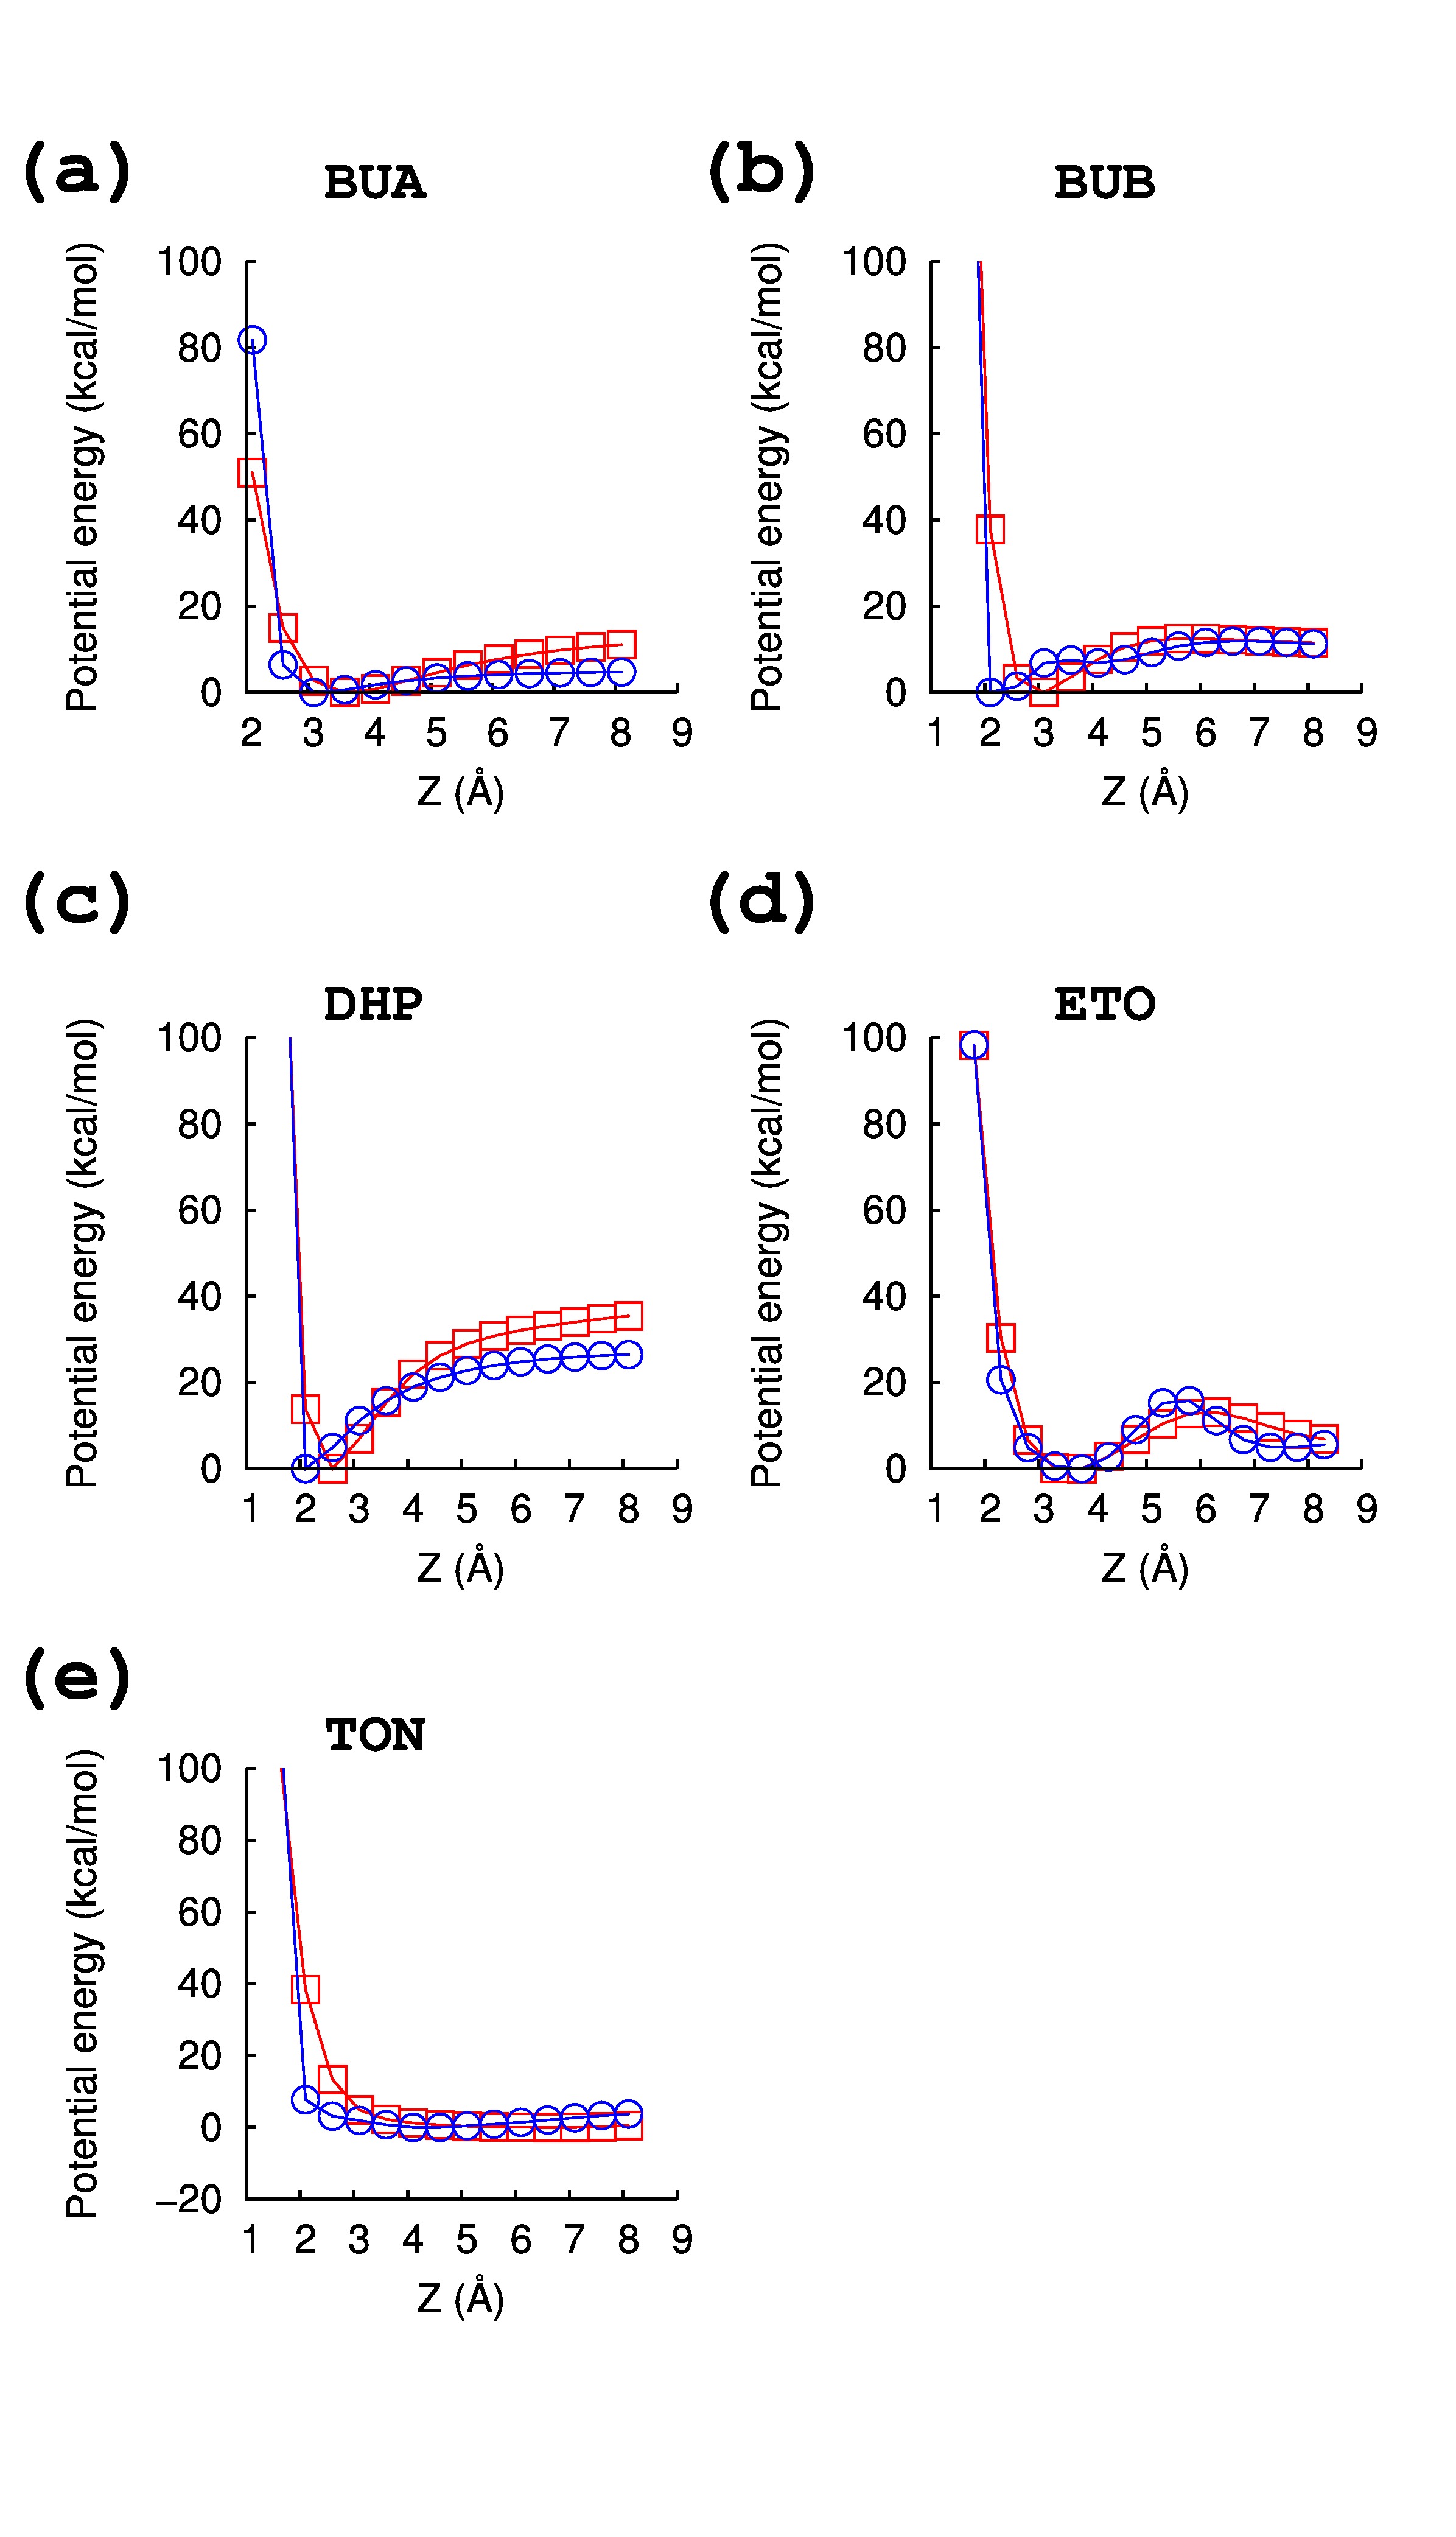
The adsorption energy of the respective molecules (BUA, BUB, DHP, ETO and TON) was evaluated with the first-principle simulation, and the results are shown in Figure 2 and TABLE 2.
| QM | MM* | |
|---|---|---|
| BUA | 8.11 | 4.72 |
| BUB | 11.51 | 11.31 |
| DHP | 35.44 | 26.46 |
| ETO | 6.85 | 5.58 |
| TON | 0.53 | 3.74 |
| * MM denotes Molecular Mechanic. |
As shown in TABLE 2, the dispersant molecule (DHP) has the largest interaction energy compared with the other molecules, because the phosphate ester has a strong polarizability. In addition, the minimum energy point of DHP was shorter than that of the other molecules, and a longer range attraction force was observed, suggesting that DHP is preferentially located in the vicinity of the BaTiO3 interface. The attraction interaction of DHP is reasonable because the DHP is well known as a strong dispersant for slurry.
Using the obtained PES, the force-field parameter between BaTiO3 and the respective molecules was determined. The nonbonding interaction energy between atom of BaTiO3 and atom of the organic molecule is evaluated as follows:
| (12) | ||||
| (13) |
where , , and are the atomic charge, distance between atoms and van der Waals parameters. Thus, the necessary parameters to perform an MD simulation are the atomic charge , and van der Waals pair interaction and . The parameters and are estimated by taking the average of the independent parameter of atoms and as follows:
| (14) | ||||
| (15) |
Because we used the GAFF for the force-field parameter of organic molecules, the parameters and for organic molecules are already reserved to describe the interactions between the respective molecules. Then, the changeable parameters for surface interaction are , and of BaTiO3 crystal, and these parameters were set to reproduce the PES obtained by the first-principle simulation. The parameters used in the all-atom MD simulation are listed in TABLE 3, and the PES results estimated by the parameter are indicated in Figure 2 by the blue line and open circles and are in good agreement with the PES evaluated by first principle. We analyzed the molecular distribution near BaTiO3 with the all-atom MD simulation using the obtained force-field parameter.
| Q | |||
|---|---|---|---|
| O | -0.08 | 0.180 | 2.205 |
| Ti | 0.16 | 0.180 | 2.405 |
| Ba | 0.08 | 0.180 | 3.805 |
| Os | -0.60 | 0.482 | 1.868 |
| Hs | 0.60 | 0.262 | 1.300 |
III.2 The distribution of molecules along the z-axis near the solid interface
The molecular distribution near the BaTiO3 surface was investigated with the all-atom MD simulation. The schematic illustration of the simulation model is shown in Figure 3-(a), where the interface between the polymer molecules and the solid BaTiO3 surface was generated. To understand the interface structure, the distribution function along the perpendicular direction was then evaluated .
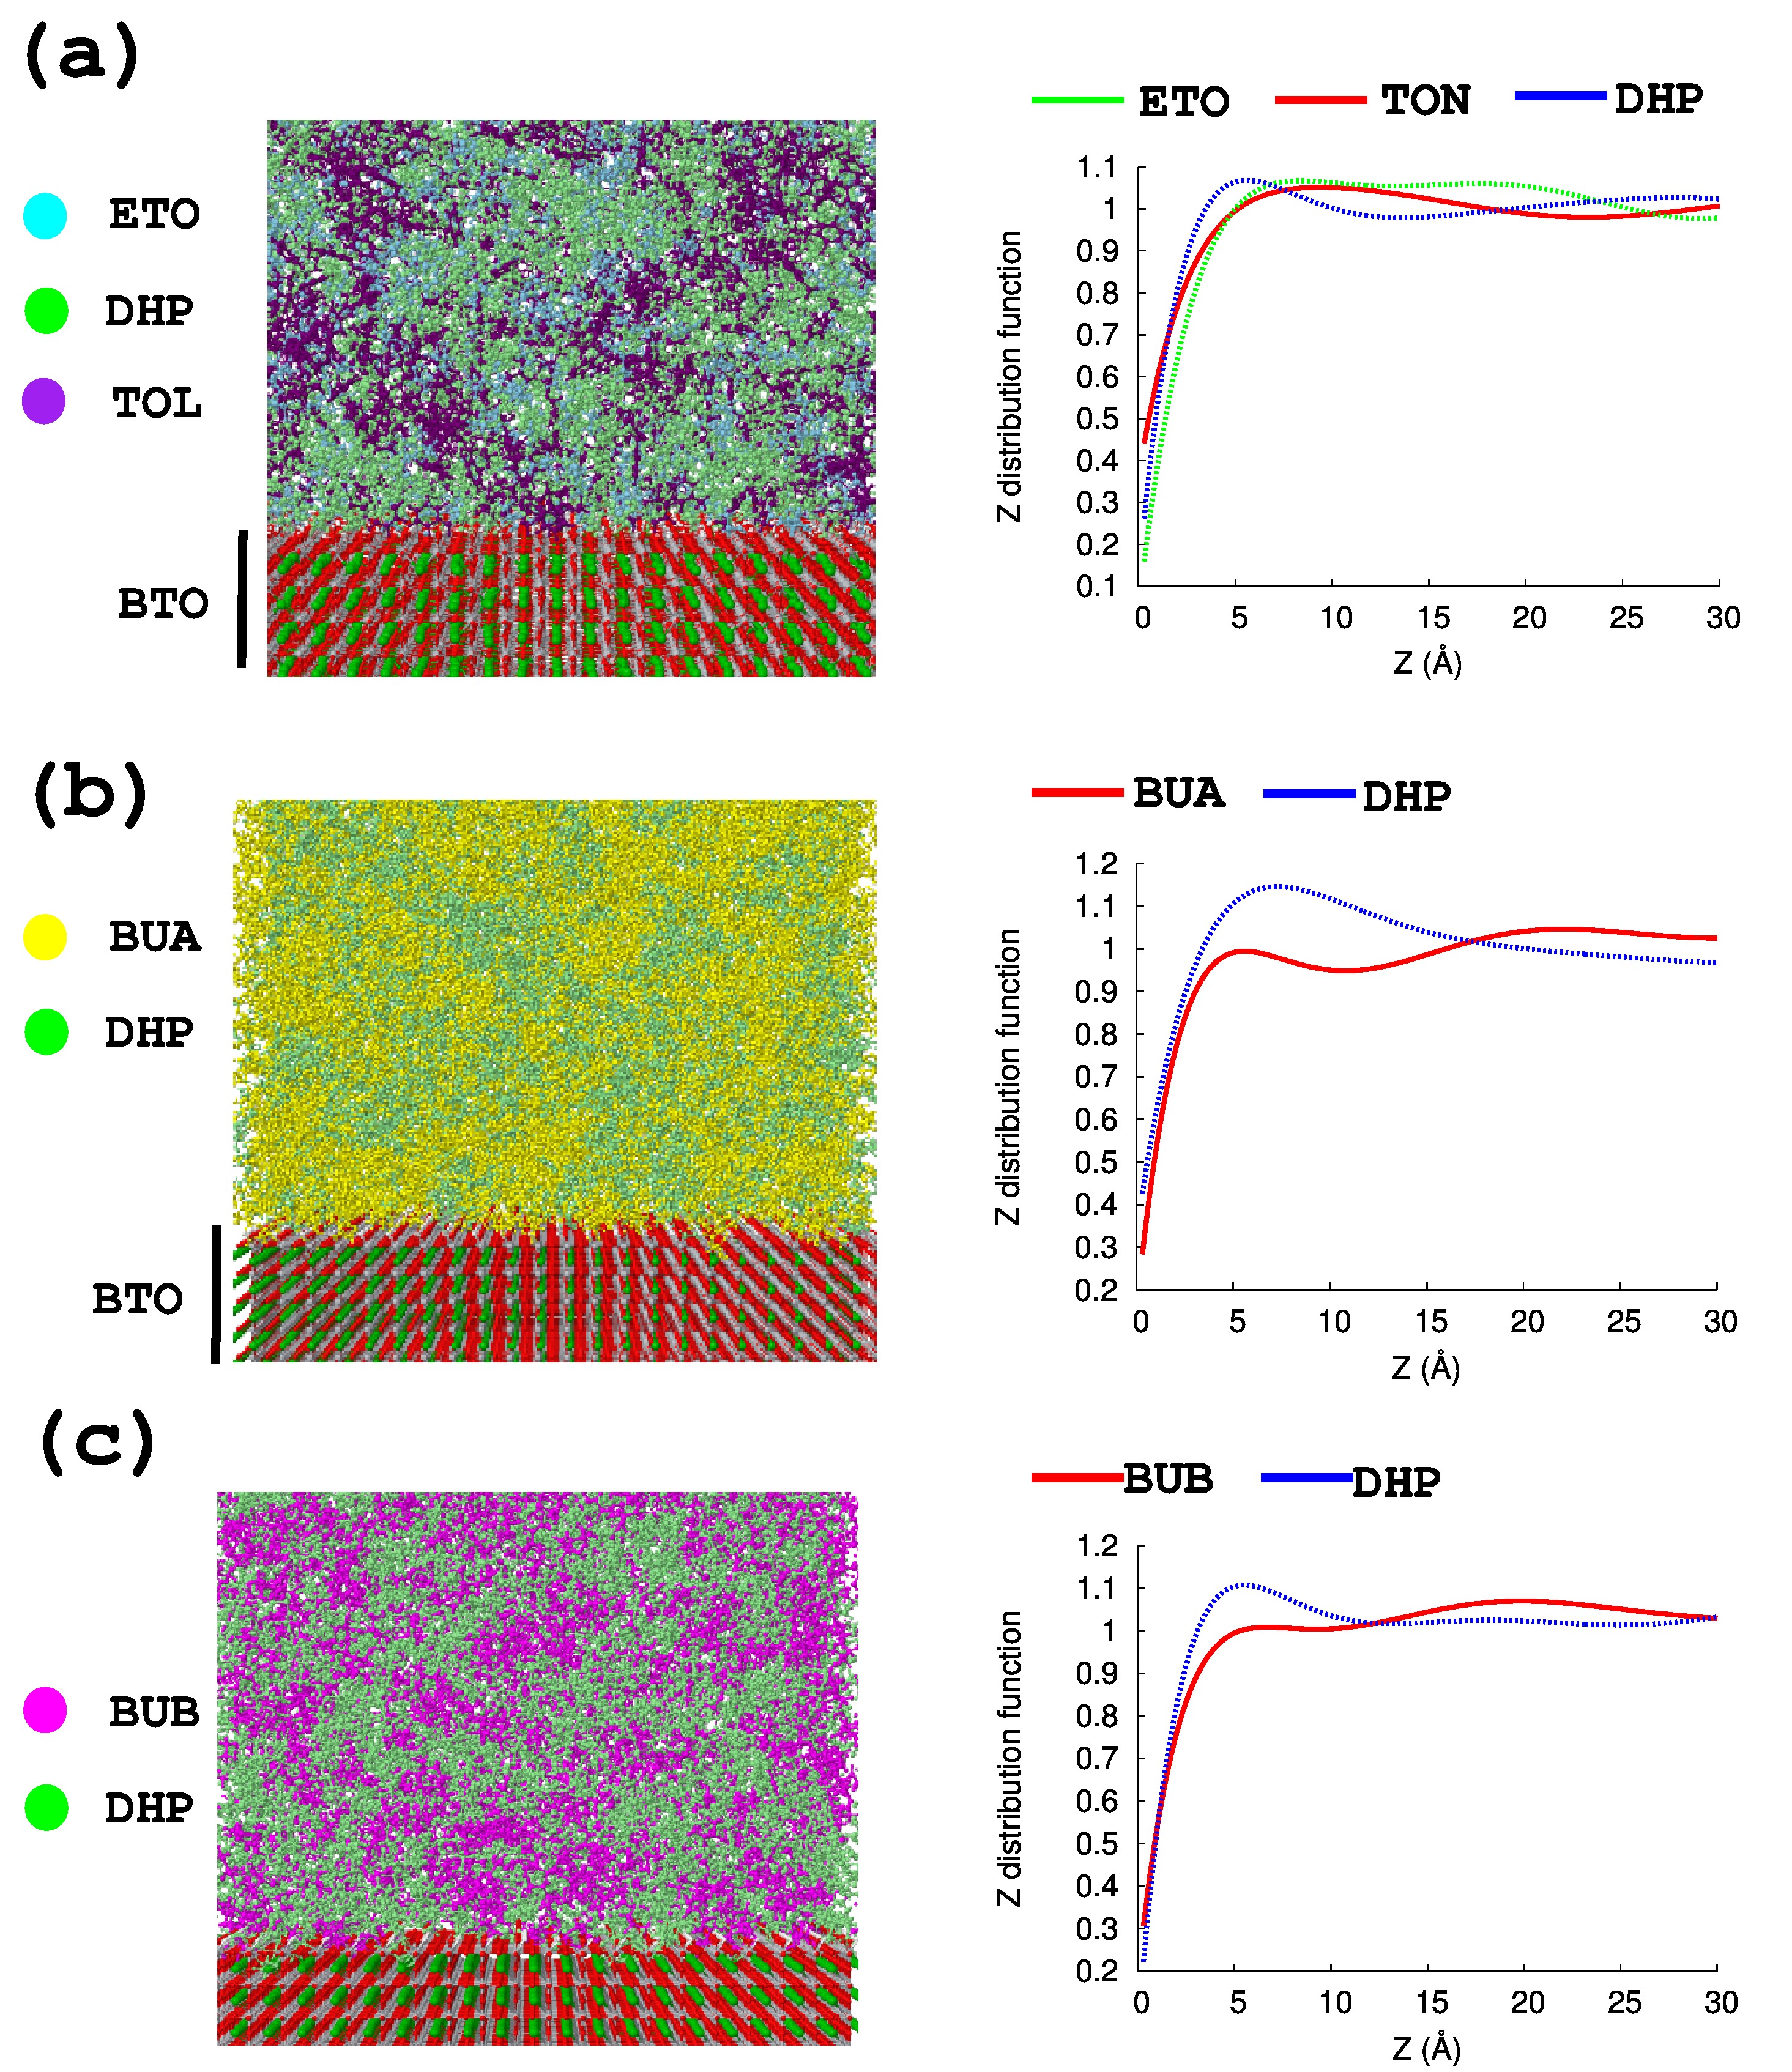
The results are shown in Figure 3-(a), (b) and (c), where the respective figures show the distributions of (a) EOH and TON against DHP, (b) BUA against DHP, and (c) BUB against DHP. In all cases, the DHP molecules locate in the vicinity of the BaTiO3 solid surface, pushing other molecules to the bulk region. The most prominent distribution difference is observed in the case of the mixture of BUA and DHP simulation (Figure 3-(b)), because BUA contains the hydrophobic alkyl chain. ETO molecules are located relatively close to the solid surface, and the presence of DHP had less impact compared with other molecules, which is also reasonable given the polarizability of the ETO molecule.
The all-atom MD simulation above makes clear the impact of the interaction energy on the actual distribution of molecules near the interface. Although the adsorption energy of DHP (35.44 kcal/mol) was significantly higher than that of the others, the probability of DHP locating at a neighbor site is not high compared with that of other molecules. This is because the final distributions of the molecules are determined not only by the most stable interaction energy, but also by other factors such as molecular size, rotation and interaction between the respective molecules. MD simulation is thus important for analyzing the impact of the DHP dispersant on the distribution of other molecules.
The simulation above is also an effective tool for screening the dispersant molecule for stabilizing the particles dispersion and decreasing the slurry viscosity. According to Fig. 3, DHP molecules locate on the BTO surface nearer than solvent (EOH and TON) and binder (BUA and BUB), indicating that DHP molecules preferentially adsorb on the BTO particles. In general, the dispersion adsorbed layer provides the steric and electrostatic repulsive force, which results in the increase in the stability of particle dispersion. ref70 ; ref71 . Therefore, the above simulation suggests that DHP molecules are a good dispersant for BaTiO3-based slurry.
III.3 Evaluation of the rheology of BaTiO3 slurry using the CG model
To understand the relationship between the interface geometry and the rheology of the slurry, a CGMD simulation was performed. The parameter for the CG model was generated using the Boltzmann inversion methodreith2003deriving ; guerrault2004dissipative as noted in computational detail, and the distribution of molecules near the interface was used to generate the pair interaction parameters between the solid and molecular interface. To validate the simulation model, we investigated the rheology for five different types of system, where the composition and size of BaTiO3 particles differ. The simulated composition is listed in TABLE 1, and the tested particle sizes were 2 nm (model01, model02 and model03), 8 nm (model04) and 15 nm (model05).
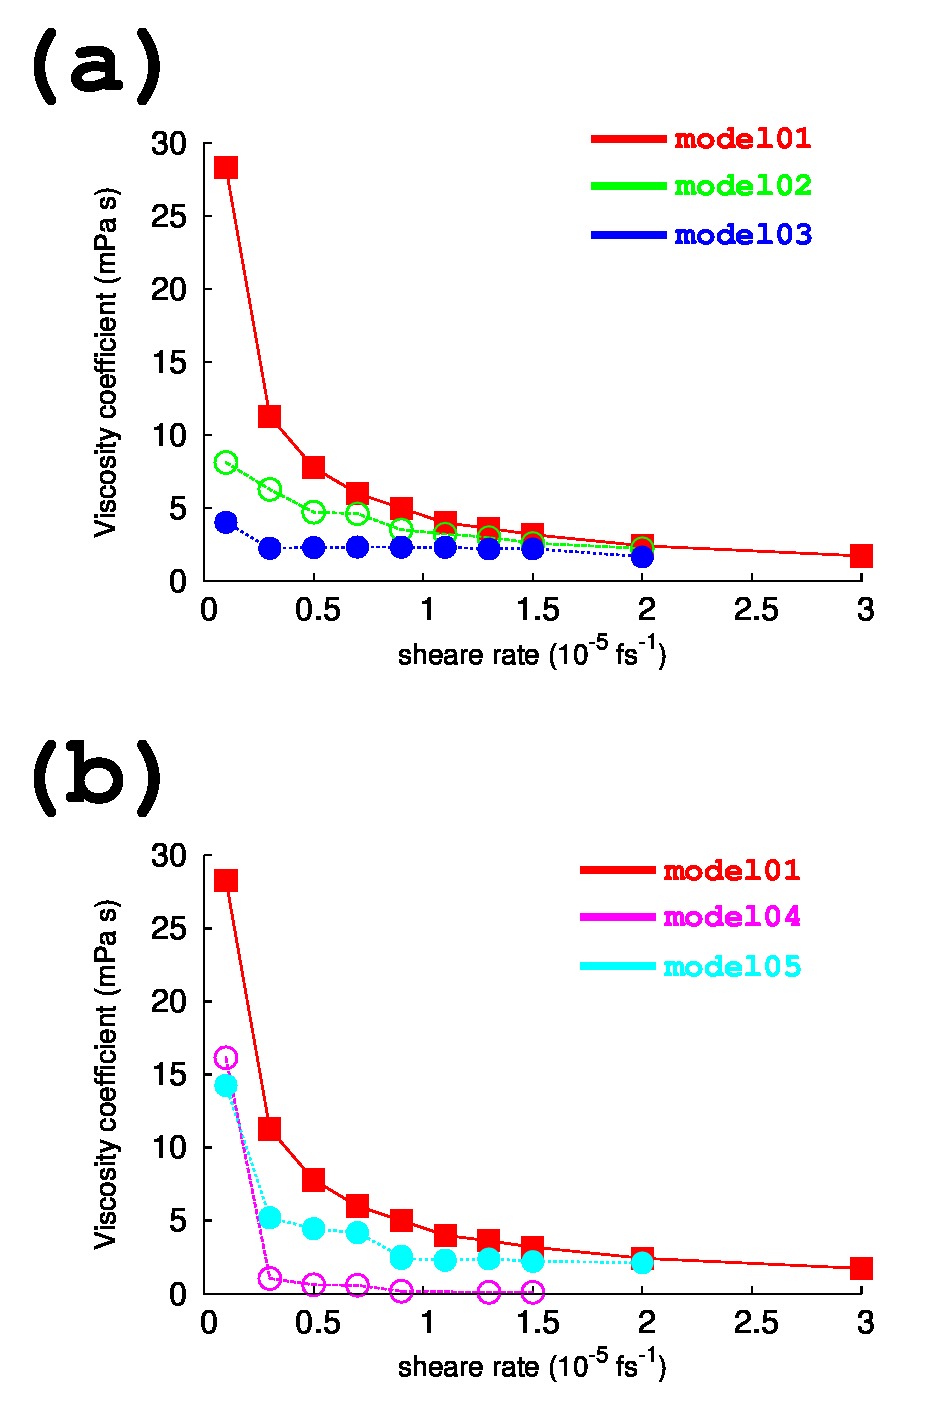
The results are summarized in Figure 4. The viscosity decreases as the shear rate increases in all models (Figure 4-(a)); that is, all models show shear thinning behavior. In particular, a significant decrease in viscosity with an increase in shear rate was observed in model01, resulting from aggregation of particles due to a large attractive force. In addition, the viscosity steeply decreases with the increase in DHP composition from model01 to model03. As predicted from the results in Figure 3, the differences in the flow behavior of the three models are clearly due to the effect of DHP as a dispersant on BaTiO3. A decrease in viscosity with the addition of phosphate ester was also observed in the experimentmikeska1988non ; kim2003suspension , and we assumed that the CG model could capture the physical picture of the BaTiO3 slurry. Furthermore, increasing the particle size also decreases the viscosity of slurry (Figure 4-(b)), which is also a typical behavior of the BaTiO3 slurryshibata2012dispersion . The simulation results indicate that the CG model used in this study can simulate the important effect of dispersant on the viscosity.
Since the CG model could simulate the flow behavior of the BaTiO3 slurry, it might be applied to know an appropriate amount of the dispersant for stable dispersion of particles, which is significantly important infomation for manufacturing. In this study, three different weight fraction of DHP and BTO are investigated: the ratio of weight fraction is 0.1 (DHP=0.03/BTO=0.3) for moderl01, 0.65 (DHP=0.13/BTO=0.2) for model02, and 2.3 (DHP=0.23/BTO=0.1) for mode03. In model01, the viscosity is very high at low shear rates, and a large shear stress is required to change the slurry microstructure. On the other hand, in the case of model02 and model03 with larger amount of dispersant than model01, the slurry viscosity maintains relatively low even at low shear rates. Although the viscosity of slurry model3 is slightly high at a shear rate of 0.1 fs-1, it behaves almost like a Newtonian fluid. Therefore, we conclude that the ratio of DHP/BTO in model03 is slightly excessive, and the appropriate amount of dispersant exists between model02 and model03.
Furthermore, the optimal amount of dispersant depends on the particle size in the slurry. The smaller size the particles are, the larger surface area they have, and therefore it is necessary to add much amount of dispersant for stable dispersion of BTO particles. As shown in FIG 4-(b), we have analyzed three models whose particle sizes are different but same weight fraction (Thus the respective models have different total surface area). In model04 and model05 (8nm and 15 nm particle size), a sufficient amount of dispersant adsorbed on the BTO particles, which results in the dispersion of BTO particles. Then the slurry microstructure easily collapses due to shearing. Although the ratios of weight fraction is same between model01 (2nm particle size), model04 (8 nm particle size), and model05 (15 nm particle size), the viscosity of model04 and model05 are significantly lower than model01. Thus, the CGMD simulations suggest that the ratio of DHP/BTO=0.1 is excessive for model04 or model05 slurry. As mentioned above, from the results of the CGMD simulation, it is possible to predict the effect of the dispersant in various slurry models, and thus we could predict the optimal amount of the dispersant for preparation of the stable dispersion of slurry.
To investigate the respective contribution of a particular molecule to the viscosity of the slurry, we decomposed the total shear stress into the respective molecular contributions, and the results are summarized in TABLE 4. The main contribution comes from the viscosity of the BaTiO3 interaction site, Addition of the DHP dispersant drastically reduced the viscosity of the slurry model from 22.44 to 2.87, suggesting that the DHP dispersant reduces the stress between BaTiO3 particles by locating between the surfaces. A reduction in viscosity (from 5.02 to 1.20) was also observed at the solvent interaction sites, and the DHP dispersant also prevents adhesion of the solvent on the BaTiO3 surface.
| bto | binder | dispersant | solvent | |
|---|---|---|---|---|
| model01 | 22.44 | 0.68 | 0.20 | 5.02 |
| model02 | 5.76 | 0.21 | 0.24 | 1.16 |
| model03 | 2.88 | 0.00 | 0.77 | 1.25 |
To understand how the dispersant affects the viscosity of the slurry, the structures of slurry models were investigated to determine whether BaTiO3 particles aggregate with each other, and where the DHP dispersant located in the slurry. The final structure after 5-ns simulation is shown in Figure 5. In Figure 5, red (surface) and blue (inside particle) denote the BaTiO3 particles, and green the DHP dispersant. The simulation results suggest that the BaTiO3 particles aggregated in all slurry models, and no apparent difference was noted.
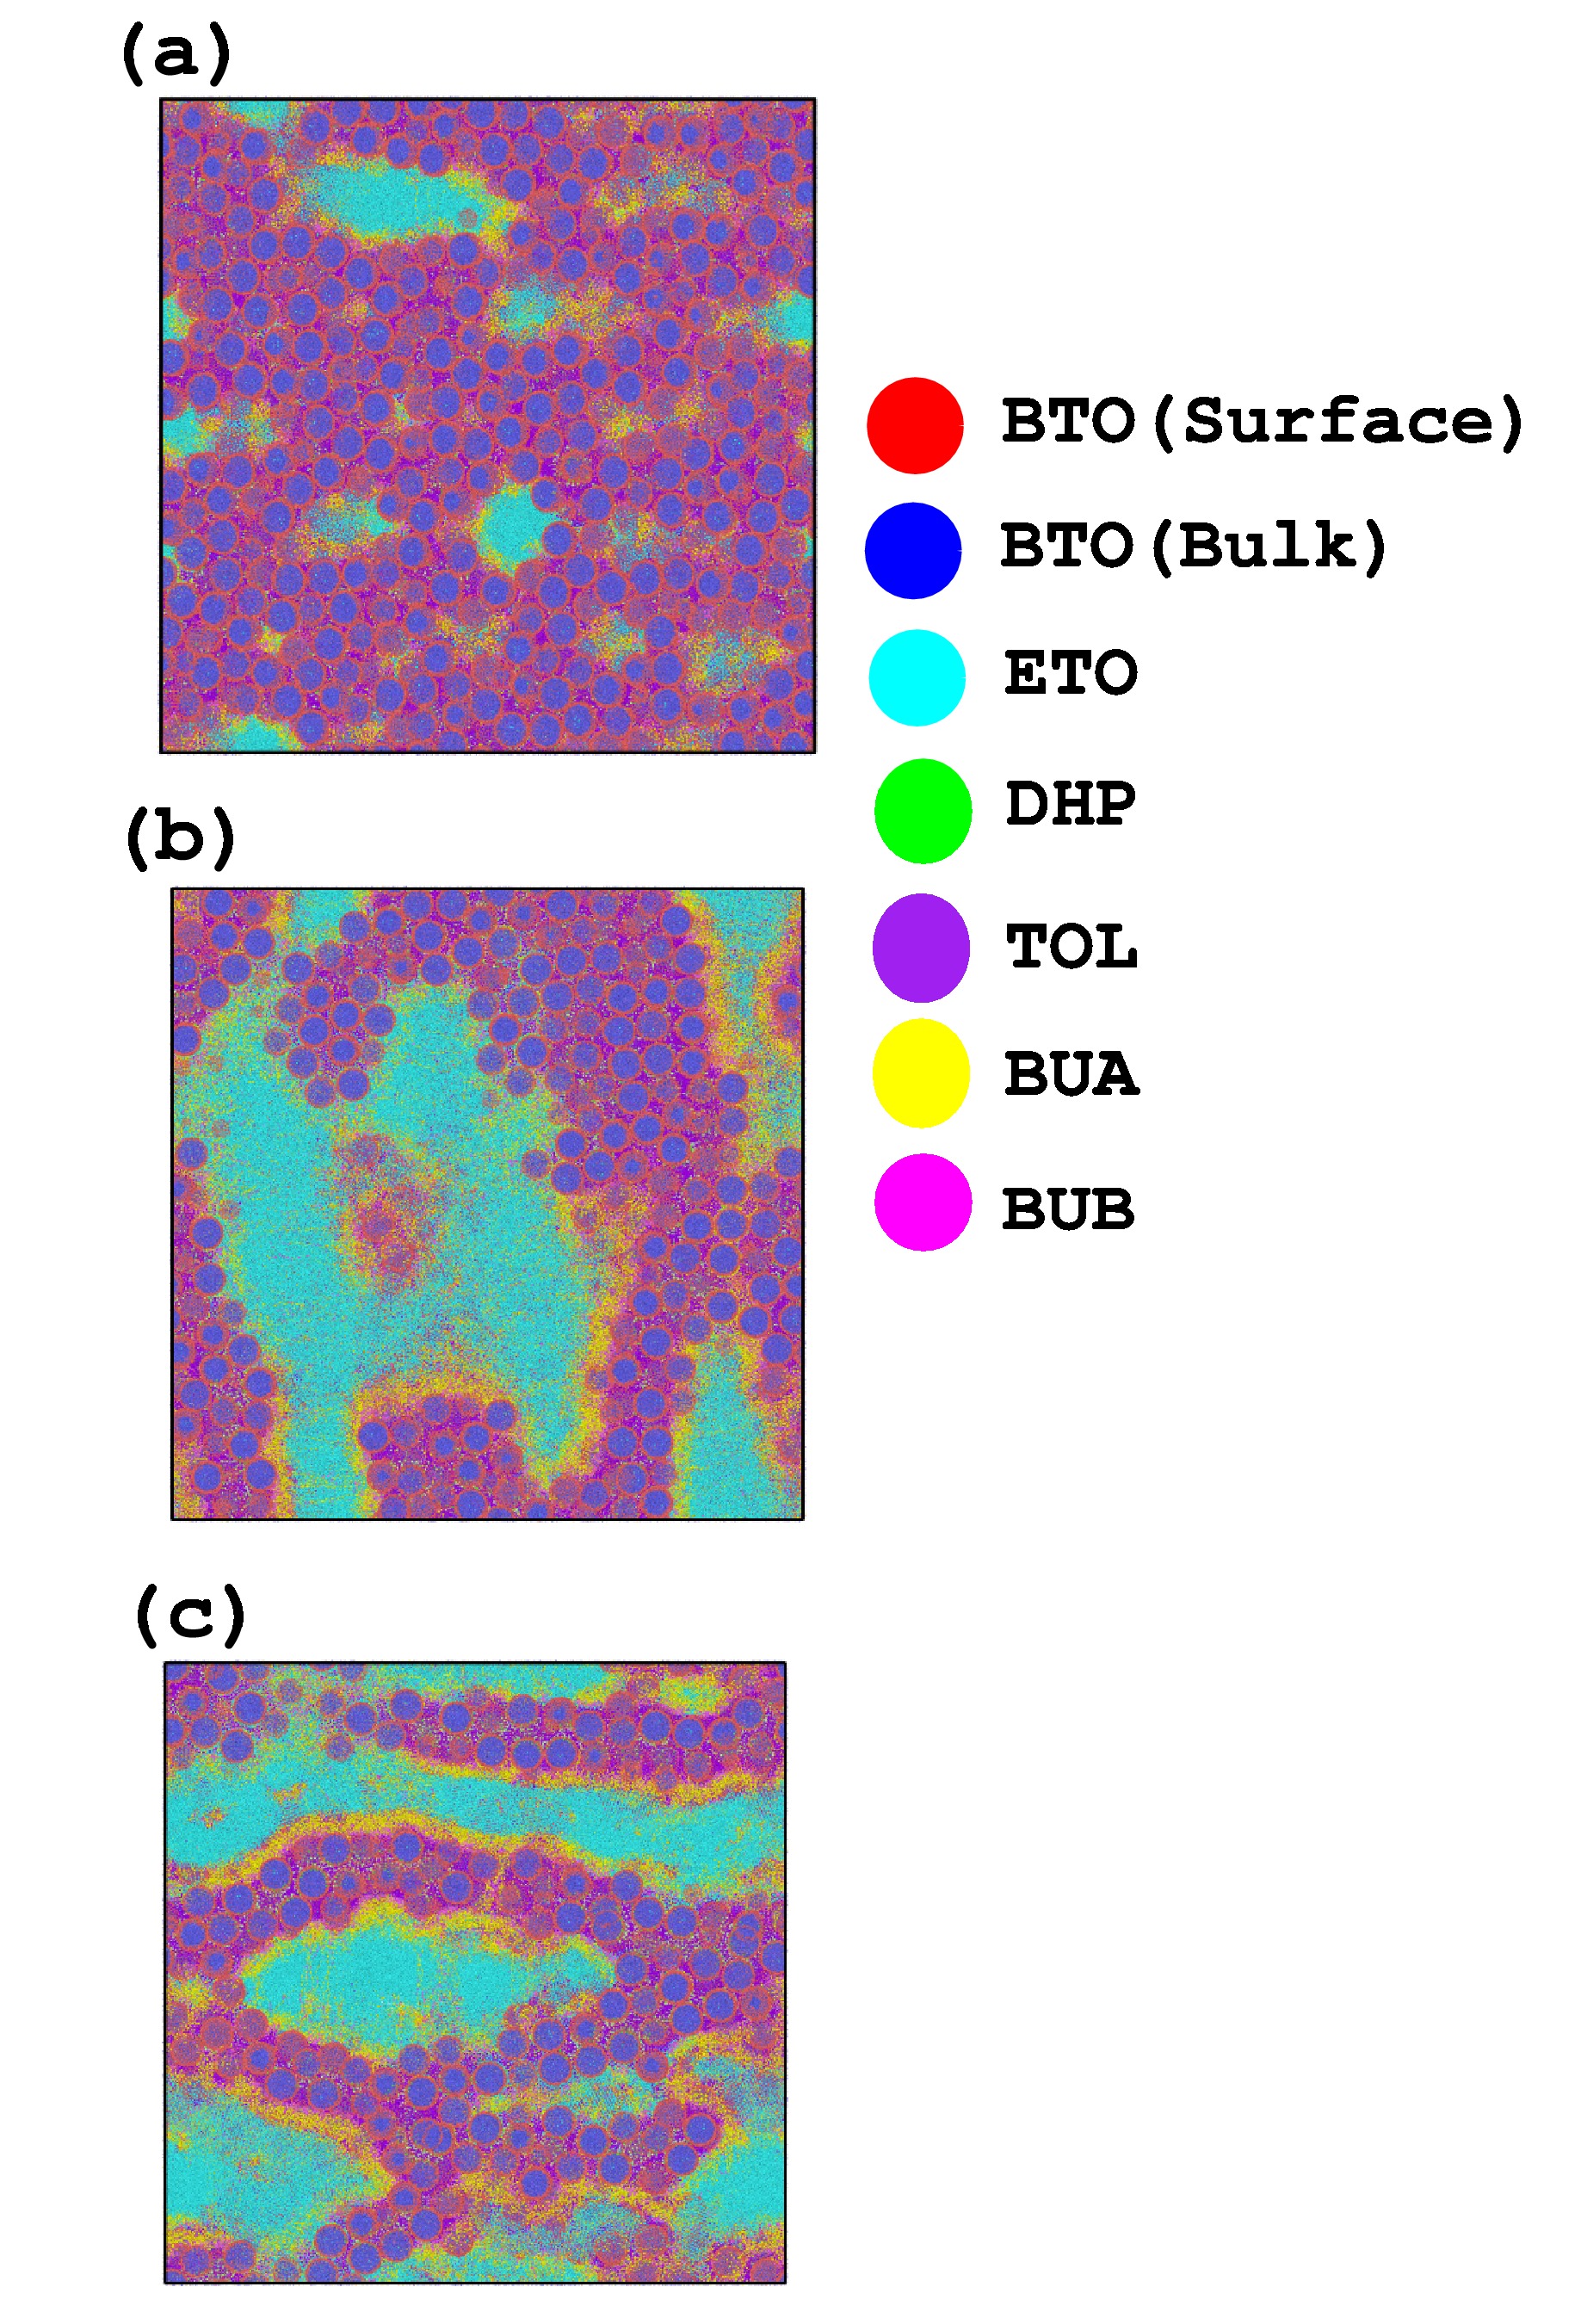
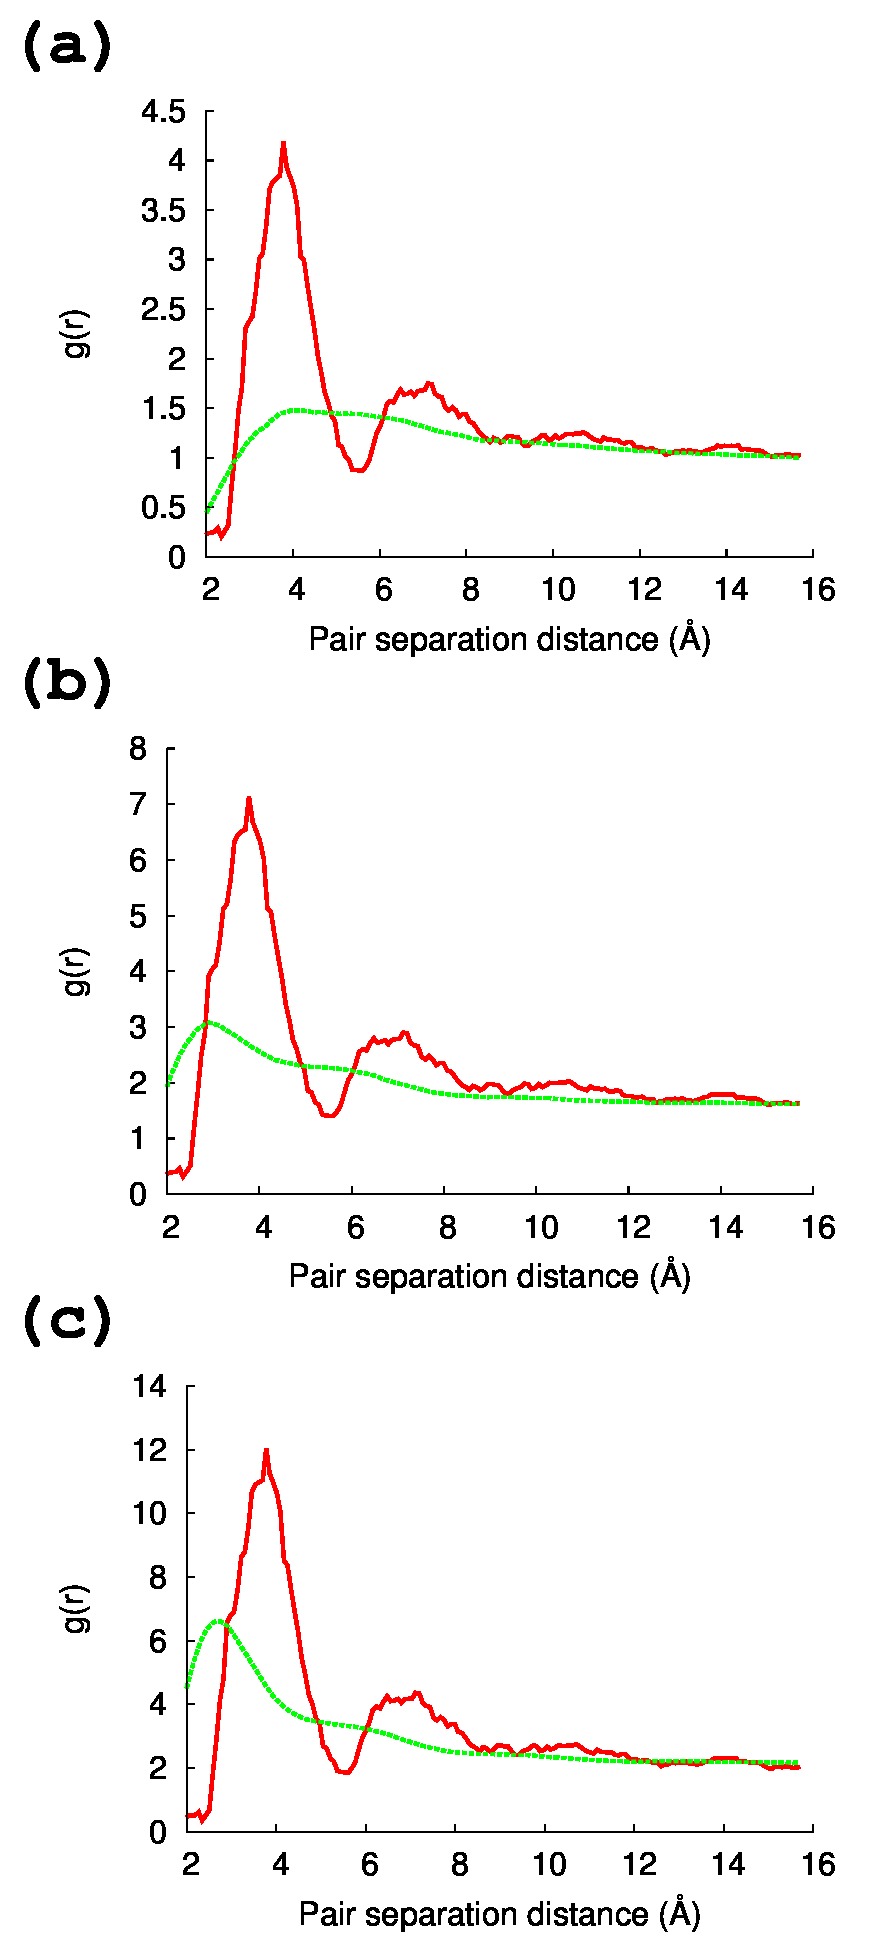
To further investigate the difference between the slurry models, the RDF was analyzed, and the results are shown in Figure 6. The red lines in Figure 6 indicate the RDF between the surface BaTiO3 interaction sites, with no difference observed between the respective slurry models. By contrast, a clear difference is observed in the RDF between DHP and BaTiO3 surface: When plenty of DHP is added (model03), the RDF shows that the DHP dispersant mainly locates near the BaTiO3 interaction sites. The simulation results thus suggest that locating DHP in the vicinity of BaTiO3 surface is a key feature in determining the rheology of BaTiO3 slurry.
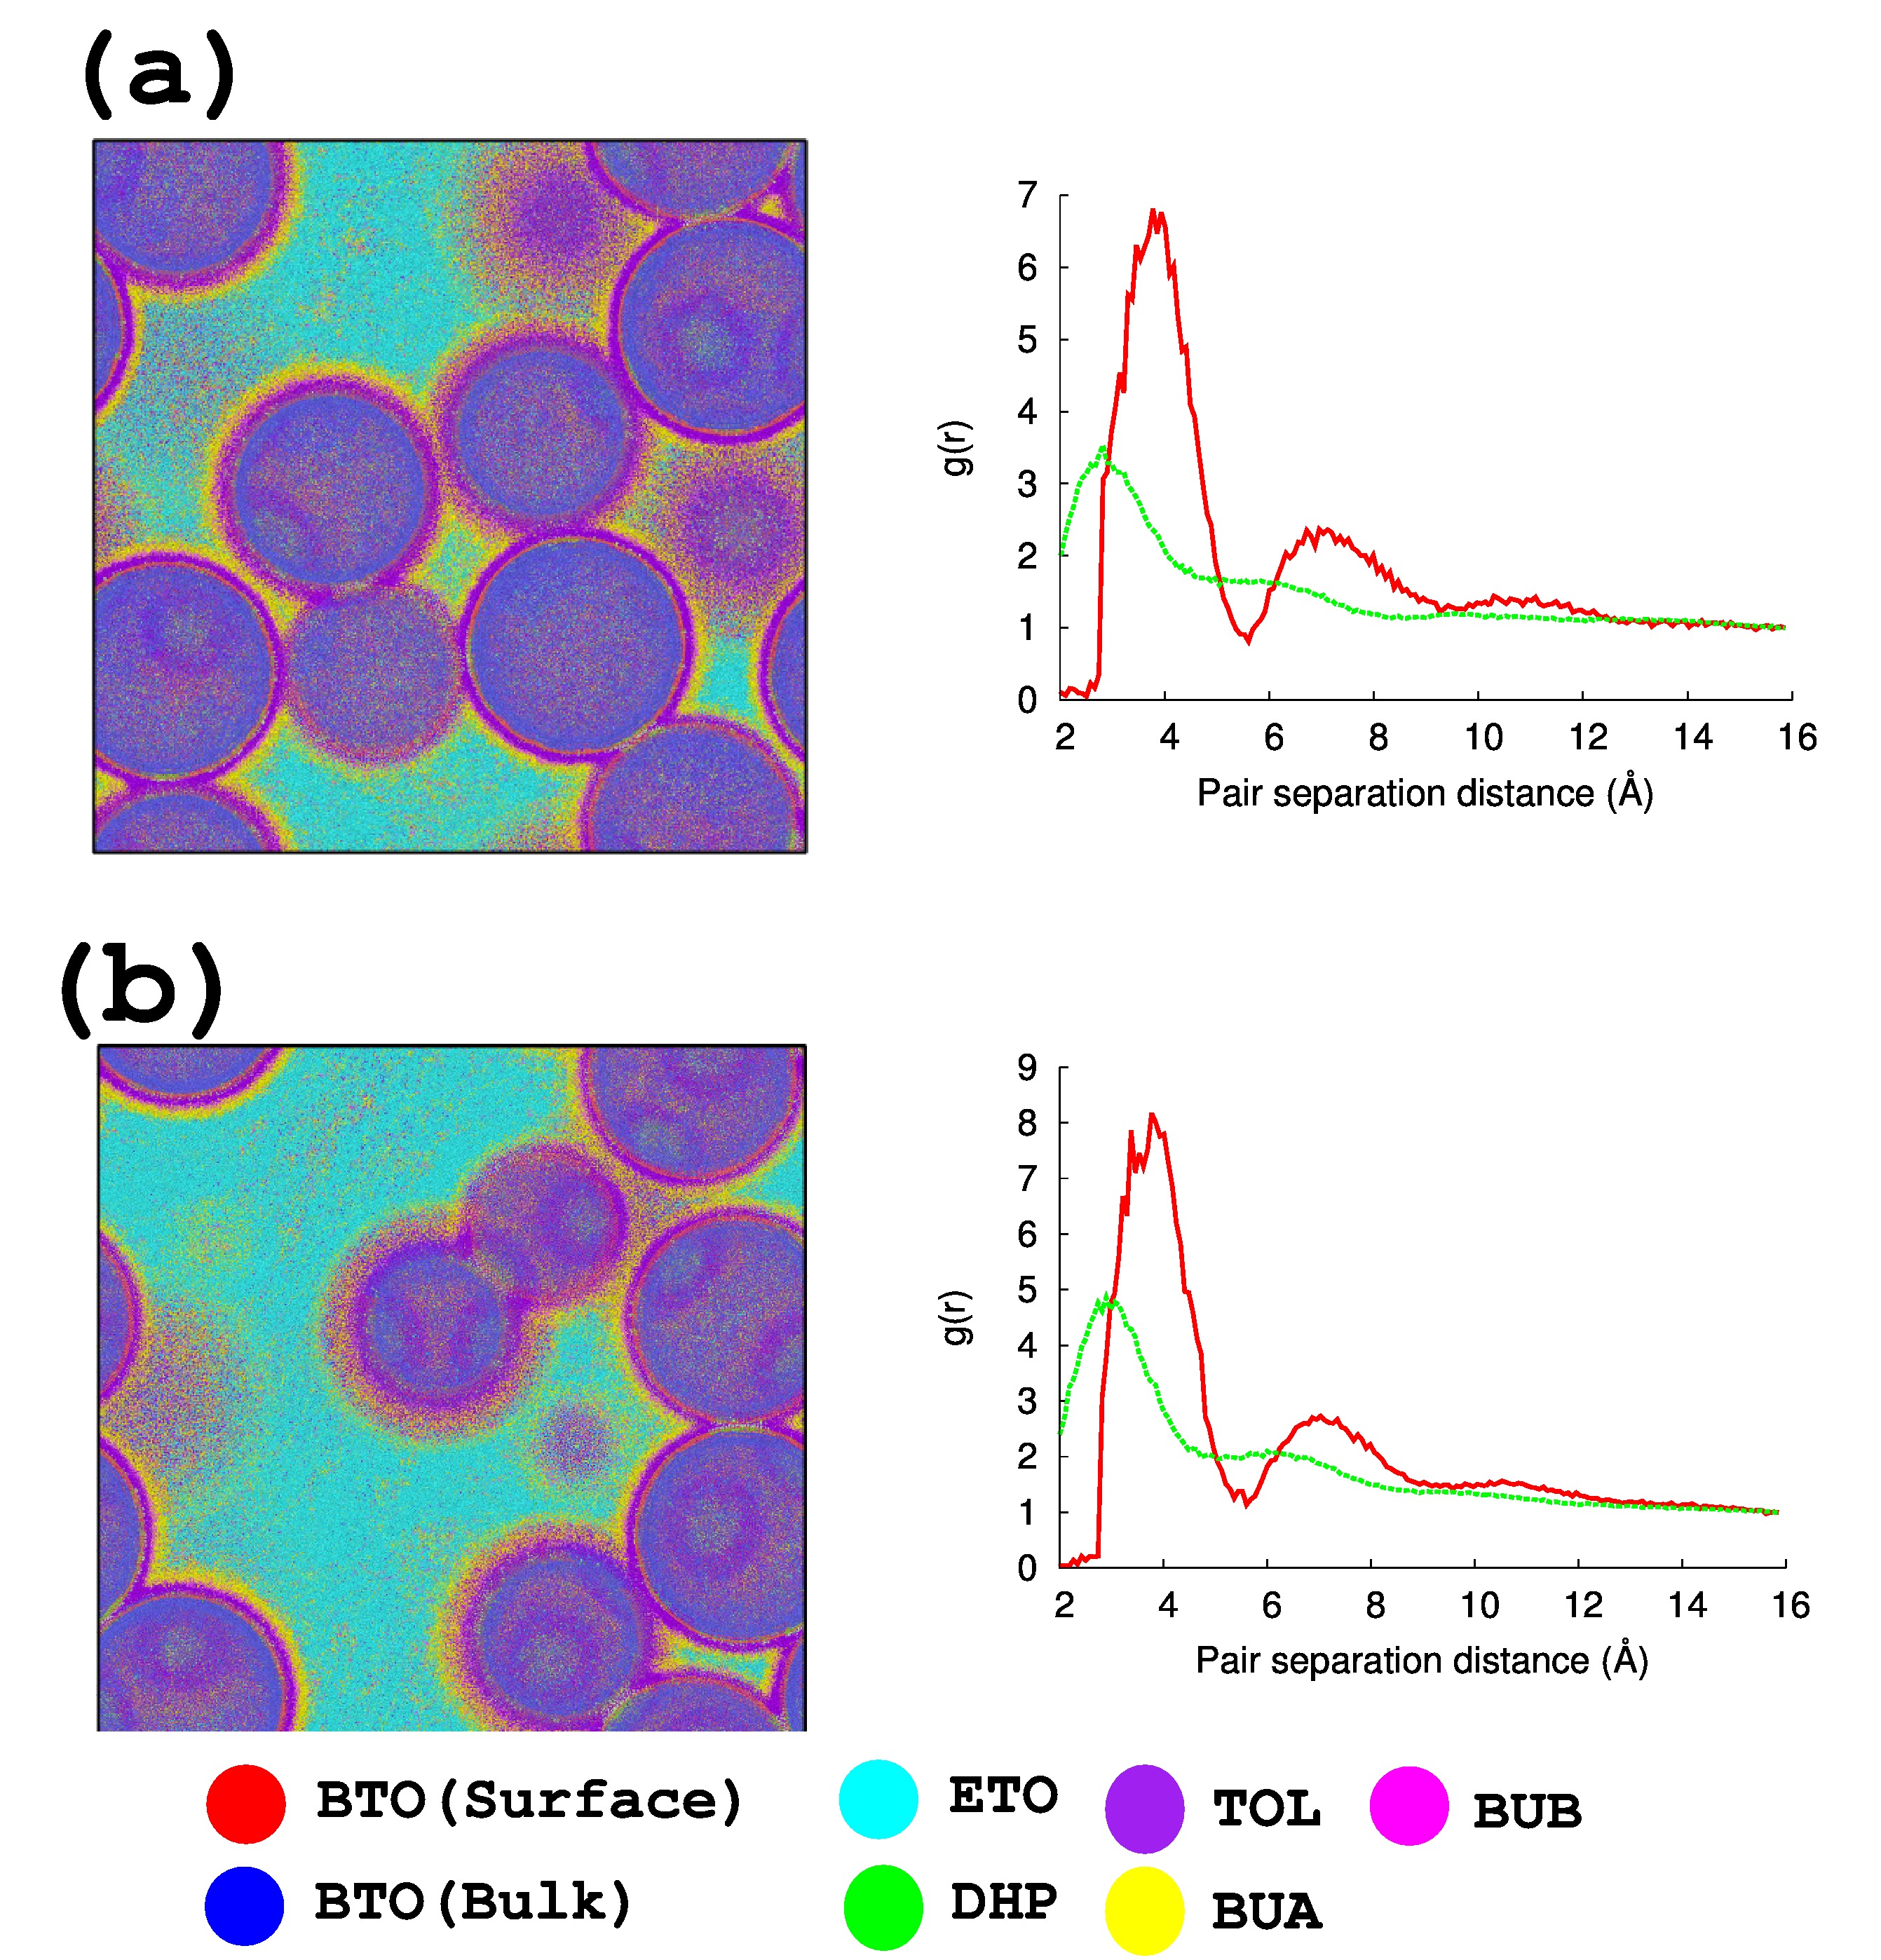
To further understand the rheology of the BaTiO3 slurry, we also analyzed the effect of particle size (from 2 to 15 nm), where we also observed the reduction in viscosity with increasing particle size. To understand the change of viscosity, the final structure and corresponding RDF are shown in Figure 7. The RDF between BaTiO3 interaction sites does not change significantly (Figure 7 compared with model01, but we observe an intense peak of the RDF between BaTiO3 and DHP interaction sites, and the nearest-neighbor distance is less than the distance between the BaTiO3 interaction sites. This result also suggests that the key factor for determining the viscosity of the BaTiO3 slurry is the population of the DHP dispersant locating in the vicinity of the BaTiO3 surface.
IV Conclusions
We investigated the rheology of a BaTiO3 slurry using CGMD simulation to understand the role of dispersant, especially focusing on the close-to-solid surface. First, the DFT and all-atom MD simulations showed that in contrast to binder or solvent molecules, the DHP dispersant prefers to locate near the BaTiO3 surface . By scaling up the atomistic simulation, the coarse grain simulation model can then successfully reproduce the reduction in viscosity with the increase of dispersant. In the simulation model, the DHP dispersant preferentially located in the vicinity of the BaTiO3 surface, playing an important role in sliding the BaTiO3 particles by the repulsion force, due to the hydrophobic didodecyl group, suggesting that the population of dispersant near the BaTiO3 surface is a key factor in determining the rheology of the BaTiO3 slurry.
In this study, we proposed a means of connecting a molecular-level surface interaction to a microstructure physical property such as viscosity by using quantum-level, all-atom MD and CGMD simulations. By scaling up from the atomistic-level simulation to CG simulation, we were able to grasp in a rigorous manner how the adsorption energy difference between respective molecules results in a final microstructure property such as rheology. Such a molecular-level understanding of the BaTiO3 slurry enables the prediction of slurry macro behavior and the estimation of optimal additive amount of dispersant without experiments, and thus could be of great help in the efficient optimization of slurry preparation.
ACKNOWLEDGMENTS
We thank the Research Institute for Information Technology at Kyushu University for providing computational resources. This research also used the computational resources of the Fujitsu PRIMERGY CX400M1/CX2550M5(Oakbridge-CX) at the Information Technology Center of The University of Tokyo through the HPCI System Research project (Project ID:hp200015).
References
- (1) Kishi H, Mizuno Y, Chazono H. Base-metal electrode-multilayer ceramic capacitors: past, present and future perspectives. Japanese journal of applied physics. 2003;42(1R):1.
- (2) Hong K, Lee TH, Suh JM, Yoon SH, Jang HW. Perspectives and challenges in multilayer ceramic capacitors for next generation electronics. Journal of Materials Chemistry C. 2019;7(32):9782-802.
- (3) Sakabe Y, Wada N, Hiramatsu T, Tonogaki T. Dielectric properties of fine-grained BaTiO3 ceramics doped with CaO. Japanese journal of applied physics. 2002;41(11S):6922.
- (4) Gong H, Wang X, Zhang S, Tian Z, Li L. Electrical and reliability characteristics of Mn-doped nano BaTiO3-based ceramics for ultrathin multilayer ceramic capacitor application. Journal of Applied Physics. 2012;112(11):114119.
- (5) Li L, Xie J, Wang M, Zhang K. Colossal permittivity (Nb, Mg) co-doped BaTiO3 ceramics with excellent temperature stability and high insulation resistivity. Ceramics International. 2021;47(7):10072-8.
- (6) Buscaglia V, Randall CA. Size and scaling effects in barium titanate. An overview. Journal of the European Ceramic Society. 2020;40(11):3744-58.
- (7) Zhu C, Cai Z, Guo L, Li L, Wang X. Grain size engineered high-performance nanograined BaTiO3-based ceramics: Experimental and numerical prediction. Journal of the American Ceramic Society. 2021;104(1):273-83.
- (8) Suzuki S, Yamaguchi S, Doi A, Abe S, Matsuda M, Nakamura T, et al. Effect of alloying Ni inner electrodes on the leakage current degradation of BaTiO3-based multilayer ceramic capacitors. Applied Physics Letters. 2020;116(13):132903.
- (9) Okuma G, Saito N, Mizuno K, Iwazaki Y, Kishi H, Takeuchi A, et al. Microstructural evolution of electrodes in sintering of multi-layer ceramic capacitors (MLCC) observed by synchrotron X-ray nano-CT. Acta Materialia. 2021;206:116605.
- (10) Suzuki S, Yamaguchi S, Doi A, Shiota A, Iwaji N, Abe S, et al. Suppressive effect of Ni–Sn internal electrode at the anode on the leakage current degradation of BaTiO3-based multilayer ceramic capacitors. Applied Physics Letters. 2021;118(11):112904.
- (11) Sada T, Fujikawa N. Analysis of insulation resistance degradation in Ni–BaTiO3 multilayer ceramic capacitors under highly accelerated life test. Japanese Journal of Applied Physics. 2017;56(10S):10PB04.
- (12) Nagayoshi M, Matsubara K, Fujikawa N. Analyses of microstructure at degraded local area in Ni-multilayer ceramic capacitors under highly accelerated life test. Japanese Journal of Applied Physics. 2020;59(SP):SPPC01.
- (13) Samantaray MM, Gurav A, Dickey EC, Randall CA. Electrode defects in multilayer capacitors part I: modeling the effect of electrode roughness and porosity on electric field enhancement and leakage current. Journal of the American Ceramic Society. 2012;95(1):257-63.
- (14) Samantaray MM, Gurav A, Dickey EC, Randall CA. Electrode Defects in Multilayer Capacitors Part II: Finite Element Analysis of Local Field Enhancement and Leakage Current in Three-Dimensional Microstructures. Journal of the American Ceramic Society. 2012;95(1):264-8. Available from: https://ceramics.onlinelibrary.wiley.com/doi/abs/10.1111/j.1551-2916.2011.04768.x.
- (15) Heath JP, Harding JH, Sinclair DC, Dean JS. Electric field enhancement in ceramic capacitors due to interface amplitude roughness. Journal of the European Ceramic Society. 2019;39(4):1170-7.
- (16) Chu LW, Prakash KN, Tsai MT, Lin IN. Dispersion of nano-sized BaTiO3 powders in nonaqueous suspension with phosphate ester and their applications for MLCC. Journal of the European Ceramic Society. 2008;28(6):1205-12.
- (17) Mikeska KR, Cannon W. Non-aqueous dispersion properties of pure barium titanate for tape casting. Colloids and Surfaces. 1988;29(3):305-21.
- (18) Bhattacharjee S, Paria M, Maiti HS. Polyvinyl butyral as a dispersant for barium titanate in a non-aqueous suspension. Journal of materials science. 1993;28(23):6490-5.
- (19) Tseng WJ, Lin CL. Effect of dispersants on rheological behavior of BaTiO3 powders in ethanol–isopropanol mixtures. Materials chemistry and physics. 2003;80(1):232-8.
- (20) Iwata N, Mori T. Effect of binder addition on optimum additive amount of dispersant for aqueous BaTiO3 slurry. Ceramics International. 2019;45(16):19644-9.
- (21) Dong Q, Zhu T, Xie Z, Han Y, An D. Optimization of the tape casting slurries for high-quality zirconia substrates. Ceramics International. 2017;43(18):16943-9.
- (22) Iwata N, Mori T. Determination of optimum slurry evaluation method for the prediction of BaTiO3 green sheet density. Journal of Asian Ceramic Societies. 2020;8(1):183-92.
- (23) Ding M, Shi Y, Xie J, Zhou D, Wang Y, Lei F, et al. Optimization of non-aqueous tape casting of high solid loading slurry for aluminum nitride ceramic substrates. International Journal of Applied Ceramic Technology. 2020;17(1):285-95.
- (24) Chen H, Wei W, Hsu KC, Chen C. Adsorption of PAA on the -Al2O3 Surface. Journal of the American Ceramic Society. 2007;90(6):1709-16.
- (25) Zhao H, Wang Y, Yang Y, Shu X, Yan H, Ran Q. Effect of hydrophobic groups on the adsorption conformation of modified polycarboxylate superplasticizer investigated by molecular dynamics simulation. Applied Surface Science. 2017;407:8-15.
- (26) Chun HJ, Kim HK, Yoon Y, Park SC. First-principles investigation of phosphate ester and carboxylic acid on BaTiO3 surfaces with stoichiometric terminations. Surface Science. 2021;703:121737.
- (27) Grest GS, Kremer K. Molecular dynamics simulation for polymers in the presence of a heat bath. Physical Review A. 1986;33(5):3628.
- (28) Kremer K, Grest GS. Dynamics of entangled linear polymer melts: A molecular-dynamics simulation. The Journal of Chemical Physics. 1990;92(8):5057-86.
- (29) Trément S, Schnell B, Petitjean L, Couty M, Rousseau B. Conservative and dissipative force field for simulation of coarse-grained alkane molecules: A bottom-up approach. The Journal of chemical physics. 2014;140(13):134113.
- (30) Reith D, Pütz M, Müller-Plathe F. Deriving effective mesoscale potentials from atomistic simulations. Journal of computational chemistry. 2003;24(13):1624-36.
- (31) Kreer T, Müser M, Binder K, Klein J. Frictional drag mechanisms between polymer-bearing surfaces. Langmuir. 2001;17(25):7804-13.
- (32) Padding J, Briels WJ. Time and length scales of polymer melts studied by coarse-grained molecular dynamics simulations. The Journal of chemical physics. 2002;117(2):925-43.
- (33) Spyriouni T, Tzoumanekas C, Theodorou D, Müller-Plathe F, Milano G. Coarse-grained and reverse-mapped united-atom simulations of long-chain atactic polystyrene melts: Structure, thermodynamic properties, chain conformation, and entanglements. Macromolecules. 2007;40(10):3876-85.
- (34) Guerrault X, Rousseau B, Farago J. Dissipative particle dynamics simulations of polymer melts. I. Building potential of mean force for polyethylene and cis-polybutadiene. The Journal of chemical physics. 2004;121(13):6538-46.
- (35) Harmandaris VA, Daoulas KC, Mavrantzas VG. Molecular dynamics simulation of a polymer melt/solid interface: Local dynamics and chain mobility in a thin film of polyethylene melt adsorbed on graphite. Macromolecules. 2005;38(13):5796-809.
- (36) Wang Y, Maurel G, Couty M, Detcheverry F, Merabia S. Implicit Medium Model for Fractal Aggregate Polymer Nanocomposites: Linear Viscoelastic Properties. Macromolecules. 2019;52(5):2021-32.
- (37) Maurel G, Schnell B, Goujon F, Couty M, Malfreyt P. Multiscale modeling approach toward the prediction of viscoelastic properties of polymers. Journal of chemical theory and computation. 2012;8(11):4570-9.
- (38) Li Y, Kroger M, Liu WK. Nanoparticle geometrical effect on structure, dynamics and anisotropic viscosity of polyethylene nanocomposites. Macromolecules. 2012;45(4):2099-112.
- (39) Wendt M. Effect of copolymer sequence on local viscoelastic properties in spherical coordinates around a nanoparticle. The Ohio State University; 2019.
- (40) Ghoufi A, Malfreyt P. Coarse grained simulations of the electrolytes at the water–air interface from many body dissipative particle dynamics. Journal of chemical theory and computation. 2012;8(3):787-91.
- (41) Hagita K. Two-dimensional scattering patterns of coarse-grained molecular dynamics model of filled polymer gels during uniaxial expansion. Polymer. 2019;166:155-68.
- (42) Harton SE, Kumar SK, Yang H, Koga T, Hicks K, Lee H, et al. Immobilized polymer layers on spherical nanoparticles. Macromolecules. 2010;43(7):3415-21.
- (43) Qian HJ, Carbone P, Chen X, Karimi-Varzaneh HA, Liew CC, Muller-Plathe F. Temperature-transferable coarse-grained potentials for ethylbenzene, polystyrene, and their mixtures. Macromolecules. 2008;41(24):9919-29.
- (44) Ndoro TV, Voyiatzis E, Ghanbari A, Theodorou DN, Bohm MC, Muller-Plathe F. Interface of grafted and ungrafted silica nanoparticles with a polystyrene matrix: Atomistic molecular dynamics simulations. Macromolecules. 2011;44(7):2316-27.
- (45) Ghanbari A, Ndoro TV, Leroy F, Rahimi M, Bohm MC, Muller-Plathe F. Interphase structure in silica–polystyrene nanocomposites: a coarse-grained molecular dynamics study. Macromolecules. 2012;45(1):572-84.
- (46) Bogoslovov R, Roland C, Ellis A, Randall A, Robertson C. Effect of silica nanoparticles on the local segmental dynamics in poly (vinyl acetate). Macromolecules. 2008;41(4):1289-96.
- (47) Ndoro TV, Bohm MC, Muller-Plathe F. Interface and interphase dynamics of polystyrene chains near grafted and ungrafted silica nanoparticles. Macromolecules. 2012;45(1):171-9.
- (48) Kacar G, Peters EA, de With G. Structure of a thermoset polymer near an alumina substrate as studied by dissipative particle dynamics. The Journal of Physical Chemistry C. 2013;117(37):19038-47.
- (49) Johnston K, Harmandaris V. Hierarchical simulations of hybrid polymer–solid materials. Soft Matter. 2013;9(29):6696-710.
- (50) Eslami H, Muller-Plathe F. How thick is the interphase in an ultrathin polymer film? Coarse-grained molecular dynamics simulations of polyamide-6, 6 on graphene. The Journal of Physical Chemistry C. 2013;117(10):5249-57.
- (51) Daoulas KC, Harmandaris VA, Mavrantzas VG. Detailed atomistic simulation of a polymer melt/solid interface: structure, density, and conformation of a thin film of polyethylene melt adsorbed on graphite. Macromolecules. 2005;38(13):5780-95.
- (52) Pandey YN, Brayton A, Burkhart C, Papakonstantopoulos GJ, Doxastakis M. Multiscale modeling of polyisoprene on graphite. The Journal of chemical physics. 2014;140(5):054908.
- (53) Vinothini V, Singh P, Balasubramanian M. Optimization of barium titanate nanopowder slip for tape casting. Journal of materials science. 2006;41(21):7082-7.
- (54) Giannozzi P, Baroni S, Bonini N, Calandra M, Car R, Cavazzoni C, et al. QUANTUM ESPRESSO: a modular and open-source software project for quantum simulations of materials. Journal of physics: Condensed matter. 2009;21(39):395502.
- (55) Giannozzi P, Andreussi O, Brumme T, Bunau O, Nardelli MB, Calandra M, et al. Advanced capabilities for materials modelling with Quantum ESPRESSO. Journal of Physics: Condensed Matter. 2017;29(46):465901.
- (56) Perdew JP, Chevary JA, Vosko SH, Jackson KA, Pederson MR, Singh DJ, et al. Atoms, molecules, solids, and surfaces: Applications of the generalized gradient approximation for exchange and correlation. Physical review B. 1992;46(11):6671.
- (57) Perdew JP, Burke K, Ernzerhof M. Generalized gradient approximation made simple. Physical review letters. 1996;77(18):3865.
- (58) Vanderbilt D. Soft self-consistent pseudopotentials in a generalized eigenvalue formalism. Phys Rev B. 1990;41(11):7892-5. Available from: https://link.aps.org/doi/10.1103/PhysRevB.41.7892.
- (59) Eglitis RI. Comparative first-principles calculations of SrTiO3, BaTiO3, PbTiO3 and CaTiO3 (001),(011) and (111) surfaces. Ferroelectrics. 2015;483(1):53-67.
- (60) Wegmann M, Watson L, Hendry A. XPS analysis of submicrometer barium titanate powder. Journal of the American Ceramic Society. 2004;87(3):371-7.
- (61) Plimpton S. Fast parallel algorithms for short-range molecular dynamics. Journal of computational physics. 1995;117(1):1-19.
- (62) Martínez L, Andrade R, Birgin EG, Martínez JM. PACKMOL: a package for building initial configurations for molecular dynamics simulations. Journal of computational chemistry. 2009;30(13):2157-64.
- (63) Becke AD. A new mixing of Hartree–Fock and local density-functional theories. The Journal of chemical physics. 1993;98(2):1372-7.
- (64) Becke AD. Density-functional thermochemistry. IV. A new dynamical correlation functional and implications for exact-exchange mixing. The Journal of chemical physics. 1996;104(3):1040-6.
- (65) Schmidt MW, Baldridge KK, Boatz JA, Elbert ST, Gordon MS, Jensen JH, et al. J Comput Chem. 1993;14:1347-63.
- (66) Gordon MS, Schmidt MW. Advances in electronic structure theory: GAMESS a decade later. In: Dykstra CE, Frenking G, Kim KS, Scuseria GE, editors. Theory and Applications of Computational Chemistry, the first forty years. Amsterdam: Elsevier; 2005. p. 1167-89.
- (67) Barca GMJ, Bertoni C, Carrington L, Datta D, De Silva N, Deustua JE, et al. Recent developments in the general atomic and molecular electronic structure system. J Chem Phys. 2020;152:154102.
- (68) Nosé S. A molecular dynamics method for simulations in the canonical ensemble. Molecular physics. 1984;52(2):255-68.
- (69) Nosé S. A unified formulation of the constant temperature molecular dynamics methods. The Journal of chemical physics. 1984;81(1):511-9.
- (70) Evans DJ, Morriss G. Nonlinear-response theory for steady planar Couette flow. Physical Review A. 1984;30(3):1528.
- (71) Daivis PJ, Todd B. A simple, direct derivation and proof of the validity of the SLLOD equations of motion for generalized homogeneous flows. The Journal of chemical physics. 2006;124(19):194103.
- (72) Kamiya H, Fukuda Y, Suzuki Y, Tsukada M, Kakui T, Naito M. Effect of polymer dispersant structure on electrosteric interaction and dense alumina suspension behavior. Journal of the American Ceramic Society. 1999;82(12):3407-12.
- (73) Kuo MS, Chang SJ, Hsieh PH, Huang YC, Li CC. Efficient dispersants for TiO2 nanopowder in organic suspensions. Journal of the American Ceramic Society. 2016;99(2):445-51.
- (74) Kim DH, Yeo JG, Jung YG, Choi SC, Paik U. Suspension stability and consolidation behavior of ultrafine BaTiO3 particles in nonazeotropic solvent system. Materials chemistry and physics. 2003;82(1):181-7.
- (75) SHIBATA J, MURAYAMA N, LEE HH. Dispersion of Nano-sized BaTiO3 Particles in Toluene-Ethanol Media Using Phosphate Ester. Resources Processing. 2012;59(3):125-30.