UBnormal: New Benchmark for Supervised Open-Set Video Anomaly Detection
Abstract
Detecting abnormal events in video is commonly framed as a one-class classification task, where training videos contain only normal events, while test videos encompass both normal and abnormal events. In this scenario, anomaly detection is an open-set problem. However, some studies assimilate anomaly detection to action recognition. This is a closed-set scenario that fails to test the capability of systems at detecting new anomaly types. To this end, we propose UBnormal, a new supervised open-set benchmark composed of multiple virtual scenes for video anomaly detection. Unlike existing data sets, we introduce abnormal events annotated at the pixel level at training time, for the first time enabling the use of fully-supervised learning methods for abnormal event detection. To preserve the typical open-set formulation, we make sure to include disjoint sets of anomaly types in our training and test collections of videos. To our knowledge, UBnormal is the first video anomaly detection benchmark to allow a fair head-to-head comparison between one-class open-set models and supervised closed-set models, as shown in our experiments. Moreover, we provide empirical evidence showing that UBnormal can enhance the performance of a state-of-the-art anomaly detection framework on two prominent data sets, Avenue and ShanghaiTech. Our benchmark is freely available at https://github.com/lilygeorgescu/UBnormal.
1 Introduction
In spite of the growing interest in video anomaly detection [11, 12, 17, 18, 19, 23, 22, 24, 27, 32, 34, 39, 40, 41, 43, 46, 52, 54, 60, 61, 64, 66], which generated significant advances leading to impressive performance levels [17, 18, 21, 27, 32, 56, 59, 60, 64, 66, 67], the task remains very challenging. The difficulty of the task stems from two interdependent aspects: the reliance on context of anomalies, and the lack of abnormal training data. The former issue can be explained through a simple comparative example considering a truck driven on a street, which is normal, versus a truck driven in a pedestrian area, which is abnormal. The reliance on context essentially generates an unbounded set of possible anomaly types. Coupled with the difficulty of collecting sufficient data for certain anomaly types (it is not ethical to fight or hurt people just to obtain video examples), the reliance on context makes it nearly impossible to gather abnormal training data.
In the recent literature, we identified two distinct formulations to deal with the difficulty of the video anomaly detection task. On the one hand, we have the mainstream formulation, adopted in works such as [2, 9, 11, 20, 23, 25, 27, 29, 30, 33, 35, 37, 38, 41, 43, 44, 47, 48, 51, 56, 61, 62, 70, 68, 14, 69, 10, 50], treating anomaly detection as a one-class classification (or outlier detection) task. In this formulation, training videos contain only normal events, while test videos encompass both normal and abnormal events. Under this scenario, methods learn a model of normality from familiar events, labeling unfamiliar events as abnormal at inference time. While framing anomaly detection as an outlier detection task preserves the open-set characteristic of anomaly types, the models proposed under this formulation usually obtain lower performance rates, as they lack knowledge of abnormal examples. On the other hand, we have the alternative formulation, considered in works such as [42, 67, 71, 15, 57], treating anomaly detection as a weakly-supervised action recognition task, where training videos contain both normal and abnormal events, but the annotation is provided at the video level. This formulation corresponds to a closed-set evaluation scenario where training and test anomalies belong to the same action categories, failing to test the capability of systems at detecting unseen anomaly types.
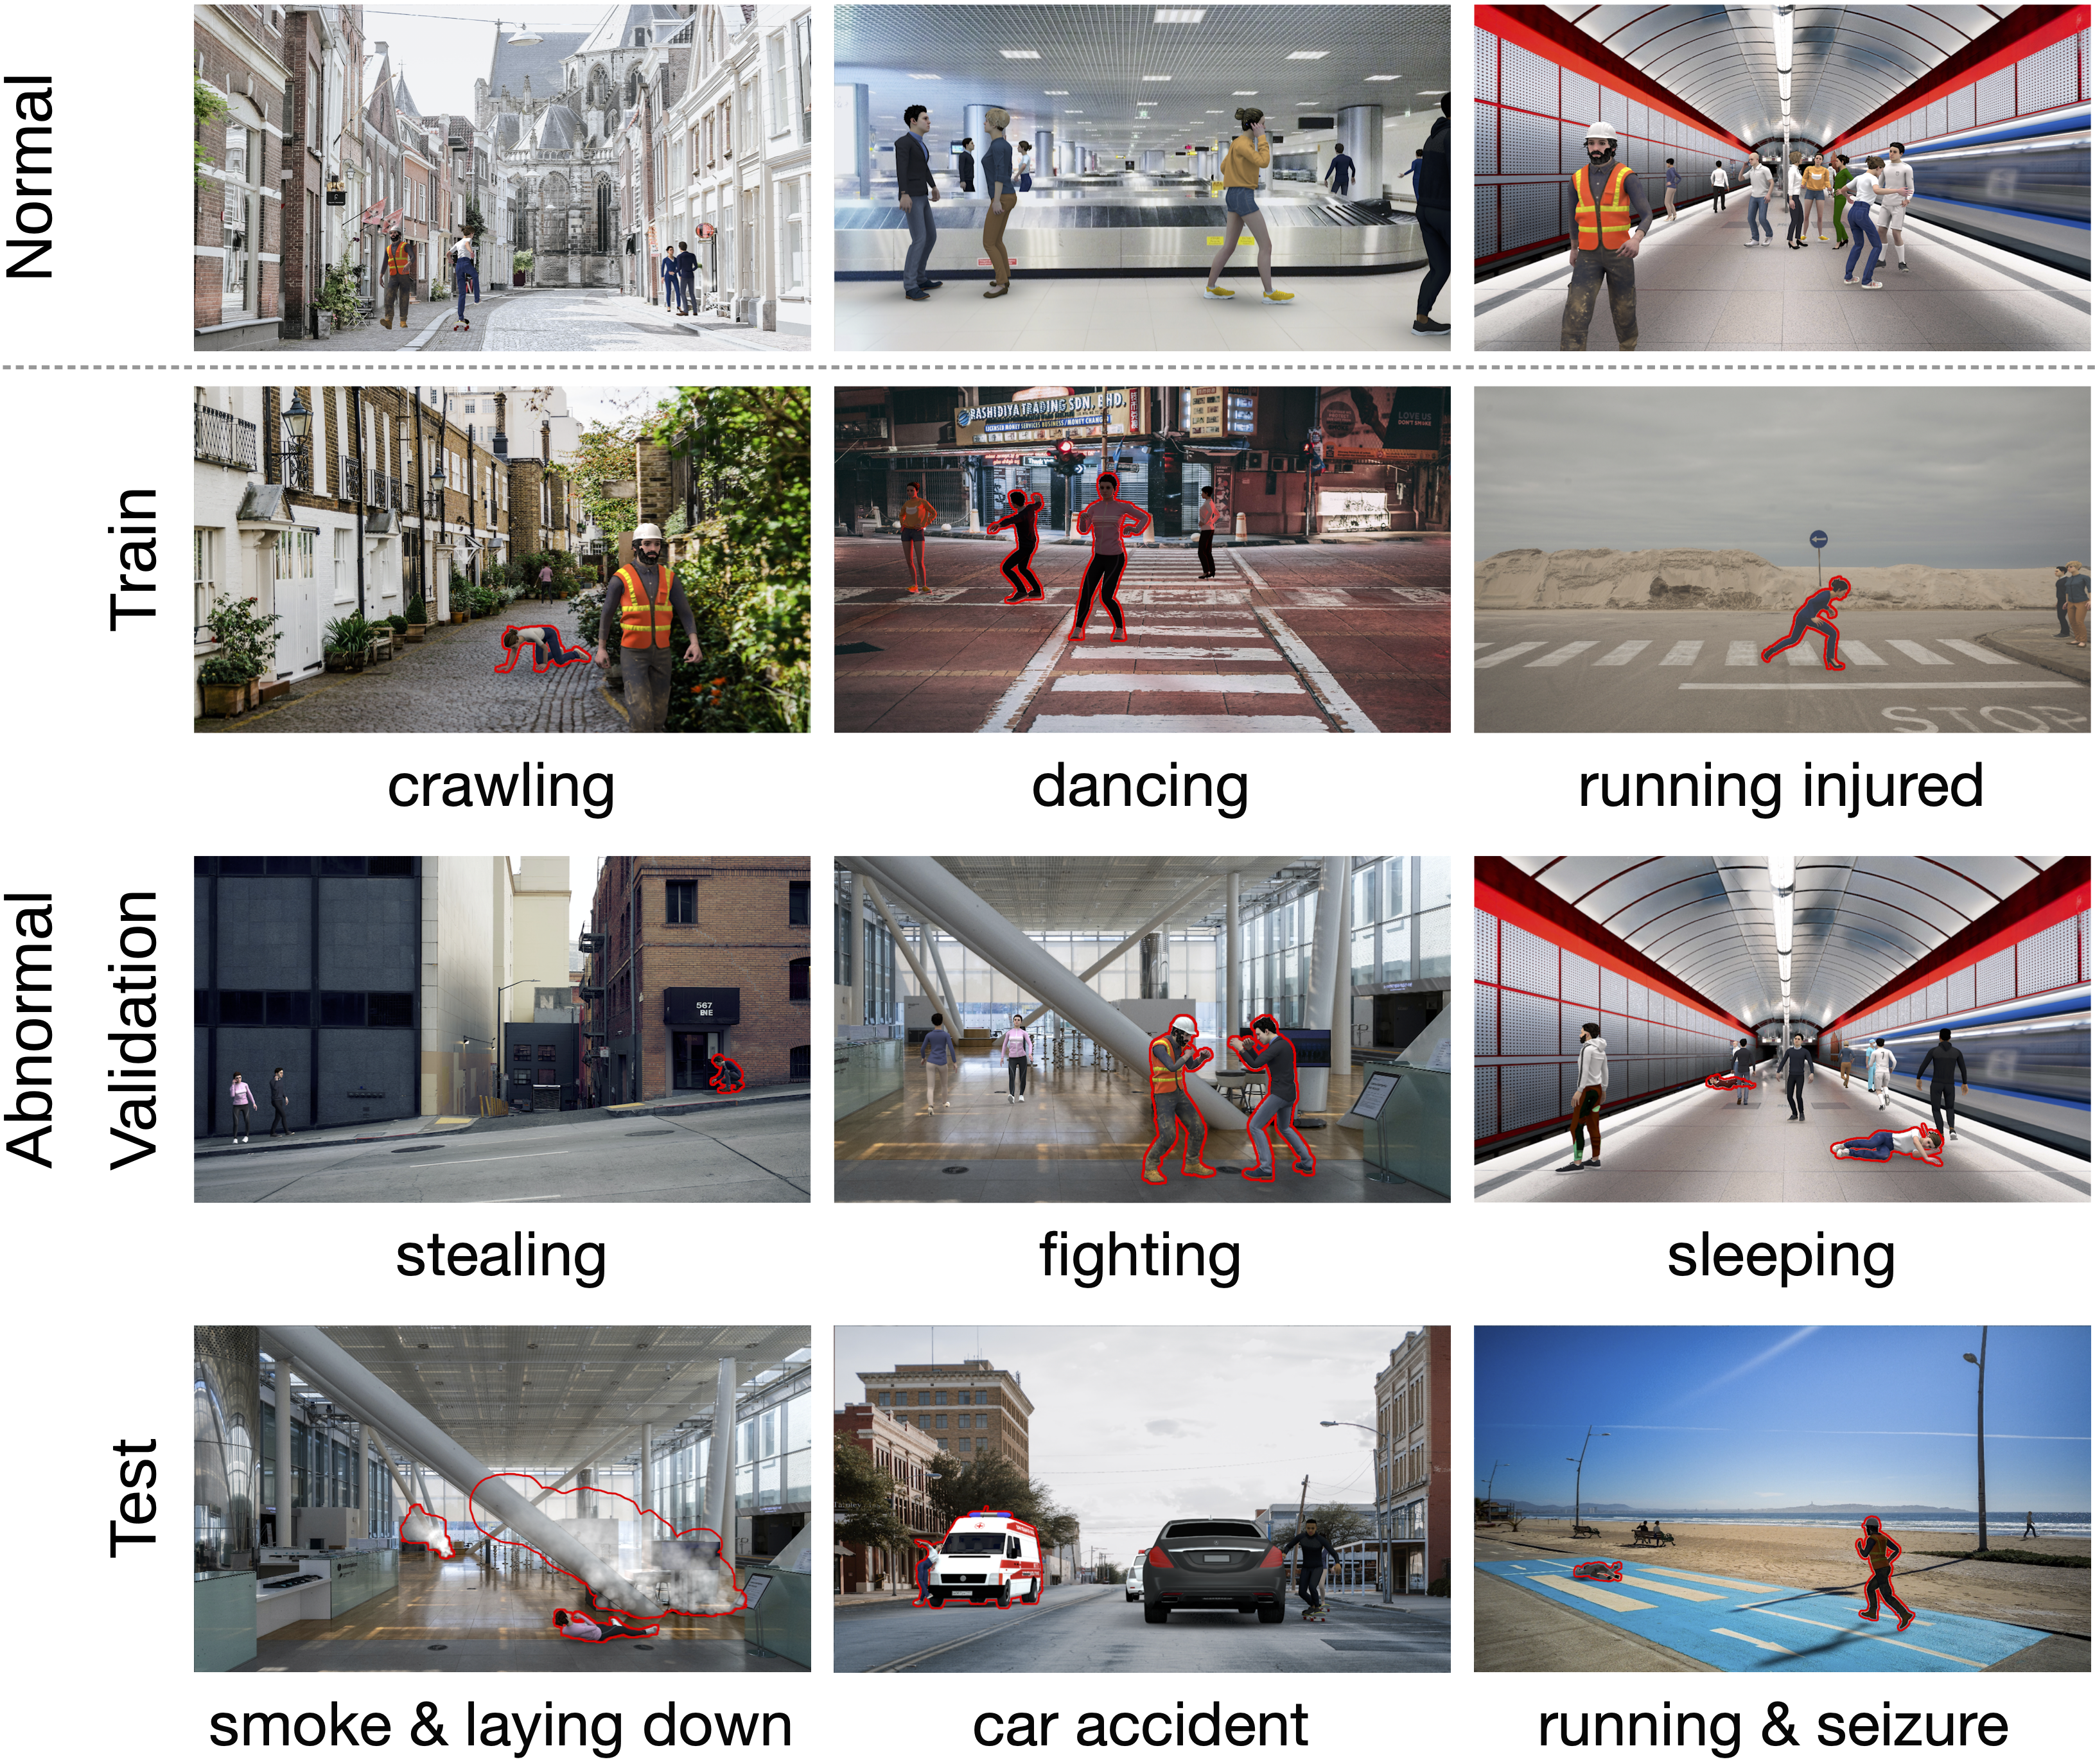
To this end, we propose a novel formulation that frames video anomaly detection as a supervised open-set classification problem. In our formulation, both normal and abnormal events are available at training time, but the anomalies that occur at inference time belong to a distinct set of anomaly types (categories). The main advantages of posing anomaly detection as a supervised open-set problem are: enabling the use of fully-supervised models due to the availability of anomalies at training time, enabling the evaluation of models under unexpected anomaly types due to the use of disjoint sets of anomaly categories at training and test time, and enabling the fair comparison between one-class open-set methods and weakly-supervised closed-set methods. As for the one-class problem formulation, an issue with the supervised open-set formulation lies in the difficulty of collecting abnormal data from the real world. To alleviate this issue, we propose UBnormal, a new benchmark comprising multiple virtual scenes for video anomaly detection. Our scenes are generated in Cinema4D using virtual animated characters and objects that are placed in real-world backgrounds, as shown in Figure 1. To the best of our knowledge, this is the first data set for supervised open-set anomaly detection in video.
Although UBnormal enables both the development and training of models in ideal conditions (with full supervision), and the evaluation of models in adverse conditions (on unknown anomaly types), its simulated scenes belong to a different data distribution than natural scenes. Therefore, it might be unclear what is the behavior of fully-supervised models on real-world scenes. To this end, we propose to overcome the distribution gap using CycleGAN [72], translating simulated objects from UBnormal to real-world benchmarks such as Avenue [33] and ShanghaiTech [35]. We then employ a state-of-the-art multi-task learning framework [17] for anomaly detection, introducing a new proxy task to discriminate between normal and abnormal samples from our data set. Our results show that UBnormal can enhance the performance of the state-of-the-art multi-task learning framework on both data sets. Interestingly, we provide empirical evidence indicating that performance gains can be achieved even without trying to close the distribution gap with CycleGAN. This shows that UBnormal can directly improve the performance of state-of-the-art models in the real-world.
In summary, our contribution is threefold:
-
•
We pose video anomaly detection as a supervised open-set task, introducing UBnormal, a new data set of virtual scenes with video frames.
- •
-
•
We conduct a data-centric study, showing that UBnormal data can bring performance gains to a recent state-of-the-art method [17] on two natural scene data sets, Avenue and ShanghaiTech.
2 Related Work
2.1 Video Anomaly Detection Methods
A large body of recent works [2, 9, 11, 20, 23, 25, 27, 29, 30, 33, 35, 37, 38, 41, 43, 44, 47, 48, 51, 61, 62, 70, 68, 14, 69, 10, 50, 36, 45, 7, 28, 63, 55, 65, 17, 18, 21, 27, 32, 56, 59, 60, 64, 66, 67, 4, 3] treats anomaly detection in video as a one-class classification (outlier detection) task, training models without having access to abnormal samples. These works can be divided into three categories corresponding to the level at which the algorithm is applied: frame, patch or object. For instance, Yu et al. [65] proposed a frame-level framework which employs the adversarial learning of past and future events to detect anomalies, instead of requiring complementary information such as optical flow or explicit abnormal samples during training. Ramachandra et al. [45] proposed a patch-level framework to localize anomalies in video by using a Siamese network to learn a metric from pairs of video patches. The learned metric is used to measure the perceptual distance between video patches from a test video and video patches from the normal training videos. Georgescu et al. [17] employed self-supervised multi-task learning at the object level to detect anomalies in video. The framework uses a total of four proxy tasks, three based on self-supervision and one based on knowledge distillation. The final anomaly score for each object detected in a frame is computed by averaging the anomaly scores predicted for each proxy task.
| frames | ||||||||||
| Data set | total | training | validation | test | normal | abnormal | anomalies | scenes | anomaly | open |
| types | set | |||||||||
| CUHK Avenue[33] | - | ✓ | ||||||||
| ShanghaiTech [35] | - | ✓ | ||||||||
| Street Scene [43] | - | ✓ | ||||||||
| Subway Entrance [1] | - | ✓ | ||||||||
| Subway Exit [1] | - | ✓ | ||||||||
| UCF-Crime [53] | - | NA | NA | NA | NA | ✗ | ||||
| UCSD Ped1 [37] | - | ✓ | ||||||||
| UCSD Ped2 [37] | - | ✓ | ||||||||
| UMN [38] | - | ✓ | ||||||||
| UBnormal (ours) | ✓ | |||||||||
Another body of works [42, 53, 67, 71, 15, 57] treats anomaly detection as a weakly-supervised action recognition task. In this line of work, an algorithm is trained on both normal and abnormal videos, but the abnormal videos are annotated at the video level. The anomalies occurring at test time belong to the same action categories as the training anomalies, leading to an easier closed-set problem. Sultani et al. [53] proposed an algorithm based on multiple instance learning, building a deep anomaly ranking model that predicts high anomaly scores for abnormal video segments. To increase the anomaly detection performance, Feng et al. [15] proposed a multiple instance self-training framework consisting of a multiple instance pseudo-label generator and a self-guided attention encoder in order to focus on the anomalous regions in each frame. We notice that weakly-supervised anomaly detection frameworks [42, 67, 71, 15, 57] are often evaluated on the ShanghaiTech or UCSD Ped data sets, but there are no official splits for weakly-supervised training on these data sets. Due to the unavailability of official splits, researchers tend to use their own data splits, leading to unfair comparisons between methods. To this end, we emphasize that the comparison between weakly-supervised and outlier detection (one-class) frameworks is unfair. This is because the former methods gain knowledge from the abnormal training data which is not available for the latter methods. If the anomaly types in training and test would be disjoint, the comparison could become more fair.
The existing video anomaly detection methods either use normal training data only [2, 9, 11, 20, 23, 25, 27, 29, 30, 33, 35, 37, 38, 41, 43, 44, 47, 48, 51, 61, 62, 70, 68, 14, 69, 10, 50, 36, 45, 7, 28, 63, 55, 65, 17, 18, 21, 27, 32, 56, 59, 60, 64, 66, 67, 3, 4], or abnormal training data with video-level annotations [42, 67, 71, 15, 42, 57]. To our knowledge, there is no off-the-shelf method that can be applied on UBnormal and take full advantage of its supervised open-set nature. To this end, we introduce minimal changes to the considered baselines to leverage the availability of abnormal training data.
2.2 Video Anomaly Detection Data Sets
To date, there are quite a few data sets available for anomaly detection in video. We report several statistics about the most utilized data sets in Table 1. While there are several data sets that preserve the open-set characteristic of anomaly detection [33, 35, 43, 1, 37, 38], to the best of our knowledge, there is only one data set for closed-set anomaly detection, namely UCF-Crime [53].
The open-set benchmarks can be separated into two categories according to the number of scenes. The CUHK Avenue [33], Street Scene [43], Subway Entrance [1], Subway Exit [1] and UCSD Ped [37] data sets form the category of single-scene benchmarks [46], enabling the successful use of frame-level methods that learn very specific normality models (adapted to a particular scene). In contrast, ShanghaiTech [35] and UMN [38] belong to the category of multiple-scene benchmarks, which tests the capability of methods to build more generic normality models, that perform well on several scenes. Street Scene [43] is the largest single-scene data set, containing frames. Despite being the largest data set for the single-scene scenario, it is not representative of real-world models that are expected to run across multiple scenes (as long as the normal behavior is similar across scenes). With frames, the largest multiple-scene data set for open-set anomaly detection is ShanghaiTech [35]. Despite being the largest in its scenario, it has a small number of anomalies () belonging to only anomaly types.
Most of the existing data sets contain anomalies related to human-interaction [33, 1, 37, 38] or vehicles in pedestrian areas, but the anomalies are usually staged and lack variety. For example, in UCSD Ped2 [37], each anomalous event is related to bicycles, skateboards or cars in a pedestrian area. Similarly, Subway [1] contains only anomalies related to people, such as people walking in the wrong direction or people jumping over the turnstiles. The size of Subway is quite large, with frames for the Entrance video and frames for the Exit video, but the number of anomaly types is very small, with only anomaly types for Entrance and anomaly types for Exit, respectively.
The closed-set UCF-Crime benchmark introduced by Sultani et al. [53] contains M frames from videos retrieved from YouTube and LiveLeak, using text queries. The data set contains anomaly categories that can be found in both training and test videos. UCF-Crime does not follow the open-set paradigm for anomaly detection in video, where the actions from the training set are different for those in the test set. Moreover, the data set does not contain pixel-level anomaly annotations.
To the best of our knowledge, we are the first to propose a benchmark for supervised open-set anomaly detection. We consider several factors that justify the need for a novel anomaly detection benchmark. First and foremost, unlike existing data sets, our benchmark contains anomalies with pixel-level annotations in the training set. The anomaly types from the training set are different from the anomaly types seen in the test set, conforming to the open-set constraint. Second, none of the existing data sets have a validation set, a mandatory requirement for many machine learning algorithms relying on hyperparameter tuning. This leaves two options, either tune the model on the test data, inherently overfitting the model to the test set, or refrain from hyperparameter tuning, likely leading to suboptimal results. In contrast to existing benchmarks, we are the first to provide a validation set. It contains anomalies belonging to a different set of action categories than the set of action categories available at test time. This ensures the possibility to perform model tuning without overfitting to the test set. Third, some of the existing data sets, e.g. UCSD Ped [37] and UMN [38], are already saturated (the performance surpasses in terms of the frame-level AUC), while the performance on other benchmarks, e.g. Avenue [33] and Subway [1], surpasses in terms of the frame-level AUC. For example, the results reported in [18] on Avenue (a micro AUC of ) and UCSD Ped2 (a micro AUC of ) are significantly higher compared to the results obtained by the same method on the UBnormal data set (a micro AUC of ). In general, our experiments show that UBnormal is significantly more challenging, likely due to the higher variation of anomaly types and scenes. Considering all these aspects, we believe that UBnormal will likely contribute towards the development of future anomaly detection models.
2.3 Open-Set Action Recognition
With respect to the definition of open-set video recognition of Geng et al. [16], in our setting, the normal classes are known known classes (KKC) and the abnormal classes used at test time are unknown unknown classes (UUC). We consider the abnormal actions used at training time as known unknown classes (KUC). However, KUC samples will not appear at test time. To this end, our setting can be considered as supervised open-set, which is distinct from the classical open-set setting. Moreover, we underline that the anomaly detection task is distinct from action recognition, i.e. abnormal actions need to be detected and localized in long videos. One video may contain multiple normal and abnormal events happening at the same time. Hence, a pure action recognition approach is not likely to provide optimal results in anomaly detection. Hence, we consider works on open-set action recognition [5, 8] as very distantly related.
3 UBnormal Benchmark
Scenes. The UBnormal benchmark is generated using the Cinema4D software, which allows us to create scenes using 2D background images and 3D animations. We select a total of natural images that represent street scenes, train stations, office rooms, among others. In the selected background images, we make sure to eliminate people, cars or other objects that should belong to the foreground. From each natural image, we create a virtual 3D scene and generate (on average) videos per scene. For each scene, we generate both normal and abnormal videos. The proportion of normal versus abnormal videos in the entire UBnormal data set is close to .
Action categories. We consider the following events as normal, for all our video scenes: walking, talking on the phone, walking while texting, standing, sitting, yelling and talking with others. In addition, we introduce a total of abnormal event types, as follows: running, falling, fighting, sleeping, crawling, having a seizure, laying down, dancing, stealing, rotating 360 degrees, shuffling, walking injured, walking drunk, stumbling walk, people and car accident, car crash, running injured, fire, smoke, jaywalking, driving outside lane and jumping. We organize the anomalous event types such that those included in the test set are different from those found in the training and validation sets. Hence, the test set includes the following anomalies: running, having a seizure, laying down, shuffling, walking drunk, people and car accident, car crash, jumping, fire, smoke, jaywalking and driving outside lane. The following anomalies are included in the training set: falling, dancing, walking injured, running injured, crawling and stumbling walk. The rest of the anomalies are added to the validation set.
Variety. In order to increase the variety of our data set, we include multiple object categories, such as people, cars, skateboards, bicycles and motorcycles. Unlike other data sets (CUHK Avenue[33], ShanghaiTech [35], UCSD Ped [37]), these objects can perform both normal and abnormal actions, thus being present in both normal and abnormal videos. Hence, simply labeling an object as abnormal because it belongs to an unseen category is no longer possible. To further increase the diversity of the data set, we include foggy scenes, night scenes, and fire and smoke as abnormal events. In existing data sets, a single person or a small group of people perform most of the abnormal actions. We can take the person with blue pants that is running or throwing a backpack or some papers in CUHK Avenue [33] as example, or the group of guys that are running and fighting in various scenes from ShanghaiTech [35]. Different from such data sets, the anomalous events in the UBnormal data set are performed by various characters. We employ different characters to animate the videos. We also change the colors of their clothes or their hair color, increasing the diversity of the animated characters included in our benchmark. We provide several figures showcasing the variety of scenes, characters and actions of UBnormal in the supplementary.
Data generation and annotation. The anomalies in the UBnormal data set are annotated at the pixel level. For each synthetic object (normal or abnormal) in the data set, we provide the segmentation mask and the object label (person, car, bicycle, motorcycle or skateboard). In the process of simulating the events and generating the benchmark, we involved a team of six people for a period of three months. We generate all videos at FPS with the minimum height of a frame set to pixels. It takes about seconds to render one frame with the Cinema4D software, taking a total of hours ( days) to render the entire data set. After generating the videos, four of our team members checked each generated video for incorrect occlusions, gravity-related issues or other visual inconsistencies, ensuring the high quality of the generated data set.
4 Methods
One-class open-set model. As the first baseline for the UBnormal data set, we employ the state-of-the-art background-agnostic framework introduced in [18]. This is an object-level method which treats anomaly detection as a one-class classification task. The framework is composed of three auto-encoders and three classifiers. To increase the performance of the anomaly detection method, Georgescu et al. [18] proposed an adversarial learning scheme for the auto-encoders. To overcome the lack of abnormal samples during training, they created a scene-agnostic set of pseudo-anomalies. The pseudo-abnormal samples are used in the adversarial training process as adversarial examples and, in the training of the binary classifiers, as abnormal samples.
In our first experiment, we employ the framework [18] without any modification as a baseline for our benchmark. Then, we add the abnormal samples from our training data set to the pool of pseudo-abnormal samples.
Supervised closed-set model. As another baseline, we consider the supervised closed-set model proposed by Sultani et al. [53]. In this framework[53], the normal and abnormal videos are represented as bags, and the video segments are instances in multiple instance learning. Sultani et al. [53] represented each video using features extracted by a pre-trained C3D [58] model. Using the video feature representation, they trained a feed-forward neural network such that the maximum score of the instances from the anomalous bag is higher than the maximum score of the instances from the normal bag. They also incorporated sparsity and smoothness constraints in the loss function to further boost the performance of the framework.
Action recognition framework. The third baseline for our benchmark is an action recognition model. We choose the state-of-the-art model proposed by Bertasius et al. [6]. The TimeSformer [6] architecture adjusts the standard transformer architecture to the video domain, by learning spatio-temporal features from sequences of frame patches. TimeSformer [6] uses divided attention, i.e. the spatial and temporal attention maps are learned separately. We train the TimeSformer model to distinguish between normal and abnormal actions. The model predicts the probability of a sequence of frames of being abnormal.
Self-supervised multi-task model. We employ the state-of-the-art multi-task learning framework of Georgescu et al. [17] to show that UBnormal can be used to boost performance on two prominent anomaly detection data sets, namely CUHK Avenue [33] and ShanghaiTech [35]. We hereby state that the main goal for conducting experiments with the state-of-the-art method of Georgescu et al. [17] is to determine if data from the UBnormal data set can help to increase performance on two real-world data sets, regardless of how our data is integrated into the training sets of the respective real-world benchmarks. While we expect higher performance gains after performing domain adaption with CycleGAN (as detailed below), we emphasize that these gains would not be possible without the examples coming from our data set.
The object-level method of Georgescu et al. [17] is based on learning a single 3D convolutional neural network (CNN) on four proxy tasks, namely the arrow of time, motion irregularity, middle box prediction and model distillation. Further, we integrate the fifth proxy task () to discriminate between normal and abnormal objects from the UBnormal data set. Here, we consider two options: train the model directly on UBnormal examples, and pass the objects seen only at training time through CycleGAN [72], before training on the fifth proxy task. During inference, we expect the normal samples from the test set to be classified as normal, and the abnormal samples to be classified as abnormal. For each object, we create an object-centric temporal sequence by cropping the object bounding box from the frames , following [17]. The normal object-centric sequences are labeled with class , while the abnormal sequences are labeled with class .
Let be the shared 3D CNN and be our abnormality head. Let be a normal or abnormal object-centric sequence of size . We employ the cross-entropy loss to train the abnormality head:
| (1) |
where and is the one-hot encoding of the ground-truth label for .
5 Experiments
5.1 Setup and Implementation Details
Data sets. Aside from reporting results on UBnormal, we evaluate how helpful the data from UBnormal is for other real-world anomaly detection benchmarks. To this end, we consider the popular CHUK Avenue [33] and ShanghaiTech [35] data sets. We provide more details about these benchmarks in Table 1.
Evaluation measures. As evaluation metrics, we consider the widely-used area under the curve (AUC), computed with respect to the ground-truth frame-level annotations, as well as the region-based detection criterion (RBDC) and track-based detection criterion (TBDC) introduced by Ramachandra et al. [43]. For the frame-level AUC, we consider both micro and macro versions, following [18].
Learning and parameter tuning. In order to train the one-class open-set model and the supervised closed-set framework on UBnormal, we use the official code provided by Georgescu et al. [18] and Sultani et al. [53], respectively. We train the models following the instructions given by the authors, without changing any of the hyperparameters.
To train the TimeSformer model on UBnormal, we rely on the official implementation released by Bertasius et al. [6]. We use the default version of TimeSformer, which processes frames, each having a spatial resolution of pixels. In order to adapt the TimeSformer model to abnormal event detection, we change the last fully-connected layer to distinguish between two classes, normal versus abnormal. We start from the pre-trained TimeSformer and fine-tune it for epochs on the UBnormal benchmark, with the learning rate set to . We perform experiments with the default video sample rate (), as well as two additional sample rates ( and ) that seemed more suitable for UBnormal, at least from our perspective.
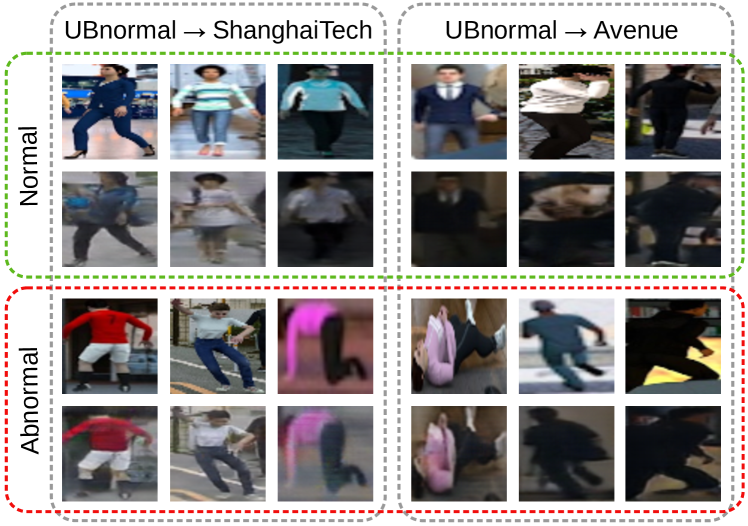
For the experiments on Avenue and ShanghaiTech, we use the official code and the hyperparameters reported by Georgescu et al. [17] to train the self-supervised multi-task model. To adapt UBnormal examples to Avenue and ShanghaiTech, respectively, we train CycleGAN [72] using the official code with the default hyperparameters. We apply CycleGAN at the object level. In order to extract the object bounding boxes from the UBnormal training set, we rely on the ground-truth segmentation masks. To detect the objects in Avenue and ShanghaiTech, we apply the pre-trained YOLOv3 [49] object detector, following [17]. We train the CycleGAN model only on the training data from UBnormal and Avenue or ShanghaiTech, respectively. We optimize the CycleGAN model for epochs on each of the two data set pairs. In Figure 2, we present a few samples of the translated objects, before and after applying CycleGAN.
| Validation | Test | |||||||
| Method | AUC | RBDC | TBDC | AUC | RBDC | TBDC | ||
| Micro | Macro | Micro | Macro | |||||
| Georgescu et al. [18] | ||||||||
| Georgescu et al. [18] + UBnormal anomalies | ||||||||
| Sultani et al. [53] (pre-trained) | ||||||||
| Sultani et al. [53] (fine-tuned) | ||||||||
| Bertasius et al. [6] ( sample rate, fine-tuned) | ||||||||
| Bertasius et al. [6] ( sample rate, fine-tuned) | ||||||||
| Bertasius et al. [6] ( sample rate, fine-tuned) | ||||||||
5.2 Anomaly Detection Results
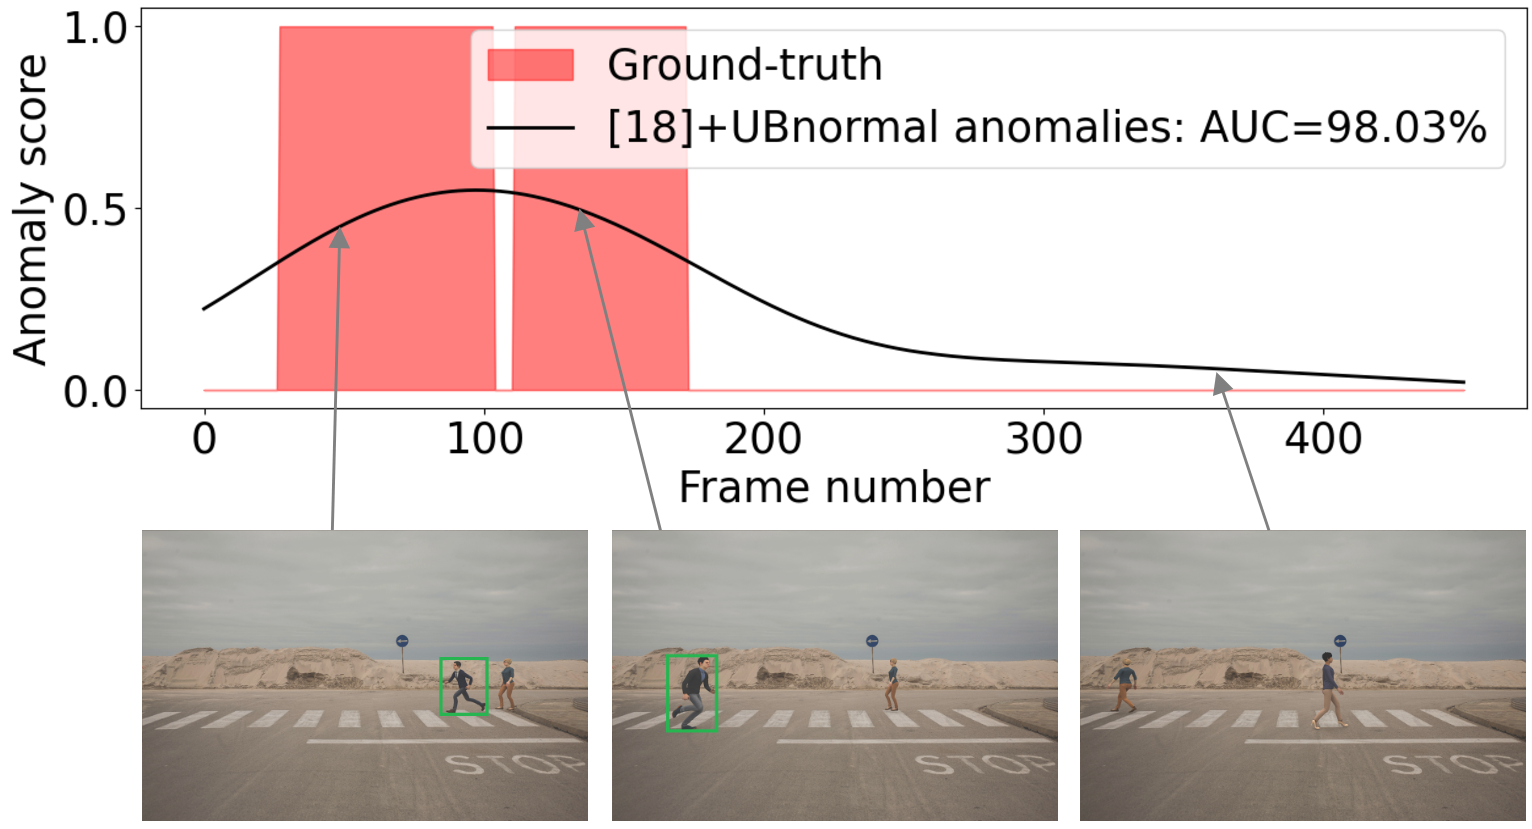
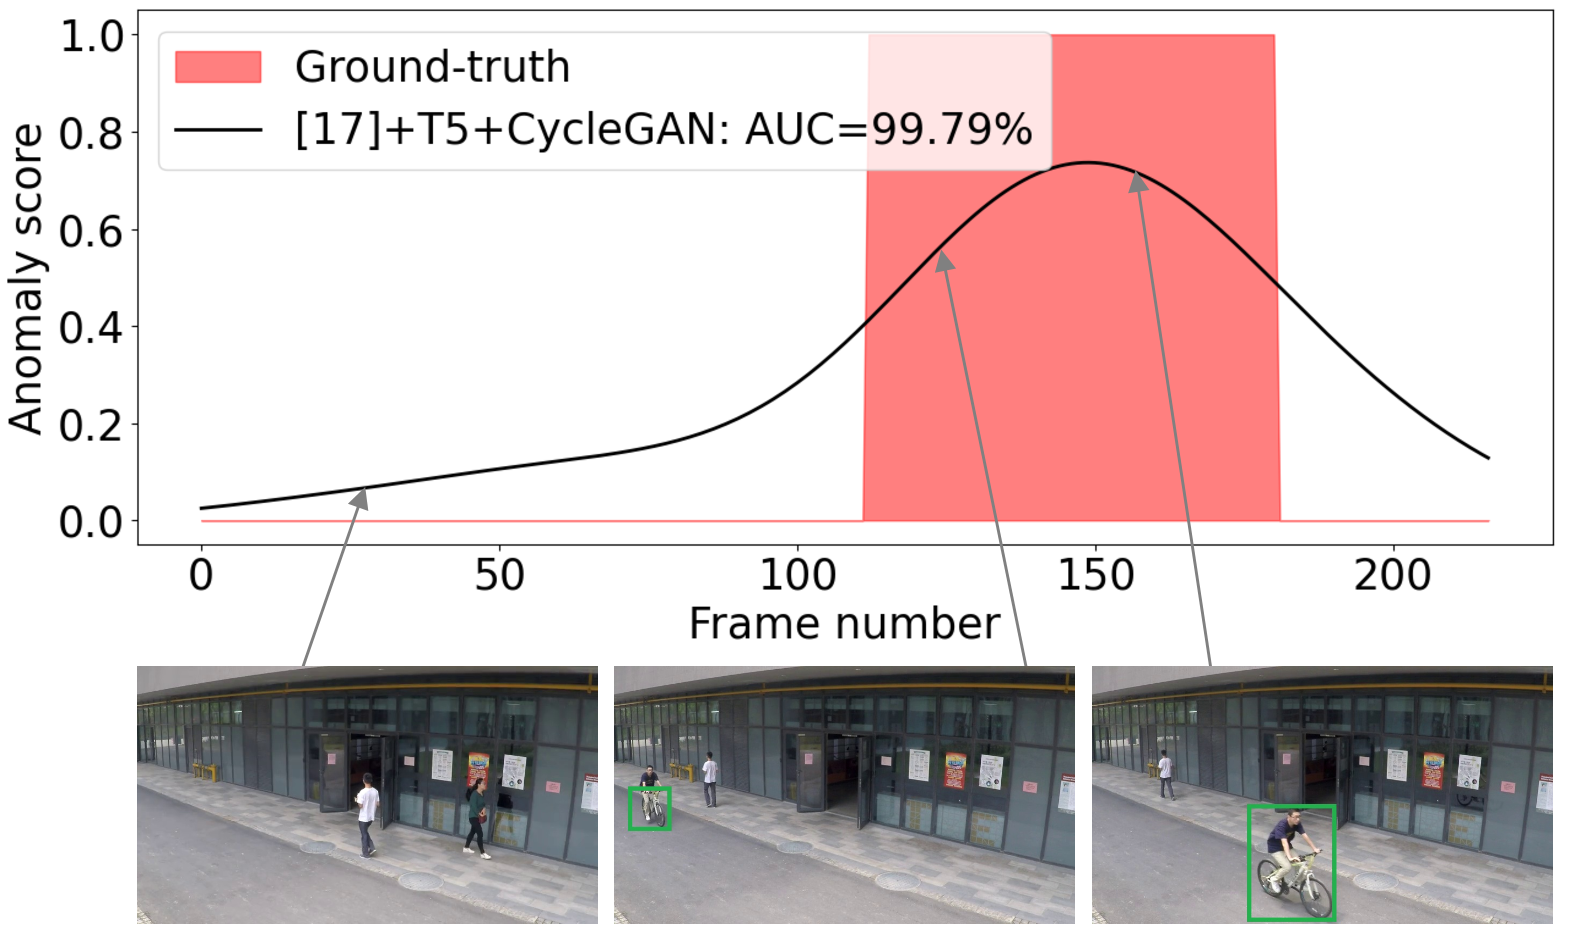
UBnormal. In Table 2, we report the results obtained by the baselines [18, 53, 6] on the validation and test sets of our benchmark. The method of Georgescu et al. [18] obtains a performance of in terms of the micro-averaged frame-level AUC on the validation set, while scoring on the test set. When we add the abnormal samples from our training data set to the pool of pseudo-abnormal samples, we observe performance gains for all four metrics. The framework of Georgescu et al. [18] is the only baseline method that performs anomaly localization, thus obtaining significantly higher RBDC and TBDC scores than the other two approaches. Nonetheless, we report the RBDC and TBDC scores for all three baselines for completeness, but we acknowledge that two of the methods [53, 6] are only suitable for anomaly detection. Hence, in Figure 3, we present the frame-level anomaly scores and a set of anomaly localization examples provided by the framework of Georgescu et al. [18] for a test video from UBnormal. The illustrated anomalies represent people running. More qualitative results are shown in the annotated videos uploaded at https://github.com/lilygeorgescu/UBnormal.
When employing the pre-trained network of Sultani et al. [53], we obtain a micro-averaged frame-level AUC of on the test set. Further fine-tuning the network on the UBnormal data set increases the micro-averaged frame-level AUC to on the test set. The TimeSformer model [6] attains the highest micro-averaged frame-level AUC on both validation and test sets. Using the default video sample rate of , we obtain a micro-averaged frame-level AUC of on the test set. As we thought that the video sample rate of was too high for anomaly detection, we also tried smaller sample rates (, ), without prevail. Indeed, the empirical results show that the video sample rate of is optimal for TimeSformer.
In summary, we find that the TimeSformer model [6] is the method of choice for anomaly detection on UBnormal, while the framework of Georgescu et al. [18] remains the best choice when it comes to anomaly localization.
| Year | Method | Avenue | ShanghaiTech | ||
|---|---|---|---|---|---|
| AUC | AUC | ||||
| Micro | Macro | Micro | Macro | ||
| 2018 | Lee et al. [26] | - | - | - | |
| Liu et al. [30] | |||||
| Liu et al. [31] | - | - | - | ||
| Sultani et al. [53] | - | - | - | ||
| 2019 | Gong et al. [19] | - | - | ||
| Ionescu et al. [21] | |||||
| Ionescu et al. [23] | - | - | - | ||
| Lee et al. [27] | - | - | |||
| Nguyen et al. [39] | - | - | - | ||
| Vu et al. [59] | - | - | - | ||
| Wu et al. [61] | - | - | - | ||
| 2020 | Dong et al. [11] | - | - | ||
| Doshi et al. [12, 13] | - | - | |||
| Ji et al. [24] | - | - | - | ||
| Lu et al. [34] | - | - | |||
| Park et al. [41] | - | - | |||
| Ramachandra et al. [43] | - | - | - | ||
| Ramachandra et al. [44] | - | - | - | ||
| Sun et al. [54] | - | - | |||
| Tang et al. [56] | - | - | |||
| Wang et al. [60] | - | - | |||
| Yu et al. [64] | - | - | |||
| 2021 | Astrid et al. [3] | - | - | ||
| Astrid et al. [4] | - | - | |||
| Chang et al. [7] | - | - | |||
| Georgescu et al. [18] | |||||
| Madan et al. [36] | - | - | |||
| Li et al. [28] | - | - | |||
| Liu et al. [32] | - | - | |||
| Szymanowicz et al. [55] | - | - | |||
| Yang et al. [63] | - | - | |||
| Yu et al. [65] | - | - | - | ||
| [17] | |||||
| [17] + (ours) | |||||
| [17] + + CycleGAN (ours) | |||||
| Method | Avenue | ShanghaiTech | ||
|---|---|---|---|---|
| RBDC | TBDC | RBDC | TBDC | |
| Liu et al. [30] | ||||
| Ionescu et al. [21] | ||||
| Ramachandra et al. [43] | - | - | ||
| Ramachandra et al. [44] | - | - | ||
| Georgescu et al. [18] | ||||
| [17] | ||||
| [17] + (ours) | ||||
| [17] + + CycleGAN (ours) | ||||
Avenue. We report the results obtained on the CUHK Avenue[33] data set in Tables 3 and 4. We compare the approach based on UBnormal samples with the following state-of-the-art methods [26, 30, 31, 53, 19, 21, 23, 27, 39, 59, 61, 11, 12, 13, 24, 34, 41, 43, 44, 54, 56, 60, 3, 4, 7, 18, 36, 28, 32, 55, 63, 65]. Without closing the distribution gap between UBnormal and CUHK Avenue[33] via CycleGAN, we still manage to obtain an improvement of in terms of the micro-averaged AUC and in terms of the macro-averaged AUC compared to the results reported by Georgescu et al. [17] at the object level. Upon passing the objects through CycleGAN, we obtain the state-of-the-art results of and in terms of micro-averaged and macro-averaged frame-level AUC, surpassing the original method [17] by at least for all four metrics.
In Figure 4, we present the frame-level anomaly scores and some examples of anomaly localization for test video from Avenue. We observe that the approach based on five tasks can precisely localize and detect the two anomalies.
ShanghaiTech. In Tables 3 and 4, we also report the results obtained on the ShanghaiTech [35] data set, comparing the approach based on UBnormal samples with other state-of-the-art methods [30, 19, 53, 21, 27, 11, 12, 13, 34, 41, 43, 44, 54, 56, 60, 3, 4, 7, 18, 36, 28, 32, 55, 63, 65]. The results obtained before applying the CycleGAN model surpass the original object-level method of Georgescu et al. [17] by at least for all four metrics. After processing the UBnormal objects with CycleGAN, we obtain the state-of-the-art results of and in terms of the micro-averaged and macro-averaged frame-level AUC measures. We also surpass the object-level baseline by and in terms of RBDC and TBDC, respectively. Regardless of how UBnormal data is integrated into the model (with or without domain adaptation), it is the data itself that has the merit of increasing performance.
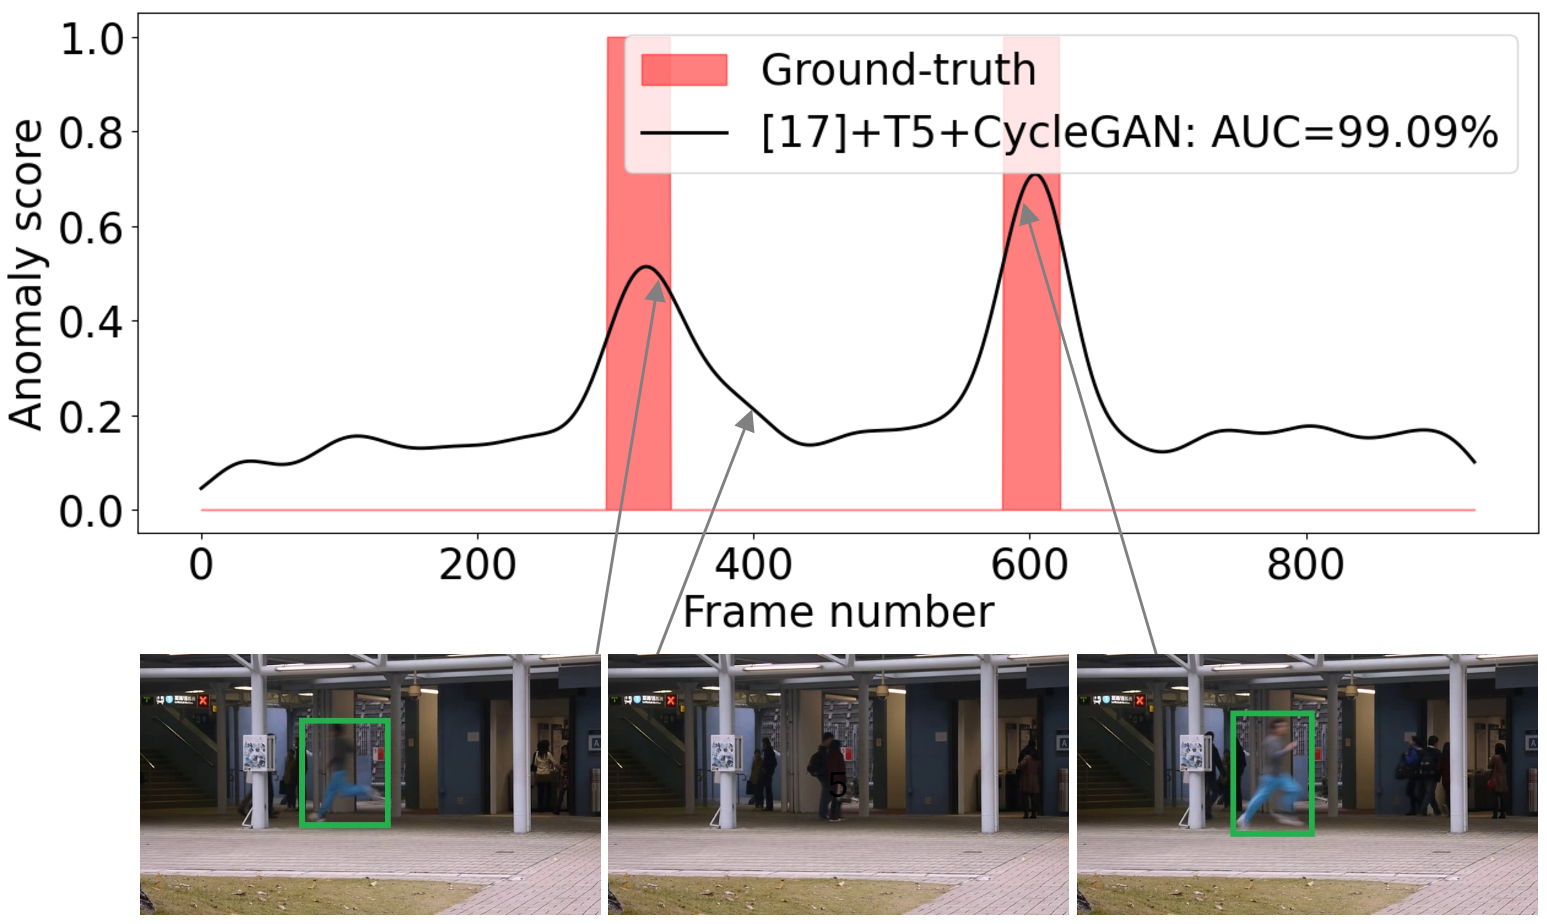
In Figure 5, we present the frame-level anomaly scores and an example of anomaly localization for video from ShanghaiTech. We observe that the approach based on five tasks can accurately localize and detect the anomaly.
6 Conclusion
In this work, we introduced UBnormal, a novel benchmark for video anomaly detection. To the best of our knowledge, this is the first and only benchmark for supervised open-set anomaly detection. Perhaps the only limitation of UBnormal is that it is composed of virtual characters and simulated actions. However, we showed several important benefits that justify the importance of UBnormal: it enables the fair and head-to-head comparison of open-set and closed-set models, and it can alleviate the lack of training anomalies in real-world data sets, bringing significant improvements over the current state-of-the-art models.
The results reported on UBnormal with three state-of-the-art models [18, 53, 6] indicate that our benchmark is very challenging. Nonetheless, we consider that the chosen baselines are strong competitors for future works trying to further improve performance on our benchmark.
In future work, we aim to test the benefit of augmenting other video anomaly detection data sets. Perhaps one of the options that seem more appealing is UCF-Crime [53]. However, given that the abnormal classes in UCF-Crime are available at both training and test time, i.e. the task is closed, we believe that adding UBnormal data will likely not bring very high performance gains.
Acknowledgments
The research leading to these results has received funding from the EEA Grants 2014-2021, under Project contract no. EEA-RO-NO-2018-0496. This article has also benefited from the support of the Romanian Young Academy, which is funded by Stiftung Mercator and the Alexander von Humboldt Foundation for the period 2020-2022.
References
- [1] Amit Adam, Ehud Rivlin, Ilan Shimshoni, and Daviv Reinitz. Robust Real-Time Unusual Event Detection Using Multiple Fixed-Location Monitors. IEEE Transactions on Pattern Analysis and Machine Intelligence, 30(3):555–560, 2008.
- [2] Borislav Antic and Bjorn Ommer. Video parsing for abnormality detection. In Proceedings of ICCV, pages 2415–2422, 2011.
- [3] Marcella Astrid, Muhammad Zaigham Zaheer, Jae-Yeong Lee, and Seung-Ik Lee. Learning memory-guided normality for anomaly detection. In BMVC, 2021.
- [4] Marcella Astrid, Muhammad Zaigham Zaheer, and Seung-Ik Lee. Synthetic Temporal Anomaly Guided End-to-End Video Anomaly Detection. In Proceedings of ICCVW, pages 207–214, 2021.
- [5] Wentao Bao, Qi Yu, and Yu Kong. Evidential deep learning for open set action recognition. In Proceedings of ICCV, pages 13349–13358, 2021.
- [6] Gedas Bertasius, Heng Wang, and Lorenzo Torresani. Is Space-Time Attention All You Need for Video Understanding? In Proceedings of ICML, 2021.
- [7] Yunpeng Chang, Zhigang Tu, Wei Xie, Bin Luo, Shifu Zhang, Haigang Sui, and Junsong Yuan. Video anomaly detection with spatio-temporal dissociation. Pattern Recognition, 122:108213, 2022.
- [8] Guangyao Chen, Peixi Peng, Xiangqian Wang, and Yonghong Tian. Adversarial Reciprocal Points Learning for Open Set Recognition. IEEE Transactions on Pattern Analysis and Machine Intelligence, 2021.
- [9] Kai-Wen Cheng, Yie-Tarng Chen, and Wen-Hsien Fang. Video anomaly detection and localization using hierarchical feature representation and Gaussian process regression. In Proceedings of CVPR, pages 2909–2917, 2015.
- [10] Y. Cong, J. Yuan, and J. Liu. Sparse reconstruction cost for abnormal event detection. In Proceedings of CVPR, pages 3449–3456, 2011.
- [11] Fei Dong, Yu Zhang, and Xiushan Nie. Dual Discriminator Generative Adversarial Network for Video Anomaly Detection. IEEE Access, 8:88170–88176, 2020.
- [12] Keval Doshi and Yasin Yilmaz. Any-Shot Sequential Anomaly Detection in Surveillance Videos. In Proceedings of CVPRW, pages 934–935, 2020.
- [13] Keval Doshi and Yasin Yilmaz. Continual Learning for Anomaly Detection in Surveillance Videos. In Proceedings of CVPRW, pages 254–255, 2020.
- [14] Jayanta K. Dutta and Bonny Banerjee. Online Detection of Abnormal Events Using Incremental Coding Length. In Proceedings of AAAI, pages 3755–3761, 2015.
- [15] Jia-Chang Feng, Fa-Ting Hong, and Wei-Shi Zheng. MIST: Multiple Instance Self-Training Framework for Video Anomaly Detection. In Proceedings of CVPR, pages 14009–14018, 2021.
- [16] Chuanxing Geng, Sheng-jun Huang, and Songcan Chen. Recent advances in open set recognition: A survey. IEEE Transactions on Pattern Analysis and Machine Intelligence, 43(10):3614–3631, 2020.
- [17] Mariana-Iuliana Georgescu, Antonio Barbalau, Radu Tudor Ionescu, Fahad Shahbaz Khan, Marius Popescu, and Mubarak Shah. Anomaly Detection in Video via Self-Supervised and Multi-Task Learning. In Proceedings of CVPR, pages 12742–12752, 2021.
- [18] Mariana Iuliana Georgescu, Radu Ionescu, Fahad Shahbaz Khan, Marius Popescu, and Mubarak Shah. A Background-Agnostic Framework with Adversarial Training for Abnormal Event Detection in Video. IEEE Transactions on Pattern Analysis and Machine Intelligence, 2021.
- [19] Dong Gong, Lingqiao Liu, Vuong Le, Budhaditya Saha, Moussa Reda Mansour, Svetha Venkatesh, and Anton Van Den Hengel. Memorizing Normality to Detect Anomaly: Memory-Augmented Deep Autoencoder for Unsupervised Anomaly Detection. In Proceedings of ICCV, pages 1705–1714, 2019.
- [20] Mahmudul Hasan, Jonghyun Choi, Jan Neumann, Amit K. Roy-Chowdhury, and Larry S. Davis. Learning temporal regularity in video sequences. In Proceedings of CVPR, pages 733–742, 2016.
- [21] Radu Tudor Ionescu, Fahad Shahbaz Khan, Mariana-Iuliana Georgescu, and Ling Shao. Object-Centric Auto-Encoders and Dummy Anomalies for Abnormal Event Detection in Video. In Proceedings of CVPR, pages 7842–7851, 2019.
- [22] Radu Tudor Ionescu, Sorina Smeureanu, Bogdan Alexe, and Marius Popescu. Unmasking the abnormal events in video. In Proceedings of ICCV, pages 2895–2903, 2017.
- [23] Radu Tudor Ionescu, Sorina Smeureanu, Marius Popescu, and Bogdan Alexe. Detecting abnormal events in video using Narrowed Normality Clusters. In Proceedings of WACV, pages 1951–1960, 2019.
- [24] Xiangli Ji, Bairong Li, and Yuesheng Zhu. TAM-Net: Temporal Enhanced Appearance-to-Motion Generative Network for Video Anomaly Detection. In Proceedings of IJCNN, pages 1–8, 2020.
- [25] Jaechul Kim and Kristen Grauman. Observe locally, infer globally: A space-time MRF for detecting abnormal activities with incremental updates. In Proceedings of CVPR, pages 2921–2928, 2009.
- [26] Sangmin Lee, Hak Gu Kim, and Yong Man Ro. STAN: Spatio-temporal adversarial networks for abnormal event detection. In Proceedings of ICASSP, pages 1323–1327, 2018.
- [27] Sangmin Lee, Hak Gu Kim, and Yong Man Ro. BMAN: Bidirectional Multi-Scale Aggregation Networks for Abnormal Event Detection. IEEE Transactions on Image Processing, 29:2395–2408, 2019.
- [28] Bo Li, Sam Leroux, and Pieter Simoens. Decoupled appearance and motion learning for efficient anomaly detection in surveillance video. Computer Vision and Image Understanding, 210:103249, 2021.
- [29] Weixin Li, Vijay Mahadevan, and Nuno Vasconcelos. Anomaly detection and localization in crowded scenes. IEEE Transactions on Pattern Analysis and Machine Intelligence, 36(1):18–32, 2014.
- [30] Wen Liu, Weixin Luo, Dongze Lian, and Shenghua Gao. Future Frame Prediction for Anomaly Detection – A New Baseline. In Proceedings of CVPR, pages 6536–6545, 2018.
- [31] Yusha Liu, Chun-Liang Li, and Barnabaás Póczos. Classifier Two-Sample Test for Video Anomaly Detections. In Proceedings of BMVC, 2018.
- [32] Zhian Liu, Yongwei Nie, Chengjiang Long, Qing Zhang, and Guiqing Li. A Hybrid Video Anomaly Detection Framework via Memory-Augmented Flow Reconstruction and Flow-Guided Frame Prediction. In Proceedings of ICCV, pages 13588–13597, 2021.
- [33] C. Lu, J. Shi, and J. Jia. Abnormal Event Detection at 150 FPS in MATLAB. In Proceedings of ICCV, pages 2720–2727, 2013.
- [34] Yiwei Lu, Frank Yu, Mahesh Kumar, Krishna Reddy, and Yang Wang. Few-Shot Scene-Adaptive Anomaly Detection. In Proceedings of ECCV, pages 125–141, 2020.
- [35] Weixin Luo, Wen Liu, and Shenghua Gao. A Revisit of Sparse Coding Based Anomaly Detection in Stacked RNN Framework. In Proceedings of ICCV, pages 341–349, 2017.
- [36] Neelu Madan, Arya Farkhondeh, Kamal Nasrollahi, Sergio Escalera, and Thomas B. Moeslund. Temporal Cues From Socially Unacceptable Trajectories for Anomaly Detection. In Proceedings of ICCVW, pages 2150–2158, 2021.
- [37] Vijay Mahadevan, Wei-Xin Li, Viral Bhalodia, and Nuno Vasconcelos. Anomaly Detection in Crowded Scenes. In Proceedings of CVPR, pages 1975–1981, 2010.
- [38] Ramin Mehran, Alexis Oyama, and Mubarak Shah. Abnormal crowd behavior detection using social force model. In Proceedings of CVPR, pages 935–942, 2009.
- [39] Trong-Nguyen Nguyen and Jean Meunier. Anomaly detection in video sequence with appearance-motion correspondence. In Proceedings of ICCV, 2019.
- [40] Guansong Pang, Cheng Yan, Chunhua Shen, Anton van den Hengel, and Xiao Bai. Self-trained Deep Ordinal Regression for End-to-End Video Anomaly Detection. In Proceedings of CVPR, pages 12173–12182, 2020.
- [41] Hyunjong Park, Jongyoun Noh, and Bumsub Ham. Learning Memory-guided Normality for Anomaly Detection. In Proceedings of CVPR, pages 14372–14381, 2020.
- [42] Didik Purwanto, Yie-Tarng Chen, and Wen-Hsien Fang. Dance With Self-Attention: A New Look of Conditional Random Fields on Anomaly Detection in Videos. In Proceedings of ICCV, pages 173–183, 2021.
- [43] Bharathkumar Ramachandra and Michael Jones. Street Scene: A new dataset and evaluation protocol for video anomaly detection. In Proceedings of WACV, pages 2569–2578, 2020.
- [44] Bharathkumar Ramachandra, Michael Jones, and Ranga Vatsavai. Learning a distance function with a Siamese network to localize anomalies in videos. In Proceedings of WACV, pages 2598–2607, 2020.
- [45] Bharathkumar Ramachandra, Michael Jones, and Ranga Raju Vatsavai. Perceptual metric learning for video anomaly detection. Machine Vision and Applications, 32:1432–1769, 2021.
- [46] Bharathkumar Ramachandra, Michael J. Jones, and Ranga Raju Vatsavai. A Survey of Single-Scene Video Anomaly Detection. IEEE Transactions on Pattern Analysis and Machine Intelligence, 2020.
- [47] Mahdyar Ravanbakhsh, Moin Nabi, Hossein Mousavi, Enver Sangineto, and Nicu Sebe. Plug-and-Play CNN for Crowd Motion Analysis: An Application in Abnormal Event Detection. In Proceedings of WACV, pages 1689–1698, 2018.
- [48] Mahdyar Ravanbakhsh, Moin Nabi, Enver Sangineto, Lucio Marcenaro, Carlo Regazzoni, and Nicu Sebe. Abnormal Event Detection in Videos using Generative Adversarial Nets. In Proceedings of ICIP, pages 1577–1581, 2017.
- [49] Joseph Redmon and Ali Farhadi. YOLOv3: An incremental improvement. arXiv preprint arXiv:1804.02767, 2018.
- [50] Huamin Ren, Weifeng Liu, Soren Ingvor Olsen, Sergio Escalera, and Thomas B. Moeslund. Unsupervised Behavior-Specific Dictionary Learning for Abnormal Event Detection. In Proceedings of BMVC, pages 28.1–28.13, 2015.
- [51] Mohammad Sabokrou, Mohsen Fayyaz, Mahmood Fathy, and Reinhard Klette. Deep-Cascade: Cascading 3D Deep Neural Networks for Fast Anomaly Detection and Localization in Crowded Scenes. IEEE Transactions on Image Processing, 26(4):1992–2004, 2017.
- [52] Sorina Smeureanu, Radu Tudor Ionescu, Marius Popescu, and Bogdan Alexe. Deep Appearance Features for Abnormal Behavior Detection in Video. In Proceedings of ICIAP, volume 10485, pages 779–789, 2017.
- [53] Waqas Sultani, Chen Chen, and Mubarak Shah. Real-World Anomaly Detection in Surveillance Videos. In Proceedings of CVPR, pages 6479–6488, 2018.
- [54] Che Sun, Yunde Jia, Yao Hu, and Yuwei Wu. Scene-Aware Context Reasoning for Unsupervised Abnormal Event Detection in Videos. In Proceedings of ACMMM, pages 184–192, 2020.
- [55] Stanislaw Szymanowicz, James Charles, and Roberto Cipolla. X-MAN: Explaining Multiple Sources of Anomalies in Video. In Proceedings of CVPRW, pages 3224–3232, 2021.
- [56] Yao Tang, Lin Zhao, Shanshan Zhang, Chen Gong, Guangyu Li, and Jian Yang. Integrating prediction and reconstruction for anomaly detection. Pattern Recognition Letters, 129:123–130, 2020.
- [57] Yu Tian, Guansong Pang, Yuanhong Chen, Rajvinder Singh, Johan W. Verjans, and Gustavo Carneiro. Weakly-Supervised Video Anomaly Detection With Robust Temporal Feature Magnitude Learning. In Proceedings of ICCV, pages 4975–4986, 2021.
- [58] Du Tran, Lubomir D. Bourdev, Rob Fergus, Lorenzo Torresani, and Manohar Paluri. Learning Spatiotemporal Features with 3D Convolutional Networks. In Proceedings of ICCV, pages 4489–4497, 2015.
- [59] Hung Vu, Tu Dinh Nguyen, Trung Le, Wei Luo, and Dinh Phung. Robust Anomaly Detection in Videos Using Multilevel Representations. In Proceedings of AAAI, volume 33, pages 5216–5223, 2019.
- [60] Ziming Wang, Yuexian Zou, and Zeming Zhang. Cluster Attention Contrast for Video Anomaly Detection. In Proceedings of ACMMM, pages 2463–2471, 2020.
- [61] Peng Wu, Jing Liu, and Fang Shen. A Deep One-Class Neural Network for Anomalous Event Detection in Complex Scenes. IEEE Transactions on Neural Networks and Learning Systems, 31(7):2609–2622, 2019.
- [62] Dan Xu, Yan Yan, Elisa Ricci, and Nicu Sebe. Detecting Anomalous Events in Videos by Learning Deep Representations of Appearance and Motion. Computer Vision and Image Understanding, 156:117–127, 2017.
- [63] Zhiwei Yang, Jing Liu, and Peng Wu. Bidirectional retrospective generation adversarial network for anomaly detection in videos. IEEE Access, 9:107842–107857, 2021.
- [64] Guang Yu, Siqi Wang, Zhiping Cai, En Zhu, Chuanfu Xu, Jianping Yin, and Marius Kloft. Cloze Test Helps: Effective Video Anomaly Detection via Learning to Complete Video Events. In Proceedings of ACMMM, pages 583–591, 2020.
- [65] Jongmin Yu, Younkwan Lee, Kin Choong Yow, Moongu Jeon, and Witold Pedrycz. Abnormal event detection and localization via adversarial event prediction. IEEE Transactions on Neural Networks and Learning Systems, pages 1–15, 2021.
- [66] Muhammad Zaigham Zaheer, Jin-ha Lee, Marcella Astrid, and Seung-Ik Lee. Old is Gold: Redefining the Adversarially Learned One-Class Classifier Training Paradigm. In Proceedings of CVPR, pages 14183–14193, 2020.
- [67] Muhammad Zaigham Zaheer, Arif Mahmood, Marcella Astrid, and Seung-Ik Lee. CLAWS: Clustering Assisted Weakly Supervised Learning with Normalcy Suppression for Anomalous Event Detection. In Proceedings of ECCV, pages 358–376, 2020.
- [68] Xinfeng Zhang, Su Yang, Jiulong Zhang, and Weishan Zhang. Video Anomaly Detection and Localization using Motion-field Shape Description and Homogeneity Testing. Pattern Recognition, 105:107394, 2020.
- [69] Ying Zhang, Huchuan Lu, Lihe Zhang, Xiang Ruan, and Shun Sakai. Video anomaly detection based on locality sensitive hashing filters. Pattern Recognition, 59:302–311, 2016.
- [70] Bin Zhao, Li Fei-Fei, and Eric P. Xing. Online Detection of Unusual Events in Videos via Dynamic Sparse Coding. In Proceedings of CVPR, pages 3313–3320, 2011.
- [71] Jia-Xing Zhong, Nannan Li, Weijie Kong, Shan Liu, Thomas H. Li, and Ge Li. Graph Convolutional Label Noise Cleaner: Train a Plug-And-Play Action Classifier for Anomaly Detection. In Proceedings of CVPR, pages 1237–1246, 2019.
- [72] Jun-Yan Zhu, Taesung Park, Phillip Isola, and Alexei A Efros. Unpaired image-to-image translation using cycle-consistent adversarial networks. In Proceedings of ICCV, pages 2223–2232, 2017.
7 Supplementary

7.1 Visualizations
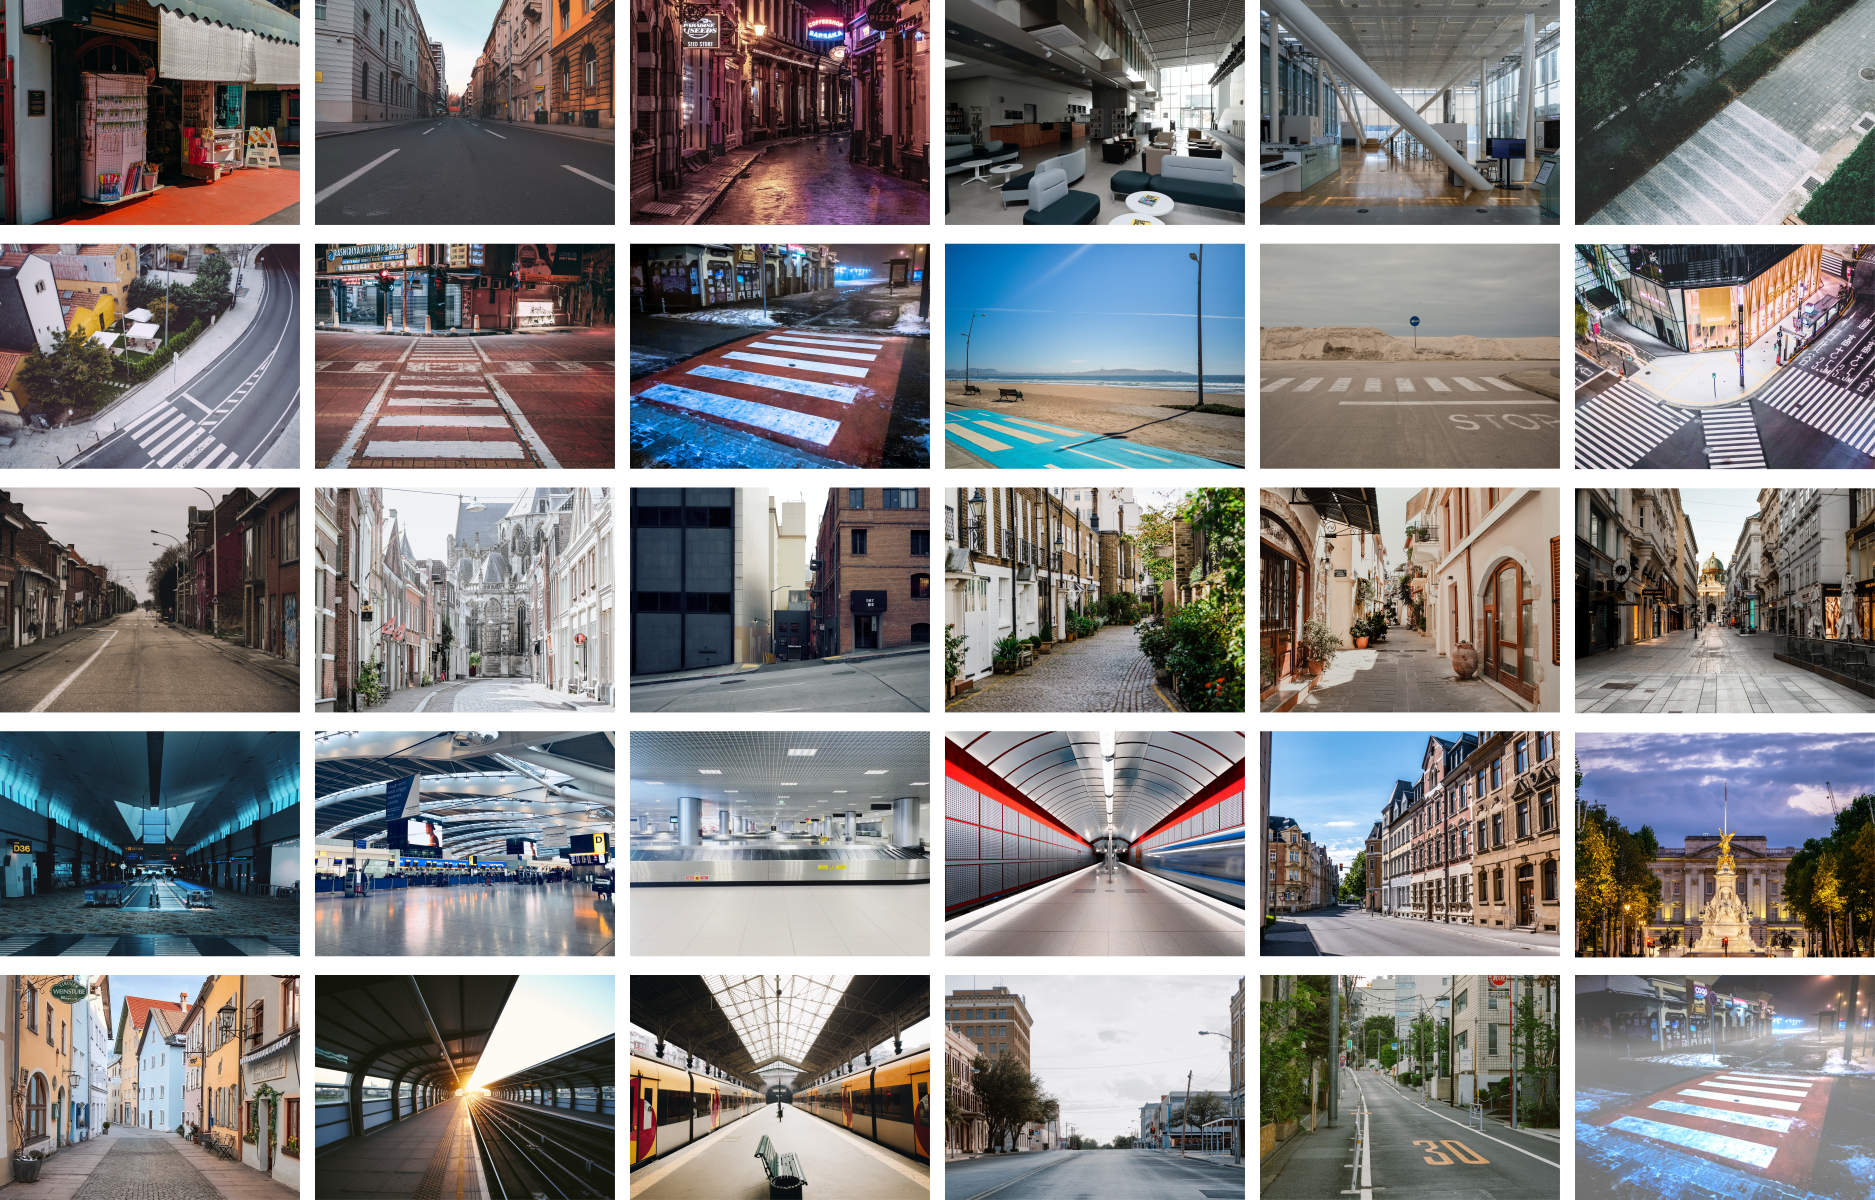
In Figure 6, we present the scenes of our data set. We have outdoor scenes and indoor scenes. There are various illumination conditions, corresponding to different weather conditions (e.g. sunny, cloudy, foggy) and different day times (e.g. day, sunset, night). The last image (at the bottom right) illustrates one of the existing scenes with the fog effect.
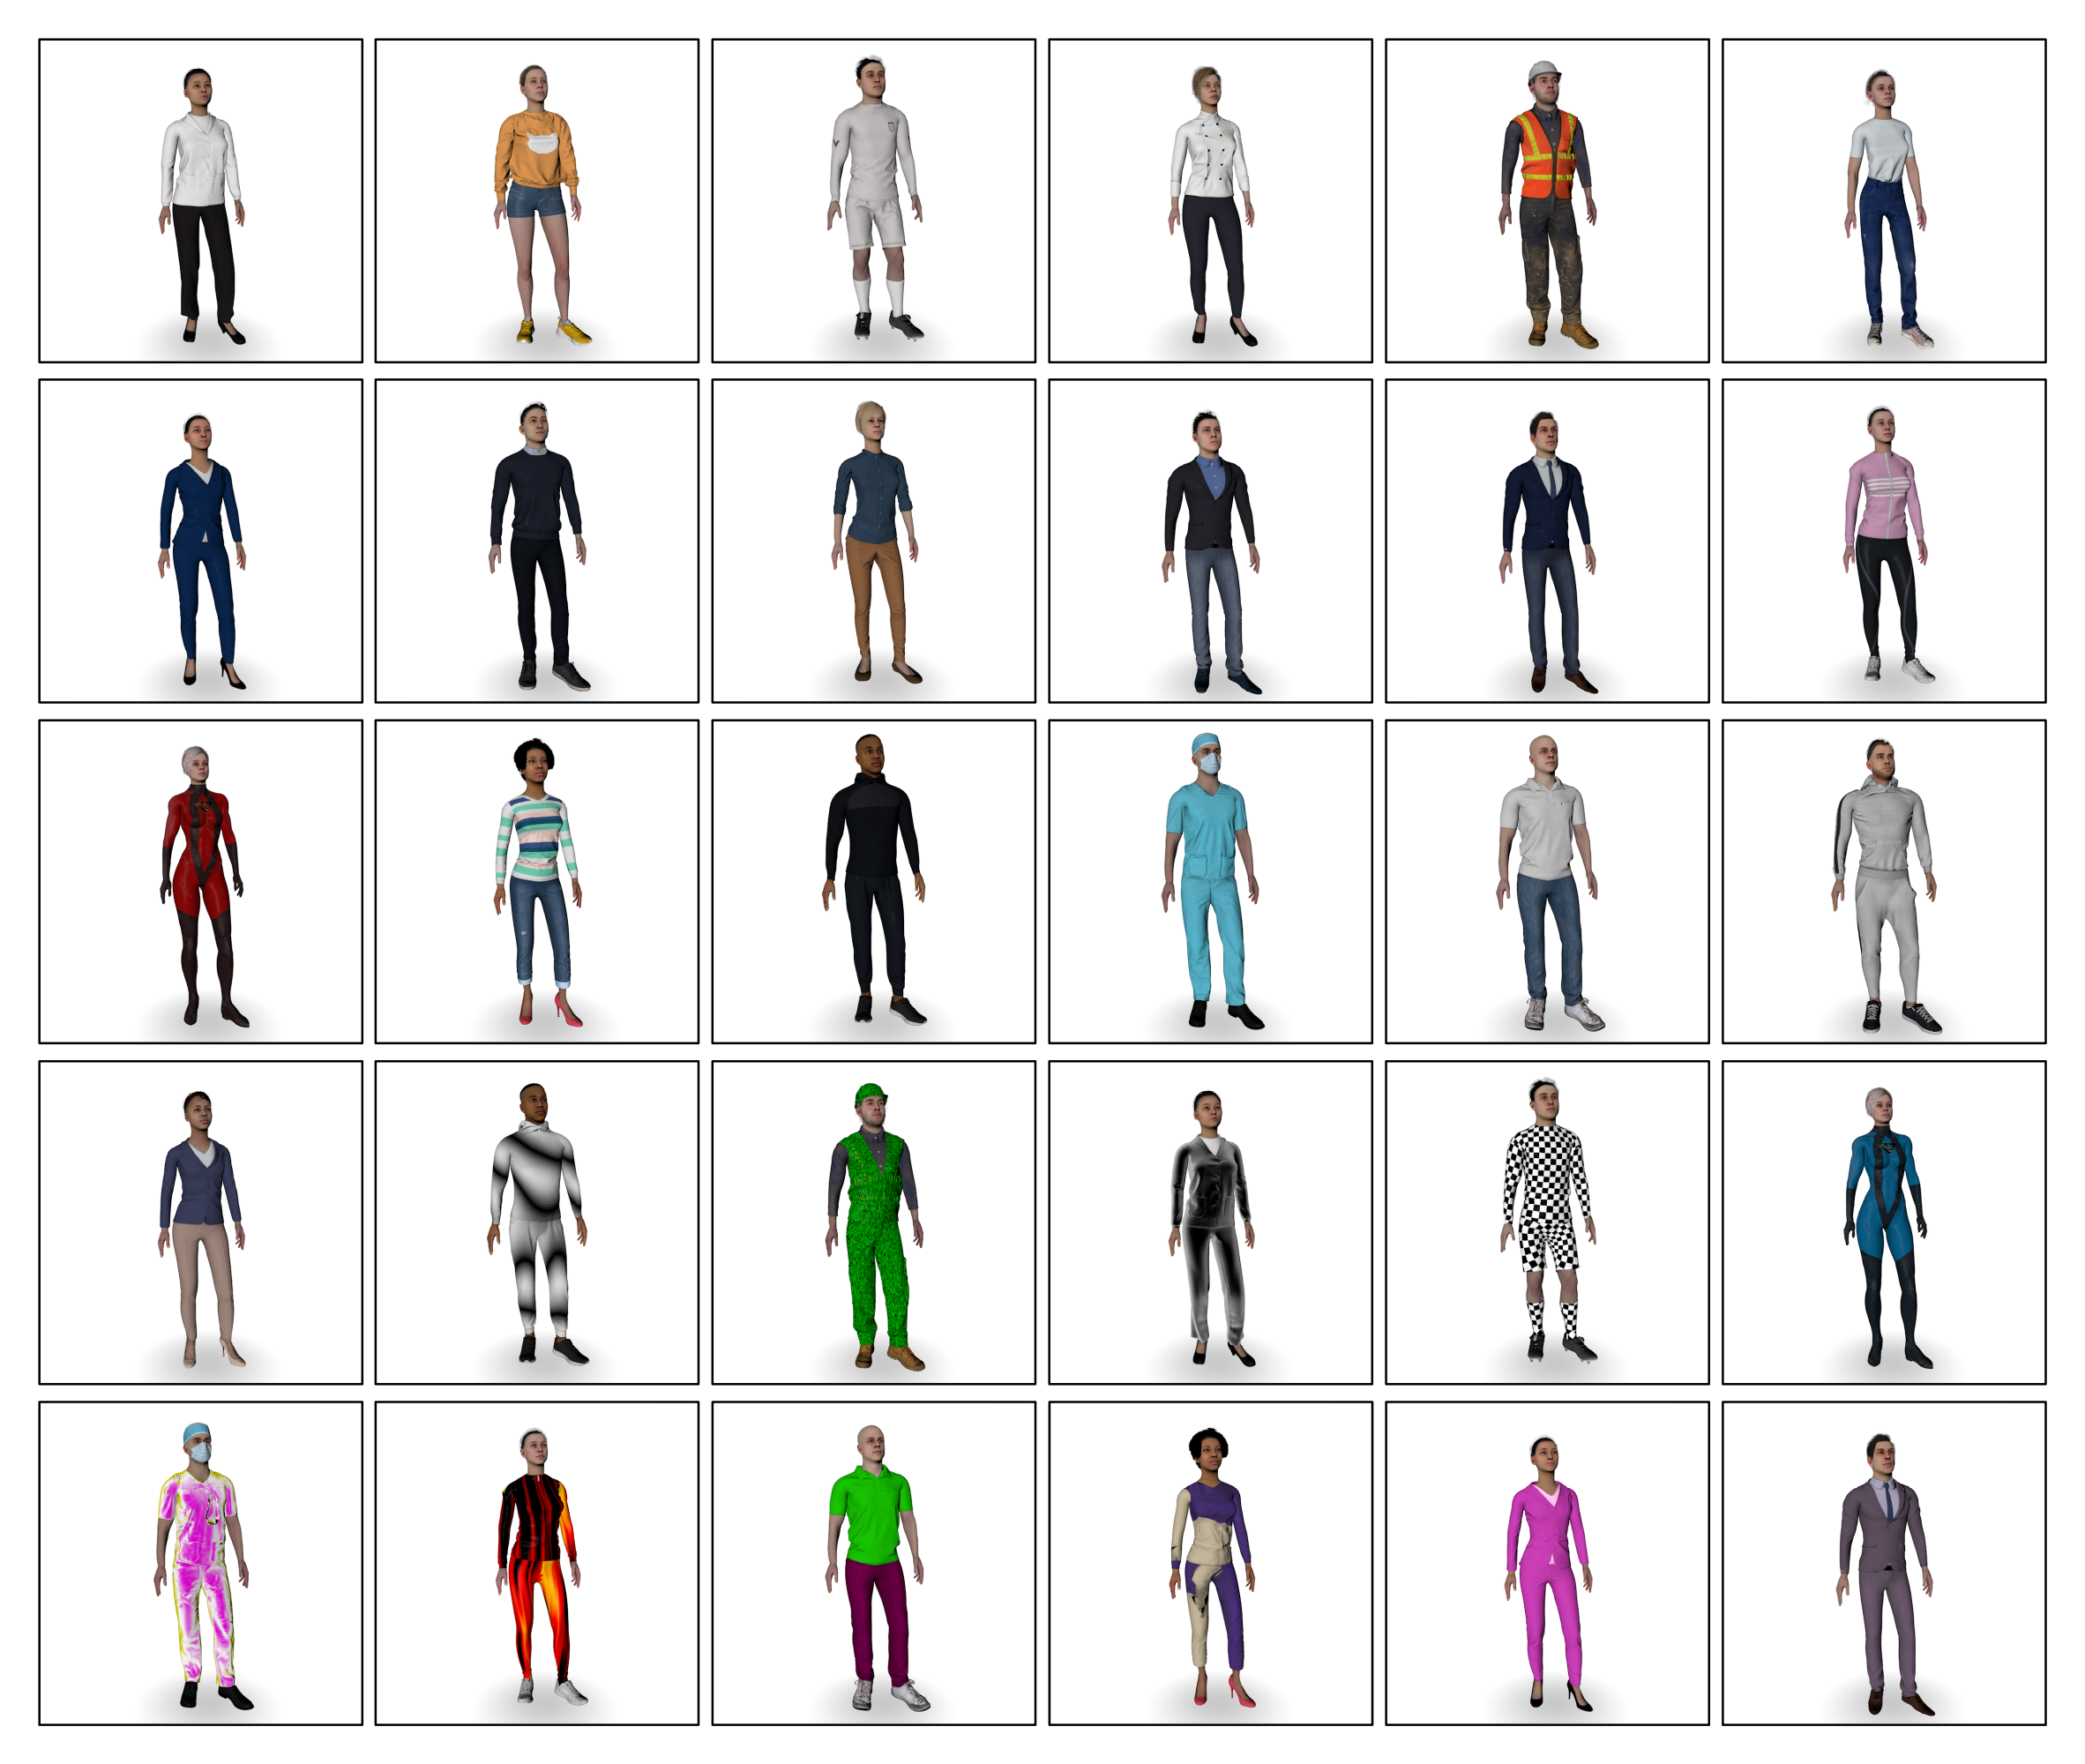
We present the animated characters from the UBnormal data set in Figure 7. There are unique characters, but in order to increase the variety of the data set, we augment the characters by changing the color of their hair and clothes.
In Figure 8, we show the object categories (excluding people) from UBnormal. We variate the colors of objects to increase diversity, as for the animated characters.
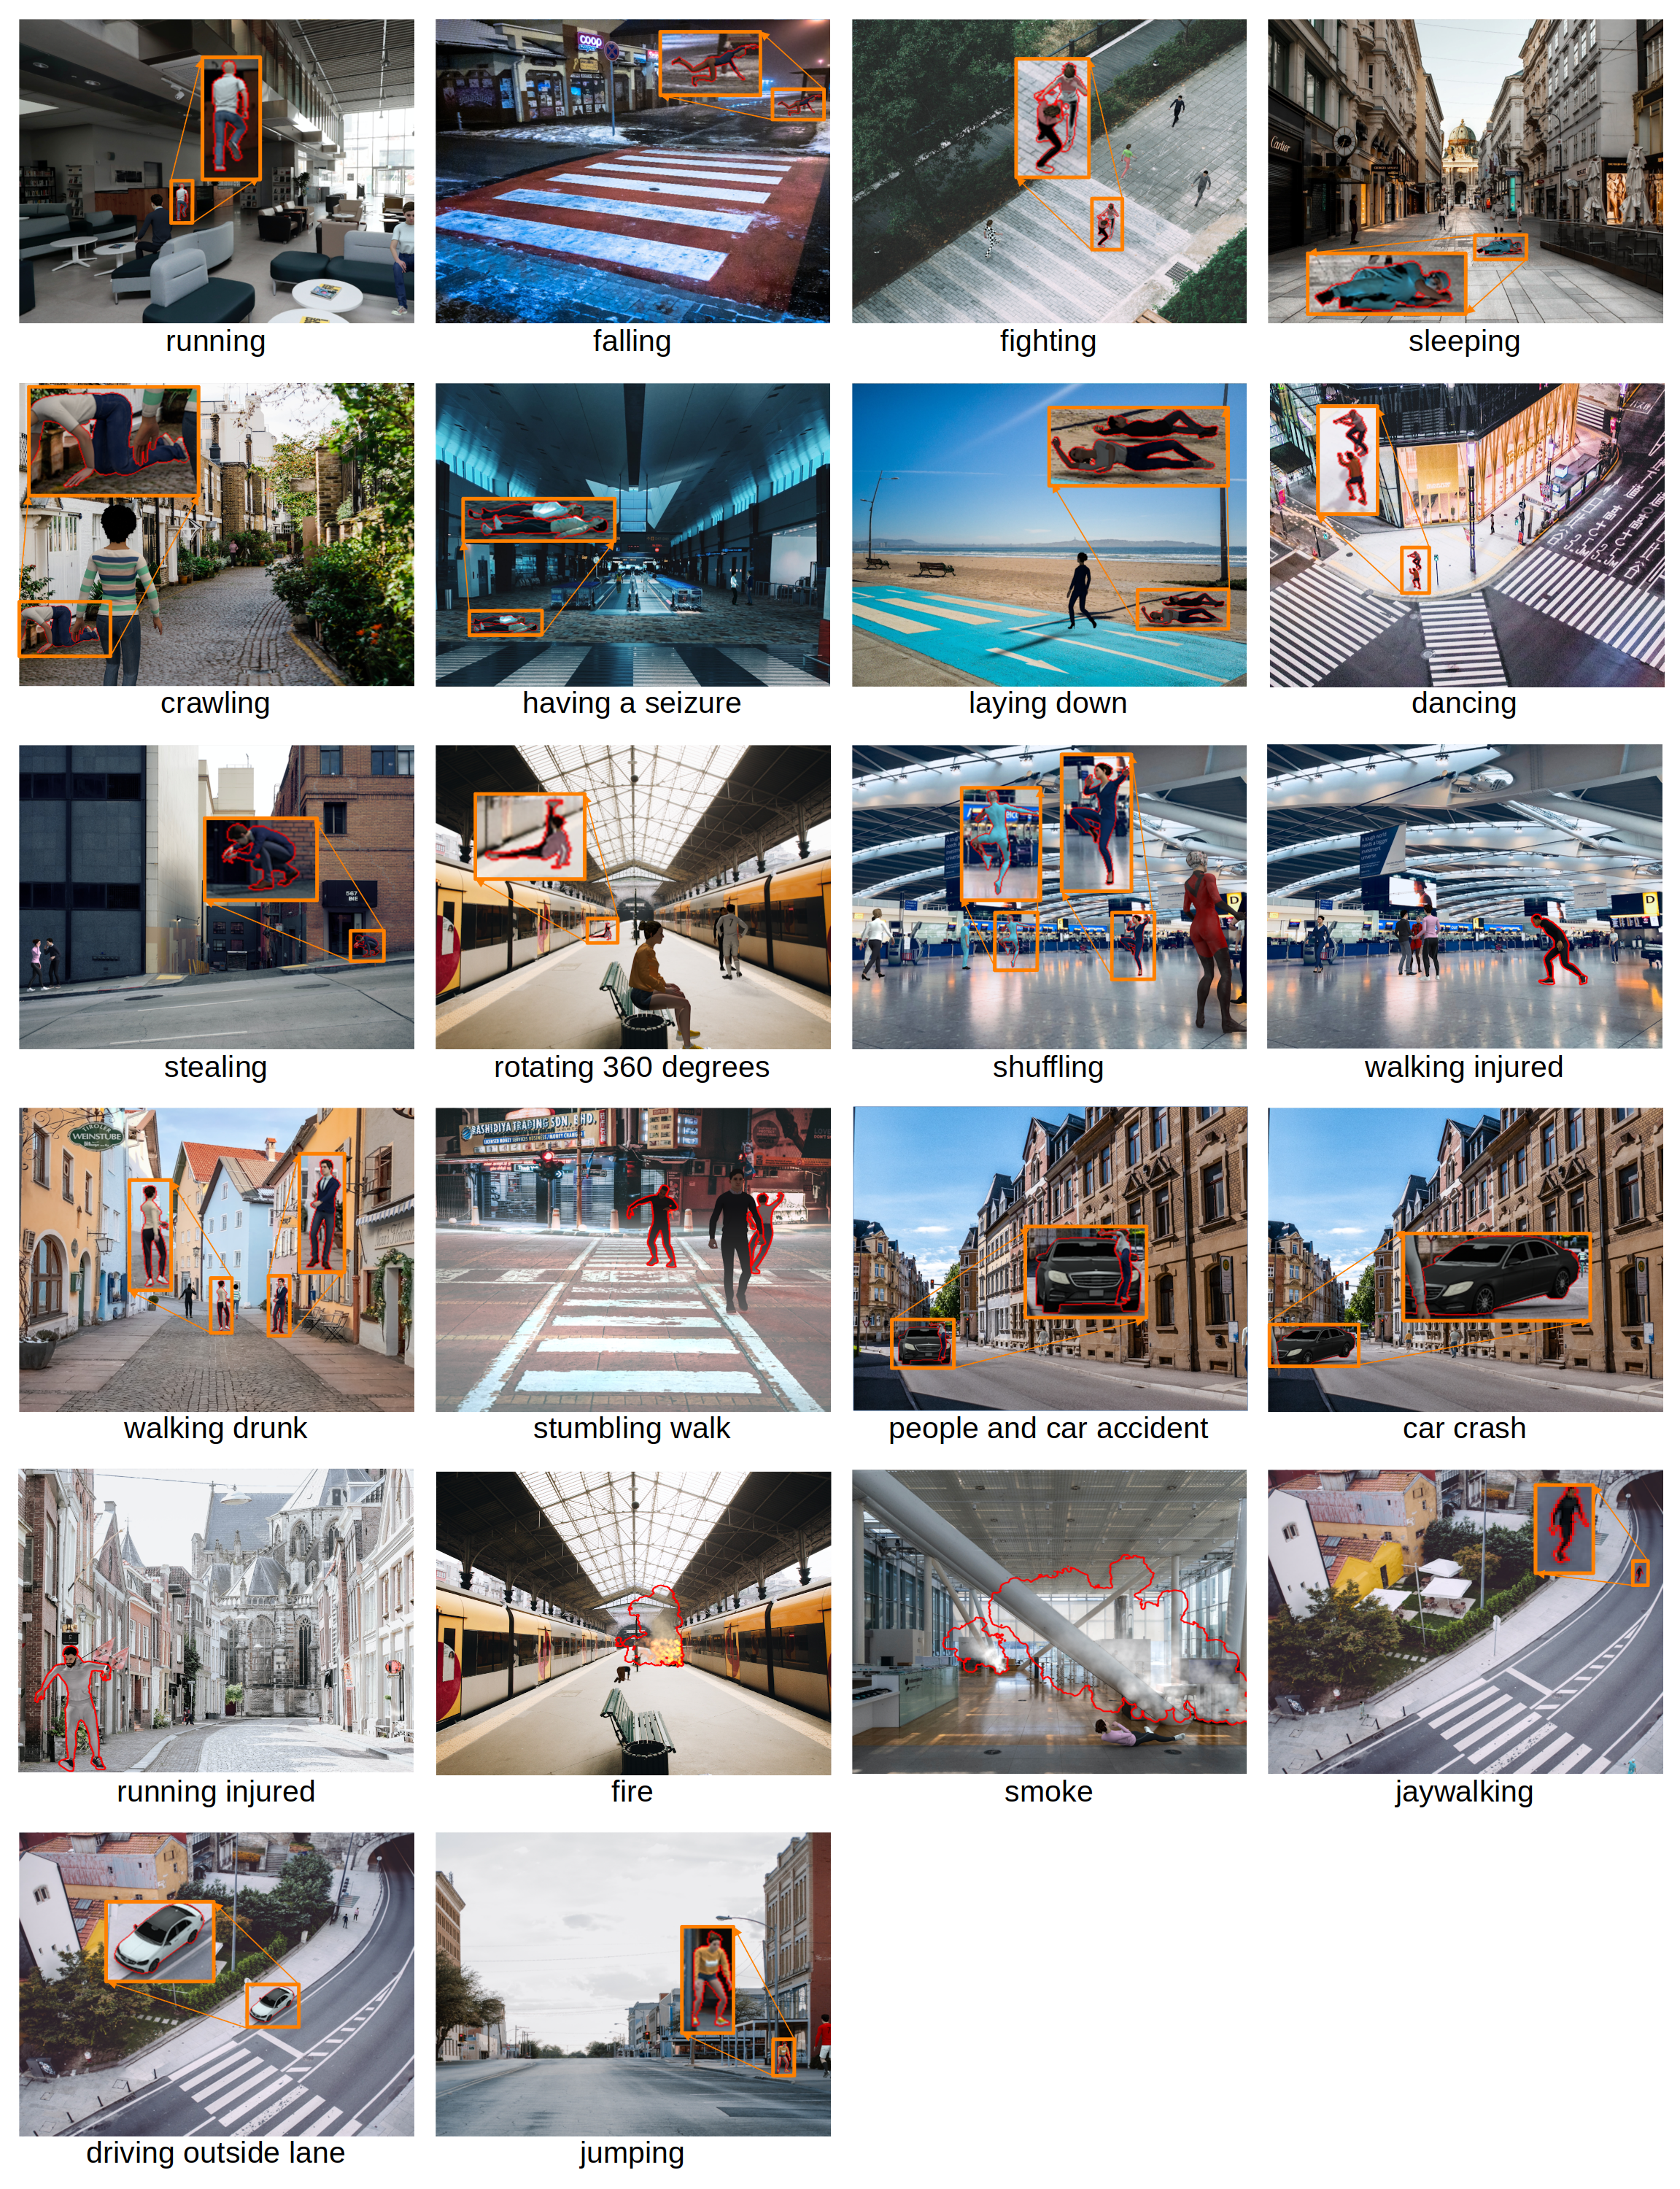
In Figure 9, we illustrate an example for each abnormal action category from the UBnormal benchmark. There are anomaly types related to objects (e.g. people, cars) and two non-object anomaly types (fire, smoke). The figure shows the diversity of our anomalies.
| Statistics | Training | Validation | Test | Total |
|---|---|---|---|---|
| anomalies | ||||
| abnormal frames | ||||
| normal frames | ||||
| abnormal minutes | ||||
| normal minutes | ||||
| videos | ||||
| abnormal regions | ||||
| unique objects | ||||
| avg. objects / frame |
7.2 Statistics
In Table 5, we report several statistics about the UBnormal data set. The number of videos in the data set is , with videos for training, for validation and the remaining for testing. There are a total of anomalies divided into , and for training, validation and test, respectively. The total number of abnormal frames is , with the largest fraction of frames belonging to the test set. There are abnormal regions in the data set, which accounts for an average of abnormal regions per abnormal frame. The average number of objects per frame is . The overall length of our data set is minutes.