Evolution of low-lying M1 modes in germanium isotopes
Abstract
Magnetic dipole strength functions are determined for the series of germanium isotopes from to = 48 on the basis of a large number of transition strengths calculated within the shell model. The evolution of the strength with increasing neutron number in the orbital is analyzed. A bimodal structure comprising an enhancement toward low transition energy and a resonance in the region of the scissors mode is identified. The low-energy enhancement is strongest near closed shells, in particular at the almost completely filled orbital, while the scissorslike resonance is most pronounced in the middle of the open shell, which correlates with the magnitude of the also deduced electric quadrupole transition strengths. The results are consistent with previous findings for the shorter series of iron isotopes and prove the occurrence and correlation of the two low-lying magnetic dipole modes as a global structural feature.
pacs:
21.10.Pc, 21.60.Cs, 23.20.Lv, 27.50.+eI Introduction
The excitation and deexcitation of the nucleus by electromagnetic radiation at high excitation energy and high level density are described by means of -ray strength functions (-SF) which represent average transition strengths in a certain energy range. The experimental determination and the theoretical understanding of the properties of -SF has attracted increasing interest because of their importance for the accurate description of photonuclear reactions and the inverse radiative-capture reactions, which play a central role in in the synthesis of the elements in various stellar environments arn07 ; kap11 . The region of low transition energies is important for these processes. Traditionally, the -SF has been associated with electric dipole () transitions. Recently a strong component of character has been observed as an upbend of the -SF toward transition energy .
First observed in 56,57Fe voi04 , the upbend was found also in various nuclides in other mass regions, such as in Mo isotopes gut05 , in 105,106Cd lar13 , and in Sm isotopes sim16 ; sim19 . The experiments used light-ion induced reactions such as (3He,3He’), and the data were analyzed with the so-called Oslo method to extract level densities and -SFs. This method was also applied in connection with decay to 76Ga spy14 . A dominant dipole character of the low-energy strength was demonstrated in Ref. lar13L , and an indication for a magnetic dipole () character was discussed for the case of 60Ni voi10 .
Shell-model calculations revealed that a large number of transitions between excited states produces an exponential increase of the -ray strength function that peaks at and describes the low-energy enhancement of dipole strength observed in Mo isotopes around the neutron shell closure at = 50 sch13L . In these calculations, large reduced transition strengths appear for transitions linking states with configurations dominated by both protons and neutrons in high- orbitals, the spins of which recouple. The low-energy enhancement was confirmed in shell-model calculations for 56,57Fe bro14Fe , 46,50,54Ti sie17a and 44Sc sie17 . In the latter work, also the electric dipole () strength function was calculated, which does not show an upbend comparable to that of the strength. A correlation between the low-energy strength (LEMAR - Low Energy Magnetic Radiation) and the scissors resonance (SR), a fundamental excitation occurring in deformed nuclei around 3 MeV hey10 , was found in shell-model calculations for the series of isotopes from 60Fe to 68Fe sch17 . It was found that the low-energy strength decreases and the scissors strength develops when going into the open shell. The simultaneous appearance of the two modes is in accordance with experimental findings in Sm isotopes sim16 ; sim19 . Later on, strength functions were calculated for isotopic series in various mass regions kar17 ; sie18 ; mid18 . The study in Ref. mid18 confirmed that the low-energy strength is strongest in nuclides near shell closures.
In the present work we study the low-energy -SFs for the chain of the Ge isotopes. The relatively small configuration space allows us to carry out shell model calculations covering completely the open neutron shell . We demonstrate for the first time that the low-energy strength is concentrated in the LEMAR spike at the bottom of the shell, it is partially moved into the SR in the middle of the shell, and is again concentrated in the LEMAR spike at the top of the shell.
II Shell-model calculations
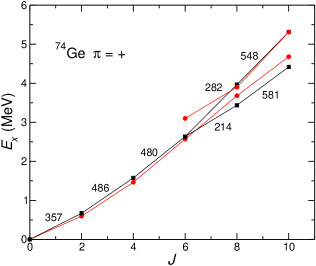
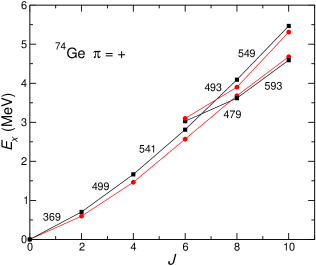
The shell-model calculations for the germanium isotopes were carried out in the jj44pn model space with the jj44bpn Hamiltonian hon09 ; bro ; lis04 using the code NuShellX@MSU bro14Nu . The model space included the proton and neutron orbitals . At first, we calculated the energies of the yrast states and the reduced transition strengths of the linking electric quadrupole () transitions for varied limitations of occupation numbers to test at which numbers the values do not change further and a convergence is achieved. This is in particular important for the mid-shell isotopes. For example, an increase of the allowed maximum occupation number (upper limit) in the neutron orbital from four to six in 70Ge does not change the value and, thus, the application of an upper limit of four is appropriate. In 74Ge, a change of this number from six to eight changes the value from 357 to 369 e2fm4, while the further increase to ten neutrons does not cause any further change. At the same time, the allowed minimum occupation numbers (lower limits) in the neutron and orbitals were set to two. A decrease of these lower limits to zero results in = 371 e2fm4. In the full calculations including all transition strengths, the following limits of occupation numbers were applied to truncate the configuration space and, hence, make the calculations feasible and efficient. Up to four protons were allowed to occupy each of the and orbitals while up to two could be lifted to each of the and orbitals. The same holds for the neutrons in 64Ge, while there can be up to six neutrons in the orbital in 66Ge. In 70Ge, at least two neutrons are in each of the and orbitals and up to four can be excited to the orbital. The possible occupation numbers of neutrons in the orbital are further increased in the heavier isotopes, ranging from two to eight in 74Ge, from six to ten in 78Ge, and from eight to ten in 80Ge. For the calculation of the reduced electric quadrupole transition strengths , standard effective charges of and were used and for the strengths, effective factors of were applied.
The full calculations were performed for the lowest 40 states of each spin from = 0 to 10 and each parity. The reduced transition strengths were calculated for all transitions from initial to final states with energies and spins . This resulted in more than 24000 transitions for each parity, which were sorted into 0.1 MeV bins of transition energy . The average value for one energy bin was obtained as the sum of all values divided by the number of transitions within this bin. Average values were deduced in an analogous way, but include also the = 2 transitions. strength functions were deduced according to
| (1) |
where the are averages in considered bins for given , , and are the level densities derived from the present calculations. The strength functions were obtained by averaging step-by-step over , , and .
III Results for the yrast region
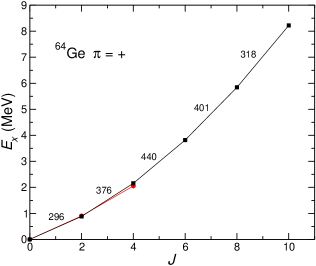
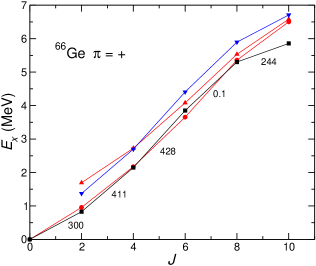
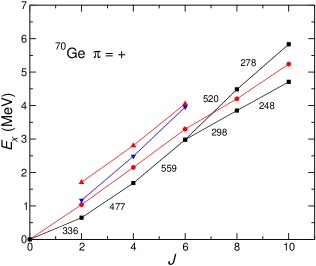
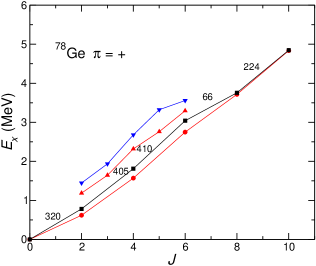
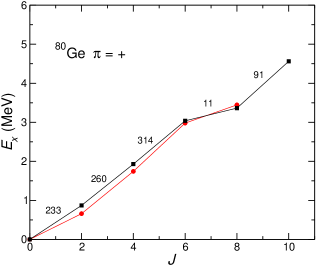
To check the reliability of the shell-model calculations, we studied the yrast regions of the Ge isotopes. The calculated energies of the ground-state and first excited bands in 74Ge are compared with the experimental ones sun14 in Figs. 1 and 2. They represent the results obtained with the just discussed upper limits of six and eight neutrons, respectively. In both cases, the experimental bands are well described by the calculations. A similarly good description of the experimental yrast and yrare bands by the present calculations is achieved for all other isotopes, which are presented in Figs. 11 and 12 of the appendix.
In accordance with the experiment, the energies increase in a regular way, forming quasi-rotatonal bands. The crossing of the ground-state band with an excited band at is reproduced. The energy ratios deviate substantially from the rotor rule , The calculated ratios of 2.44, 2.59, 2.59, 2.38, 2.32, 2.22 for 64,66,70,74,78,80Ge compare well with experimental ratios of 2.28, 2.27, 2.07, 2.46, 2.54, 2.64, respectively. They characterize the Ge isotopes as soft nuclei in the transitional region between spherical and deformed shapes, because they are well below the rotor ratio of 3.33. The calculated values increase toward high spin up to the crossing region. For 74Ge, the experimental ratio is reproduced by the calculated one of 1.35.
The results for the states are compared with the experimental values in Table 1. The energies of the states are reproduced within 100 keV, except the high experimental value for 70Ge. The experimental values indicate a maximum of the quadrupole collectivity in the middle of the shell, which is reproduced by the calculations. However, the calculated peak is much shallower than in the experiment. A similar shallow peak is obtained for and 6 (see Figs.11 and 12 of the appendix.).
One should be aware that the determination of the quadrupole collectivity from the values only is based on the assumption of a rotational behavior of the yrast states, which is not realized for the soft nuclei under consideration. Instead, the sums of the values of all transitions from the ground state are more appropriate Kum72 ; pov20 and also given in Table 1. These sums of all transitions into the ground state are however only little larger and follow the trends of the values. An even more comprehensive indicator of the collectivity may be the consideration of average values between all the states considered here. The further discussion of values in Sec. IV therefore takes into account these values.
| ) | ) | ||||
|---|---|---|---|---|---|
| (keV) | (e2fm4) | (e2fm4) | |||
| EXP111The values for 64,66,70,74,78,80Ge were taken from Refs. nds64 ; nds66 ; nds70 ; nds74 ; nds78 ; nds80 , respectively. | CALC | EXP111The values for 64,66,70,74,78,80Ge were taken from Refs. nds64 ; nds66 ; nds70 ; nds74 ; nds78 ; nds80 , respectively. | CALC | CALC | |
| 64Ge32 | 902 | 883 | 296 | 308 | |
| 66Ge34 | 957 | 828 | 190(36) | 300 | 321 |
| 70Ge38 | 1040 | 649 | 356(7) | 336 | 382 |
| 74Ge42 | 596 | 704 | 609(7) | 369 | 384 |
| 78Ge46 | 619 | 782 | 455(79) | 320 | 343 |
| 80Ge48 | 659 | 871 | 279(55) | 233 | 280 |


IV Results for the strength functions
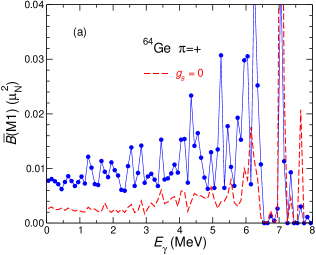
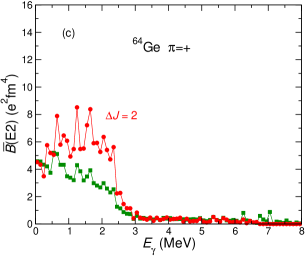
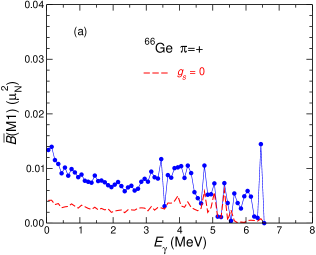
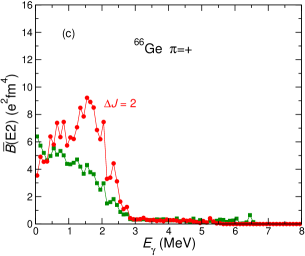
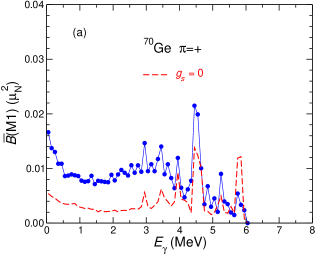
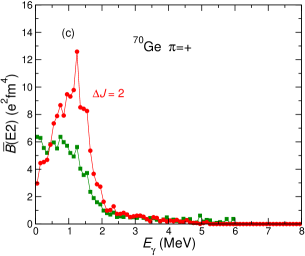
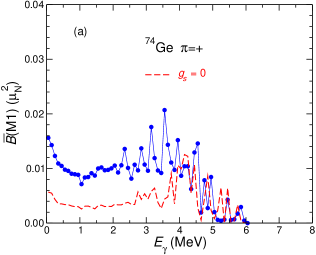
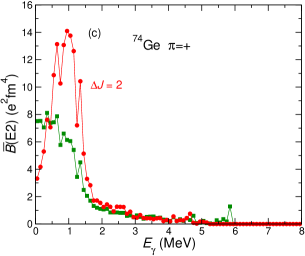
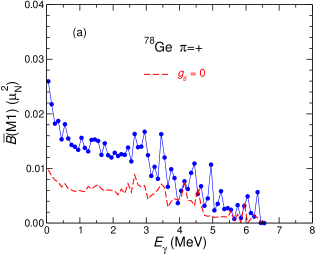
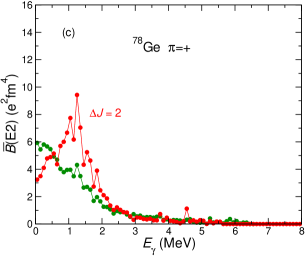
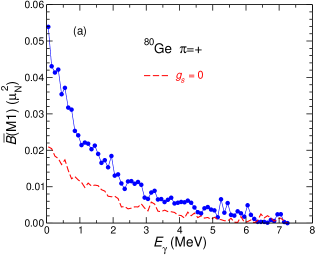
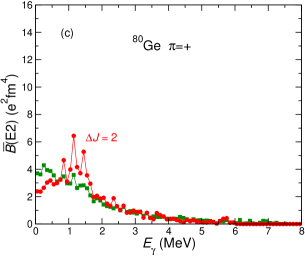
The average and values for positive parity states and the strength functions including both parities are shown for all considered Ge isotopes in Figs. 3,4,5,6,7,8. The nucleus 64Ge shows a fluctuating, but on average flat distribution of the strength as a function of with an even slight decrease toward , which is similar to predictions for the nuclei 48Ca sie17a and 108Xe sie18 . This seems to point to a more general feature of the low-energy strength in nuclei. It is suggested below that isospin conservation quenches the LEMAR spike. In the nuclide Ge34, a gradual enhancement of the strength toward is seen. The behavior resembles the one in Fe34 sch17 , but is less pronounced. Both these nuclei are localized near the bottom of the neutron shell. For Ge38, the bimodal structure of a LEMAR peak at and a broad SR peak around MeV appears. A similar bimodal distribution is seen in Ge42. This bimodal strength distribution is characteristic for nuclei located well in the open shell, as for example also in Fe38,42 sch17 and in nuclides with 100 sie18 . The SR peak becomes weak in Ge46 and disappears in Ge48, when approaching the top of the neutron shell. A similar suppression of the SR peak toward the next higher neutron shell was also found in nuclei sie18 . The present calculations find a maximum of the SR strength in the middle of the neutron shell that correlates with the clear maximum of the experimental values. Unlike the experiment, the calculated values have a very shallow mid-shell maximum, as was also obtained in the calculations for the Fe isotopes sch17 .
However, a different behavior is seen for the average values shown in the panels (c) of Figs. 3,4,5,6,7,8. Here, a peak around 1 MeV develops toward the middle of the shell (70,74Ge). This peak indicates enhanced collectivity in the sequences and clearly correlates with the maximum of the SR strength in the middle of the shell. It can be interpreted as the appearance of damped rotational transitions (see e.g. Ref. mat97 ) as a consequence of building-up quadrupole collectivity. The calculations include states up angular momentum 10 with equal weight. The average transition energy of 1 MeV and the average angular momentum of correspond to a moment of inertia of about 10 /MeV, which is somewhat smaller than the rigid-body value of 14 /MeV for . In the same way, from Fig. 4 of Ref. sch17 one derives a moment of inertia of 8 /MeV for Fe42. In Ref. sim16 , the increased SR strength of the -SF of 151,153Sm could be reproduced by replacing the ground state moment of inertia by the rigid-body value in the phenomenological expression of Ref. end05 , which was developed for the excitation of the SR from the ground state.
We calulated the total strengths in certain energy ranges by a numerical integration of the strength functions:
| (2) |
The results for the LEMAR region ( MeV), the SR region (2 MeV MeV) and their sums are compiled in Table 2. As visualized in the panels (b) of Figs. 3,4,5,6,7,8, one also quantitatively observes a shift of strength to the SR region when going into the open shell (Ge38,42) and a shift back to the LEMAR region when approaching the = 50 shell closure (Ge46,48), while the sum of the two remains roughly constant. Only the nuclide 64Ge does not fit the systematics for reasons discussed below. In the calculations of Ref. sch17 , a similar redistribution of the strength was found for the isotopes Fe34,38,42 when moving into the open shell by adding neutrons. However, the integrated strength up to 5 MeV, which is the sum of the LEMAR and SR strength, is about 1 for the Ge isotopes and about 10 for the Fe isotopes. The authors of Ref. sch13L suggested that the low-energy radiation is generated by the reorientation of the valence nucleons on high- orbitals. This mechanism is particular efficient if protons are hole-like and neutrons are particle-like (or vice versa). Then the transverse magnetic moments add up, which generates strong radiation. An analogous mechanism generates the ”shears bands” manifesting ”magnetic rotation” MagRot . In the case of the Fe isotopes one has active proton holes, which favorably combine with the active neutrons. In the case of the Ge isotopes the active neutrons combine with the protons, which have a small magnetic moment, and protons, which have a magnetic moment with the opposite sign. The factor of 10 in the integrated low-energy strength reflects the different valence proton configurations of the Fe and Ge isotopes. In case of the , nuclides the integrated strength up to 4 MeV is 0.5 - 1 (see Fig. 3 of Ref. sie18 ). The small number is expected because active protons and neutrons are particle-like and do not occupy the high- orbitals.
Also shown in Table 2 are the integrated strengths up to = 5 MeV, which were determined analogously to the integrated strengths. The values are maximal at the mid-shell nuclei 70,74Ge in accordance with the SR strengths, which proves the correlation of SR strength and collectivity.
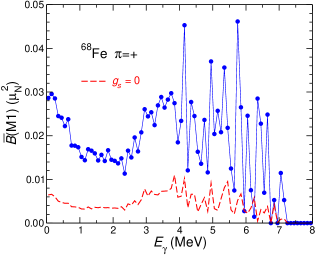
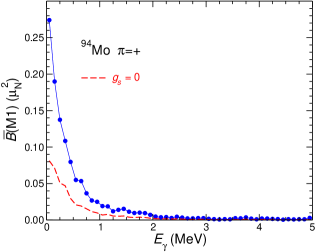
The excitation of the SR from the ground state, which appears as a bunch of states around 3 MeV, has been extensively studied and reviewed in Ref. hey10 . Therein, the SR is considered as being dominated by exciting the orbital angular momentum of the protons. In contrast, our calculations for the Ge isotopes show a reduction of the low-energy strength by a factor of about two when the spin part of the magnetic dipole operator is set equal to zero, which is illustrated in the panels (a) of Figs. 3,4,5,6, 7,8. An equal reduction appeared in our earlier calculations for the Mo and Fe isotopes as displayed in Figs. 9 and 10. The strong dependence of the strength on the spin part indicates that the reorientation of high- orbitals such as and must play a central role in generating the strong radiation (see Ref. sch17 ). In the calculations for 130Te in Ref. sie18 , the SR peak is similarly quenched when the spin part of the operator is set equal to zero whereas the LEMAR spike remains unchanged (see Figs. 2c and 2d therein).
The SR strength in the medium and heavy nuclei has been found proportional to the square of the quadrupole deformation, which is maximal in the middle of the open shell hey10 . As discussed in Ref. sim16 , the strength of the SR in the -SF seems to be related to the nuclear ground-state deformation in a similar way, though being a factor of three larger. The calculations in Ref. sie18 show the built-up of a SR around 4 MeV when moving into the open shell by adding neutrons in the case of the Te isotopes and when adding protons in the case of the isotones, where the SR strength increases with the values (compare Figs. 1 and 3 in Ref. sie18 and the experimental values for the studied nuclides given in Ref. ram01 ). The same correlation between the increase of experimental and of the increase of the SR strength was found for the Fe isotopes in the calculations in Ref. sch17 .
The integrated strengths up to a transition energy of 5 MeV in Table 2 are about 1 . They are much larger than the sums of the strengths of transitions from states down to the ground state, which are also given in Table 2. As seen in Table II of Ref. sch17 , the integrated strengths up to a transition energy of 5 MeV in 60,64,68Fe are about 10 to be compared with 0.33, 0.55, 0.58 for the respective sums of all transitions from states down to the ground state. In Ref. sim19 , the experimental integrated strengths up to 5 MeV for transitions in the quasicontinuum of 147,149,151,153Sm were found to be about 8 , which has to be compared with summed strengths of 0.16, 0.32, 0.80, 0.81 from states to the ground states of 148,150,152,154Sm, respectively end05 . In Ref. sch17 , the enhancement was attributed to the quenching of the pair correlations with increasing excitation energy, i.e. the thermal quenching of pairing.
According to the collective model of Ref. end05 , the strength of the SR on the ground state scales , where is the deformation parameter and the mass number. The sums of transition down to the ground states of the Ge, Fe,Te and Sm isotopes roughly follow the scaling (cf. Table 2 and Refs. sch17 ; sie18 ; sim19 ). The simple collective behavior seems to be caused by the pair correlations. The integrated strengths for the transitions in the quasicontinuum do not obey it. Once the pair correlations are quenched, the bimodal LEAMAR-SR structure appears in the strength function, the total strength of which depends strongly on the individual magnetic properties of the valence nucleons. This is in analogy to the moments of inertia. At low spin, when the the pair correlations are strong, the moments of inertia behave in a systematic manner, being . At high spin, when the Coriolis force overcomes the pair correlation, the individuality of the valence nucleons comes to light.
The experimental summed strengths for the transitions from states to the ground state given in Table 2 are smaller than the calculated ones. However, the experimental values represent only a lower limit. In the calculations, a large number of weak transitions contributes to the summed strengths, whereas experiments as the ones in Ref. jun95 detect only the strongest transitions. It has been demonstrated that a large number of weak transitions, which are hidden in a quasicontinuum, may substantially enlarge the strength function, as seen for example in Ref. mas14 .
The operator has approximately isospin character. In nuclei the low-lying states have . The states lie substantially higher. In case of 64Ge, the experimental energy of the lowest state is 6.2 MeV. Thus, the sum = 0.001 in Table 2 includes only transitions between states, which are isospin forbidden. The very small value for 64Ge reflects that isospin conservation nearly quenches transitions between the states. For nuclei the low-lying states have . Transitions between states are allowed, which results in for 66Ge. One expects that the same mechanism works for higher excitation energies. Transitions between the states are nearly forbidden. The states lie on the average substantially above the states that are connected by the operator, which prevents transition energies close to zero. For nuclides, the transitions between the states with the same isospin are allowed and the LEMAR spike appears. The author of Ref. sie18 suggested an alternative explanation: nuclei have a particular large deformation that moves strength from the LEMAR spike to the SR, which results in a flat distribution. At variance, the dependences of the strength in Figs. 3 to 8 and Table 2 indicate little collectivity for 64Ge.
| 111Integrated strength calculated according to Eq. (2). | 222Integrated strength calculated for positive-parity states in analogy to Eqs. (1) and (2). | 333Summed strength of transitions from the states below 5 MeV to the ground state. | ||||
|---|---|---|---|---|---|---|
| (fm4) | ||||||
| LEMAR | SR | EXP444Value taken from Ref. jun95 . | CALC | |||
| 64Ge32 | 0.30 | 0.54 | 0.84 | 155 | 0.001 | |
| 66Ge34 | 0.35 | 0.35 | 0.70 | 185 | 0.25 | |
| 70Ge38 | 0.54 | 0.62 | 1.16 | 219 | 0.04(1) | 0.49 |
| 74Ge42 | 0.44 | 0.50 | 0.94 | 241 | 0.30(3) | 0.57 |
| 78Ge46 | 0.63 | 0.49 | 1.12 | 181 | 0.48 | |
| 80Ge48 | 0.84 | 0.28 | 1.12 | 123 | 0.31 | |
V Summary
Shell-model calculations were performed for the series of germanium isotopes with neutron numbers from = 32 to = 48. Average and strengths were determined from a large number of transitions linking states of spins from 0 to 10. The average strengths and the associated strength functions are strongly enhanced near zero transition energy, which is the LEMAR spike observed before. The LEMAR spike develops with increasing neutron number and is strongest at . It is suppressed at , which is attributed to isospin conservation. In the mid-shell nuclei, a bump around 3.5 MeV appears, which is interpreted as the scissors resonance. The strength of the SR correlates with the quadrupole collectivity, as reflected by the experimental values and the integrated average strength of quasicontinuum transitions. The sum of the LEMAR and SR strengths depends only weakly on the neutron number. These characteristics are consistent with those found for the series of iron isotopes and with the experimental observation of LEMAR and SR strengths in samarium isotopes as well. They exhibit the important role of high- orbitals, such as and , for the evolution of the low-lying modes. Spin and orbital contributions to the strength appear nearly equal at low energy in most isotopes, while there are stronger orbital contributions above 4 MeV of transition energy in the mid-shell isotopes 70,74Ge. The present systematic analysis of low-lying strength in a relatively long isotopic series demonstrates that the correlated appearance of the two modes is a phenomenon that occurs across various mass regions.
VI Acknowlegdments
We thank B. A. Brown for his support in using the code NuShellX@MSU. The allocation of computing time through the Centers for High-Performance Computing of Technische Universität Dresden and of Helmholtz-Zentrum Dresden-Rossendorf are gratefully acknowledged. S. F. acknowledges support by the DOE Grant DEFG02-95ER4093.
References
- (1) M. Arnould, S. Goriely, and K. Takahashi, Phys. Rep. 450, 97 (2007).
- (2) F. Käppeler, R. Gallino, S. Bisterzo, and W. Aoki, Rev. Mod. Phys. 83, 157 (2011).
- (3) A. Voinov, E. Algin, U. Agvaanluvsan, T. Belgya, R. Chankova, M. Guttormsen, G. E. Mitchell, J. Rekstad, A. Schiller, and S. Siem, Phys. Rev. Lett. 93, 142504 (2004).
- (4) M. Guttormsen, R. Chankova, U. Agvaanluvsan, E. Algin, L. A. Bernstein, F. Ingebretsen, T. Lonnroth, S. Messelt, G. E. Mitchell, J. Rekstad, A. Schiller, S. Siem, A. C. Sunde, A. Voinov, and S. Odegard, Phys. Rev. C 71, 044307 (2005).
- (5) A. C. Larsen, I. E. Ruud, A. Burger, S. Goriely, M. Guttormsen, A. Görgen, T. W. Hagen, S. Harissopulos, H. T. Nyhus, T. Renstrøm, A. Schiller, S. Siem, G. M. Tveten, A. Voinov, and M. Wiedeking, Phys. Rev. C 87, 014319 (2013).
- (6) A. Simon, M. Guttormsen, A. C. Larsen, C. W. Beausang, P. Humby, J. T. Burke, R. J. Casperson, R. O. Hughes, T. J. Ross, J. M. Allmond, R. Chyzh, M. Dag, J. Koglin, E. McCleskey, M. McCleskey, S. Ota, and A.Saastamoinen, Phys. Rev. C 93, 034303 (2016).
- (7) F. Naqvi, A. Simon, M. Guttormsen, R. Schwengner, S. Frauendorf, C. S. Reingold, J. T. Burke, N. Cooper, R. O. Hughes, S. Ota, and A. Saastamoinen, Phys. Rev. C 99, 054331 (2019).
- (8) A. Spyrou, S. N. Liddick, A. C. Larsen, M. Guttormsen, K. Cooper, A. C. Dombos, D. J. Morrissey, F. Naqvi, G. Perdikakis, S. J. Quinn, T.Renstrøm, J. A. Rodriguez, A. Simon, C. S. Sumithrarachchi, and R. G. T. Zegers, Phys. Rev. Lett. 113, 232502 (2014).
- (9) A. C. Larsen, N. Blasi, A. Bracco, F. Camera, T. K. Eriksen, A. Görgen, M. Guttormsen, T. W. Hagen, S. Leoni, B. Million, H. T. Nyhus, T. Renstrøm, S. J. Rose, I. E. Ruud, S. Siem, T. Tornyi, G. M. Tveten, A. V. Voinov, and M. Wiedeking, Phys. Rev. Lett. 111, 242504 (2013).
- (10) A. Voinov, S. M. Grimes, C. R. Brune, M. Guttormsen, A. C. Larsen, T. N. Massey, A. Schiller, and S. Siem, Phys. Rev. C 81, 024319 (2010).
- (11) R. Schwengner, S. Frauendorf, and A. C. Larsen, Phys. Rev. Lett. 111, 232504 (2013).
- (12) B. Alex Brown and A. C. Larsen, Phys. Rev. Lett. 113, 252502 (2014).
- (13) K. Sieja, EPJ Web of Conferences 146, 05004 (2017).
- (14) K. Sieja, Phys. Rev. Lett. 119, 052502 (2017).
- (15) K. Heyde, P. von Neumann-Cosel, and A. Richter, Rev. Mod. Phys. 82, 2365 (2010).
- (16) R. Schwengner, S. Frauendorf, and B. A. Brown, Phys. Rev. Lett. 118, 092502 (2017).
- (17) S. Karampagia, B. A. Brown, and V. Zelevinsky, Phys. Rev. C 95, 024322 (2017).
- (18) K. Sieja, Phys. Rev. C 98, 064312 (2018).
- (19) J. E. Midtbø, A. C. Larsen, T. Renstrøm, F. L. Bello Garrote, and E. Lima, Phys. Rev. C 98, 064321 (2018).
- (20) M. Honma, T. Otsuka, T. Mizusaki, and M. Hjorth-Jensen, Phys. Rev. C 80, 064323 (2009).
- (21) B. A. Brown and A. F. Lisetskiy, unpublished.
- (22) A. F. Lisetskiy, B. A. Brown, M. Horoi, and H. Grawe, Phys. Rev. C 70, 044314 (2004).
- (23) B. A. Brown and W. D. M. Rae, Nucl. Data Sheets 120, 115 (2014).
- (24) J. J. Sun, Z. Shi, X. Q. Li, H. Hua, C. Xu, Q. B. Chen, S. Q. Zhang, C. Y. Song, J. Meng, X. G. Wu, S. P. Hu, H. Q. Zhang, W. Y. Liang, F. R. Xu, Z. H. Li, G. S. Li, C. Y. He, Y. Zheng, Y. L. Ye, D. X. Jiang, Y. Y. Cheng, C. He, R. Han, Z. H. Li, C. B. Li, H. W. Li, J. L. Wang, J. J. Liu, Y. H. Wu, P. W. Luo, S. H. Yao, B. B. Yu, X. P. Cao, and H. B. Sun, Phys. Lett B 734, 308 (2014).
- (25) K. Kumar, Phys. Rev. Lett. 28, 249 (1972).
- (26) A. Poves, F. Nowacki, and Y. Alhassid, Phys. Rev. C 101, 054307 (2020).
- (27) B. Singh, Nucl. Data Sheets 108, 197 (2007).
- (28) E. Browne and J. K. Tuli, Nucl. Data Sheets 111, 1093 (2010).
- (29) G. Gürdal and E. A. Mccutchan, Nucl. Data Sheets 136, 1 (2016).
- (30) B. Singh and A. R. Farhan, Nucl. Data Sheets 107, 1923 (2006).
- (31) A. R. Farhan and B. Singh, Nucl. Data Sheets 110, 1917 (2009).
- (32) B. Singh, Nucl. Data Sheets 105, 223 (2005).
- (33) M. Matsuo, T. Dossing, E. Vigezzi, R. A. Broglia, and K. Yoshida, Nucl. Phys. A 617, 1 (1997).
- (34) S. Frauendorf, Rev. Mod. Phys. 73, 463 (2001).
- (35) S. Raman, C. W. Nestor Jr., and P. Tikkanen, At. Data Nucl. Data Tables 78, 1 (2001).
- (36) J. Enders, P. von Neumann-Cosel, C. Rangacharyulu, and A. Richter, Phys. Rev. C 71, 014306 (2005).
- (37) A. Jung, S. Lindenstruth, H. Schacht, B. Starck, R. Stock, C. Wesselborg, R. D. Heil, U. Kneissl, J. Margraf, H. H. Pitz, and F. Steiper, Nucl. Phys. A 584, 103 (1995).
- (38) R. Massarczyk, G. Rusev, R. Schwengner, F. Dönau, C. Bhatia, M. E. Gooden, J. H. Kelley, A. P. Tonchev, and W. Tornow, Phys. Rev. C 90, 54310 (2014).
- (39) E. Farnea, G. de Angelis, A. Gadea, P. G. Bizzeti, A. Dewald, J. Eberth, A. Algora, M. Axiotis, D. Bazzacco, A. M. Bizzeti-Sona et al., Phys. Lett. B 551, 56 (2003).
- (40) E. A. Stefanova, I. Stefanescu, G. de Angelis, D. Curien, J. Eberth, E. Farnea, A. Gadea, G. Gersch, A. Jungclaus, K. P. Lieb, T. Martinez, R. Schwengner, T. Steinhardt, O. Thelen, D. Weisshaar, and R. Wyss, Phys. Rev. C 67, 054319 (2003).
- (41) B. Mukherjee, S. Muralithar, G. Mukherjee, R. P. Singh, R. Kumar, J. J. Das, P. Sugathan, N. Madhavan, P. V. M. Rao, A. K. Sinha, A. K. Pande, L. Chaturvedi, S. C. Pancholi, and R. K. Bhowmik, Acta Phys. Hung. N. S. 11, 189 (2000); Erratum Acta Phys. Hung. N. S. 13, 253 (2001).
- (42) A. M. Forney, W. B. Walters, C. J. Chiara, R. V. F. Janssens, A. D. Ayangeakaa, J. Sethi, J. Harker, M. Alcorta, M. P. Carpenter, G. Gürdal, C. R. Hoffman, B. P. Kay, F. G. Kondev, T. Lauritsen, C. J. Lister, E. A. McCutchan, A. M. Rogers, D. Seweryniak, I. Stefanescu, and S. Zhu, Phys. Rev. Lett. 120, 212501 (2018).
- (43) Zs. Podolyak, S. Mohammadi, G. de Angelis, Y. H. Zhang, M. Axiotis, D. Bazzacco, P. G. Bizetti, F. Brandolini, R. Broda, D. Bucurescu, E. Farnea et al., Int. J. Mod. Phys. 13, 123 (2004).
Appendix A Yrast properties of the remaining isotopes