A generalized lever rule for shear banding of yield stress fluids
Abstract
We study the local dynamics of a yield stress fluid that shows a pronounced non-monotonic flow curve. Such a mechanically unstable behavior generally leads to the coexistence of a flowing band with an arrested region below a critical shear rate . Combining ultrasound velocimetry with standard rheometry, we discover an original shear banding scenario in the decreasing branch of the flow curve, in which the flow profile of the flowing band is set by the applied shear rate instead of . As a consequence, the material slips at the walls with a velocity that shows a non-trivial dependence on . To capture our experimental observations, we propose a differential version of the so-called lever rule that describes the extent of the flowing band and the evolution of wall slip velocity with shear rate. Our approach therefore provides a generalized lever rule where constraints imposed in the classical shear banding scenario can be relaxed, while wall slip plays the role of an additional degree of freedom.
Introduction.- Yield stress fluids (YSF) encompass a broad range of materials, from cosmetics and food products to cement pastes and waxy crude oils. All these materials have in common a jammed or percolated microstructure that confers upon them solid-like properties under low external stresses. However, for stresses larger than a critical value, the microstructure yields and the material flows like a liquid Bonn et al. (2017). The existence of such a shear-induced solid to liquid transition results in a time-dependent mechanical response, referred to as thixotropy, and in complex flow properties, including stick-slip, fracture, and more generally heterogeneous flow profiles Persello et al. (1994); Divoux et al. (2010); Coussot (2014); Divoux et al. (2016); Andrade and Coussot (2019). The latter phenomenon, coined shear banding, has been mainly attributed to the competition between aging (that often results from attractive interactions between constituents) and the rejuvenation imposed by external shear Viasnoff and Lequeux (2002); Cloitre et al. (2000); Bonn et al. (2002). In practice, such a competition leads to a decreasing branch in the flow curve of shear stress vs. shear rate , and to the existence of a critical shear rate , below which a homogeneous shear flow becomes unstable Coussot et al. (2002a); Fielding (2007). As a result, the local flow profile splits into a fluidized region sheared at a critical shear rate and an arrested band, whose extent follows the lever rule, i.e., grows proportionally to as the shear rate is decreased below Coussot et al. (2002a); Ovarlez et al. (2009); Fall et al. (2010); Fielding (2014); Divoux et al. (2016).
The above phenomenology was further shown to be affected by boundary conditions and by the existence of slip at the wall. Originally described as a mere artifact that can be suppressed by well-chosen surface properties, wall slip appears to play a deeper, fundamental role in the flow properties of YSF Buscall (2010); Cloitre and Bonnecaze (2017); Derzsi et al. (2017). For instance, wall slip may affect the yielding transition and modify the steady-state flow properties of YSF Gibaud et al. (2008, 2009). Nonetheless, the current consensus remains that wall slip and more generally boundary conditions can always be tuned independently of the material rheological response Mansard et al. (2014).
In this Letter, we rationalize the interplay between wall slip and shear banding in YSF through experiments on model paraffin gels, which display a pronounced non-monotonic flow curve under simple steady shear. Velocimetry coupled to standard rheometry allows us to unravel an original steady-state shear banding scenario: along the decreasing branch of the flow curve, the shear rate in the fluidized band is controlled by the externally imposed shear rate , rather than being fixed to . As a result, the slip velocity of the fluid at the wall displays a non-trivial dependence with . We propose a simple model that describes all the experimental data, in which wall slip is directly related to the bulk behavior of the material based on a differential formulation of the lever rule. This approach remains valid down to very low shear rates, at which cooperative effects come into play as the dimension of the flowing band becomes comparable to the average particle size Goyon et al. (2008); Bocquet et al. (2009); Goyon et al. (2010). Our results offer a new perspective on wall slip in YSF, and a generalized approach to the classical lever rule that allows us to relax the constraints imposed in the classical shear-banding scenario.
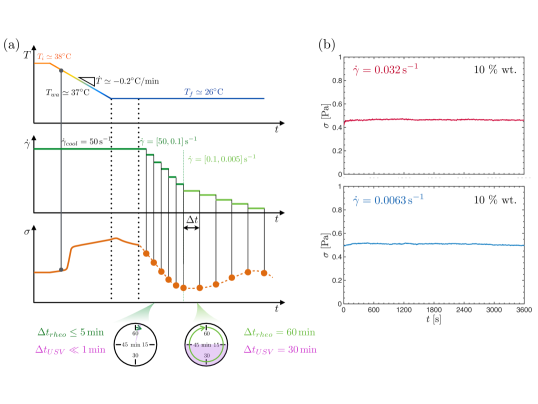
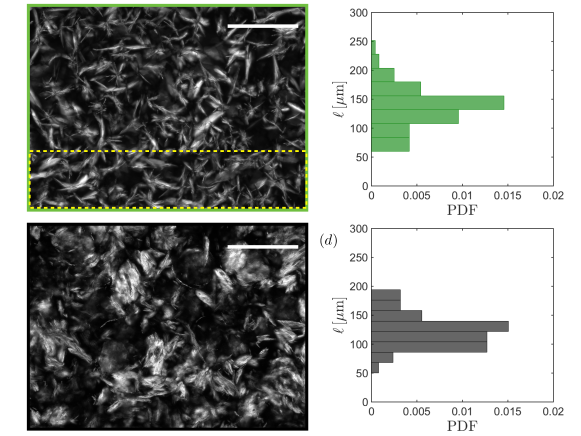
Materials and Methods.- Model paraffin gels are obtained by dissolving linear -paraffin chains in heavy mineral oil at high temperature () and at two different weight fractions ( and ). An example of the gel microstructure after cooling to ambient temperature is shown in Fig. 1(a). It consists of platelet-like paraffin particles of characteristic size that interact sterically and through interparticle crystalline bridges Singh et al. (2000); Miyazaki and Marangoni (2014). Each solution is poured still hot into a homemade Taylor-Couette cell with a gap mounted on a stress-controlled rheometer (AR-G2, TA Instruments) equipped with two-dimensional ultrasonic velocimetry Gallot et al. (2013). The small gap minimizes stress inhomogeneities that give rise to shear localization Andrade et al. (2020). The cylinder is covered with sandpaper and the outer cup is sandblasted. The gel is obtained by cooling the sample under shear at . A series of decreasing shear rate steps is then applied, starting from down to , during which velocity maps are acquired (see Supplemental Material for details).
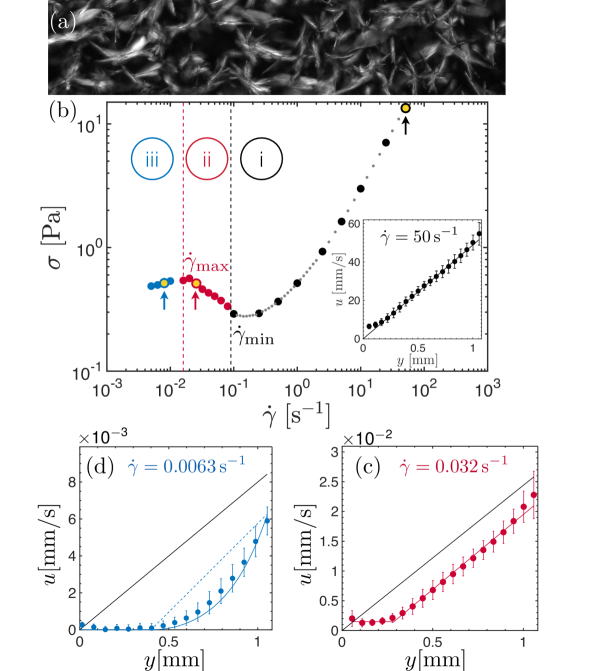
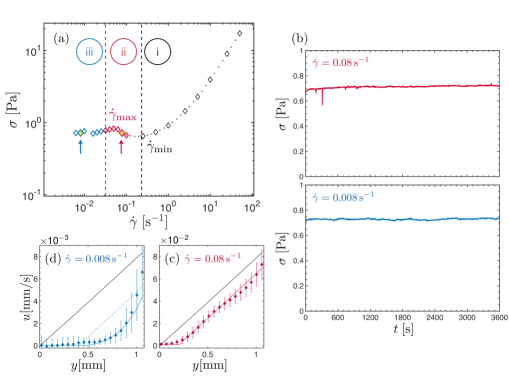
Results.- Figure 1(b) illustrates the steady-state flow behavior of the paraffin gel, measured by a decreasing ramp of shear rate steps. The flow curve shows a pronounced decreasing branch, which is delimited by two specific shear rates: , at which the stress goes through a local minimum, and , at which the stress goes through a weak local maximum. These two specific shear rates separate three different flow behaviors as confirmed by velocity profiles recorded simultaneously to the flow curve. For large shear rates, i.e., (regime ), the flow curve increases monotonically, the corresponding velocity profiles are homogeneous and wall slip remains negligible as expected for rough walls [see inset of Fig. 1(b)]. Intermediate shear rates, i.e., (regime ), correspond to the decreasing branch of the flow curve. The base flow is unstable and the velocity profiles separate into two regions, a flowing shear band close to the rotor (located at ) and an unyielded, solid-like region close to the stator [see Fig. 1(c) for ]. The extent of the arrested and unyielded band increases as the shear rate decreases, while the average local shear rate in the flowing band is always very close to the global imposed shear rate . Concomitantly, we measure noticeable slippage of the flowing band at the rotor with a slip velocity . Finally, for (regime ), the quiescent band takes up about half the gap and the velocity profile of the flowing band shows increasing curvature, while remains very close to [see Fig. 1(d) for ]. We emphasize that a gel shows the same phenomenology with larger values of and (see Supplemental Fig. S4), and that a steady state is reached for all the shear rates investigated, as supported by the stress evolution over time shown in Fig. S1(b) and S4(b) in Supplemental Material.
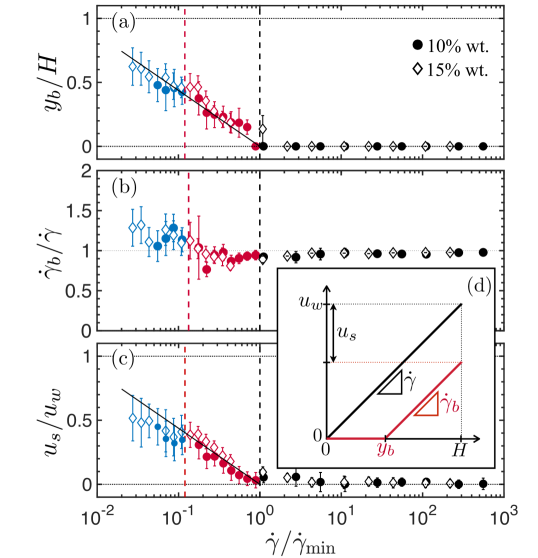
Figure 2 further analyzes the velocity profiles as a function of for both wax concentrations. Remarkably, all three observables defined so far and recalled in Fig. 2(d); namely, the normalized extent of the arrested band, [Fig. 2(a)], the normalized average local shear rate in the flowing band, [Fig. 2(b)] and the ratio of the slip velocity at the rotor to the rotor velocity [Fig. 2(c)], collapse on the same master curves. This hints at a generic underlying physical mechanism, in which both the arrested band and the relative slip velocity grow for decreasing shear rates below , while the flowing band always experiences the global imposed shear rate .
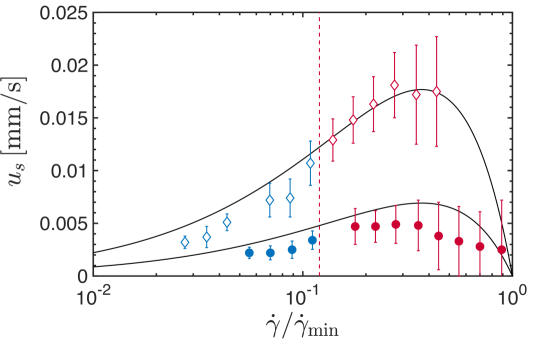
Modeling.- The above observations are in stark contrast with previous reports on steady-state shear banding, in which the flowing band is sheared at the critical shear rate and the “classical” lever rule, , holds for . These features have been associated with a non-monotonic underlying constitutive behavior, whose experimental signature is a stress plateau in the steady-state flow curve below Coussot et al. (2002a); Fielding (2007). In our experiments, the extent of the flowing band rather displays a nonlinear, logarithmic dependence on [Fig. 2(a)] and the average local shear rate in the flowing band coincides (within error bars) with the externally applied shear rate [Fig. 2(b)]. Moreover, the fact that strong wall slip goes along with shear-banded flows suggests that slippage is key to account for the present steady-state shear banding. Indeed, as shown in Fig. 3, the slip velocity displays non-trivial trends as a function of for both paraffin concentrations.
In order to rationalize our observations, we now revisit the premises of the classical lever rule. First, we note that the classical lever rule simply derives from the continuity of the velocity profile in the absence of wall slip Ovarlez et al. (2009); Divoux et al. (2016). Second, YSF obeying the lever rule are usually modeled using a structural parameter possessing a single time scale, which drives the dynamics of both the yield stress at rest and the plastic viscosity under flow Coussot et al. (2002b); Ragouilliaux et al. (2006); Ovarlez et al. (2009); Cheddadi et al. (2012). Yet, extensive experiments have shown that model paraffin gels as investigated here can build up a yield stress very fast, while their plastic viscosity changes over a much longer timescale Dimitriou et al. (2013); Mendes et al. (2015a, b); Geri et al. (2017); Andrade et al. (2020); not . Modeling this class of thixotropic YSF requires the introduction of two characteristic time scales, denoted respectively (over which the yield stress builds up in the unyielded region) and (over which the plastic viscosity changes in the flowing band), with . We hypothesize that when , the flowing band cannot adjust its viscosity fast enough to a fixed critical shear rate, here denoted . As a consequence, the local shear rate remains close to the global imposed shear rate , while the fluid preferentially starts to slip at the boundaries of the shear cell through a thin lubricating layer mainly composed of solvent.
Such a scenario can be supported by the following energy considerations based on the dissipation per unit volume averaged over the gap width, . In the case of shear banding following the classical lever rule, the stress reaches a plateau value Ovarlez et al. (2009); Schall and van Hecke (2010); Divoux et al. (2016) and , where is the width of the fluidized band. In contrast, if the velocity profile consists of a fluidized band with width sheared at , and a slip layer close to the rotor as shown by the red line in Fig. 2(d), then . Since to ensure continuity of the velocity profiles, the power dissipated in the classical shear-banding scenario is larger than in the case of shear banding combined with wall slip, at least when . Therefore, it may be energetically favorable for the system to access at least part of the states within the decreasing branch of the flow curve, provided that wall slip can occur and that there is a clear separation of time scales in the thixotropic YSF.
Within this framework, we can further derive expressions for both the extent of the shear band and the slip velocity as a function of the external imposed shear rate. We start by considering the slip layer as an additional band of finite thickness , with the same viscosity as the suspending oil, such that based on stress homogeneity within the gap. Perturbing the relation leads to:
| (1) |
Since , any microstructural change within the flowing band develops much more slowly than in the unyielded band where the yield stress is building up. Hence, for any given time interval , and, up to first order, we may neglect the contribution from . The term related to slip is also much smaller than the two remaining contributions because the slip layer thickness (typically by two to three orders of magnitude Salmon et al. (2003a, b); Meeker et al. (2004); Zhang et al. (2017); Péméja et al. (2019)) and , where is the ratio between the plastic viscosity of the gel and the oil viscosity. Based on these simplifications and substituting , the revised lever rule in differential form simply reads:
| (2) |
Upon integration of Eq. (2) from at which to at which , we obtain:
| (3) |
where is a dimensionless scaling factor that accounts for all the simplifications leading to Eq. (2), and the last equality results from velocity continuity, which imposes . Figure 2(a) shows that Eq. (3) provides excellent descriptions of the normalized extent of the arrested region and of the normalized slip velocity with in both regimes and [see black solid lines in Fig. 2(a,c)]. Interestingly, the same value of fits both data sets equally well, which confirms the consistency and robustness of the modified lever rule through a priori independent wall slip and bulk flow measurements. Finally, with , Eq. (3) reads , which accounts quantitatively very well for our experimental wall slip data [Fig. 3]. In particular, the non-monotonic evolution of with appears as a distinctive consequence of the modified lever rule.
Discussion and conclusion.- The predictions obtained from the generalized differential flow rule hold all along the decreasing branch of the flow curve, i.e., in regime , as well as in the limit of very low shear rates, i.e., in regime . In the latter regime, the flowing band no longer results in a uniform shear rate , but rather displays a strongly curved velocity profile [see Fig. 1(d)]. As detailed in the Supplemental Material, such a curvature can be interpreted as a result of cooperative effects when the extent of the flowing band gets smaller than a few times that of single wax particles Goyon et al. (2008); Bocquet et al. (2009); Seth et al. (2012); Serial et al. (2021). In particular, Supplemental Fig. S5 shows that a nonlocal model based on a diffusion equation for the fluidity of the YSF correctly fits the velocity profiles in the flowing band with a cooperativity length m, very close to the characteristic lateral dimension of paraffin platelets . Our results suggest that in spite of the confinement of the sample microstructure, the generalized lever rule remains valid in regime , provided one defines as the average of the local shear rate in the flowing band [see Fig. 2(b)]. Note that the condition implies that Eq. (3) should hold down to , which is approximately five times smaller than the minimum shear rate achieved in the present velocimetry experiments. Therefore, future work under even lower rates should assess whether Eq. (3) remains valid deeper into regime .
The approach proposed in this Letter quantitatively describes both wall slip and bulk flow heterogeneity in YSF for which the usual assumptions underpinning the classical lever rule do not hold. Still, our approach does not simply constitute an alternative to the standard steady-state shear-banding scenario in the absence of wall slip. It also encompasses the standard scenario under appropriate assumptions. Indeed, if and no wall slip occurs, the local shear rate can remain fixed at and Eq. (2) reduces to , hence upon integration we obtain , which boils down to the classical lever rule.
The possibility of the time scale separation and its microscopic origin appear as important yet often overlooked features in many thixotropic YSF, for which it is often assumed that the two time scales coincide. In the case of the present paraffin gels, the highly anisotropic, platelet-like shape of the interacting microcrystals that constitute the gel microstructure [see Fig. 1(a) and microscopy in Supplemental Material] is likely to account for a short time scale required to rebuild the solid-like properties compared to the time scale for the evolution of the plastic viscosity. As a result, the decreasing branch of the flow curve, which is mechanically unstable and usually observed only in transient responses Mas and Magnin (1994); Pignon et al. (1996); Grondin et al. (2008); Møller et al. (2009), becomes increasingly stabilized here.
The above discussion prompts us to also consider the case of unsteady heterogeneous flows under external shear. For instance, it is known that shear start-up flows of YSF and the corresponding yielding transition are accompanied by wall slip, even in presence of rough boundary conditions Gibaud et al. (2008); Divoux et al. (2011); Grenard et al. (2014). During these short periods of time, YSF, even with isotropic constituents, experience conditions similar to those reported in the present Letter, i.e., , which strongly suggests that wall slip also plays the role of an external degree of freedom during transient flows. In such framework, Eq. (3) provides a functional form for the scaling of the slip velocity with the externally imposed shear rate . This expression could be coupled to spatially-resolved models, e.g., soft glassy rheology or simpler fluidity models Fielding (2014), to account for wall slip in transient flows.
Finally, our results at low shear rates, where cooperative effects dominate the flow profile, call for incorporating wall slip into spatially-resolved models to further investigate the interplay between wall slip and nonlocal effects. To date, spatially-resolved models with cooperative effects that successfully account for both steady-state and complex long-lasting transient flows Benzi et al. (2016); Nicolas et al. (2018); Benzi et al. (2019, 2021), do not include wall slip. The present experimental results should serve as a benchmark for testing such generalized theories in an effort to fully understand flow processes under very small imposed shear rates. Above all, they provide a more general framework for understanding the complexity of heterogeneous flows of YSF of interest in many engineering, geophysical and biomedical applications.
Acknowledgments.- We are very thankful to Dr. Bavand Keshavarz for machining the rotor with great precision. We thank the MIT-France program for supporting this collaboration between MIT and ENS de Lyon. MG and GHM are also grateful to Chevron ETC and the MIT Energy Initiative for supporting part of this research.
References
- Bonn et al. (2017) D. Bonn, M. M. Denn, L. Berthier, T. Divoux, and S. Manneville, Rev. Mod. Phys. 89, 035005 (2017).
- Persello et al. (1994) J. Persello, A. Magnin, J. Chang, J. M. Piau, and B. Cabane, J. Rheol. 38, 1845 (1994).
- Divoux et al. (2010) T. Divoux, D. Tamarii, C. Barentin, and S. Manneville, Phys. Rev. Lett. 104, 208301 (2010).
- Coussot (2014) P. Coussot, J. Non-Newton. Fluid Mech. 211, 31 (2014).
- Divoux et al. (2016) T. Divoux, M. A. Fardin, S. Manneville, and S. Lerouge, Annu. Rev. Fluid Mech. 48, 81 (2016).
- Andrade and Coussot (2019) D. E. V. Andrade and P. Coussot, Soft Matter 15, 8766 (2019).
- Viasnoff and Lequeux (2002) V. Viasnoff and F. Lequeux, Phys. Rev. Lett. 89, 065701 (2002).
- Cloitre et al. (2000) M. Cloitre, R. Borrega, and L. Leibler, Phys. Rev. Lett. 85, 4819 (2000).
- Bonn et al. (2002) D. Bonn, S. Tanase, B. Abou, H. Tanaka, and J. Meunier, Phys. Rev. Lett. 89, 015701 (2002).
- Coussot et al. (2002a) P. Coussot, J. Raynaud, F. Bertrand, P. Moucheront, J. Guilbaud, H. Huynh, S. Jarny, and D. Lesueur, Phys. Rev. Lett. 88, 218301 (2002a).
- Fielding (2007) S. M. Fielding, Soft Matter 3, 1262 (2007).
- Ovarlez et al. (2009) G. Ovarlez, S. Rodts, X. Chateau, and P. Coussot, Rheol. Acta 48, 831 (2009).
- Fall et al. (2010) A. Fall, J. Paredes, and D. Bonn, Phys. Rev. Lett. 105, 225502 (2010).
- Fielding (2014) S. M. Fielding, Rep. Prog. Phys. 77, 102601 (2014).
- Buscall (2010) R. Buscall, J. Rheol. 54, 1177 (2010).
- Cloitre and Bonnecaze (2017) M. Cloitre and R. T. Bonnecaze, Rheol. Acta 56, 283 (2017).
- Derzsi et al. (2017) L. Derzsi, D. Filippi, G. Mistura, M. Pierno, M. Lulli, M. Sbragaglia, M. Bernaschi, and P. Garstecki, Phys. Rev. E 95, 052602 (2017).
- Gibaud et al. (2008) T. Gibaud, C. Barentin, and S. Manneville, Phys. Rev. Lett. 101, 258302 (2008).
- Gibaud et al. (2009) T. Gibaud, C. Barentin, N. Taberlet, and S. Manneville, Soft Matter 5, 3026 (2009).
- Mansard et al. (2014) V. Mansard, L. Bocquet, and A. Colin, Soft Matter 10, 6984 (2014).
- Goyon et al. (2008) J. Goyon, A. Colin, G. Ovarlez, A. Ajdari, and L. Bocquet, Nature 454, 84 (2008).
- Bocquet et al. (2009) L. Bocquet, A. Colin, and A. Ajdari, Phys. Rev. Lett. 103, 036001 (2009).
- Goyon et al. (2010) J. Goyon, A. Colin, and L. Bocquet, Soft Matter 6, 2668 (2010).
- Singh et al. (2000) P. Singh, R. Venkatesan, H. S. Fogler, and N. Nagarajan, AIChE journal 46, 1059 (2000).
- Miyazaki and Marangoni (2014) Y. Miyazaki and A. G. Marangoni, Mater. Res. Express 1, 025101 (2014).
- Gallot et al. (2013) T. Gallot, C. Perge, V. Grenard, M.-A. Fardin, N. Taberlet, and S. Manneville, Rev. Sci. Instrum. 84, 045107 (2013).
- Andrade et al. (2020) D. E. Andrade, M. Ferrari, and P. Coussot, J. Non-Newton. Fluid Mech. 279, 104261 (2020).
- Coussot et al. (2002b) P. Coussot, Q. Nguyen, H. Huynh, and D. Bonn, Phys. Rev. Lett. 88, 175501 (2002b).
- Ragouilliaux et al. (2006) A. Ragouilliaux, B. Herzhaft, F. Bertrand, and P. Coussot, Rheol. Acta 46, 261 (2006).
- Cheddadi et al. (2012) I. Cheddadi, P. Saramito, and F. Graner, J. Rheol. 56, 213 (2012).
- Dimitriou et al. (2013) C. J. Dimitriou, R. H. Ewoldt, and G. H. McKinley, J. Rheol. 57, 27 (2013).
- Mendes et al. (2015a) R. Mendes, G. Vinay, G. Ovarlez, and P. Coussot, J. Non-Newton. Fluid Mech. 220, 77 (2015a).
- Mendes et al. (2015b) R. Mendes, G. Vinay, G. Ovarlez, and P. Coussot, J. Rheol. 59, 703 (2015b).
- Geri et al. (2017) M. Geri, R. Venkatesan, K. Sambath, and G. H. Mckinley, J. Rheol. 61, 427 (2017).
- (35) For a similar chemical composition, fits to an elastoviscoplastic model of thixotropic yield stress fluids lead to s and 10 s Geri et al. (2017). Note that the longer time scale is much smaller than the one-hour duration of each step at a given shear rate, which allows us to consider that a steady state is reached for all in regime .
- Schall and van Hecke (2010) P. Schall and M. van Hecke, Annu. Rev. Fluid Mech. 42, 67 (2010).
- Salmon et al. (2003a) J.-B. Salmon, S. Manneville, and A. Colin, Phys. Rev. E 68, 051503 (2003a).
- Salmon et al. (2003b) J.-B. Salmon, L. Bécu, S. Manneville, and A. Colin, Eur. Phys. J. E 10, 209 (2003b).
- Meeker et al. (2004) S. P. Meeker, R. T. Bonnecaze, and M. Cloitre, Phys. Rev. Lett. 92, 198302 (2004).
- Zhang et al. (2017) X. Zhang, E. Lorenceau, P. Basset, T. Bourouina, F. Rouyer, J. Goyon, and P. Coussot, Phys. Rev. Lett. 119, 208004 (2017).
- Péméja et al. (2019) J. Péméja, B. Géraud, C. Barentin, and M. Le Merrer, Phys. Rev. Fluids 4, 033301 (2019).
- Seth et al. (2012) J. R. Seth, C. Locatelli-Champagne, F. Monti, R. T. Bonnecaze, and M. Cloitre, Soft Matter 8, 140 (2012).
- Serial et al. (2021) M. R. Serial, D. Bonn, T. Huppertz, J. A. Dijksman, J. van Der Gucht, J. van Duynhoven, and C. Terenzi, ArXiv e-prints (2021).
- Mas and Magnin (1994) R. Mas and A. Magnin, J. Rheol. 38, 889 (1994).
- Pignon et al. (1996) F. Pignon, A. Magnin, and J.-M. Piau, J. Rheol. 40, 573 (1996).
- Grondin et al. (2008) P. Grondin, S. Manneville, J.-L. Pozzo, and A. Colin, Phys. Rev. E 77, 011401 (2008).
- Møller et al. (2009) P. Møller, A. Fall, V. Chikkadi, D. Derks, and D. Bonn, Philos. Trans. R. Soc. A 367, 5139 (2009).
- Divoux et al. (2011) T. Divoux, C. Barentin, and S. Manneville, Soft Matter 7, 9335 (2011).
- Grenard et al. (2014) V. Grenard, T. Divoux, N. Taberlet, and S. Manneville, Soft Matter 10, 1555 (2014).
- Benzi et al. (2016) R. Benzi, M. Sbragaglia, M. Bernaschi, S. Succi, and F. Toschi, Soft Matter 12, 514 (2016).
- Nicolas et al. (2018) A. Nicolas, E. E. Ferrero, K. Martens, and J.-L. Barrat, Rev. Mod. Phys. 90, 045006 (2018).
- Benzi et al. (2019) R. Benzi, T. Divoux, C. Barentin, S. Manneville, M. Sbragaglia, and F. Toschi, Phys. Rev. Lett. 123, 248001 (2019).
- Benzi et al. (2021) R. Benzi, T. Divoux, C. Barentin, S. Manneville, M. Sbragaglia, and F. Toschi, Phys. Rev. Lett. 127, 148003 (2021).
- Smith (1953) A. E. Smith, J. Chem. Phys. 21, 2229 (1953).
A generalized lever rule for shear banding of yield stress fluids
Supplemental Material
I Composition and preparation of paraffin gels
Model paraffin gels are obtained by dissolving a single commercial paraffin wax with melting point between and (Sigma Aldrich , ASTM D ) in heavy mineral oil (Sigma Aldrich, ). Solid wax is weighed at room temperature, then added to the liquid mineral oil and the mixture is continuously stirred at high temperature () overnight. We prepare two large batches containing and in paraffin wax, which are used for all subsequent experiments. Before each experiment, the whole batch is heated back to on a hot stirring plate and the desired amount of sample is poured inside the Taylor-Couette geometry right before starting the cooling ramp (see Section II below for the detailed protocol). Under these conditions, well above the wax appearance temperature for both the and concentrations, the samples are purely Newtonian at the beginning of each experiment. Therefore, they do not bear any memory of their previous thermal or shear history. Upon cooling, the paraffin chains precipitate out of solution and crystallize, forming discotic platelets with lateral dimensions that strongly depend on the cooling rate and a typical thickness that corresponds roughly to the length of the paraffin chains Smith (1953); Singh et al. (2000) (see Section III below for details on the microstructure). Crystalline bridges as well as the steric interaction among these discotic particles give rise to an elastic network and to a complex nonlinear response under shear Singh et al. (2000); Miyazaki and Marangoni (2014).
II Experimental setup and protocol
Our rheo-velocimetry setup is described at length in Ref. Gallot et al. (2013) and specific details about the analysis of velocity data are given in Section IV below. In the present work, the Taylor-Couette cell (or concentric-cylinder shear cell) consists of an outer fixed cylinder (stator) made of sandblasted PMMA and of an inner rotating cylinder (rotor) made of Delrin covered with sandpaper of surface roughness . The diameter of the stator is and the working gap is , small enough to guarantee a quasi-homogeneous stress field across the gap. We deliberately choose a large roughness, which is usually supposed to minimize wall slip, to highlight the fact that wall slip sets in during the shear-banding regime in spite of rough boundary conditions. The fact that no wall slip is detected in regime even very close to confirms the effectiveness of the sandpaper in suppressing slip whenever the velocity profile is stable (see Fig. 1 in the main text). We checked that the shear-banding phenomenology reported here is robust and also observed when both surfaces are sandblasted or smooth, although experiments performed without sandpaper clearly show an additional significant slip velocity even in regime .
Supplemental Figure S1(a) depicts the protocol followed in the experiments presented in the main text. Due to the thermal sensitivity of the ultrasound probe, the water bath surrounding the Taylor-Couette cell and the probe must be kept at temperatures lower than . Therefore, the water bath was first stabilized at before pouring the paraffin–oil mixture heated at in the Taylor-Couette cell. The sample is subsequently sheared at during the whole cooling process. Once the sample temperature equilibrates at , the chiller of the water bath is set to cool the sample with a cooling rate until a final temperature . After reaching , the mixture is sheared for an additional . Finally, the steady-state flow curve is measured by progressively decreasing the shear rate. From down to , the shear rate is swept down logarithmically with 10 points per decade between and then with 20 points per decade between and . For each applied shear rate, the rheometer waits for the stress to vary by less than 3% over (with a time limit per point set to ) before decreasing the shear rate. From down to , a constant shear rate is imposed over . As seen in Supplemental Fig. S1(b) for the same shear rates as in Fig. 1 in the main text, this protocol allows us to ensure that all initial transients have died out even at the lowest shear rates while accommodating for the time needed for acquiring ultrasound velocimetry maps at steady state, which ranges from much less than 1 min at the highest shear rate to about 30 min at .
III Polarized light microscopy of paraffin gels
Since paraffin crystallites are birefringent, we use polarized light microscopy to visualize the gel microstructure. A series of images is recorded at room temperature using an ABRIO (CRi, Inc.) camera and software on a Nikon TE-2000U inverted microscope using a objective. Two types of preparation protocols are employed in order to compare the morphology of single wax crystals in the case of static cooling or dynamic cooling (i.e. cooling while also under shear).
For the static case, a small visualization chamber is made by laying three stripes (approximately ) of Parafilm on a glass slide (). A cover glass () is then sealed on top of the Parafilm by heating the slide on a hot plate at about , which makes the Parafilm adhesive. Next, the liquid paraffin–oil mixture is pipetted in between the bottom slide and the cover glass at the same temperature of . Finally, the cell is quickly placed on a Peltier stage to impose the same cooling rate as that used in the rheo-velocimetry experiments, namely , until room temperature is reached.
For the dynamic case, the melted gel sample is spread on a glass slide () in contact with the Peltier stage of a stress-controlled rheometer (DHR-3, TA Instruments) heated at . Shear is applied thanks to a parallel plate geometry of diameter covered with sandpaper (same roughness as in the velocimetry experiments) and within a gap of . The sample is then cooled under a constant shear rate at a cooling rate until room temperature is reached. At the end of the process, we raise the head of the rheometer and transfer the glass slide directly onto the microscope for visualization.
Images representative of both cooling processes are reported in Supplemental Fig. S2(a) for the static case and Supplemental Fig. S2(c) for the dynamic case. Although the crystallites are arranged very differently in the two cases, most probably due to the flow generated when raising the shearing tool in the last step of the dynamic case, a quantitative analysis of a series of images show very similar distributions of the crystallite characteristic size [see Supplemental Fig. S2(b,d)] and an average size in both cases.
IV Analysis of velocimetry data
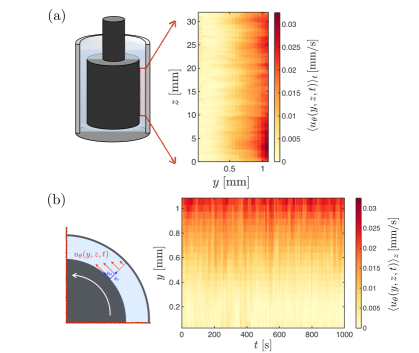
As explained in full details in Ref. Gallot et al. (2013), our ultrafast ultrasound imaging technique outputs maps of the tangential velocity component as a function of the distance to the stator, of the vertical position along the ultrasonic probe, and of time . Such velocity maps result from the cross-correlation of successive ultrasound images of the material under shear recorded from the emission and back-scattering of plane pulses sent with a repetition frequency that is inversely proportional to the applied shear rate. In the case of the present paraffin gels with wax concentrations and , the wax crystallites scatter ultrasound efficiently enough that ultrasound images can be obtained directly, without requiring any seeding of the samples by acoustic contrast agents.
Supplemental Figure S3 shows an example of velocity data recorded on the paraffin gel within the decreasing branch of the flow curve (). As seen in Supplemental Fig. S3(a), the velocity field averaged over for the whole acquisition window does not show any significant variation along the vertical direction . Similarly, the velocity averaged over and presented as a function of and in the spatiotemporal diagram of Supplemental Fig. S3(b) fluctuates around a mean without any systematic trend over s. Analogous maps are produced for all other shear rates under study, which confirms the absence of more complex flow behaviour besides shear banding and wall slip. This also allows us to focus only on the velocity profiles averaged both in time and along the vorticity direction.
To quantify the average local shear rate in the flowing band , the extent of the unyielded band and the slip velocity , each velocity profile (averaged over ) is fitted to a linear profile in the two bands (with zero slope for the unyielded band). The slope of each fitted flowing band provides an estimate for and the intercept between the two linear profiles an estimate for , while the slip velocity is extracted by taking the difference between the wall velocity and the velocity calculated based on the fitted linear profile extrapolated at the wall. Error bars in all velocity profiles and calculated quantities are characteristic of the fluctuations in time, but fluctuations in the vorticity direction are very similar. For shear rates in regime , instead of using a linear fit, the curved velocity profile in the flowing band is fitted for by a polynomial of order 3, with the polynomial coefficients. From these, is obtained as the average local shear rate, i.e. , with .
V Rheology of a paraffin gel
Figure S4 shows some of the results used to extract the data for the paraffin gel shown with empty diamonds in Figs. 2 and 3 in the main text. It is clear that the rheology of this gel is very similar to that of the gel: we observe the same regimes in the flow curve [Fig. S4(a)], which correspond to the same types of velocity profiles [Fig. S4(c,d)] as in Fig. 1 in the main text. As seen from stress evolution over time in Fig. S4(b), a steady state is reached even at very low shear rates.
VI Flow cooperativity at very low shear rates
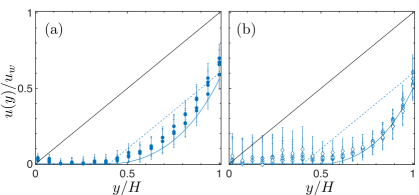
Supplemental Figure S5 gathers the normalized velocity profiles recorded in regime for both the and paraffin gels. When compared to velocity profiles in regime [see Fig. 1(c) in the main text and Supplemental Fig. S4], it is clear that the flowing region shows a much more pronounced curvature in regime , recalling the profiles observed in confined suspensions when spatial cooperativity is present Seth et al. (2012); Goyon et al. (2008); Bocquet et al. (2009). Inspired by these results, we solve a nonlocal equation for the local plastic fluidity to derive an expression for the velocity profile in the flowing band, i.e. for . This nonlocal equation reads
| (S1) |
where is the flow cooperativity length and is the bulk fluidity. In our case, since the material outside the flowing band is arrested, we impose and define at the moving wall, which leads to:
| (S2) |
with . Further integrating and imposing yields:
| (S3) |
where . In Supplemental Fig. S5, we fit the experimental data to Eq. (S3) in order to determine an estimate of the cooperativity length . In view of the large experimental uncertainty resulting from the very low velocity levels, we focus on the velocity profiles averaged over all shear rates available in regime . Since is not known a priori, we also have to treat as a fitting parameter. We find , which is comparable to the dimension of the wax crystallites, while and for both gel concentrations. The agreement between theory (blue solid lines) and experiments suggests that nonlocal effects can indeed explain the curvature observed on the velocity profiles in regime .