Now at ]Dep. Physik, ETH Zürich
Measurement of the SD5/2 transition in hydrogen
Abstract
We present a measurement of the hydrogen SD5/2 transition performed with a cryogenic atomic beam. The measured resonance frequency is kHz, which corresponds to a relative uncertainty of . Combining our result with the most recent measurement of the SS transition, we find a proton radius of fm and a Rydberg constant of m-1. This result has a combined 3.1 disagreement with the CODATA 2018 recommended value. Possible implications of the discrepancy are discussed.
Spectroscopy of hydrogen, the simplest element, was pivotal in the development of quantum theory and now plays a crucial role in the determination of fundamental constants and precision tests of fundamental theory [1, 2, 3]. Due to its simplicity, theoretical calculations of the energy levels of hydrogen can be made with high accuracy, and deviations from theoretical predictions could suggest the presence of new physics [4, 5, 6, 7, 8].
The energy levels of hydrogen can be described by the following expression, given by [9, 10],
| (1) |
The first term, which depends only on the principle quantum number , is the gross structure contribution from nonrelativistic quantum theory. The second term accounts for quantum electrodynamics (QED) and relativistic recoil corrections [3, 11]. The last term is the leading correction to the states arising from the finite size of the nucleus, where is the root-mean-square charge radius of the proton. By measuring two hydrogen transitions, the Rydberg constant, , and in Eqn. (1) can be determined. While is a function of other physical constants, such as the fine-structure constant and electron-to-proton mass ratio, each of these have been measured with sufficient precision in other experiments to not limit the determination of and . Therefore, assuming that the QED corrections are accurately applied, a consistent extraction of and from spectroscopic measurements is expected.
Tension arose when the value of obtained from muonic hydrogen was compared to the value determined from hydrogen spectroscopy and electron-proton elastic scattering data. This led to the “proton-radius puzzle” [12, 13, 14, 15]. This discrepancy has spurred further interest in precision spectroscopy on hydrogen, and several new results have been recently published [9, 16, 17, 10].
The CODATA 2014 recommended value, which is historically significant in the discussion of the proton-radius puzzle, is strongly influenced by previous measurements of the two-photon SS/D transitions [18, 19]. While remeasuring any of these transitions produces data relevant to the proton radius puzzle, the 2S1/2-8D5/2 transition is particularly attractive as it possesses the largest two-photon matrix element. Therefore, we have remeasured the SD5/2 transition and report a value that has a three-times smaller uncertainty as compared with the previous best measurement [19].
Our measurement has benefited from several technological advances. Improvements in laser technology afford us both the optical frequency comb to determine absolute optical frequencies, and the ability to optically excite a sufficient population of hydrogen atoms to the metastable 2S state, as in [9]. By generating metastable atoms optically via the two-photon 1S1/2-2S1/2 transition, instead of by electron bombardment, we are able to perform spectroscopy on a cryogenic beam of hydrogen atoms, reducing velocity-dependent systematics and allowing for the selective population of the S hyperfine manifold. Therefore, optical production of an appreciable flux of metastable hydrogen represents a substantial improvement over previous measurements of this transition. We have also directly characterized the velocity distribution, reducing uncertainty in velocity-related systematics [20]. Additionally, our apparatus provides a geometrically-constrained interaction between the hydrogen atoms and the spectroscopy light.
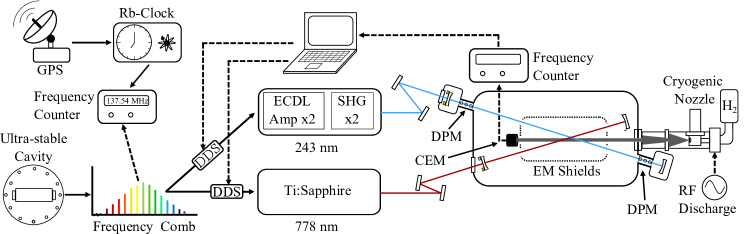
Our experimental apparatus has not been fully described elsewhere. We generate a cryogenic beam of hydrogen by disassociating molecular hydrogen in a microwave discharge followed by a cryogenic nozzle [20]. At a distance of 1.5 m away from the nozzle, the atoms interact with 243 nm radiation to generate S population. The 243 nm radiation [21] is enhanced in an in-vacuum optical cavity [22] at a angle from the atomic beam. The UV cavity mirrors are kept in a mTorr oxygen environment to prevent UV degradation, and a pair of differential pumping manifolds separates the mirror chambers from the spectroscopy region. The metastable 2S atoms then travel 15 cm before intersecting with 778 nm spectroscopy light from a Coherent-899 Ti:Sapphire ring laser, which is also enhanced in an in-vacuum optical cavity at a angle from the atomic beam. The linearly polarized 778 nm radiation excites the 2S8D5/2 transition. Population in the 8D5/2 state will rapidly decay – predominantly to the 2P state which will then decay to the 1S ground state. Therefore, by driving the 2S8D5/2 transition, we effectively quench the metastable population. The entire spectroscopic volume is within a pair of concentric magnetic shields, which is itself inside of a Faraday cage to mitigate Zeeman shifts and DC Stark shifts. The remaining metastable population not quenched by the 778 nm radiation is detected 15 cm past the SD5/2 interaction volume by a channel electron multiplier. The absolute frequencies of the 243 nm and 778 nm radiation are determined by phase-locking the lasers to a coherent Er-fiber optical frequency comb whose repetition rate is continuously counted by a GPS-disciplined, Rb time base and whose beat note is phase locked to an RF synthesizer. See Fig. 1 for a schematic of our experimental apparatus.
The UV-enhancement cavity is about 1.8 m long and is constructed with a pair of 1 m radius of curvature mirrors – the effective beam radius is approximately m at the intersection with the atomic beam. Between 1% and 10% of atoms in the excitation volume are driven to the S state. The spectroscopy light is also enhanced in an in-vacuum optical cavity to drive appreciable population to the 8D5/2 state and the optical power is measured by continuously monitoring the cavity transmission with a photodiode.
A direct digital synthesizer (DDS) sets the beat frequencies between the comb and the other laser systems – the DDS itself is referenced to a 10 MHz signal from a GPS-disciplined, Rb time standard. To verify that our absolute frequency calibration is accurate, we locally counted a cesium-referenced 5 MHz signal at the NIST WWVB station in Fort Collins, Colorado with the Rb-time base and frequency counter, finding an accuracy within the expectations of a GPS-disciplined oscillator [23] (a fractional accuracy of ).
To scan the SD5/2 transition, a set of 25 evenly spaced frequencies in a 3 MHz span around the resonance are chosen. This set of 25 frequency points is randomly sequenced. For each scan of the line, we fit the measured lineshape with
| (2) |
where ’s correspond to Lorentzian functions of appropriate relative magnitude centered on the hyperfine manifold, and are fit parameters for the amplitude of the metastable decrease, linewidth, and effective centroid frequency, respectively. Further details on the fitting function and other possible lineshape distortions (including quantum interference [24]) can be found in the supplementary material (SM).
We have developed numeric lineshape models, which take into account the geometry and dynamics of the atom-light interaction, AC and DC Stark effects, velocity distribution, repopulation of the metastable state, and the second-order Doppler shift (see SM). The numeric models are primarily used to quantify the DC Stark effect, but are also used to verify the accuracy of fitting lineshapes with Eqn. (2).
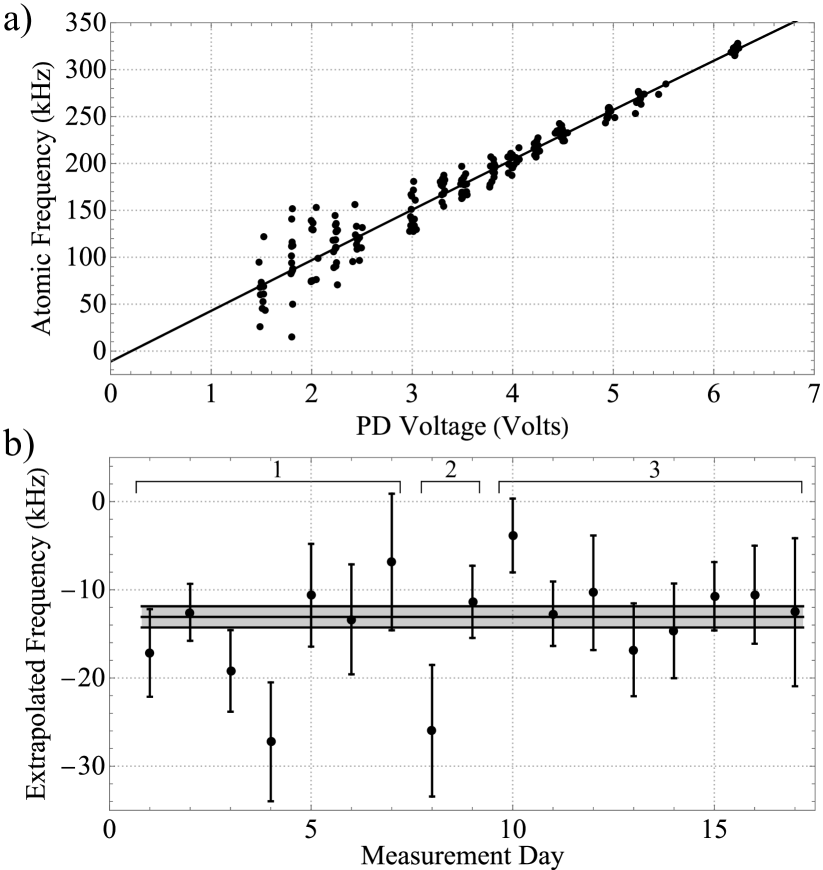
The AC Stark shift is our leading systematic, with typical shifts in the range of 50-300 kHz. To properly account for this effect, we drive the resonance with a range of intensities, quenching between 15% and 60% of the metastable population, and extrapolate to zero laser power. This extrapolation is similar to previous measurements of the 2S-S/D transitions [25, 26, 19]. For each day of data collection, a single extrapolation is generated (an example is shown in Fig. 2).
The AC Stark effect introduces a shift in the resonance frequency of the SD5/2 transition that is linear with intensity [27]. However, extrapolations on an ensemble of metastable atoms acquire a slight nonlinearity due to the different intensity profiles sampled by metastable atoms with different trajectories. As atoms following trajectories sampling the most intense portions of the 778 nm cavity mode begin to saturate, atoms along trajectories which sample lower intensities begin to contribute relatively more to the determination of the line center. This effect was present in the previous measurement of the SD5/2 transition [26, 19], though the nonlinearity present in our extrapolations is smaller due to the more stringent geometric constraints on the atomic trajectories in our apparatus.
While the nonlinearity is relatively small, ignoring it shifts the extrapolated resonance frequency by several kHz. Sampling an appreciable range of intracavity laser powers is required to properly determine the nonlinearity. From analytic considerations we have found that the nonlinearity acquired due to this spatial distribution is predominantly cubic and that this conclusion does not depend on the metastable spatial distribution (see SM); both of these results are strongly supported by our numeric lineshape models. Seventeen suitable extrapolations form the basis of our data set, and are shown in Fig. 2.
Our second leading systematic is due to the DC Stark effect, which leads to shifts and distortions of the SD5/2 line. We have taken steps to passively mitigate stray fields by enclosing the entire metastable excitation and spectroscopic volume within a Faraday cage coated in colloidal graphite [29]. Due to the near degeneracy of the 8D, 8P, and 8F manifolds, the transition is very sensitive to static fields with shifts of 12 kHz/(V/m)2. Higher lying -manifolds are even more sensitive to the presence of static fields due to the narrower natural linewidths, increasing degeneracy of the states, and larger dipole matrix elements between the states. This makes the line distortions of transitions to higher -states a sensitive probe of the stray fields [19].
From measurements of the SD5/2 lineshape distortion, we have observed that the stray fields are stable day-to-day as long as the system remains under vacuum, and that the stray field orientation is parallel with the atomic beam. The orientation of the stray field was determined by varying the excitation light polarization and comparing the shift and distortion of the line. Between batches of data collection on the SD5/2 line, the chamber was vented, leaving the possibility of stray field variation within the data set. Therefore, we also measured the electric field strength for each day in situ by averaging several SD5/2 scans from a single day and at similar 778 nm laser power. We then fit this averaged line with the numeric model to match the subtle line distortion and extract the stray DC field (see SM for additional detail). Fig. 3 shows the determined electric field for each measurement day. We find the average static field for each batch of data and use that field strength to determine the shift for that set of data.
The coupling introduced by the DC electric field causes a quadratic shift due to nearby dipole-allowed transitions and a lineshape distortion due to the mixing between the nearly degenerate D5/2 and F5/2 states [19]. Since the lines are fit with the simple analytic function given in Eqn. (2), the distortion also produces an additional shift. For each of the three measured electric fields shown in Fig. 3, the resulting DC Stark shift is determined with the numeric model. Then, the appropriate correction for each extrapolated resonance frequency in a given batch is applied. The three batches of electric field corrections are -1.92(0.32) kHz, -5.45(0.54) kHz, and -4.43(0.37) kHz, respectively. Due to the statistical contribution of each batch to the final dataset, the weighted DC Stark correction for the entire measurement is -3.54(0.37) kHz.

The correction of -3.54(0.37) kHz assumes a stray field which is perpendicular to the spectroscopy light polarization. However, we cannot completely exclude a small parallel field, which can modify the required correction by up to 0.65 kHz. Additionally, from the numeric model, we find there is a small amount of cross-talk between the AC extrapolation and DC Stark effect. This cross-talk amounts to a -0.35 kHz correction to the DC Stark shift, and we assign the full 0.35 kHz shift as the associated uncertainty. Since the systematic shifts associated with the cross-talk effect, the possibility of non-perpendicular fields, and the statistical variance of the DC field correction are highly correlated, we combine their uncertainties linearly, and obtain a net DC Stark correction of -3.89(1.36) kHz.
We believe the vacuum pressure is limited by water, which has an intrinsic dipole moment. During a collision with a water molecule, a hydrogen atom experiences a varying electric field which can drive population in the 8D state to nearby states, quenching the 8D state and broadening the line [30]. We have employed Monte Carlo simulations of these H-H2O collisions to estimate the shift and broadening, similar to [31]. From these simulations we have found that any associated pressure shifts are below the 1 Hz level and insignificant at our current level of precision.
Due to the two-photon excitation of the SD5/2 transition in an optical cavity, the first-order Doppler shift is effectively absent. The second-order Doppler shift remains, given by , for atomic velocity . An advantage of our apparatus is the ability to directly characterize the hydrogen and metastable hydrogen velocity distributions via a time-of-flight measurement [20]. From such measurements, we have found the metastable velocity distribution is well approximated by , with and the required correction is kHz.
From the AC extrapolation data, we recover a 2S8D5/2 hyperfine centroid of kHz. The DC Stark correction shifts this centroid by kHz to kHz. We then apply minor corrections in our uncertainty budget as shown in Table 1. A summary of the treatment of these corrections may be found in the SM. With all the systematic corrections accounted for, we find a SD5/2 resonance frequency of
| (3) |
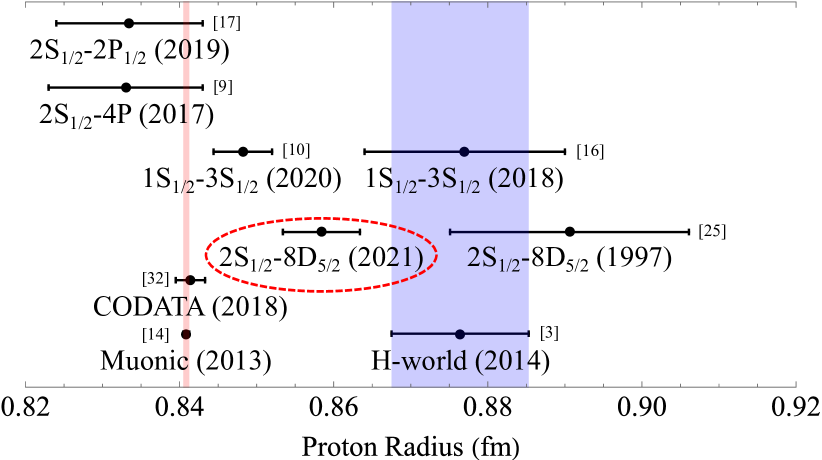
Combining our result with the SS1/2 value [32], we obtain fm, and m-1. Our obtained is presented alongside a selection of recent determinations of from spectroscopic results in Fig. 4. Our value is 3.1 combined standard deviations from the latest CODATA recommended value [33].
| (kHz) | (kHz) | |
| Stark Corrected | 770649561571.01 | 1.82 |
| 2Order Doppler | 0.73 | 0.10 |
| Zeeman Effect | 0 | 0.56 |
| Frequency Calibration | -0.40 | 0.47 |
| Black-body Radiation | -0.49 | 0.16 |
| Pressure Shifts | 0 | |
| 8D5/2 Hyperfine Structure | 0 | 0.03 |
| Photodiode Imperfections | 0 | 0.32 |
| Incoherent Line Pulling | 0 | |
| Light Force Shift | ||
| Total: Minor corrections | -0.16 | 0.82 |
| Hyperfine Centroid | 770649561570.9 | 2.0 |
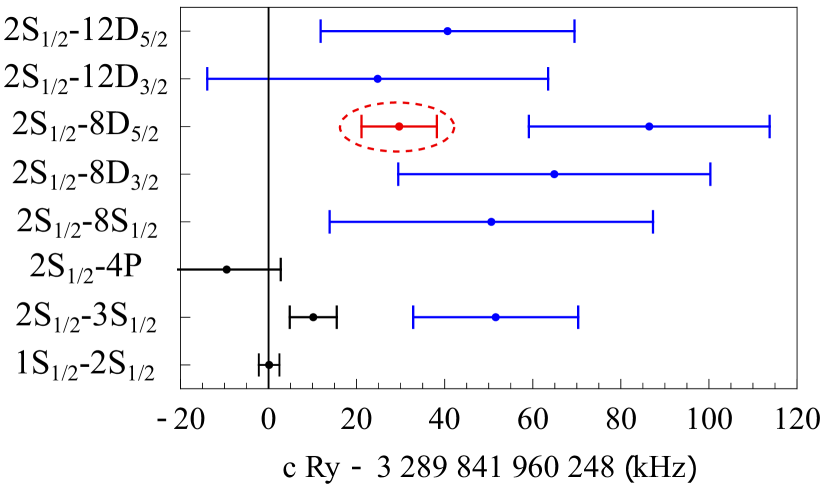
While the data shown in Fig. 4 combines the SS1/2 measurement [32] with other hydrogen spectroscopy to extract , it is also interesting to use the value of determined from muonic hydrogen [14] as input data for Eqn. 1. This is a compelling approach considering that a recent measurement of the Lamb shift in normal hydrogen is in agreement with the muonic result [17]. With that, a single measured interval in hydrogen is sufficient to extract . The result of this analysis for a selection of the most precise hydrogen laser spectroscopy data is shown in Fig. 5. The uncertainty for the Rydberg constant determination from the 1S1/2-2S1/2 transition shown in Fig. 5 is almost entirely due to the theoretical uncertainty of the state. In order to avoid including this correlated uncertainty in the 1S1/2-3S1/2 determinations [16, 10], we have subtracted the very precisely determined 1S1/2-2S1/2 transition frequency [32] to obtain 2S1/2-3S1/2 intervals.
As can be seen from the Fig. 5, there is a general trend towards larger Rydberg constant when using experimentally determined intervals between states with larger . It is interesting to note that hydrogen spectroscopy can provide a test for massive bosons that provide an additional coupling between the nucleus and electron [7, 8]. Such bosons introduce a potential with finite range (a Yukawa potential) which affects certain -states in hydrogen more strongly than others, producing an -dependence when extracting . As shown in the SM, the variation in Rydberg constant tends to decrease as the of either the upper or lower state increases. We found that the reduced for the data shown in Fig. 5 decreases from 4.0 to 2.0 with the addition of a Yukawa potential with a length scale of 34 . Therefore, while the perturbation from such a potential can drastically reduce the inconsistency within the dataset shown in Fig. 5, it does not eliminate it.
Future investigations of SS/D transitions in hydrogen are attractive due to the narrow natural lines afforded by such states and the convenience of the laser wavelengths required to drive the transitions. Additionally, the current -dependence of the Rydberg constant extractions as shown in Fig. 5 provides a compelling case for further measurements of transitions to relatively high as a search for new physics [7, 8]
Acknowledgements.
We gratefully acknowledge useful conversations with J. Berger, S. M. Brewer, A. Grinin, S. A. Lee, L. Maisenbacher, R. Pohl, J. L. Roberts, Th. Udem, and V. Wirthl. We would like to thank the NIST WWVB team for accomodating our check of the GPS disciplined Rb time standard as described in the letter. Finally we gratefully acknowledge funding for this measurement through the NIST Precision Measurement Grant (60NANB16D270), and the NSF CAREER Award (1654425).References
- [1] S. G. Karshenboim, Precision physics of simple atoms: QED tests, nuclear structure and fundamental constants, Phys. Rep. 422, 1 (2005).
- [2] S. G. Karshenboim, F. S. Pavone, G. F. Bassani, M. Inguscio, T. W. Hänsch, Introduction to Simple Atoms (Springer, 2007).
- [3] P. J. Mohr, D. B. Newell, B. N. Taylor, CODATA recommended values of the fundamental physical constants: 2014, Rev. Mod. Phys. 88, 1 (2016).
- [4] S. G. Karshenboim, V. G. Ivanov, Hyperfine structure of the ground and first excited states in light hydrogen-like atoms and high-precision tests of QED, Eur. Phys. J. D 19, 13 (2002).
- [5] M. S. Safronova, D. Budker, D. Demille, D. F. Kimball, A. Derevianko, C. W. Clark, Search for new physics with atoms and molecules, Rev. Mod. Phys. 90, 025008 (2018).
- [6] L. C. Tu, J. Luo, Experimental tests of Coulomb’s Law and the photon rest mass, Metrologia 41, 136 (2004).
- [7] S. G. Karshenboim, Precision physics of simple atoms and constraints on a light boson with ultraweak coupling, Phys. Rev. Lett. 104, 40801 (2010).
- [8] M. P. A. Jones, R. M. Potvliege, M. Spannowsky, Probing new physics using Rydberg states of atomic hydrogen, Phys. Rev. Res. 2, 013244 (2020).
- [9] A. Beyer, L. Maisenbacher, A. Matveev, R. Pohl, K. Khabarova, A. Grinin, T. Lamour, D. C. Yost, T. W. Hänsch, N. Kolachevsky, T. Udem, The Rydberg constant and proton size from atomic hydrogen, Science 358, 79 (2017).
- [10] A. Grinin, A. Matveev, D. C. Yost, L. Maisenbacher, V. Wirthl, R. Pohl, T. W. Hänsch, T. Udem, Two-photon frequency comb spectroscopy of atomic hydrogen, Science 370, 1061 (2020).
- [11] M. Horbatsch, E. A. Hessels, Tabulation of the bound-state energies of atomic hydrogen, Phys. Rev. A 93, 022513 (2016).
- [12] R. Pohl, A. Antognini, F. Nez, F. D. Amaro, F. Biraben, J. M. R. Cardoso, D. S. Covita, A. Dax, S. Dhawan, L. M. P. Fernandes, A. Giesen, T. Graf, T. W. Hänsch, P. Indelicato, L. Julien, C. Y. Kao, P. Knowles, E. O. Le Bigot, Y. W. Liu, J. A. M. Lopes, L. Ludhova, C. M. B. Monteiro, F. Mulhauser, T. Nebel, P. Rabinowitz, J. M. F. Dos Santos, L. A. Schaller, K. Schuhmann, C. Schwob, D. Taqqu, J. F. C. A. Veloso, F. Kottmann, The size of the proton, Nature 466, 213 (2010).
- [13] A. Antognini, F. Nez, K. Schuhmann, F. D. Amaro, F. Biraben, J. M. R. Cardoso, D. S. Covita, A. Dax, S. Dhawan, M. Diepold, L. M. P. Fernandes, A. Giesen, A. L. Gouvea, T. Graf, T. W. Hänsch, P. Indelicato, L. Julien, C. Y. Kao, P. Knowles, F. Kottmann, E. O. Le Bigot, Y. W. Liu, J. A. M. Lopes, L. Ludhova, C. M. B. Monteiro, F. Mulhauser, T. Nebel, P. Rabinowitz, J. M. F. Dos Santos, L. A. Schaller, C. Schwob, D. Taqqu, J. F. C. A. Veloso, J. Vogelsang, R. Pohl, Proton structure from the measurement of 2S-2P transition frequencies of muonic hydrogen, Science 339, 417 (2013).
- [14] R. Pohl, R. Gilman, G. A. Miller, K. Pachucki, Muonic hydrogen and the proton radius puzzle, Annu. Rev. Nucl. Part. Sci. 63, 175 (2013).
- [15] C. E. Carlson, The proton radius puzzle, Prog. Part. Nucl. Phys. 82, 59 (2015).
- [16] H. Fleurbaey, S. Galtier, S. Thomas, M. Bonnaud, L. Julien, F. Biraben, F. Nez, M. Abgrall, J. Guéna, New Measurement of the 1S-3S Transition Frequency of Hydrogen: Contribution to the Proton Charge Radius Puzzle, Phys. Rev. Lett. 120, 183001 (2018).
- [17] N. Bezginov, T. Valdez, M. Horbatsch, A. Marsman, A. C. Vutha, E. A. Hessels, A measurement of the atomic hydrogen Lamb shift and the proton charge radius, Science 365, 1007 (2019).
- [18] F. Biraben, J. C. Garreau, L. Julien, Détermination of the rydberg constant by doppler-free two-photon spectroscopy of hydrogen rydberg states, Epl 2, 925 (1986).
- [19] B. De Beauvoir, C. Schwob, O. Acef, L. Jozefowski, L. Hilico, F. Nez, L. Julien, A. Clairon, F. Biraben, Metrology of the hydrogen and deuterium atoms: Determination of the Rydberg constant and Lamb shifts, Eur. Phys. J. D 12, 61 (2000).
- [20] S. F. Cooper, A. D. Brandt, C. Rasor, Z. Burkley, D. C. Yost, Cryogenic atomic hydrogen beam apparatus with velocity characterization, Rev. Sci. Instrum. 91, 013201 (2020).
- [21] Z. Burkley, A. D. Brandt, C. Rasor, S. F. Cooper, D. C. Yost, Highly coherent, watt-level deep-UV radiation via a frequency-quadrupled Yb-fiber laser system, Appl. Opt. 58, 1657 (2019).
- [22] S. F. Cooper, Z. Burkley, A. D. Brandt, C. Rasor, D. C. Yost, Cavity-enhanced deep ultraviolet laser for two-photon cooling of atomic hydrogen, Opt. Lett. 43, 1375 (2018).
- [23] M. A. Lombardi, The Use of GPS Disciplined Oscillators as Primary Frequency Standards for Calibration and Metrology Laboratories, NCSLI Meas. 3, 56 (2008).
- [24] T. Udem, L. Maisenbacher, A. Matveev, V. Andreev, A. Grinin, A. Beyer, N. Kolachevsky, R. Pohl, D. C. Yost, T. W. Hänsch, Quantum Interference Line Shifts of Broad Dipole-Allowed Transitions, Ann. Phys. 531, 1900044 (2019).
- [25] C. Schwob, L. Jozefowski, B. De Beauvoir, L. Hilico, F. Nez, L. Julien, F. Biraben, O. Acef, A. Clairon, Optical frequency measurement of the 2S-12D transitions in hydrogen and deuterium: Rydberg constant and lamb shift determinations, Phys. Rev. Lett. 82, 4960 (1999).
- [26] B. De Beauvoir, F. Nez, L. Julien, B. Cagnac, F. Biraben, D. Touahri, L. Hilico, O. Acef, A. Clairon, J. J. Zondy, Absolute frequency measurement of the 2S-8S/D transitions in hydrogen and deuterium: New determination of the rydberg constant, Phys. Rev. Lett. 78, 440 (1997).
- [27] M. Haas, U. D. Jentschura, C. H. Keitel, N. Kolachevsky, M. Herrmann, P. Fendel, M. Fischer, T. Udem, R. Holzwarth, T. W. Hänsch, M. O. Scully, G. S. Agarwal, Two-photon excitation dynamics in bound two-body Coulomb systems including ac Stark shift and ionization, Phys. Rev. A - At. Mol. Opt. Phys. 73, 052501 (2006).
- [28] A. E. Kramida, A critical compilation of experimental data on spectral lines and energy levels of hydrogen, deuterium, and tritium, At. Data Nucl. Data Tables 96, 586 (2010).
- [29] B. H. Porter, Research applications of colloidal graphite, Rev. Sci. Instrum. 7, 101 (1936).
- [30] I. I. Sobel’man, L. A. Vainshtein, A. Y. Evgenii, Excitation of Atoms and Broadening of Spectral Lines (Springer-Verlag Berlin Heidelberg New York, 1955).
- [31] A. Matveev, N. Kolachevsky, C. M. Adhikari, U. D. Jentschura, Pressure shifts in high-precision hydrogen spectroscopy: II. Impact approximation and Monte-Carlo simulations, J. Phys. B At. Mol. Opt. Phys. 52, 75006 (2019).
- [32] C. G. Parthey, A. Matveev, J. Alnis, B. Bernhardt, A. Beyer, R. Holzwarth, A. Maistrou, R. Pohl, K. Predehl, T. Udem, T. Wilken, N. Kolachevsky, M. Abgrall, D. Rovera, C. Salomon, P. Laurent, T. W. Hänsch, Improved Measurement of the Hydrogen 1S-2S Transition Frequency, Phys. Rev. Lett. 107, 203001 (2011).
- [33] E. Tiesinga, P. J. Mohr, D. B. Newell, B. N. Taylor, Codata recommended values of the fundamental physical constants: 2018, Rev. Mod. Phys. 93, 25010 (2021).