Periodic modulations during a long outburst in V363 Lyr
Abstract
I analyzed the Kepler long and short cadence data of V363 Lyr. A period of 0.185723(8) d was persistently detected and this is identified as the orbital period. V363 Lyr showed one long outburst accompanied by an “(embedded) precursor” during Kepler observations and modulations with a period of 0.1956(2) d, longer than the orbital one, were detected during this outburst. There are two possible interpretations of this period. The first one is superhumps despite that V363 Lyr is far above the period gap. This interpretation requires an evolved, undermassive secondary enabling a low mass ratio of =0.15. The evolution of this long-period variations, however, does not follow the standard evolution of superhumps. The second one is that the precursor occurred when the disk reached the tidal truncation radius, as inferred from observations of IW And stars. In this case, the long-period variations could be interpreted as a variable stream impact on a precessing eccentric disk, which may have been formed by disturbances at the tidal truncation radius. This might lead to effective removal of the angular momentum which resulted in 0.3–0.4 mag brightening following the precursor. The fractional period excess suggests that is just above the stability limit of the 3:1 resonance. In either cases, the nature of the secondary and the mass ratio need to be verified by spectroscopic observations.
tkato@kusastro.kyoto-u.ac.jp
1 Introduction
V363 Lyr is a dwarf nova discovered by Hoffmeister (1967). Galkina and Shugarov (1985) studied this object photographically. Although both authors suggested high frequency of outbursts, the interval (21.4 d) was first confidently measured by CCD observations by Kato et al. (2001). Liu et al. (1999) spectroscopically confirmed this object to be a cataclysmic variable (CV). This object is included in the Kepler field (Borucki et al. 2010; Koch et al. 2010) and was observed as a Kepler target as KIC 7431243. Ramsay et al. (2014) reported an analysis of the 5.2 d segment and detected two periods of 4.68 hr and 4.47 hr, which I will discuss in this paper.
2 Data Analysis
The data analysis was performed practically in the same way as in Osaki and Kato (2013a, b): I used two-dimensional Fourier analysis for detecting the signals and examined diagrams to detect variation of the periods.
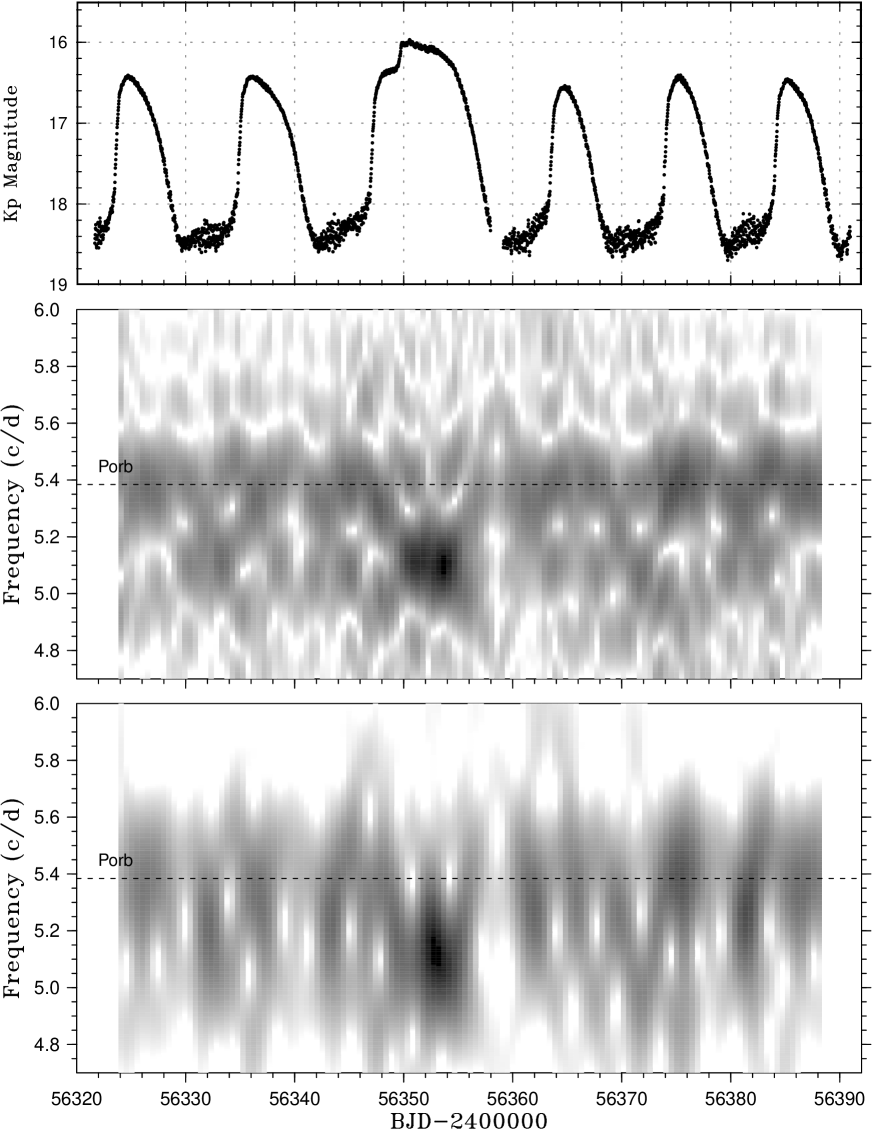
Two sets of Kepler data for V363 Lyr are publicly available: quarter 15 (Q15) short cadence (SC) and Q16 long cadence (LC) data. Since the Q15 observations (in quiescence) covered only for 5.3 d, I primarily used this quarter for confirming the period detected in Q16. The Q16 data contained five short outbursts and one long outburst.
3 Results
3.1 Identification of two periods
I present the result of period analysis only around the frequencies of these periods. There is no candidate frequency outside this frequency region. The results of the Fourier analysis is shown in figure 1. Two major signals were present. These signals corresponds to the periods detected by Ramsay et al. (2014).
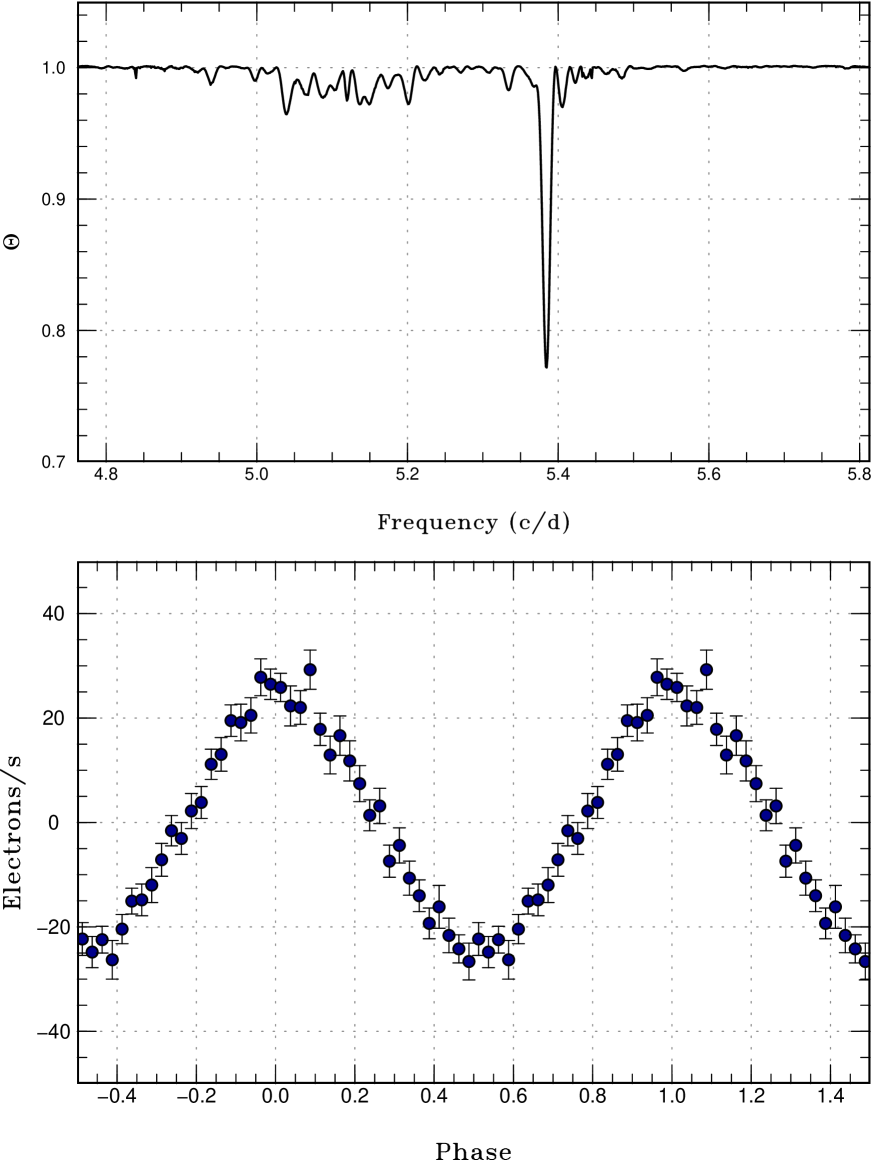
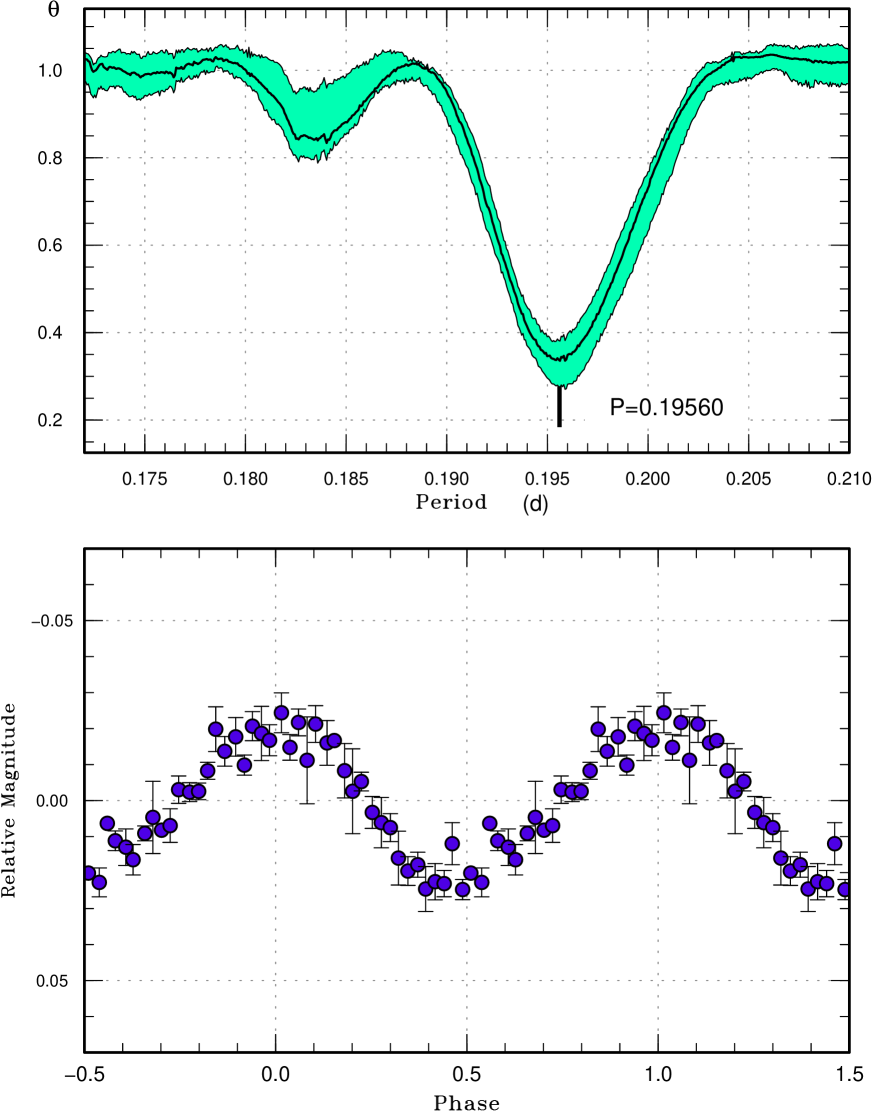
I examined the stability of the signal at 5.38 c/d. Almost all the segments (4 d in width), both in quiescence and in outburst, showed the constant phase and almost constant amplitude (in flux) of this 5.38-c/d signal (figure 2). I conclude that this signal was coherent during the Kepler observation, and identified it to be the orbital period (). A phase dispersion minimization (PDM: Stellingwerf (1978)) analysis of the combined data set of Q15 and Q16 yielded a period of 0.185723(8) d (figure 3). The error was estimated by methods of Fernie (1989) and Kato et al. (2010).
A two-dimensional Fourier analysis (figure 1) clearly indicates that another signal around frequencies 5.0–5.2 c/d was especially strong around the long outburst. Since the frequency of this signal is lower (i.e. the period is longer) than that of . Hereafter I call this signal P. A two-dimensional PDM analysis is also shown in figure 1. In the case of V363 Lyr, PDM analysis gave a better result than least absolute shrinkage and selection operator (Lasso: Tibshirani (1996); Kato and Uemura (2012); Kato and Maehara (2013)) analysis employed in Osaki and Kato (2013b) due to the non-sinusoidal nature of the signal and small number of points in the LC data. The resolution of PDM analysis is intermediate between Fourier transform and Lasso analysis, and this result can be treated as a slightly degraded version of Lasso analysis presented in Osaki and Kato (2013b) [see also an application of a two-dimensional PDM analysis to superhumps in Kato et al. (2021b)]. It looks like that Pwas sometimes weakly excited outside the long outburst. No evidence of the negative superhump was detected.
3.2 Development of P
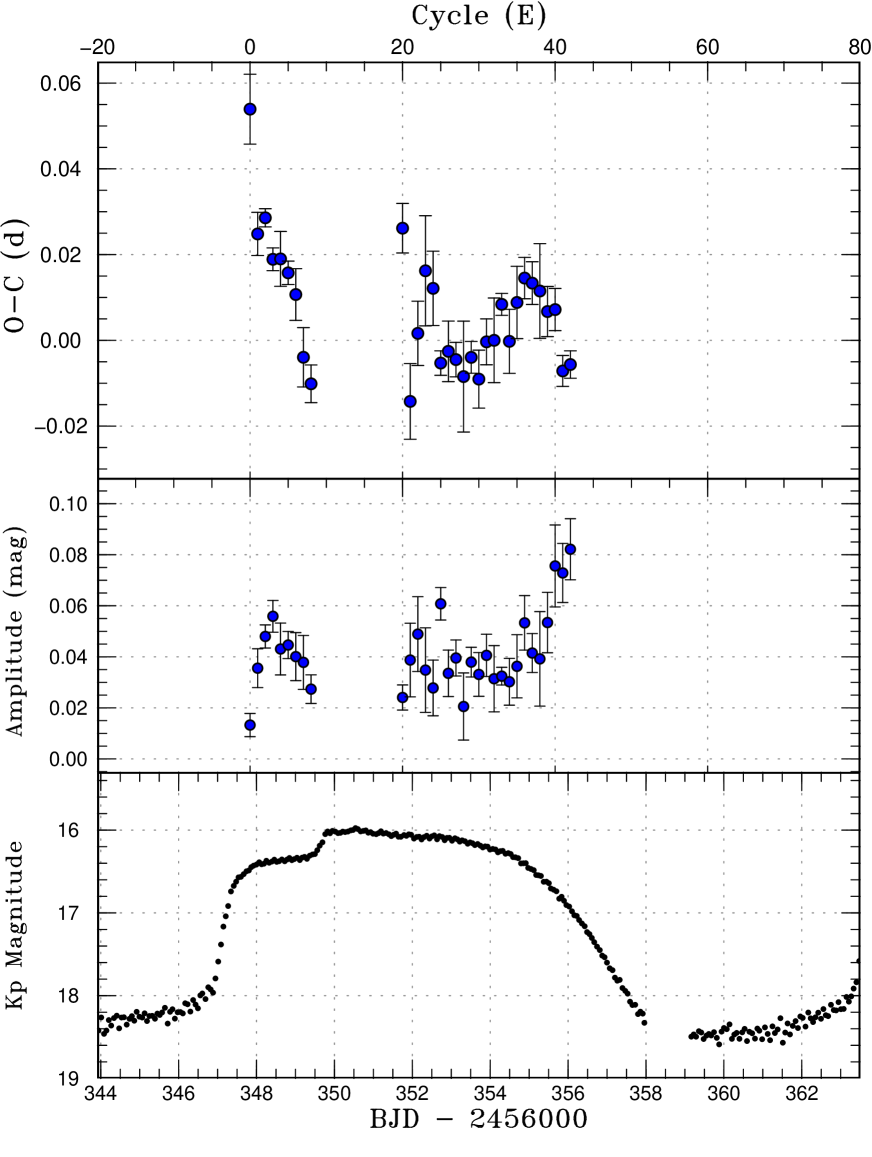
The long outburst had a shoulder (precursor) followed by a brighter outburst. This phenomenon in SS Cyg stars is also referred to as an “embedded precursor” by Cannizzo (2012). During the precursor, humps recurring with were recorded. After BJD 2456352 (two days after the peak), Phumps appeared.
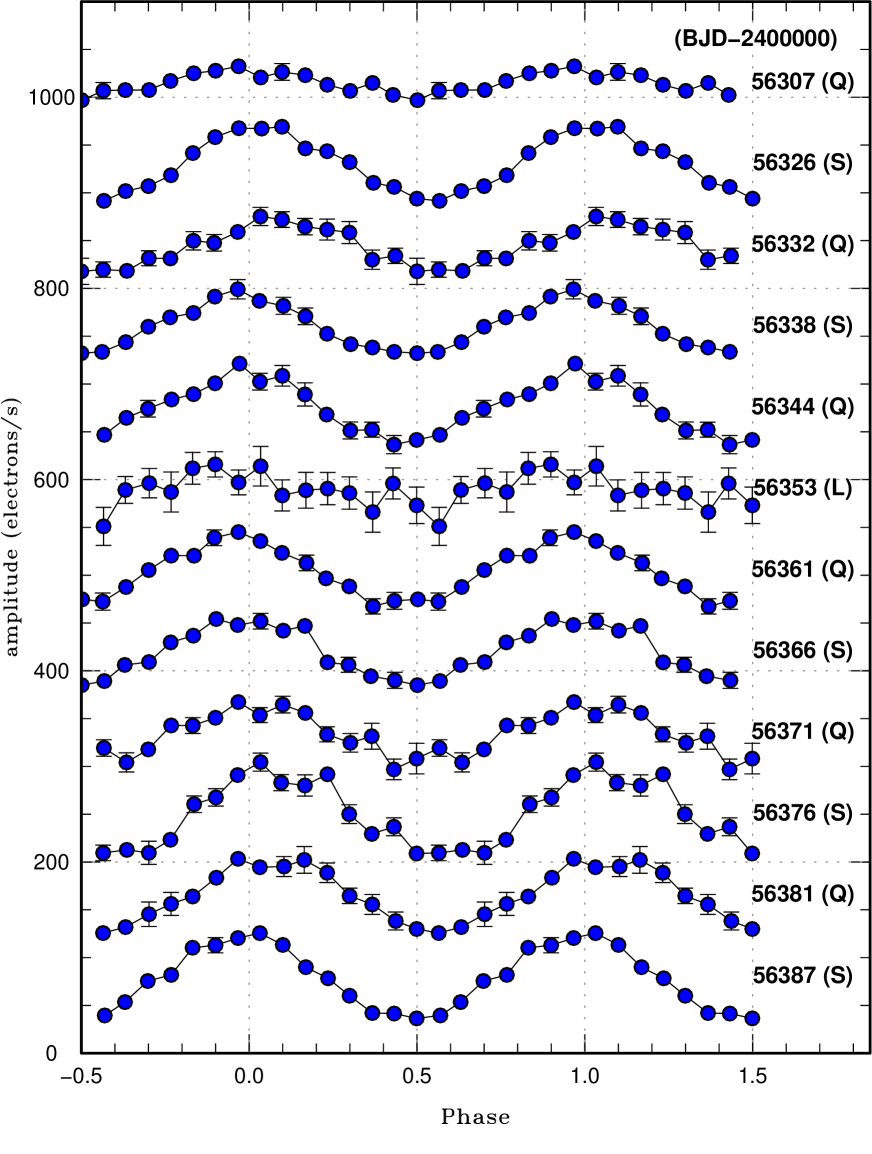
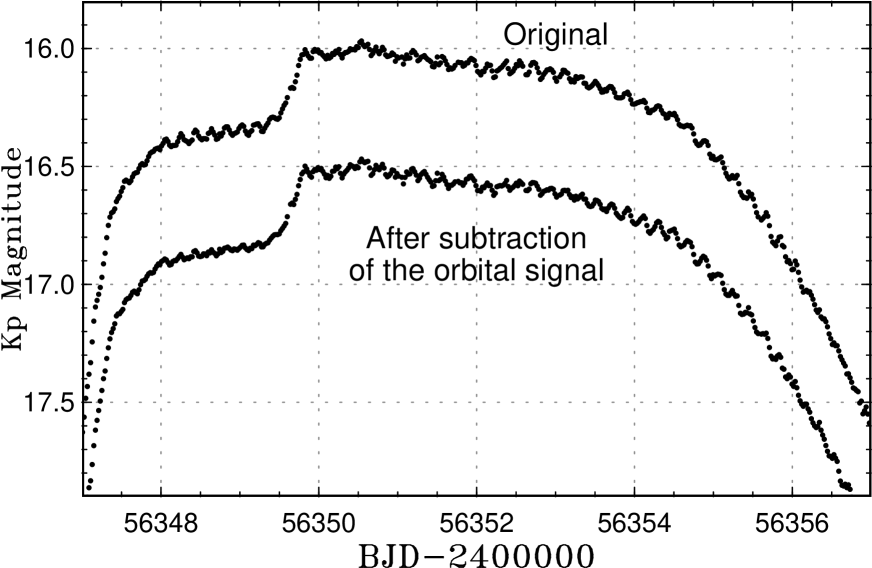
I measured the times of maxima of these humps in the light curve by the template fitting method described in Kato et al. (2009) after removing the trend of the outburst by locally-weighted polynomial regression (LOWESS: Cleveland (1979)). I used the raw light curve (without subtraction of the orbital signal) in figure 4. The times of maxima are listed in table 1. As shown in figure 4, the variations during the precursor can be identified as the orbital signal. After the precursor, the object brightened by 0.3–0.4 mag. No clearly periodic variations were detected for 2 d. The amplitudes of Pwere small (0.04 mag) and there was no significant variation of the period. The profile of Pwas slightly asymmetric (figure 6).
| max∗ | error | † | ‡ | ||
| 0 | 56347.8869 | 0.0081 | 0. | 0351 | 8 |
| 1 | 56348.0537 | 0.0050 | 0. | 0065 | 7 |
| 2 | 56348.2533 | 0.0021 | 0. | 0107 | 7 |
| 3 | 56348.4395 | 0.0027 | 0. | 0016 | 8 |
| 4 | 56348.6354 | 0.0064 | 0. | 0022 | 8 |
| 5 | 56348.8280 | 0.0027 | 0. | 0006 | 7 |
| 6 | 56349.0188 | 0.0060 | 0. | 0051 | 8 |
| 7 | 56349.2000 | 0.0069 | 0. | 0193 | 8 |
| 8 | 56349.3897 | 0.0044 | 0. | 0249 | 7 |
| 20 | 56351.7762 | 0.0058 | 0. | 0175 | 7 |
| 21 | 56351.9316 | 0.0088 | 0. | 0224 | 8 |
| 22 | 56352.1433 | 0.0075 | 0. | 0060 | 8 |
| 23 | 56352.3538 | 0.0128 | 0. | 0091 | 8 |
| 24 | 56352.5455 | 0.0087 | 0. | 0055 | 6 |
| 25 | 56352.7240 | 0.0029 | 0. | 0114 | 8 |
| 26 | 56352.9225 | 0.0071 | 0. | 0082 | 8 |
| 27 | 56353.1165 | 0.0040 | 0. | 0096 | 7 |
| 28 | 56353.3083 | 0.0129 | 0. | 0131 | 7 |
| 29 | 56353.5087 | 0.0037 | 0. | 0081 | 8 |
| 30 | 56353.6995 | 0.0068 | 0. | 0126 | 8 |
| 31 | 56353.9040 | 0.0054 | 0. | 0034 | 8 |
| 32 | 56354.1002 | 0.0099 | 0. | 0026 | 8 |
| 33 | 56354.3044 | 0.0026 | 0. | 0063 | 8 |
| 34 | 56354.4917 | 0.0075 | 0. | 0018 | 8 |
| 35 | 56354.6966 | 0.0084 | 0. | 0078 | 8 |
| 36 | 56354.8981 | 0.0048 | 0. | 0140 | 8 |
| 37 | 56355.0928 | 0.0050 | 0. | 0133 | 8 |
| 38 | 56355.2868 | 0.0110 | 0. | 0120 | 7 |
| 39 | 56355.4779 | 0.0058 | 0. | 0077 | 8 |
| 40 | 56355.6742 | 0.0049 | 0. | 0087 | 7 |
| 41 | 56355.8557 | 0.0036 | 0. | 0052 | 7 |
| 42 | 56356.0531 | 0.0032 | 0. | 0031 | 7 |
| ∗BJD2400000. | |||||
| †Against max . | |||||
| ‡Number of points used to determine the maximum. | |||||
4 Discussion
4.1 Comparison with superhumps in SU UMa stars
As we have seen, V363 Lyr showed both the orbital signal and the Psignal longer than during the long, bright outburst. These Pvariations may look similar to superhumps in SU UMa stars, which have periods a few percent longer than and are considered to arise from the precession of an eccentric accretion disk whose deformation is excited by the 3:1 resonance (Whitehurst (1988); Hirose and Osaki (1990); Lubow (1991)).
There are, however, a number of features different from superhumps in ordinary SU UMa stars. They are:
- •
-
•
The ratio between the durations of the long outburst (12 d for the entire outburst, 6 d after the long period appeared) and other outbursts (5 d) is small compared to other SU UMa stars.
-
•
Superhumps in SU UMa stars usually show variations (Kato et al. 2009). Pin V363 Lyr, however, did not show such a variation.
- •
4.2 Can Pbe growing superhumps?
In many SU UMa-type dwarf novae, superhumps start to appear during the precursor (if there is a precursor) or a few to several days after the start of the superoutburst (if there is no precursor). This reflects when the 3:1 resonance starts to develop (Osaki 2005). During this growing phase of superhumps, superhump periods () are longer and this phase is referred to as stage A (Kato et al. 2009). It is interpreted that during the growing phase of superhumps, the eccentric part of the disk is confined to the region near the 3:1 resonance (Osaki and Kato 2013b; Kato and Osaki 2013) and that the period reflects the dynamical precession rate at the 3:1 resonance. As the region of the eccentric part reaches the inner part of the disk, the pressure effect slows down the precession rate (stage B). In many SU UMa-type dwarf novae, stage B superhumps are seen near the peaks of superoutbursts.
Pin V363 Lyr has a period of 0.1956(2) d (figure 6), which is 5.3% longer than . This period corresponds to a fractional superhump excess in frequency = 0.0514(10). If we consider that Pvariations in V363 Lyr reflect the dynamical precession rate at the 3:1 resonance, this value corresponds to a mass ratio of =0.152(3) (Kato and Osaki 2013). The mass of the secondary inferred from this mass ratio is too small for an object with 0.18572 d. The mass, and ofthe secondary for this period on the standard evolutionary sequence of CVs are 0.39, 10.2 and 5.9, respectively (Knigge 2006). Even a Chandrasekhar-mass white dwarf gives =0.28, which cannot explain the observation.
There remains a possibility that the secondary in V363 Lyr is undermassive for . Such a system should have an evolved secondary such as QZ Ser (Thorstensen et al. 2002), CRTS J134052.1151341 (Thorstensen 2013) and ASASSN-18aan (Wakamatsu et al. 2021). The quiescent absolute magnitudes of V363 Lyr are =7.5 and =4.4 [using 2MASS (Cutri et al. 2003) and Gaia parallax (Gaia Collaboration et al. 2021)]. These values are brighter than those of main-sequence stars on the standard evolutionary sequence of CVs, and the secondary in V363 Lyr may indeed be evolved. For comparison, quiescent absolute magnitudes are =10.5 and =7.2 for QZ Ser, =8.4 and =5.9 for CRTS J134052.1151341 and =8.4 and =6.0 for ASASSN-18aan. If the secondary is indeed evolved in V363 Lyr, Pmight be attributed to superhumps arising from the 3:1 resonance. If this is the case, the difference in the behavior of superhumps from other SU UMa stars would require an additional explanation since the corresponding value is normal for an SU UMa star and textbook evolution of superhumps is expected. Spectroscopic determination of the secondary type and radial-velocity measurements are needed.
4.3 Could Pbe stream impact on a precessing eccentric disk?
Since Pwas seen during the middle-to-late phase of the outburst, this variation might be attributed to (traditional) late superhumps (Haefner et al. 1979; Vogt 1983; van der Woerd et al. 1988), which arise from the stream impact on an eccentric disk.
The dynamical precession rate of an eccentric disk can be obtained by the method in Hirose and Osaki (1990); Kato and Osaki (2013) and the disk radius can be estimated by equating the theoretical precession rate with the observed . The results for various values are listed in table 2. I used the formula of the tidal truncation radius
| (1) |
in Paczyński (1977). and Lubow-Shu (or circularization) radius
| (2) |
from Lubow and Shu (1975). The value =0.15 corresponds to subsection 4.2 (assuming that Pis growing or stage A superhumps). The values =0.25 or =0.30 correspond to the limit of the 3:1 tidal instability. The value =0.476 corresponds to a secondary star on the standard evolutionary sequence of CVs (Knigge 2006) and an average-mass white dwarf 0.82 in CVs (Zorotovic et al. 2011).
In cases for the radius of the 3:1 resonance is inside and the tidal instability due to the 3:1 resonance can occur. In these cases, an eccentric disk is expected to form by the tidal instability and the identification Pas (traditional) late superhumps is possible. This interpretation, however, requires an explanation why ordinary superhumps before the appearance of late superhumps were not observed. In all cases, the estimated radii are far outside and they are achievable. For , however, eccentric deformation of the disk by the 3:1 resonance is not expected and there is a need for a different mechanism.
| Disk radius∗ | Truncation radius∗ | Radius of 3:1 resonance∗ | Lubow-Shu radius∗ | |
| 0.15 | 0.462 | 0.52 | 0.459 | 0.118 |
| 0.20 | 0.413 | 0.50 | 0.453 | 0.103 |
| 0.25 | 0.377 | 0.48 | 0.447 | 0.093 |
| 0.30 | 0.348 | 0.46 | 0.441 | 0.085 |
| 0.35 | 0.325 | 0.44 | 0.435 | 0.079 |
| 0.476† | 0.283 | 0.41 | 0.422 | 0.069 |
| ∗Unit: binary separation. | ||||
| †Assuming a standard secondary and an average mass white dwarf. | ||||
4.4 Possible deformation of the disk for a high- system
If the true mass ratio is too large to hold the 3:1 resonance within the tidal truncation radius, V363 Lyr is not an SU UMa star. Kato and Hambsch (2021) recently proposed an interpretation that embedded precursors in long outbursts of SS Cyg stars may correspond to a phenomenon when the disk radius reaches the tidal truncation radius. This interpretation originated from direct observations of the variation of the disk radius (M. Shibata et al. in preparation) in an IW And star (Simonsen 2011; Kato 2019). If this is indeed the case in the precursor in V363 Lyr, Pmay be a previously undescribed phenomenon which is excited when the disk reaches the tidal truncation radius. In IW And stars, standstills are terminated by brightening and this would require a mechanism of effective removal of angular momentum at the tidal truncation radius (see Kimura et al. (2020); Kato et al. (2021b); M. Shibata et al. in preparation). It would not be surprising if intersections of orbits in the disk near the tidal truncation radius (Paczyński 1977) cause disturbances and lead to eccentric deformation of the disk (which is desired for the late-superhump type interpretation) and effective removal of the angular momentum. As seen in table 2, the estimated disk radius is much smaller than for larger values. This mechanism to produce Pwould only be acceptable in V363 Lyr for a narrow range of which does not allow the 3:1 resonance to occur but enables the disk radius sufficiently close to . Brightening by 0.3–0.4 mag after the precursor in V363 Lyr is probably the result of effective removal of the angular momentum (just as in superoutburst in SU UMa stars, Osaki (1989)), and Pobserved in V363 Lyr could be a manifestation of the disturbances around the tidal truncation radius.
Acknowledgments
I thank the Kepler Mission team and the data calibration engineers for making Kepler data available to the public. This work was supported by JSPS KAKENHI Grant Number 21K03616.
References
- Borucki et al. (2010) Borucki, W. J. et al. (2010) Kepler planet-detection mission: Introduction and first results. Science 327, 977
- Cannizzo (2012) Cannizzo, J. K. (2012) The shape of long outbursts in U Gem type dwarf novae from AAVSO data. ApJ 757, 174
- Cleveland (1979) Cleveland, W. S. (1979) Robust locally weighted regression and smoothing scatterplots. J. Amer. Statist. Assoc. 74, 829
- Cutri et al. (2003) Cutri, R. M. et al. (2003) 2MASS All Sky Catalog of point sources (NASA/IPAC Infrared Science Archive)
- Fernie (1989) Fernie, J. D. (1989) Uncertainties in period determinations. PASP 101, 225
- Gaia Collaboration et al. (2021) Gaia Collaboration et al. (2021) Gaia Early Data Release 3. summary of the contents and survey properties. A&A 649, A1
- Galkina and Shugarov (1985) Galkina, M. P., & Shugarov, S. Yu. (1985) Study of 11 stars in Lyra. Perem. Zvezdy 22, 225
- Haefner et al. (1979) Haefner, R., Schoembs, R., & Vogt, N. (1979) The outbursts of the dwarf nova VW Hydri – a comparative study of short and long eruptions. A&A 77, 7
- Hirose and Osaki (1990) Hirose, M., & Osaki, Y. (1990) Hydrodynamic simulations of accretion disks in cataclysmic variables – superhump phenomenon in SU UMa stars. PASJ 42, 135
- Hoffmeister (1967) Hoffmeister, C. (1967) Mitteilungen über neuentdeckte veränderliche Sterne. Astron. Nachr. 289, 205
- Kato (2019) Kato, T. (2019) Three Z Cam-type dwarf novae exhibiting IW And-type phenomenon. PASJ 71, 20
- Kato and Hambsch (2021) Kato, T., & Hambsch, F.-J. (2021) On the nature of embedded precursors in long outbursts of SS Cyg stars as inferred from observations of the IW And star ST Cha. VSOLJ Variable Star Bull. 83, (arXiv:2110.10321)
- Kato et al. (2009) Kato, T. et al. (2009) Survey of period variations of superhumps in SU UMa-type dwarf novae. PASJ 61, S395
- Kato et al. (2021a) Kato, T. et al. (2021a) ASASSN-19ax: SU UMa-type dwarf nova with a long superhump period and post-superoutburst rebrightenings. VSOLJ Variable Star Bull. 84, (arXiv:2111.01304)
- Kato and Maehara (2013) Kato, T., & Maehara, H. (2013) Analysis of Kepler light curve of the novalike cataclysmic variable KIC 8751494. PASJ 65, 76
- Kato et al. (2010) Kato, T. et al. (2010) Survey of Period Variations of Superhumps in SU UMa-Type Dwarf Novae. II. The Second Year (2009-2010). PASJ 62, 1525
- Kato et al. (2001) Kato, T., Nogami, D., Baba, H., & Masuda, S. (2001) Outburst cycle of V363 Lyr. IBVS 5118
- Kato and Osaki (2013) Kato, T., & Osaki, Y. (2013) New method to estimate binary mass ratios by using superhumps. PASJ 65, 115
- Kato et al. (2021b) Kato, T. et al. (2021b) BO Ceti: Dwarf nova showing both IW And and SU UMa-type features. PASJ in press (arXiv:2106.15028)
- Kato and Uemura (2012) Kato, T., & Uemura, M. (2012) Period analysis using the Least Absolute Shrinkage and Selection Operator (Lasso). PASJ 64, 122
- Kimura et al. (2020) Kimura, M., Osaki, Y., & Kato, T. (2020) KIC 9406652: A laboratory of the tilted disk in cataclysmic variable stars. PASJ 72, 94
- Knigge (2006) Knigge, C. (2006) The donor stars of cataclysmic variables. MNRAS 373, 484
- Koch et al. (2010) Koch, D. G. et al. (2010) Kepler mission design, realized photometric performance, and early science. ApJ 713, L79
- Liu et al. (1999) Liu, Wu., Hu, J. Y., Zhu, X. H., & Li, Z. Y. (1999) Spectroscopic confirmation of 55 northern and equatorial cataclysmic variables. I. 27 confirmed cataclysmic variables. ApJS 122, 243
- Lubow (1991) Lubow, S. H. (1991) A model for tidally driven eccentric instabilities in fluid disks. ApJ 381, 259
- Lubow and Shu (1975) Lubow, S. H., & Shu, F. H. (1975) Gas dynamics of semidetached binaries. ApJ 198, 383
- Osaki (1989) Osaki, Y. (1989) A model for the superoutburst phenomenon of SU Ursae Majoris stars. PASJ 41, 1005
- Osaki (2005) Osaki, Y. (2005) The disk instability model for dwarf nova outbursts. Proc. Japan Acad. Ser. B 81, 291
- Osaki and Kato (2013a) Osaki, Y., & Kato, T. (2013a) The cause of the superoutburst in SU UMa stars is finally revealed by Kepler light curve of V1504 Cygni. PASJ 65, 50
- Osaki and Kato (2013b) Osaki, Y., & Kato, T. (2013b) Study of superoutbursts and superhumps in SU UMa stars by the Kepler light curves of V344 Lyrae and V1504 Cygni. PASJ 65, 95
- Paczyński (1977) Paczyński, B. (1977) A model of accretion disks in close binaries. ApJ 216, 822
- Ramsay et al. (2014) Ramsay, G. et al. (2014) RATS-Kepler – a deep high-cadence survey of the Kepler field. MNRAS 437, 132
- Simonsen (2011) Simonsen, M. (2011) The Z CamPaign: Year 1. J. American Assoc. Variable Star Obs. 39, 66
- Stellingwerf (1978) Stellingwerf, R. F. (1978) Period determination using phase dispersion minimization. ApJ 224, 953
- Thorstensen (2013) Thorstensen, J. R. (2013) CSS J134052.0151341: A cataclysmic binary star with a stripped, evolved secondary. PASP 125, 506
- Thorstensen et al. (2002) Thorstensen, J. R., Fenton, W. H., Patterson, J. O., Kemp, J., Halpern, J., & Baraffe, I. (2002) QZ Serpentis: A dwarf nova with a 2-hour orbital period and an anomalously hot, bright secondary star. PASP 114, 1117
- Tibshirani (1996) Tibshirani, R. (1996) Regression shrinkage and selection via the lasso. J. R. Statistical Soc. Ser. B 58, 267
- van der Woerd et al. (1988) van der Woerd, H., van der Klis, M., van Paradijs, J., Beuermann, K., & Motch, C. (1988) Observations of the late superhump in VW Hydri. ApJ 330, 911
- Vogt (1983) Vogt, N. (1983) VW Hydri revisited – conclusions on dwarf nova outburst models. A&A 118, 95
- Wakamatsu et al. (2021) Wakamatsu, Y. et al. (2021) ASASSN-18aan: An eclipsing SU UMa-type cataclysmic variable with a 3.6-hr orbital period and a late G-type secondary star. PASJ 73, 1209
- Warner (1995) Warner, B. (1995) Cataclysmic Variable Stars (Cambridge: Cambridge University Press)
- Whitehurst (1988) Whitehurst, R. (1988) Numerical simulations of accretion disks. I - superhumps - a tidal phenomenon of accretion disks. MNRAS 232, 35
- Zorotovic et al. (2011) Zorotovic, M., Schreiber, M. R., & Gänsicke, B. T. (2011) Post common envelope binaries from SDSS. XI. the white dwarf mass distributions of CVs and pre-CVs. A&A 536, A42