:
\theoremsep
\jmlrvolumeLEAVE UNSET
\jmlryear2021
\jmlrsubmittedLEAVE UNSET
\jmlrpublishedLEAVE UNSET
\jmlrworkshopMachine Learning for Health (ML4H) 2021
Monte Carlo dropout increases model repeatability
Abstract
The integration of artificial intelligence into clinical workflows requires reliable and robust models. Among the main features of robustness is repeatability. Much attention is given to classification performance without assessing the model repeatability, leading to the development of models that turn out to be unusable in practice. In this work, we evaluate the repeatability of four model types on images from the same patient that were acquired during the same visit. We study the performance of binary, multi-class, ordinal, and regression models on three medical image analysis tasks: cervical cancer screening, breast density estimation, and retinopathy of prematurity classification. Moreover, we assess the impact of sampling Monte Carlo dropout predictions at test time on classification performance and repeatability. Leveraging Monte Carlo predictions significantly increased repeatability for all tasks on the binary, multi-class, and ordinal models leading to an average reduction of the 95% limits of agreement by 17% points.
keywords:
repeatability, Monte Carlo dropout, cervical screening, breast density, retinopathy of prematurity, medical classification, computer vision1 Introduction
While the majority of the deep learning (DL) work for medical image classification focuses on accuracy and classification performance, little is known about the repeatability of these models. It is of utmost importance and key to model reliability, that models provide consistent predictions in clinical settings. Empirically, minor changes in an image can lead to vastly different predictions by DL models. In clinical practice, this repeatability issue could lead to dangerous medical errors. Figure 1 illustrates this issue. Automatic visual assessment of cervix images by artificial intelligence models has the potential to support cervical cancer screening in low-resource settings. Two cervical cancer screening images from the same precancerous cervix acquired during the same visit lead to completely different predictions. A binary DL model (without dropout layers) trained to distinguish between a normal cervix and one with precancerous lesions (0: Normal, 1: Pre-cancer) predicted a normal cervix on one image and classified the second one as precancerous. This difference is represented by prediction results at each extreme of the spectrum, i.e., 0.01 and 0.98, suggesting high model certainty for both outputs. Repeatability is important as it reflects how reliably the model can achieve a certain classification performance.
[Model prediction: 0.01 (Normal)]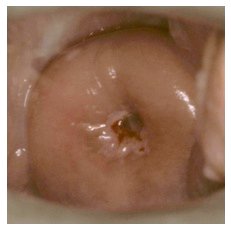 \subfigure[Model prediction: 0.98 (Pre-cancer)]
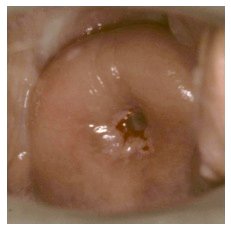
tab:dataset
| # images | Label distribution | Mean img/patient | Train/Val/Test split | |
|---|---|---|---|---|
| Cervical | 3509 | No./Gray/Precancer (33%/33%/34%) | 2 | 65%/10%/25% |
| DMIST | 108,230 | Fatty/Scat./Hetero./Dense (12%/44%/38%/6%) | 5 | 65%/10%/25% |
| ROP | 5511 | No./Pre-Plus/Plus (82%/15%/3%) | 3 | 78%/13%/8% |
1.1 Study outline
In the competition to achieve higher and higher classification performance important aspects like test-retest variability remain overlooked and not all DL models are equal with respect to their repeatability. To the best of our knowledge, this is the first study to propose Monte Carlo (MC) dropout (Hinton et al., 2012; Srivastava et al., 2014) as a method to improve repeatability and systematically assess it on different tasks, model types, and network architectures. In this work, we evaluate the repeatability of four types of DL classification and regression models, binary, multi-class, ordinal, and regression, each with and without MC dropout. We test the repeatability of these models’ predictions on three different medical image analysis tasks: cervical cancer screening, breast density estimation, and retinopathy of prematurity (ROP) disease severity classification. Based on our results, we present recommendations for model selection to improve repeatability.
2 Methods
 \floatconts
fig:bland_altman
tab:metric-table
| Cervical | Breast density | ROP | ||||
| Model | 95% LoA | Acc. | 95% LoA | Acc. | 95% LoA | Acc. |
| Binary | ||||||
| MC Binary | ||||||
| Multi class | ||||||
| MC multi-class | ||||||
| Ordinal | ||||||
| MC ordinal | ||||||
| Regression | ||||||
| MC Regression | ||||||
2.1 Datasets
Three datasets were used to assess the repeatability of the different models: cervical photographs for certical cancer screening, mammographies for breast density prediction, and retinal photographs for ROP severity diagnosis (summarized in Table LABEL:tab:dataset). All datasets were split on a patient level to prevent leakage of information. Repeatability was assessed as the maximum difference between model outputs for all available images for each patient in the test dataset.
Cervical
Cervical cancer is the fourth most common cancer in women worldwide and the leading cause of cancer-related deaths in western, eastern, middle, and southern Africa (Arbyn et al., 2020). In addition to HPV testing, the visual assessment of the cervix using photographs can help to detect precancerous lesions in low-resource settings (Catarino et al., 2015; Xue et al., 2020; Hu et al., 2019). Each image, originating from one of two studies (Schiffman and Solomon, 2003; Bratti et al., 2004), was classified using cytological and histological data from the patient as one of the following three categories: Normal, Gray zone, i.e., the presence of precancerous lesions was equivocal, Pre-cancer/cancer. For the binary models, we utilized only images that were classified as either normal or pre-cancer/cancer.
Breast density
The risk to develop breast cancer rises with increasing breast density (Boyd et al., 1995). We used images from the Digital Mammographic Imaging Sceening Trial (DMIST) acquired at 33 institutions (Pisano et al., 2005). Breast density labels were generated according to the BI-RADS criteria (Liberman and Menell, 2002): fatty, scattered fibroglandular density, heterogeneously dense, and extremely dense. The breast density models were trained using all available views for each patient in the training dataset using either four labels or a simplified binary labelling system of fatty and scattered as one class, and dense and heterogeneous as the other class.
Retinopathy of Prematurity
ROP is the leading cause of preventable childhood blindness worldwide (IAPB, ). Images from the dataset described in Brown et al. (2018) were classified as normal, pre-plus, or plus disease following previously published methods (Ryan et al., 2014). The final label was based on the independent image-based diagnosis by 3 expert graders. The binary models were trained using normal as one class and pre-plus and plus as the other class. Following Brown et al. (2018)’s work, we trained ROP classification models using pre-segmented vessel maps as input. ROP classification models were trained using only the posterior field of view and the repeatability was assessed on the posterior, temporal, and nasal views which represents a slight domain shift (i.e., testing on unseen views).
Classification model training
For each dataset, we trained binary, multi-class and ordinal (Cao et al., 2019) classification models, as well as regression models each with and without dropout, resulting in a total of 8 models per dataset. Models with dropout were trained using spatial dropout with a dropout rate of 0.1 for cervical images and DMIST, and 0.2 for ROP. For the DenseNet121 architecture, the dropout was applied after every dense layer while for the ResNets the dropout layer was applied after each residual block. At test time, the dropout was enabled to generate slightly different predictions and the final prediction was obtained by averaging over all the MC samples (Gal and Ghahramani, 2016). We used the following ImageNet pretrained models for each dataset based on which performed the best for the conventional multi-class classification model: DenseNet121 (cervix), ResNet50 (DMIST), and ResNet18 (ROP). Models were trained using binary cross-entropy, cross-entropy, CORAL (Cao et al., 2019), and mean squared error (MSE) losses for binary, multi-class, ordinal, and regression models respectively. The code was implemented using the MONAI framework (MONAI Consortium, 2020) based on the PyTorch library (Paszke et al., 2017).
2.2 Evaluation
Severity scores
For direct comparison of a model’s predictions, we summarized each model’s outputs as a continuous severity score. The methodology and analysis were chosen based on the consideration that the underlying variable of interest, i.e. disease severity, of these medical tasks is better represented by a spectrum rather than clear distinct categories. For the binary and regression models, the output of the models was directly used without further modifications (labels from 0 to max class - 1). For the multi-class model, we utilized the ordinality of all three classification problems and defined the continuous severity score as a weighted average using softmax probability of each class as described in Equation 1. For cervical and ROP classification (3 classes), the values lie in the range 0 to 2 while the values extend from 0 to 3 for breast density (4 classes).
| (1) |
with being the number of classes and the softmax probability of class . For the ordinal model, the classification problem of ranks (i.e., classes) is modified into binary classification problems (Li and Lin, 2007) leading to one output unit less than for the classification form. For instance, for a 3-class problem, the ground truth would be encoded as follows: class 1 [0, 0]; class 2 [1, 0]; class 3 [1, 1]. The continuous prediction score for ordinal models is obtained by summing the output neurons leading to values ranging from 0 to 2 and 0 to 3 for 3-class and 4-class problems, respectively.
Metrics
Repeatability was evaluated using the 95% limits of agreement (LoA) from the Bland-Altman plots. Since normality was not reached for the differences for the LoA, non-parametric LoA were calculated using empirical percentiles (Bland and Altman, 1999). The LoA was presented as a fraction of the possible value range. The classification accuracy was also reported. For the regression models, thresholds to binarize predictions for accuracy calculation were computed by splitting the range of predictions equally (e.g., 3-class problem with predictions ranging from 0 to 2: class 1; class 2; class 3).
Statistics
Statistical difference between models was determined using a two-sided -test and metric bootstrapping (500 iterations). Models with a p-value smaller than 0.05 were considered significantly different. The normality of the distribution was verified using the Shapiro-Wilk test ().
3 Results
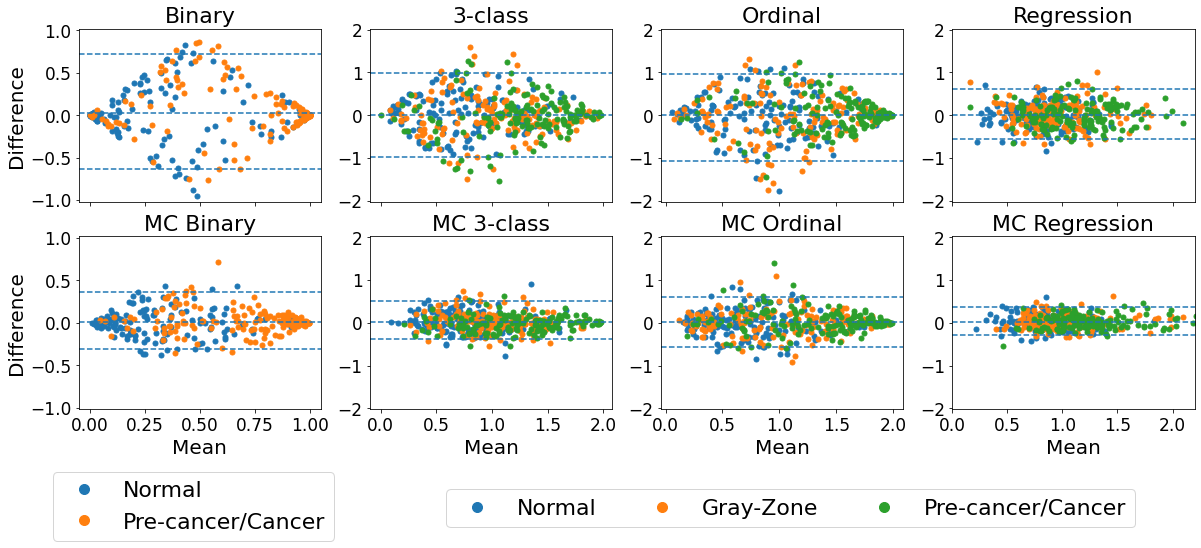
Bland-Altman plots of all model types for cervical classification are summarized in Figure LABEL:fig:bland_altman. Ideally, all cases would lie near a horizontal line crossing the y-axis at 0 which means the difference between test-retest score is low. For every task, the MC models showed better test-retest reliability than their conventional counterparts with the exception of the regression models. This is illustrated by the narrower 95% LoA and the highest concentration of differences near 0 on the y-axis. The range of predicted values remained similar for MC models, indicating that the effect of the MC model is not simply regressing scores towards the mean.
95% LoA (i.e., repeatability metric) and accuracy for each model can be found in Table LABEL:tab:metric-table. As observed in Figure LABEL:fig:bland_altman, repeatability was statistically improved when using MC models for binary, multi-class and ordinal models for all tasks. On average, across all tasks and classification models (i.e., excluding regression) the 95% limit of agreement improved by 17% points. Increased repeatability translates to smaller disagreement rates during test-retest which is desired for classification tasks. Accuracy increased for all classification MC models. No consistent improvement in classification or repeatability performances was shown when adding MC iterations to regression models over the different medical tasks. Regression models generally showed better repeatability compared with the classification models (i.e., 3-class and ordinal), which reduces the potential to improve repeatability, as regression without MC reaches good repeatability performances compared to the classification models.
4 Conclusion
We evaluated the repeatability of four model types on three medical tasks using distinct model architectures (ResNet18, ResNet50, DenseNet121). We demonstrated that MC sampling during test time leads to more reliable classification models providing more stable and repeatable predictions on different images from the same patient. Only regression models did not show a constant improvement when leveraging MC sampling. MC sampling is flexible as it is applicable to any model type and architecture while being easily implementable. The code used to train and generate results can be found at https://github.com/andreanne-lemay/gray_zone_assessment.
References
- Arbyn et al. (2020) Marc Arbyn, Elisabete Weiderpass, Laia Bruni, Silvia de Sanjosé, Mona Saraiya, Jacques Ferlay, and Freddie Bray. Estimates of incidence and mortality of cervical cancer in 2018: a worldwide analysis. The Lancet Global Health, 8(2):e191–e203, 2020. ISSN 2214109X. 10.1016/S2214-109X(19)30482-6.
- Bland and Altman (1999) J Martin Bland and Douglas G Altman. Measuring agreement in method comparison studies. Statistical methods in medical research, 8(2):135–160, 1999.
- Boyd et al. (1995) N. F. Boyd, J. W. Byng, R. A. Jong, E. K. Fishell, L. E. Little, A. B. Miller, G. A. Lockwood, D. L. Tritchler, and M. J. Yaffe. Quantitative classification of mammographic densities and breast cancer risk: Results from the canadian national breast screening study. Journal of the National Cancer Institute, 87(9):670–675, 1995. ISSN 00278874. 10.1093/jnci/87.9.670.
- Bratti et al. (2004) M Concepción Bratti, Ana C Rodríguez, Mark Schiffman, Allan Hildesheim, Jorge Morales, Mario Alfaro, Diego Guillén, Martha Hutchinson, Mark E Sherman, Claire Eklund, et al. Description of a seven-year prospective study of human papillomavirus infection and cervical neoplasia among 10 000 women in guanacaste, costa rica. Revista Panamericana de Salud Pública, 15:75–89, 2004.
- Brown et al. (2018) James M. Brown, J. Peter Campbell, Andrew Beers, Ken Chang, Susan Ostmo, R. V.Paul Chan, Jennifer Dy, Deniz Erdogmus, Stratis Ioannidis, Jayashree Kalpathy-Cramer, and Michael F. Chiang. Automated diagnosis of plus disease in retinopathy of prematurity using deep convolutional neural networks. JAMA Ophthalmology, 136(7):803–810, 2018. ISSN 21686165. 10.1001/jamaophthalmol.2018.1934.
- Cao et al. (2019) Wenzhi Cao, Vahid Mirjalili, and Sebastian Raschka. Rank-consistent ordinal regression for neural networks. arXiv preprint arXiv:1901.07884, 1(6):13, 2019.
- Catarino et al. (2015) Rosa Catarino, Patrick Petignat, Gabriel Dongui, and Pierre Vassilakos. Cervical cancer screening in developing countries at a crossroad: Emerging technologies and policy choices. World Journal of Clinical Oncology, 6(6):281–290, 2015. ISSN 22184333. 10.5306/wjco.v6.i6.281.
- Gal and Ghahramani (2016) Yarin Gal and Zoubin Ghahramani. Dropout as a bayesian approximation: Representing model uncertainty in deep learning. In international conference on machine learning, pages 1050–1059. PMLR, 2016.
- Hinton et al. (2012) Geoffrey E Hinton, Nitish Srivastava, Alex Krizhevsky, Ilya Sutskever, and Ruslan R Salakhutdinov. Improving neural networks by preventing co-adaptation of feature detectors. arXiv preprint arXiv:1207.0580, 2012.
- Hu et al. (2019) Liming Hu, David Bell, Sameer Antani, Zhiyun Xue, Kai Yu, Matthew P. Horning, Noni Gachuhi, Benjamin Wilson, Mayoore S. Jaiswal, Brian Befano, L. Rodney Long, Rolando Herrero, Mark H. Einstein, Robert D. Burk, Maria Demarco, Julia C. Gage, Ana Cecilia Rodriguez, Nicolas Wentzensen, and Mark Schiffman. An Observational Study of Deep Learning and Automated Evaluation of Cervical Images for Cancer Screening. Journal of the National Cancer Institute, 111(9):923–932, 2019. ISSN 14602105. 10.1093/jnci/djy225.
- (11) International Agency for the Prevention of Blindness IAPB. VISION2020. URL https://www.iapb.org:8443.
- Li and Lin (2007) Ling Li and Hsuan-Tien Lin. Ordinal regression by extended binary classification. 2007.
- Liberman and Menell (2002) Laura Liberman and Jennifer H. Menell. Breast imaging reporting and data system (BI-RADS), 2002. ISSN 00338389. URL https://pubmed.ncbi.nlm.nih.gov/12117184/.
- MONAI Consortium (2020) The MONAI Consortium. Project monai, December 2020. URL https://doi.org/10.5281/zenodo.4323059.
- Paszke et al. (2017) Adam Paszke, Sam Gross, Soumith Chintala, Gregory Chanan, Edward Yang, Zachary DeVito, Zeming Lin, Alban Desmaison, Luca Antiga, and Adam Lerer. Automatic differentiation in pytorch. 2017.
- Pisano et al. (2005) Etta D. Pisano, Constantine Gatsonis, Edward Hendrick, Martin Yaffe, Janet K. Baum, Suddhasatta Acharyya, Emily F. Conant, Laurie L. Fajardo, Lawrence Bassett, Carl D’Orsi, Roberta Jong, and Murray Rebner. Diagnostic Performance of Digital versus Film Mammography for Breast-Cancer Screening. New England Journal of Medicine, 353(17):1773–1783, 10 2005. ISSN 0028-4793. 10.1056/NEJMoa052911. URL http://www.nejm.org/doi/abs/10.1056/NEJMoa052911.
- Ryan et al. (2014) Michael C. Ryan, Susan Ostmo, Karyn Jonas, Audina Berrocal, Kimberly Drenser, Jason Horowitz, Thomas C. Lee, Charles Simmons, Maria Ana Martinez-Castellanos, R. V.Paul Chan, and Michael F. Chiang. Development and Evaluation of Reference Standards for Image-based Telemedicine Diagnosis and Clinical Research Studies in Ophthalmology. AMIA … Annual Symposium proceedings / AMIA Symposium. AMIA Symposium, 2014:1902–1910, 2014. ISSN 1942597X.
- Schiffman and Solomon (2003) Mark Schiffman and Diane Solomon. Findings to date from the ascus-lsil triage study (alts). Archives of pathology & laboratory medicine, 127(8):946–949, 2003.
- Srivastava et al. (2014) Nitish Srivastava, Geoffrey Hinton, Alex Krizhevsky, Ilya Sutskever, and Ruslan Salakhutdinov. Dropout: a simple way to prevent neural networks from overfitting. The journal of machine learning research, 15(1):1929–1958, 2014.
- Xue et al. (2020) Zhiyun Xue, Akiva P. Novetsky, Mark H. Einstein, Jenna Z. Marcus, Brian Befano, Peng Guo, Maria Demarco, Nicolas Wentzensen, Leonard Rodney Long, Mark Schiffman, and Sameer Antani. A demonstration of automated visual evaluation of cervical images taken with a smartphone camera. International Journal of Cancer, 147(9):2416–2423, 2020. ISSN 10970215. 10.1002/ijc.33029.