Dense Molecular Clouds in the Crab Supernova Remnant
Abstract
Molecular emission was imaged with ALMA from numerous components near and within bright H2-emitting knots and absorbing dust globules in the Crab Nebula. These observations provide a critical test of how energetic photons and particles produced in a young supernova remnant interact with gas, cleanly differentiating between competing models. The four fields targeted show contrasting properties but within them seventeen distinct molecular clouds are identified with CO emission; a few also show emission from HCO+, SiO and/or SO. These observations are compared with Cloudy models of these knots. It has been suggested that the Crab filaments present an exotic environment in which H2 emission comes from a mostly-neutral zone probably heated by cosmic rays produced in the supernova surrounding a cool core of molecular gas. Our model is consistent with the observed CO J=3-2 line strength. These molecular line emitting knots in the Crab present a novel phase of the ISM representative of many important astrophysical environments.
1 Introduction
Massive stars explode via core collapse and ejection of surrounding layers. Large abundances of refractory elements in those layers may produce dust and molecules; these supernovae may be the dominant source of dust and molecules in the early Universe (Sarangi et al. 2018a). ALMA has identified CO, 28SiO and 29SiO (Kamenetzky et al. (2013), Matsuura et al. (2017)) as well as copious amounts of dust (0.7 ) in the core collapse supernova 1987A inner ejecta; the mass of molecular material continues to increase as the remnant evolves. Dust (0.1-0.6 Barlow et al. (2010), De Looze et al. (2017)) and molecules (Wallström et al. 2013) have also been observed in the more evolved (330 year-old) remnant Cas A, the remnant of a type IIb supernova of a massive supergiant. Dust has also been measured in G54.1+0.3, which appears to have at least 0.3 in the more evolved (1500-3000 year old) remnant of its 16 to 27 progenitor (Rho et al. 2018; Temim et al. 2017). Here we investigate the chemistry of a remnant of intermediate age, the Tau A remnant, the Crab Nebula, which appeared in 1054.
The Crab Nebula is a prime example of a nearby and easily observable though more evolved young remnant of the common Type IIp core-collapse supernova. These SNe ejecta are efficient and productive dust sources among supernovae (Sarangi et al. 2018a). The Crab is a pulsar wind nebula well known for its expanding bubble of relativistic plasma that produces strong synchrotron radiation and cosmic rays. These in turn impinge on and excite a filamentary system of condensations that have formed around the exterior of the bubble. The ionized gas in these condensations has been heavily studied with special interest in the unusual chemical abundances produced in the SN. The molecular content of the filaments has been little explored since the discovery of relatively bright infrared lines of H2 (Graham et al. 1990). Measurement of the molecular content can reveal gas isotopic composition, as well as details of the chemical evolution of the gas in the thousand years since the supernova. The gas chemistry traces interaction of high-energy particles and photons with the molecular gas and may inform us how gas behaves in similar environments found in distant cool-core galaxy clusters, AGN and in SNe found early in the history of galaxies.
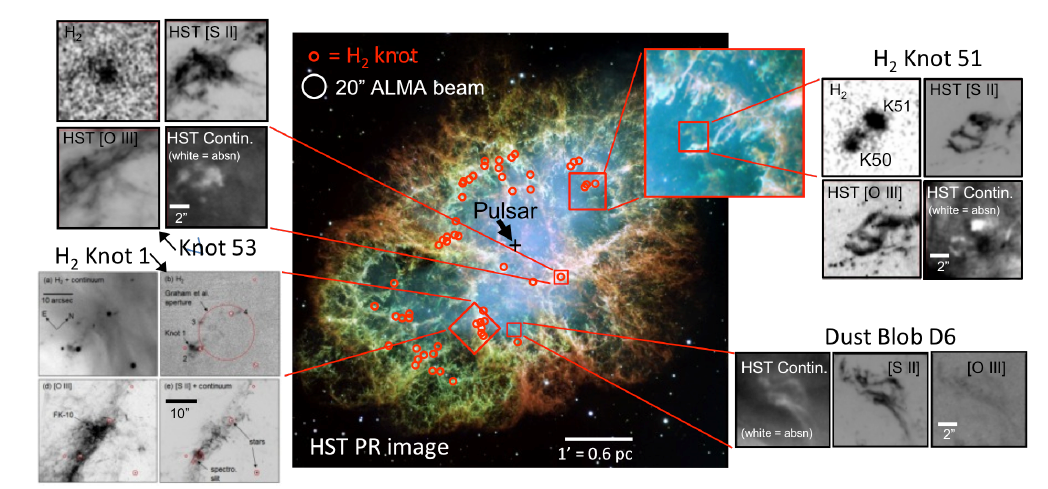
Data have been obtained from a detailed, pan-chromatic examination of the Crab’s molecular component. We used our guaranteed time on the 4m SOAR Telescope to discover 55 individual knots that are strong sources of H2 2.12 m emission (Loh et al. 2010, 2011). Our follow-up near-IR spectroscopy (Loh et al. 2012) showed that the H2 excitation temperature is 3000 K. We assembled all pertinent HST narrow-band emission-line images as well as Spitzer and Herschel data (see examples in Fig 1). These show that the H2 knots generally follow the optical filament system, but are associated with strong low-ionization optical emission lines from which we have measured the knots’ velocities.
These data constrain detailed Cloudy models (Richardson et al. 2013). The knots may be excited by synchrotron radiation, which is well constrained, or some other source of heating. The other sources of heating may be shocks or electrons and positrons from the pulsar. Priestley et al. (2017) find that a greatly enhanced cosmic ray ionization rate, by 7 orders of magnitude, over the standard interstellar value is required to account for the OH+ and ArH+ detected lines, and lack of [C I] emission in the Herschel SPIRE FTS spectrum of the Crab (Barlow et al. 2013). The models that fit the K-band H2 emission and optical lines show that the H2 emission must come from what is really an extended HI zone in which a very high electron density leads to formation of H2 through the H- route rather than in the usual way on dust. This zone is then heated, probably by cosmic rays produced in the Crab, to excite the trace amount of H2. This is an exotic and almost completely unexplored environment for producing molecular emission, one that we seek to characterize with ALMA observations in this paper.
To that end, we have also catalogued 280 small (arcsec scale) absorption blobs caused by dust silhouetted against the Crab’s synchrotron continuum and compared their positions to the H2-emitting knots. Many of these were recently discussed by Grenman et al. (2017). A few H2 knots are clearly associated with dust features, but most are not. However, the dust blobs often are associated with small knots of low-ionization gas for which we can measure velocities using our grid of optical spectra. The radial velocities show that most dust blobs are on the near side of the Crab’s expanding shell, while most of the H2 knots are on the far side. Typical extinction through the dust blobs is A 0.5 mag, corresponding to N(HI) 1021 cm-2 up to a few times higher. This gas has so far not been seen in either 21 cm HI emission or absorption. It would be confused with ISM emission in the LAB survey, and the published absorption maps (e.g. Greisen 1973) do not cover a sufficient velocity range. Key questions include: What are the physical properties of the H2-emitting knots, including the density, temperature, and mass? What is the physics that governs the molecular emission? What excites the molecular emission and what is its chemistry? What are the dust properties in this very young SN remnant? Is there also a component of cooler molecular gas? What is the connection between the dust blobs, the H2 knots, and other molecular species such as CO? We address these issues with new data obtained with ALMA reported here.
We used ALMA to measure molecular emission from CO J=3-2, and from HCO+, SiO and SO from four ALMA fields in the Crab nebula (Figure 1): (1) Knot 51, a bright H2 knot that also has dust absorption; (2) Knot 1, a bright H2 emitting knot that does not show dust absorption; (3) Knot 53, an H2 knot for which we have observations seeking CO J=2-1 using the 30-m IRAM telescope and the Plateau de Bure interferometer; and (4) as a control sample, a dust blob D6 that is not a strong H2 emitter.
2 Observations
Observations (Table 1) were made with ALMA in the 850m window (Band 7) in December 2015 on four occasions using a hybrid array during a transition from an extended configuration to a compact one. These data did not meet the brightness sensitivity proposed for the observations, therefore a second set of observations was obtained 16 June 2016 in a more compact configuration (C40-4) using 40 12m antennas deployed on baselines from 17 to 784m. The largest scales to which the observations are sensitive are 11″. The flux scale was set via observations of J0510+1800 (S345.6GHz=1.08Jy).
| Date | Nant | Baselines | PWV | Flux Calibrator | Flux |
|---|---|---|---|---|---|
| m | mm | Jy | |||
| 12-Dec-15 | 31 | 15.2 - 7700 | 0.7 | J0237+2848 | 1.48 |
| 12-Dec-15 | 31 | 15.2 - 7700 | 0.65 | J0510+1800 | 2.6 |
| 15-Dec-15 | 43 | 15.1 - 6300 | 0.94 | J0423-0120 | 0.62 |
| 15-Dec-15 | 42 | 15.1 - 6300 | 0.94 | J0510+1800 | 2.6 |
| 16-Jun-16 | 40 | 16.7 - 783.5 | 0.81 | J0510+1800 | 1.08 |
Note: All integration periods were 2922 4 s.
Four pointings toward particular dust and/or H2-emitting globules were made within a single session on 16 June. In each pointing, four spectral windows 1.875 GHz wide were observed centered near 345 GHz to cover the four spectral lines listed in Table 2 to provide maximal continuum sensitivity and spectral grasp. The raw data were processed by the ALMA/NA Regional Center using the CASA package 4.5.3; nearby quasars were used for flux and bandpass calibration as listed in Table 1. The phase calibrator used was J0521+2112 (S345.6GHz=2002.4mJy).
CASA clean was used in the delivered data with standard robust=0.5 weighting, tapered to 0.45” beam to produce data cubes matching the proposal request for locating emission lines within the 17″ FWHP primary beam. All 1906 channels were imaged for each spectral window. The beam size of the delivered data was 0.49 by 0.43″ at position angle -37o, with velocity resolutions listed in Table 2. In the delivered 16 June data, the sensitivity was 3.7mJy in those bandwidths. Continuum sensitivity was about 75 Jy. The data was re-imaged to take advantage of the higher resolution which could be realized from all the data delivered (including Dec 2015 data) using natural weighting, which produced a 0.33 x 0.25″ beam at PA -36o at a sensitivity of 2.8 mJy/beam or about 400mK. It is on these images which we report.
| Species | Frequency | Transition | Eu | v |
|---|---|---|---|---|
| (GHz) | (K) | km s-1 | ||
| CO | 345.79599 | 3-2 | 33.2 | 0.979 |
| SO | 346.528481 | 8(9) - 7(8) | 78.8 | 0.979 |
| HCO+b | 356.73422 | 4-3 | 42.8 | 0.979 |
| SiO | 347.33058 | 8-7 | 75 | 0.979 |
3 Results
Molecular knots in the Crab may be identified using different tracers. The most complete description of the character of a knot includes aspects derived from all tracers. For each knot, we discuss the relationship between the various tracer components-warm H2, dust and target molecules-to develop a more comprehensive view of the character of the cool molecular emitting component.
3.1 Knot 51
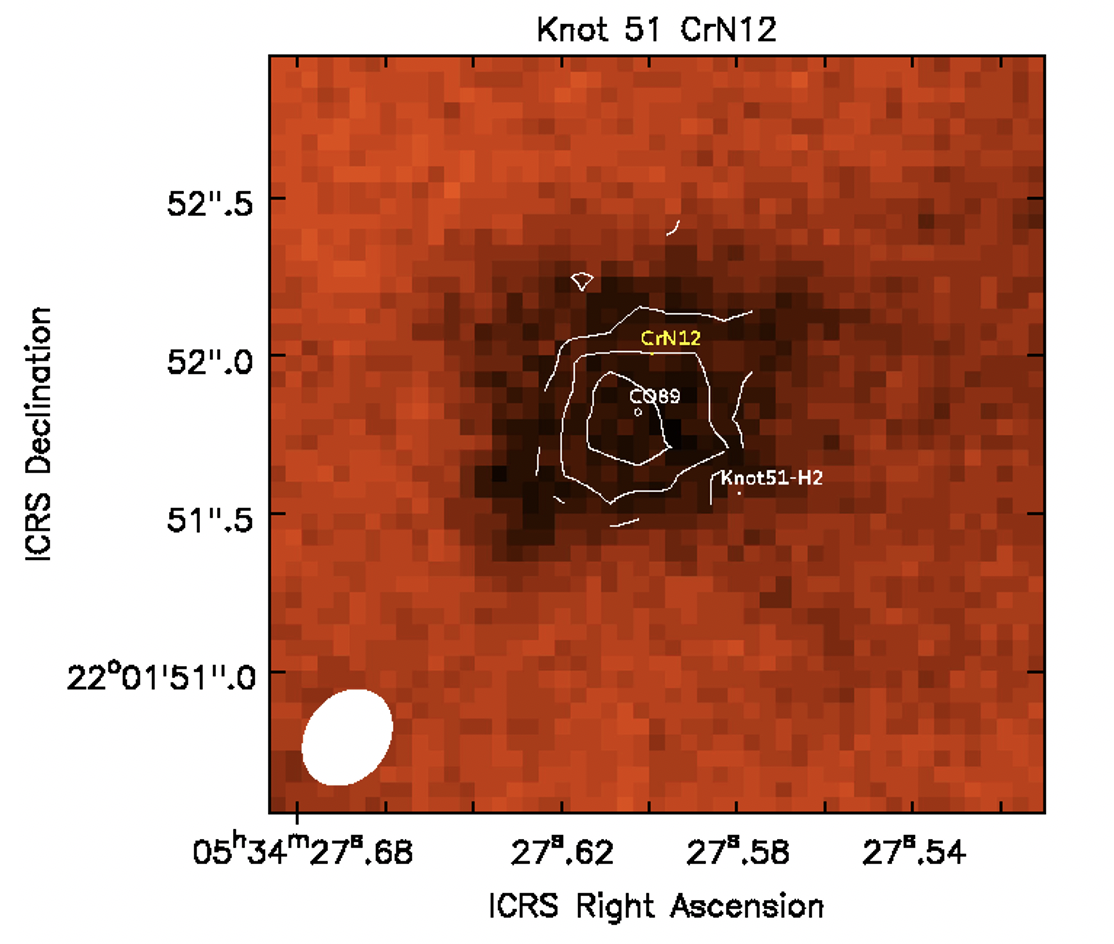
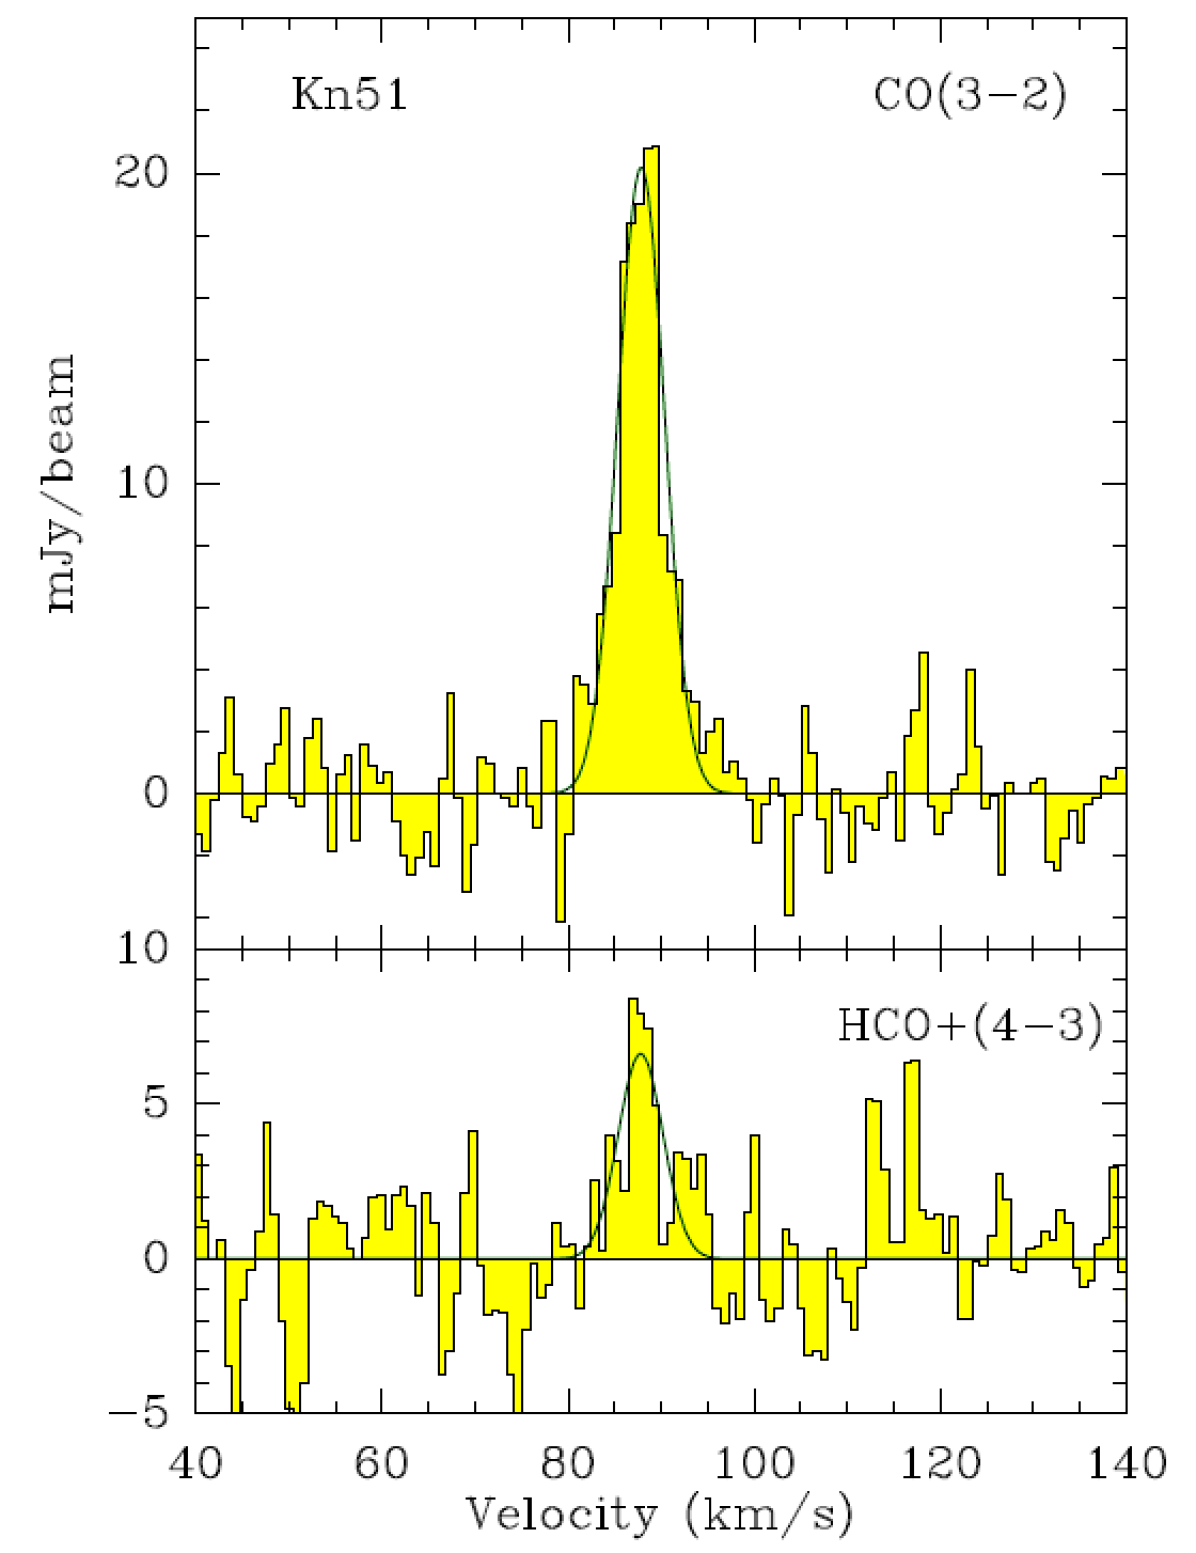
Spatially distinct and isolated, near the tip of an inwardly reaching finger of a gas filament to the northwest of the pulsar wind nebula, this diameter dust globule (CrN12 in Grenman et al 2017) was modeled by Richardson et al. 2013. In this globule different tracers reveal different aspects of related spatial structures at different wavelengths. H2 traces higher excitation neutral gas. A small H2 radial velocity (VLSRK=103.4 100 km s-1(Loh et al. 2012) coupled with the large transverse velocity (1340 km s-1) measured for the dust knot CrN12 suggests that the knot lies near the nebular midplane, following its expansion westward in the plane of the sky, on the outskirts of the remnant (Grenman et al. 2017). Grenman et al. (2017) measured CrN12 to subtend 1.2″(2400AU) diameter and estimated a dust mass for it of 1.6 . We clearly detect a distinct and cospatial CO emission feature from Knot51, at VLSRK=89 km s-1 illustrated in Figure 2, suggesting association of the CO gas with both the dust and the warmer H2 gas. Allowing for nebular expansion of 0.01″/yr in the two years between the HST images of the dust knot and the ALMA observation, the integrated CO image closely follows the contours of the dust knot as seen in Figure 1, as does H2. This, along with the kinematic evidence, suggests close association between dust, H2 and CO. The full velocity width to half maximum intensity of the CO feature is 5 km/s; the deconvolved size of the CO emission is in a beam. HCO+ emission was also seen from Knot 51 (Figure 3) though only limits were measured for SiO and SO. Knot 51 lies very close to Knot 50 and 52, both also sources of H2 emission. Knot 52 (dust counterpart CrN8 in Grenman et al. (2017)), with no CO counterpart, lies to the west. The third H2 knot, Knot 50, also without CO, lies southeast of Knot51 with the same radial velocity but its dust counterpart shows much less absorption (Amag) compared to more than 2.6mag for Knot51 (Richardson et al. 2013). No millimeter continuum emission was detected from the region, consistent with expectations given our sensitivity.
To try to understand the nature of Knot 51, Richardson et al. (2013) compared a number of different Cloudy models involving very different density structures and excitation mechanisms. In order to reproduce the observed H2 intensity ratios, they found that in addition to the Crab’s synchrotron radiation field, extra heating by particles or some other source is required (their “temperature floor” and “ionizing particle” models). These models were arbitrarily truncated at the back edge of the neutral zone that produces the H2 emission, and therefore predicted very little CO emission.
However, as Richardson et al. (2013) pointed out in their section 4.4, there could also be an extensive zone of cooler molecular gas which would produce strong CO and other molecular lines but no significant H2. As an example, they showed some results from a representative “fully molecular core” model which did not include the extra heating sources needed to produce the observed H2 spectrum, but which (crucially) extended to a depth (5 cm) which was 8 times greater than for the temperature floor and ionizing particles models. Their figure 15 demonstrates the factor of times greater predicted strength of CO lines (relative to the already-observed H2 lines) from the fully molecular core model as compared to the temperature floor model.
The CO observations described here require a great deal more molecular gas than is present in the temperature floor or ionizing particle models. The observed integrated CO 3-2 flux is 11 K km s-1. The temperature floor model predicts only 0.43 K km s-1, which is about 25 times smaller than is observed, while the ionizing particle model predicts times less CO emission than is observed. This shows that a significant fully molecular core must be present. However, the observed H2 emission cannot come only from a cold fully-molecular region, because the accompanying CO 3-2 emission would then be far stronger than is observed. Therefore, the true situation must be that the observed H2 emission comes from a thin warm layer that emits little CO, while the CO emission comes from a moderately deep molecular core behind it.
Our single observed transition of the rotational ladder does not provide strong constraints on the molecular excitation; however the upper levels of the transitions detected in some knots (Table 1) lie between 33 and 79K suggesting a high excitation, due to high volume density, as in the fully molecular core model. Then the CO excitation temperature should be equal to the dust temperature. The Richardson et al. (2013) model predicted grain temperatures between 38 and 54K, which they note is in agreement with Gomez et al. (2012) who fit unresolved Herschel submillimeter emission with cold and hot dust components at 28 and 63K respectively, depending upon grain composition. We assume Tex=40K in what follows, similar to the average dust temperature for the nebula of =41K determined by De Looze et al. (2019). In the Richardson et al. (2013) “dense core” model, the density reaches n(H2)=106 cm-3, sufficient to couple gas and dust temperatures, particularly in an environment where excitation may involve electron as well as neutral particle collisions. A neutral gas temperature of 40K and density of cm-3is also consistent with excitation estimates for SN87A (Matsuura et al. 2017); the density is similar to that in the high-J CO knots in Cas A (Wallström et al. 2013). Under these conditions, the column density of CO in Knot51 is N(CO)=51015cm-2 within the measured dust core diameter of 1200 AU. Grenman et al. (2017) estimated a dust mass for CrN12 of 1.6 . Assuming a gas to dust ratio of 100 and a mean molecular mass of 2.33, we derive a CO abundance relative to H2 of X(CO)=7.6 , somewhat lower than commonly cited ISM values (Liszt 2007). Knot51 also shows HCO+ emission; with the same excitation conditions we find an HCO+ column density of N(HCO+)=()1012cm-2 and an abundance relative to H2 of X(HCO+)=7. , using the LTE excitation modeling program Radex (van der Tak et al. 2007). Neither SiO nor SO emission were detected from this knot. For all molecular knots, given the excitation estimates and 3 noise levels used here, column densities for undetected emission (S3mJy/beam) are estimated to lie below N(HCO+)=51011cm-2, N(SiO)=31013cm-2 and N(SO)=21013cm-2.
3.2 Knot 1
Located directly on a very bright filament on the opposite (eastern) side but not so far ( 0.6pc) in projection from the pulsar emission nebula as Knot 51, Knot 1 is a complex, bright emitting knot (Loh et al. 2010) that does not have clear dust absorption in the Hubble continuum images. It is the brightest knot in the Loh catalogue (Loh et al. 2011) and among the largest, extending 5″ 2″ approximately along an EW axis. Knot 1 covers about four times the area of Knot 51 in H2 emission. The radial velocities (heliocentric) were measured to be 145 100 km s-1(Loh et al. 2012). The positive recession velocities suggest that from our viewpoint the material in Knot 1 lies on the far side of the remnant, illuminated on its face by the pulsar wind nebula, consistent with the absence of clear dust absorption. Barlow et al. (2013) reported OH+ and ArH+ in this general vicinity (ArH+ occurred at Vhelio=140 34 km s-1, quite similar to the H2 in the stronger Knot1 NW component).
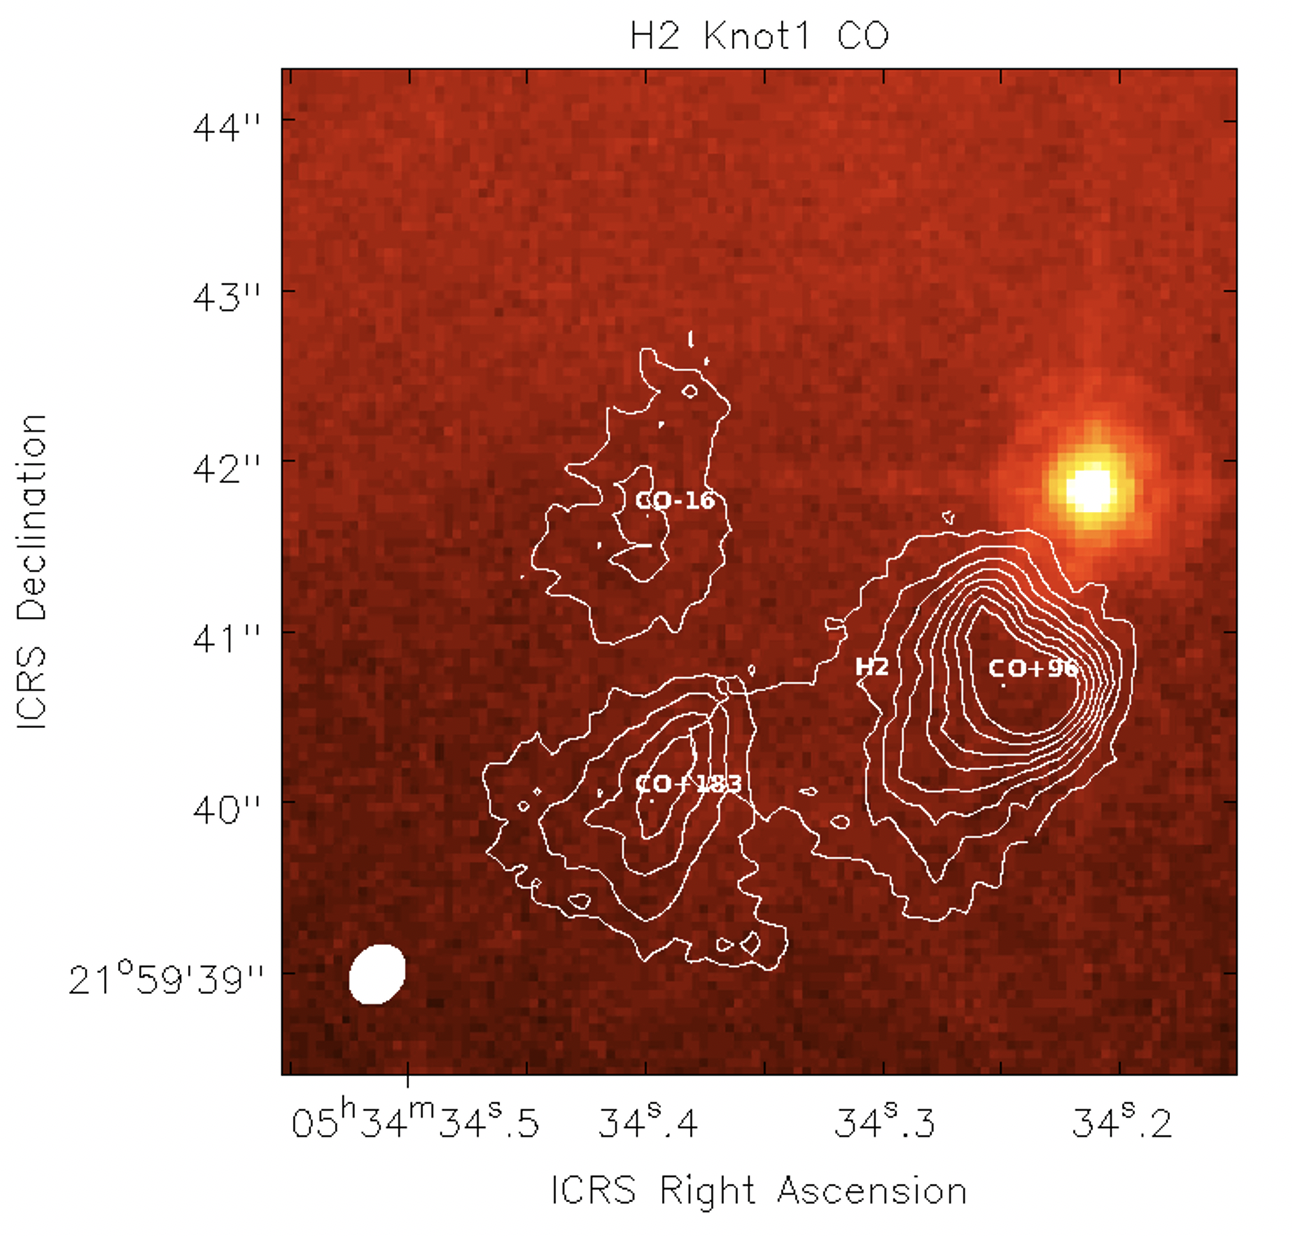
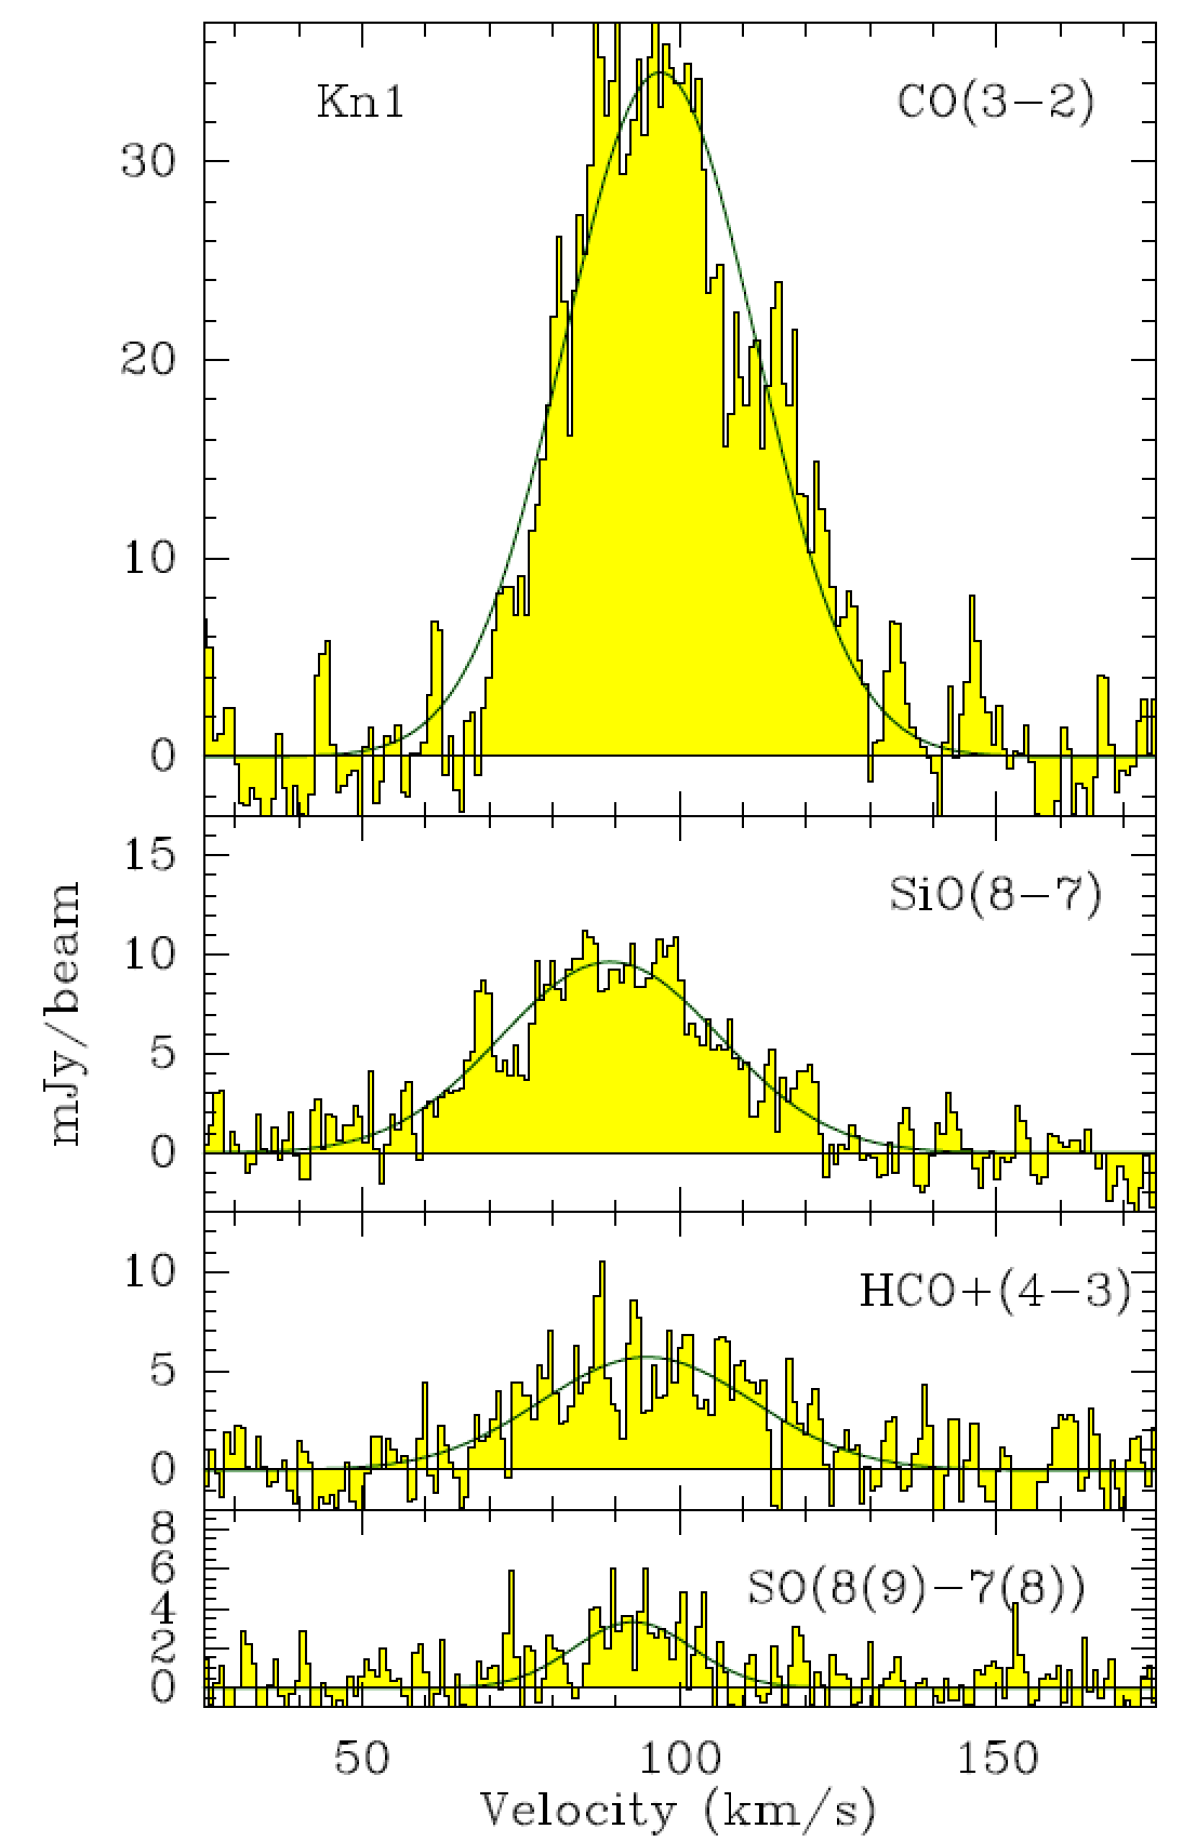
ALMA imaged three prominent distinct CO spatio-kinematic components in Knot 1 at radial velocities of VLSRK=96 km/s, VLSRK=183 km s-1and VLSRK=-16km s-1as listed in Table 3 and illustrated in Figure 4. All components lay spatially and kinematically separated within a roughly 3″by 3″region in the center of the field, roughly centered on the location of Knot 1 in , suggesting a physical association with that emission. Line widths (FWHM) range up to 40km s-1, six times those observed in Knot 51. Each component is distinct in its spatial and velocity characteristics suggesting that the three emitting regions lie separated along the line of sight within a complex structure. The northwestern component is the stronger and consists of two intermingled sub-components oriented NE-SW with slightly more positive velocities to the SW; the variation is much less than the line width. On the basis of position, CO integrated strength and velocity, we suggest Knot1NW-CO+96 is probably most closely associated with the cloud. Loh et al. (2012) estimated a lower limit to the molecular mass of 5 .
We assume an excitation temperature for the molecules in Knot 1 as in Knot 51. We estimate CO columns for the three molecular components as listed in Table 3, from 0.8 to 4 10; Knot1NW-CO+96 is the most prominent of these.
Lacking dust absorption measurements, the total dust column in Knot 1 cannot be as well-characterized as it is in Knot 51. Loh et al. (2012) estimated that the total H2 mass in Knot 1 could be 0.05, corresponding to a dust mass which might be detectable as thermal dust emission in our observations. In fact, our slightly tapered continuum image ( at PA ) for Knot 1 clearly showed continuum emission from the location of the H2 over a region of similar extent to that subtended by the CO emission, at least for Knot1NW and Knot1E. However, even using the more favorable gas to dust ratio of Owen & Barlow (2015) the continuum flux translates to about 4 solar masses. This is unrealistic given the mass of the progenitor star. It is likely dominated by synchrotron emission. Indeed, we detect for the two globules Knot1NW and Knot1E, over a surface of 40 beams, (or 3.6 10-4 pc2), a total integrated continuum emission S870μm = 25 mJy 12 Jy. The detected continuum is probably dominated by synchrotron emission by a factor 100, since the emission is too strong to be produced by dust. Such non-thermal emission is expected since these globules belong to a conspicuous radio/optical filament. Knot 1 appears to be the most massive observed knot, as suggested by its H2 or CO line fluxes. It shows the brightest emission from each of the other molecules within the band, characterized in Table 3. Why are there continuum knots? ALMA observations of the 100 GHz continuum with a lower resolution (Dubner et al. 2017) reveal multiple inhomogeneities, corresponding to plasma confined to magnetic field lines, including wisps, arches and loops. Lacking a clear radio counterpart or optical absorption, the dust mass of Knot 1 remains uncharacterized.
The 96 km s-1(NW) and the 183 km s-1(E) components both showed emission from SiO J=8-7, SO 8(9) - 7(8) and HCO+ J=4-3. In Knot1-NW the SiO emission originates from the same region at the same velocity (Figure 5); however HCO+ emission centers about 1000 AU NNE of CO and SiO. Emission from all molecules is coincident in the E component. Assuming the same excitation for all four molecules, we obtain the molecular column densities as listed in Table 3.
3.3 Knot 53
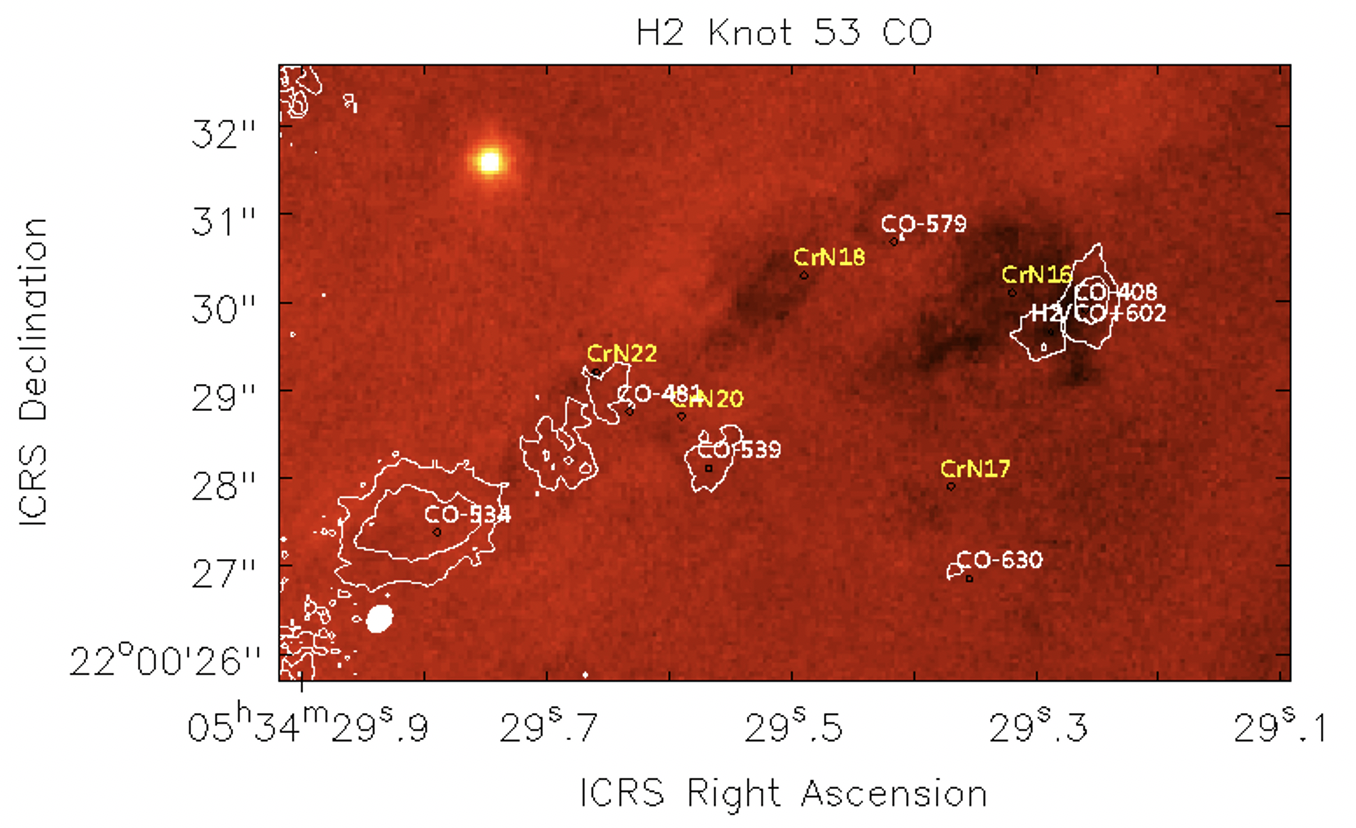
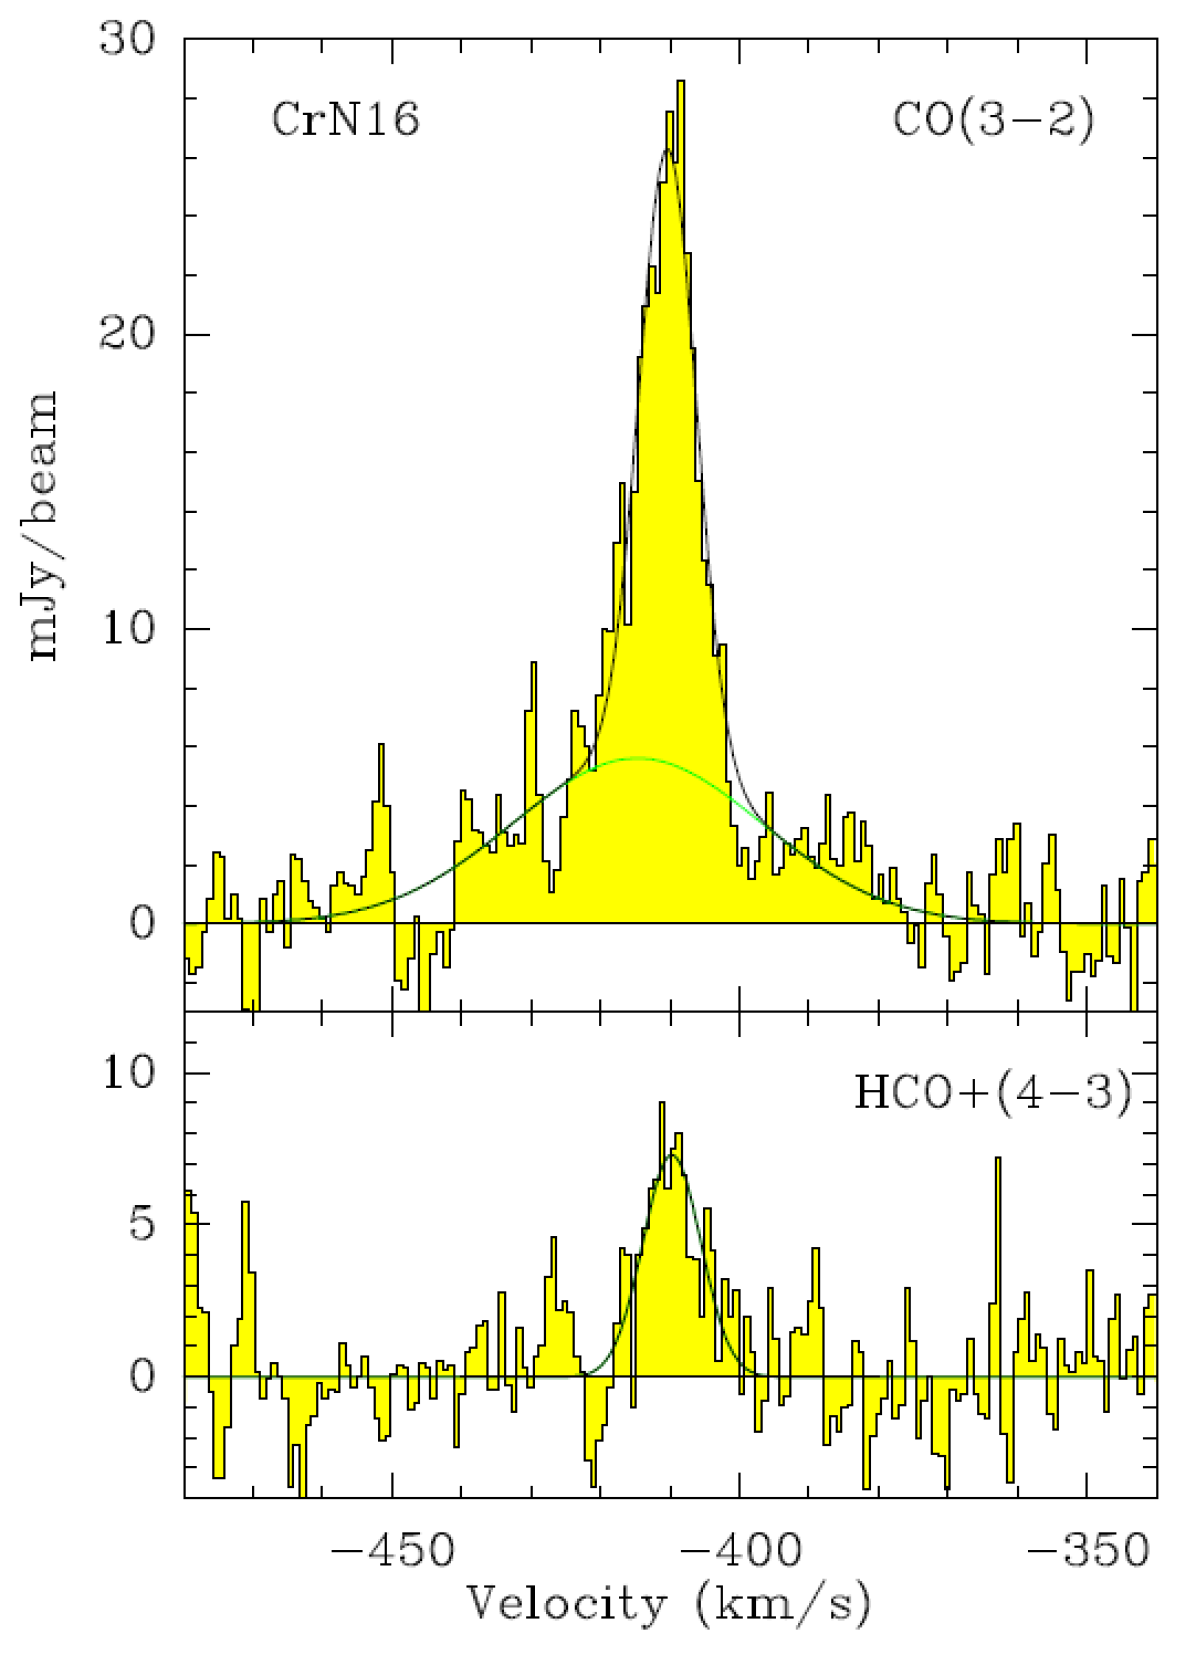
Knot 53 is located closest in projection from the pulsar, and as might therefore be expected lies within a region of complexity and brightness exceeded only by the region around Knot 1. Knot 53 had previously been the target of CO J= 2-1 observations from the IRAM 30m telescope and the Plateau de Bure interferometer. The noise level was rms 5 mJy in 2.5 km/s channels at 230GHz, 3 times higher than the ALMA rms at 345 GHz. The non-detection is compatible with the present ALMA results, since the expected CO(2-1) signal is lower by at least a factor 2 with respect to the CO(3-2) signal (Salome et al, private communication). This expected signal is assuming a dense molecular core, and a CO excitation temperature coupled to the dust temperature of 35-40K. This is consistent with the fully molecular core model of Richardson et al. (2013). Knot 53 is situated at the western head of a trail of dust knots seen in the HST image, which mark the loci of a major filament (‘E’ in the Hester et al. (1990) notation) in the Crab. The unresolved filament is also seen in Herschel images (De Looze et al. 2019). There are several dense gas tracers identified within the ALMA primary beam, which targeted relatively strong molecular hydrogen emission at Vhelio=696 km s-1(VLSRK=668 km s-1). Barlow et al. detected ArH+ J=1-0 in detector C3 at Vhelio=933 33 km s-1and ArH+ J=2-1 in D4 at 743 26 km/s in this direction. H2 and ArH+ are probably associated with a particular far-side CO element, Knot53/H2/+591. CO emission in this region arises from two kinematic components, the molecular hydrogen emission component Knot53/H2/+591 and an CO feature at VLSRK=-408 km s-1, on opposite sides of the Crab at velocities separated 1000 km s-1along one line of sight but less than half an arcsec in projected distance apart (Figure 6). CrN16 is a prominent dust globule coincident with the CO feature, for which Grenman et al. (2017) estimated a dust mass of 5.8 within a radius of 2″(2000AU). Grenman et al. (2017) measured proper motion for the dust globules in this region; the expansion of the nebula moves them generally southwestward with time. Between the Grenman et al. (2017) measurements in 2014 and the ALMA observations in mid-2016, all Knot53 features are expected to have moved 0″.14 generally along position angle 99o, consistent with the differences we observe between dust and CO gas. Positional coincidence suggests that the CO feature at -408km s-1arises within CrN16. An HCO+ emission peak also coincides with CrN16 in position and velocity (Figure 7)
In all, ten CO features lie within the Knot53 field, with radial velocities between VLSRK=-620.2 km s-1and 601.5 km s-1; seven are shown in Figure 6, spread across a portion of the ALMA field of view. Six of these show approaching velocities, centered east of Knot53-H2, along the trail of dust features, spanning 5″ with velocities between -630 and -408.0 km s-1. Knot53/CrN16/-408 lies at the western end of this chain.
We further identify CrN20 in Grenman’s list as the host dark cloud for the CO emission feature at VLSRK=-539 km s-1(W). CO within a nearby distinct cloud to the east lies at VLSRK=-534 km s-1associating with very weak dust absorption uncatalogued by Grenman. Dust globule CrN22 associates with CO at VLSRK=-496 km s-1. Some prominent dark globules have no apparent CO emission–for example CrN18 is quite prominent but the only nearby CO, that at VLSRK=-591 km s-1, appears to be associated only with a small uncatalogued globule to its NE. Even smaller CrN17 is, however, probably associated with weak broad CO emission near VLSRK=-630 km s-1.
Three CO features with receding velocities lie in the far western portion of the field out of the Figure 6 field. Knot53-CO+532 and Knot53-CO+540 lie west of Knot53-CO+286, oriented along PA 40 with V 530 in the NE increasing to 544 in the SW, broad and perhaps splitting in the SW. These are SW of the main pulsar wind nebula with no clear associated features in the HST image.
In summary, of the ten CO clouds we find in the Knot 53 field, six at positive velocities can reasonably be associated with near-side dust globules catalogued in Grenman et al. (2017), one cloud probably relates to the far-side H2 and ArH+ emission. Three at negative velocities seem unrelated to dust absorption in HST images or to H2 emission.
Figure 7 shows spectra of CO and HCO+ towards the prominent CrN16 absorbing cloud. We assume an excitation for the molecules in each of the Knot 53 clouds as in Knot 51. As before, we use the Grenman et al. (2017) dust mass and size estimates to derive a column density for H2 which can then be compared to the CO column to provide an estimate of the CO abundance. For instance, for CrN16, we estimate N(H2)=2.7 and thus derive a CO abundance relative to H2 of X(CO)=7 , similar to CrN12 but lower than commonly cited values for Galactic clouds (e.g., Liszt 2007).
3.4 Knot D6
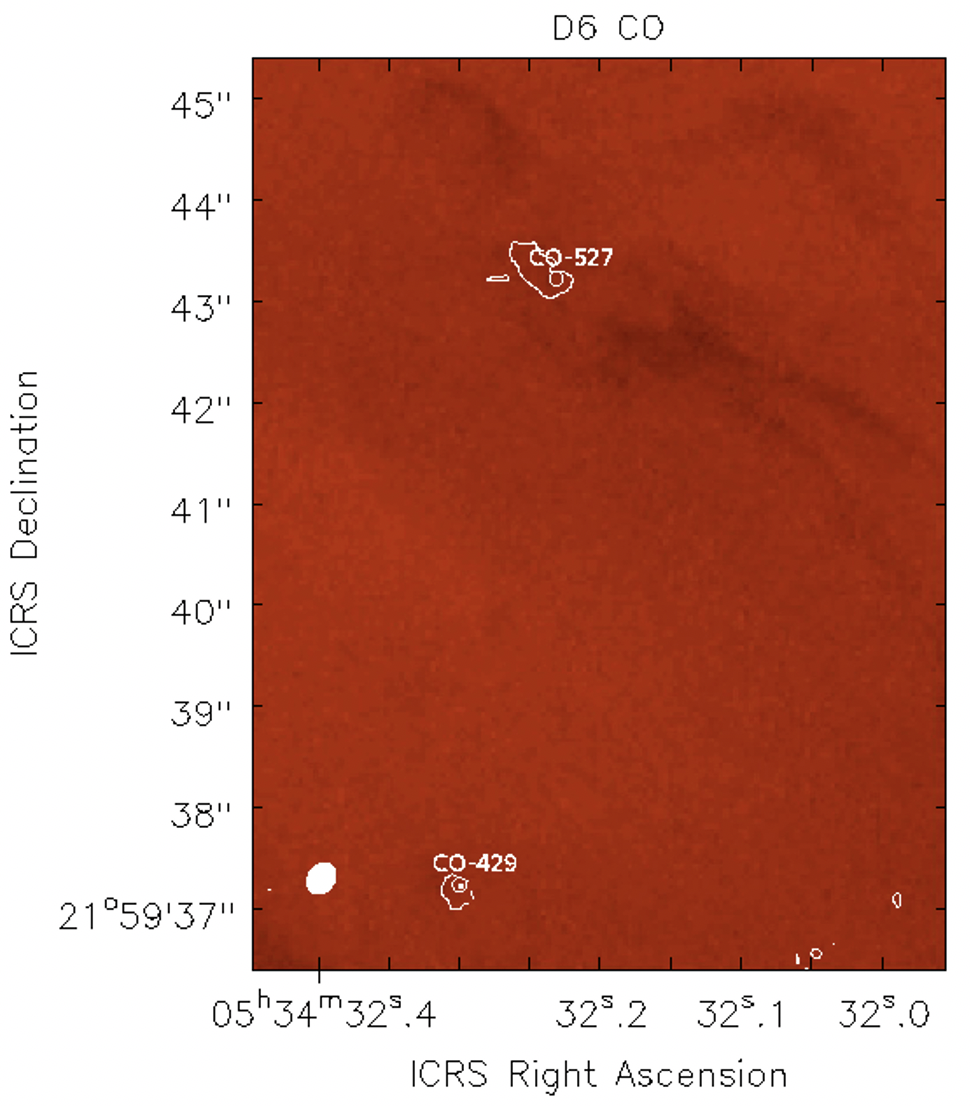
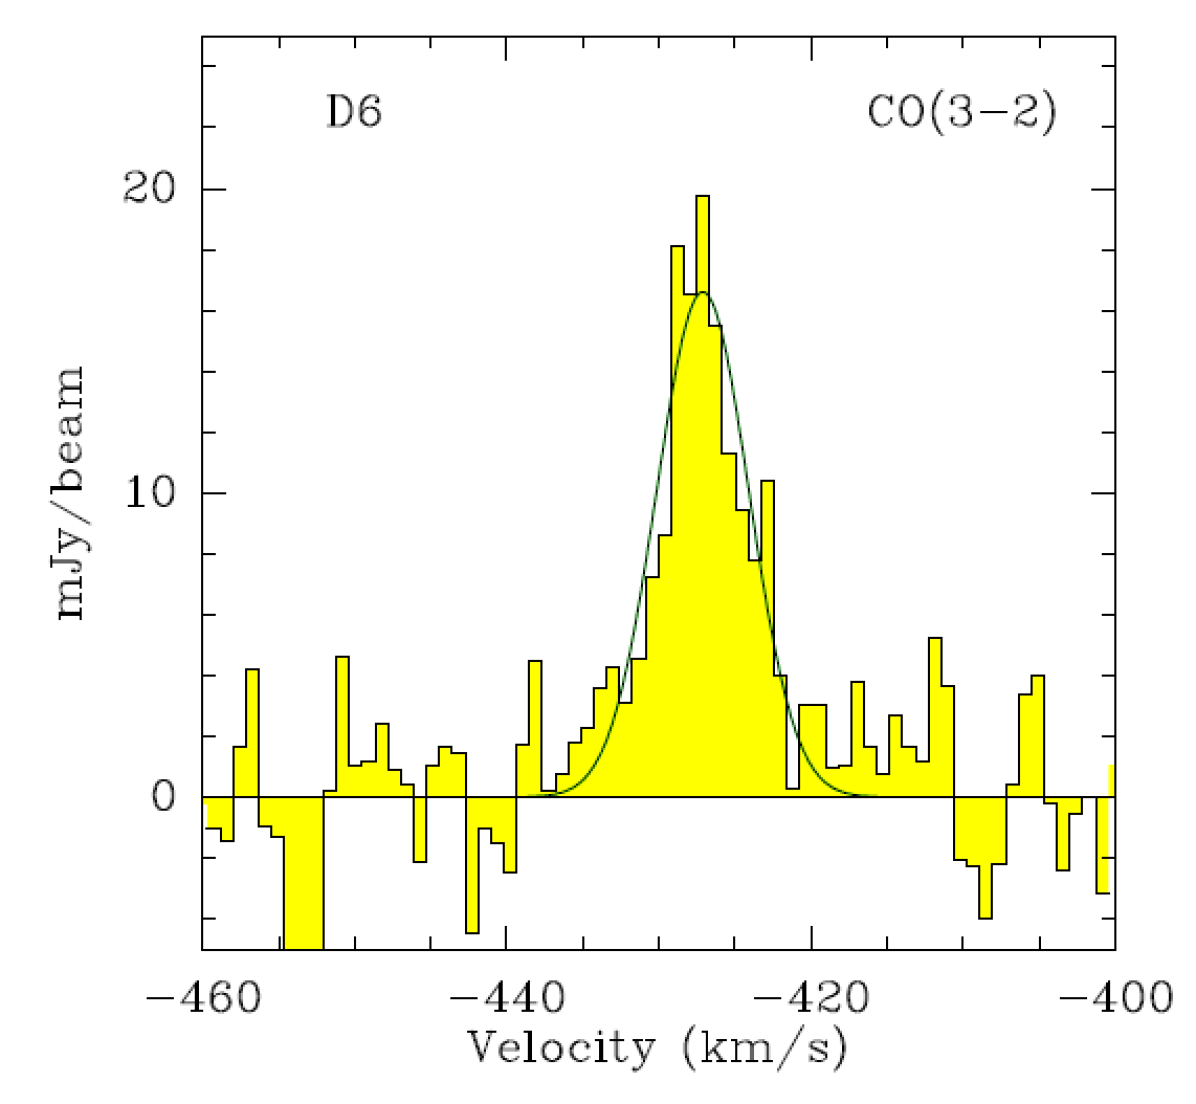
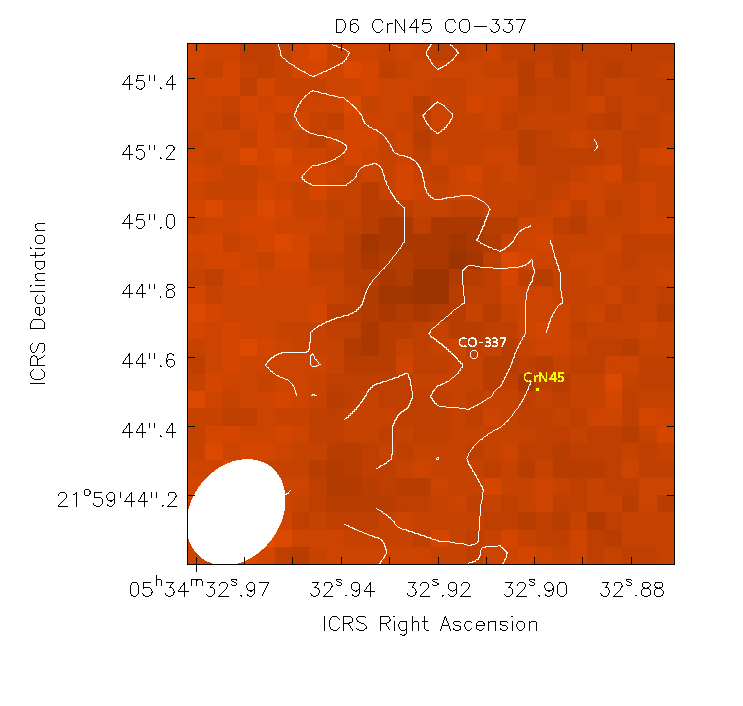
D6 lies somewhat more distant (0.8pc) in projection from the pulsar than other targeted features. H2 was not detected toward D6 by Loh et al. (2011). Several dust features festoon the region, which includes features denoted as CrN 39, 40, 41 and 45 by Grenman et al. (2017), with transverse velocities between 200 and 500 km s-1. None of the knots tabulated in that study coincides exactly with the dust feature D6 which sprawls around a small central CO feature, and which has a velocity of VLSRK=-521 km s-1on the approaching side of the nebula (Figure 8). Barlow et al. detected ArH+ J=2-1 at Vhelio-572 25 km/s near D6, perhaps associated with the same feature. In the eastern part of the field, the CO feature at VLSRK=-337 km s-1lies about one synthesized beam southwest of the HST image location of dust globule CrN45 (Figure 10). Both that dust feature and the CO feature are similar in size, 0.5″, slightly elongated in a SE-NW direction. The offset of the centroids of the two features is consistent with the expected proper motion. We identify CrN45 with the CO cloud on this basis. A third CO feature was also detected south of the central D6 dust feature at VLSRK=-429 km s-1, but without apparent dust absorption in the HST image.
No emission was detected from HCO+, SiO or SO toward any of the CO clouds in the D6 field. We assume an excitation for the CO molecules in each of the clouds as in other knots. As before, we use the Grenman et al. (2017) dust mass and size estimates to derive a column density for H2 which can then be compared to the CO column to provide an estimate of the CO abundance for the only cloud with CO and well-characterized dust, CrN45. There we estimate N(H2)=4.1 and N(CO)=5.5 thus derive a CO abundance relative to H2 of X(CO)=2 , somewhat higher than in the previous knots where CO abundance could be derived.
4 Discussion
Perhaps the simplest of the fields is that of the isolated Knot 51, the subject of some previous modeling by Richardson et al. (2013). The rough H2-CO positional agreement does not suggest that the H2 and CO emission come from a spatially identical region. The most likely geometry is one where H2 comes from very warm gas near the surface of the globule, since temperatures approaching 3000 K are needed to excite H2 (Ferland et al. 2008), while the CO originates in a much colder molecular core. The molecular hydrogen mass given in the last column of Table 3 is the mass of the unobserved cold H2 that is co-spatial with the CO. Their models required that the surface have an additional source of heating, which is almost certainly energetic particles (Richardson et al. 2013; Priestley et al. 2017). CO observations did not exist at that time so their comments on CO emission are parenthetical and not the result of directed modeling. Table 4 provides estimates of CO, HCO+ and SiO abundances for the seven globules where those molecules are observed which also have H2 masses from Grenamn’s dust measurements and where the extent of the molecular emission is the same as Grenman measured for dust.
A variety of clouds are seen. Seventeen globules have CO emission, others have CO and H2, and seven have CO emission with associated dust. Of the 17 CO emission regions we have described (Table 3), ten occur in regions of dust absorption. These must occur on the near side of the nebula, both to absorb the synchrotron continuum and to account for that fact that nine have negative CO velocities. Four CO clouds also show H2 emission, at positive velocities, but lack dust absorption. Since H2 emission also occurs at positive velocities, these clouds must lie on the far side of the expanding nebula. Four CO clouds have neither clear H2 emission nor dust absorption.
The distribution of CO emitters is symmetric in velocity suggesting that ALMA detects most of the clouds within the Crab in its limited field of view. The H2 clouds are mostly receding (Loh et al. 2011) suggesting that typically these have a large enough column density to extinguish the 2 micron emission and hide the H2 from our vision. It follows that the extra heating needed to produce the H2 emission must predominantly deposit energy in the side of the globule facing the pulsar wind nebula.
The dust masses and column densities listed in Tables 3 and 4 have significant, factors of , uncertainties. The Crab Nebula is chemically inhomogeneous with some regions having an especially high helium abundance. The grain material depends on the chemistry of the cold molecular gas in which it forms and the grain size distribution, which determines its reddening, depends on the grain formation/destruction history. Despite this, the evidence suggests that the dust in the cores is similar to ISM grains. Although there are models for each of these processes, they are not robust and depend on many parameters. Grenman et al. (2017) derived dust masses from Av measurements. The extinction law for dust grains in these globules matches a normal interstellar extinction law. This is evidence for a globule composition similar to normal interstellar grains. We note that the ALMA observations detect mainly the small globules and not the larger filaments which have been studied by Herschel. It would not be surprising if the dust in the globules and filaments were different and this introduces a further uncertainty in our analysis. We provide these column densities from Grenman et al. (2017) for each absorbing globule to determine a point of reference; for Knot 1, with neither dust absorption (it is on the nebular far side) nor emission, only molecular column density is measured.
The fact that the Crab Nebula is young and not interacting with the ISM eliminates one major area of uncertainty, but also important is the fact that both the fluxes and energy distribution of locally generated cosmic rays have likely not been significantly modified due to the interaction with ISM and can thus be estimated fairly well (Ivlev et al. 2018; Padovani et al. 2018). The summary of molecular column density (4) suggests an elevated HCO+ abundance in Knot51 with respect to Knot 53, which may suggest changes in , but further observations are needed to secure this hint.
5 Summary
Spurred by Richardson et al. (2013) who present a range of models for knots observed in the Crab, particularly the “fully molecular core” model of Knot 51, we have undertaken a small survey. We have imaged four 17″ fields of the Crab supernova remnant selected for H2 emission and/or apparent dust absorption with ALMA, with spectral windows covering emission from CO, HCO+, SiO and SO emitting in the 850 m window. Localized emission is found from seventeen clouds, typically under 1000AU in size, in the CO molecule. Four knots show HCO+ emission. In H2 Knot 1, at both of the locations and velocities of two CO clouds all four molecules–CO, HCO+, SiO and SO are detected. These observations favor the “fully molecular core” model applying to a range of knot configurations. In this fully molecular core model, the emission of H2, CO and other molecules does not come from the same region. CO (and HCO+, SiO, SO) emission occurs in the globule core, and H2 on the surfaces. H2 emission requires high temperatures suggesting cosmic ray excitation. Inside dense globules, the gas is cooler, H2 may be present, but only the CO emission will be visible.
Our ALMA observations of Knot 51 show that a significant column density of molecular gas must be present, in addition to the thin skin that produces the H2. Figure 15 of Richardson et al. (2013) shows that the molecular emission produced by the fully molecular core discussed in their paper is far more intense than their competing temperature floor model that was optimized to reproduce only the H2 observations. The H2 emission originates in a warm skin so does not require an extensive fully molecular core. Our CO observations strongly support the fully molecular core for Knot 51 since a large column density of molecular gas is needed.
A new generation of spectral models is needed to really harvest the information in the current data set or uniquely determine the energy source of the molecular regions. The Richardson et al. (2013) models focused on the remarkably strong H2 emission. Little was known of the CO spectrum so it was a parenthetical effort in that work. As a result, these models were not optimized to determine the energy source for the molecular core using the lines ALMA has detected. There has also been significant advances in the chemistry (Shaw & Ferland (2021); Shaw et al. (2020) and in preparation) and observations of molecules such as ArH+ are now available. A new unified modeling and observational effort may be able to discern between such competing energy sources as penetrating energetic particles or shocks.
The emitting regions encompass portions of a variety of structures observed at other wavelengths. Three (H2 Knots 1, 51 and 53) were selected as associated with known sources of molecular hydrogen emission. CO was found to be associated with (but not cospatial with) H2 in each of these; notably Knot 1 harbors three CO features, two of which also emit in the HCO+, SiO and SO lines; all are less extensive than the warm H2 emission. Of the latter two, Knot1NW-CO+96 is the more massive but both may contribute to the H2 cloud. We note that a line survey of the much younger SN1987A remnant also showed emission from cool CO, HCO+, SiO and SO molecules, possibly from post-explosion elemental mixing.
Eight of the clouds showing CO emission, including Knot51, were found to be associated with absorption patches identified against the nebular emission as catalogued by Grenman et al. (2017). Four CO emission regions were not identified with absorption or with H2 emission features. Some H2 emitting knots showed no associated CO (e.g. Knot 50) while some prominent absorption patches did not show detectable CO emission (e.g. CrN18).
For the obscuring clouds Grenman et al. (2017) provided estimates of visual absorption, which we have used to estimate the total column of H2. Using assumptions for the excitation of CO, SiO, HCO+ and SO based on Richardson et al. (2013) models we estimated molecular column densities. The models do not predict substantial warm CO, consistent with non-detection of higher-J CO lines in the much lower resolution Barlow et al (2013) SPIRE FTS spectra. Abundances derived from the comparison of H2 and molecular columns suggest that these globules are chemically similar to the diffuse interstellar medium. Therefore, in the thousand years since the supernova which produced the Crab Nebula, chemical processes have produced a molecular retinue similar to those seen in regions of presumably far more advanced age. For the few younger remnants for which there is data, a similar collection of molecules have been identified (Matsuura et al. 2017). Molecules can therefore provide good estimators of physical conditions within newly identified cool and dense clumps within the evolving remnant.
Other regions, like the helium-rich belt, have very different compositions. The Crab is probably also not chemically homogeneous in the molecular knots that are the focus of this work. Deep ALMA and JWST observations of these anomalous regions should be a high priority for future work.
The optical, IR, and now sub-millimeter observations suggest that the globules have a common geometry with a cool molecular core that is detected in CO, surrounded by a warmer molecular layer emitting H2. These are encased in an envelope of ionic emission seen in the HST images. Individual knots are a combination of these basic ingredients, with different amounts of each in different knots. This shows that a surprisingly simple basic geometry can account for what appears overly complex.
The Richardson et al. (2013) study focused on understanding the near infrared H2 emission and was not guided by the type of sub millimeter observations now possible with ALMA. Nonetheless, they postulated that globules with fully molecular cores were likely, although they would be too cool to contribute to the observed H2 emission. The CO and other sub-millimeter lines we detect strongly support the existence of such a fully molecular cores in some globules although it is not possible to identify the heating mechanism. The low-J CO lines are thermalized so mainly determine the temperature. Other diagnostics, not available to the Richardson et al. (2013) study and so not predicted by them, should reveal the energy source for the molecular cores. These should be the focus of future studies.
The geometry and spectra of Crab Nebula filaments are eerily similar to the filaments seen in cool core clusters of galaxies (Fabian et al. 2008; Ferland et al. 2009; Fabian et al. 2011). Indeed, this was the original motivation for the Richardson et al. (2013) study, as they explain. Even the gas pressures are analogous, with cm-3 K for Knot 51 in the Crab and cm-3 K for well-studied regions of the Perseus cluster. Only some differences might be noted: the metallicity of the gas is higher in the Crab filaments, being expelled by the massive central star, while the cooling gas in clusters is a mixture of primordial gas and ejecta from the central galaxy. The gas metallicity in the Perseus cluster is estimated to be 0.3 solar (Sanders et al. 2004). Dust is forming in supernovae ejecta (Sarangi et al. 2018b), while it has difficulty to survive the sputtering in clusters (Draine & Salpeter 1979). The similarities in the gas excitation provided the original motivation to understand the far closer Crab Nebula filaments. Ferland et al. (2009) argued that the cluster filaments are excited by energetic particles mixing with atomic and molecular gas. Our current work shows that this process accounts for the emission from cool dense regions of Crab globules as well. The bright and well spatially resolved Crab Nebula thus provides a laboratory to understand nearby analogues of the cool-core cluster environment.
| Field | RA | Dec | Velocity | Width | Int. Flux | FWHM | N(X) | M(H2) |
| J(2000.0) | J(2000.0) | km s-1 | km s-1 | K km s-1 | arcsec | cm-2 | 10-4M⊙ | |
| Knot51/H2/CrN12/89 | 5:34:27.603 | 22:01:51.81 | 89. | 5 | 11 | 0.4 | 15 | 1.7 |
| Knot53/CrN17/-630 | 5:34:29.355 | 22:00:26.85 | -630 | 30. | 30 | 0.4 | 6.7 | |
| Knot53/CrN18/-590 | 5:34:29.417 | 22:00:30.68 | -590 | 1.6 | 2.4 | 0.5 | 0.6 | |
| Knot53/CrN20W/-539 | 5:34:29.568 | 22:00:28.11 | -539 | 11.7 | 33 | 0.5 | 8.4 | |
| Knot53/CrN20E/-534 | 5:34:29.790 | 22:00:27.38 | -534 | 14.3 | 54 | 0.6 | 14.3 | |
| Knot53/CrN22/-496 | 5:34:29.633 | 22:00:28.75 | -496 | 8.1 | 25.9 | 0.6 | 6.1 | |
| Knot53/CrN16/-408 | 5:34:29.260 | 22:00:29.91 | -408 | 8 | 32. | 0.9 | 88.4 | |
| Knot53/+286 | 5:34:28.531 | 22:00:34.6 | 286 | 3 | 18 | 0.5 | 4.5 | |
| Knot53/+532 | 5:34:28.479 | 22:00:33.09 | 532 | 9 | 17.5 | 0.4 | 3.0 | |
| Knot53/+540 | 5:34:28.457 | 22:00:32.47 | 540 | 11 | 70 | 0.4 | 8.4 | |
| Knot53/H2/+591 | 5:34:29.288 | 22:00:29.65 | 591 | 5.6 | 21. | 0.8 | 14.8 | |
| Knot1-CO-16 | 5:34:34.40 | 21:59:41.67 | -16 | 15 | 20 | 0.5 | 4.2 | |
| Knot1NW-CO+96 | 5:34:34.250 | 21:59:40.68 | 96 | 28 | 98 | 1.3 | 142. | |
| Knot1E-CO+183 | 5:34:34.398 | 21:59:40.00 | 183 | 15 | 45 | 1.8 | 143. | |
| D6-CO-429 | 5:34:32.30 | 21:59:37.24 | -429 | 5 | 13 | 0.3 | 1.1 | |
| D6-CO-521 | 5:34:32.231 | 21:59:43.22 | -521 | 7 | 4.3 | 0.3 | 0.37 | |
| D6/CrN45-CO-337 | 5:34:32.913 | 21:59:44.58 | -337 | 4.5 | 15 | 1.1 | 17.8 | |
| Knot51/CrN12/-HCO+ 89 | 5:34:27.603 | 22:01:51.80 | 87.5 | 5 | 5.5 | 0.4 | ||
| Knot53/CrN16-HCO+-408 | 5:34:29.25 | 22:00:30.1 | -408 | 8.1 | 8.1 | 0.9 | ||
| Knot1NW-HCO+ +96 | 5:34:34.256ck | 21:59:40.99 | 94. | 40 | 50 | 0.8 | ||
| Knot1E-HCO+ +183 | 5:34:34.387ck | 21:59:40.19 | 182 | 25 | 45 | 0.5 | ||
| Knot1NW-SiO +96 | 5:34:34.256ck | 21:59:40.99 | 94. | 40 | 50 | 0.8 | ||
| Knot1E- SiO +183 | 5:34:34.387ck | 21:59:40.19 | 182 | 25 | 45 | 0.5 | ||
| Knot1NW-SO +96 89 - 78 | 5:34:34.256 | 21:59:40.99 | 96. | 20 | 13 | 0.8 | ||
| Knot1E-SO +183 89 - 78 | 5:34:34.387 | 21:59:40.19 | 183 | 22 | 11 | 0.5 |
| Field | Transition Line | X Column Density | H2 Column Density | Abundance Estimate |
|---|---|---|---|---|
| cm-2 | cm-2 | n(X)/nH | ||
| Kn51/CrN12 | CO 3-2 | (5.5 .2) 1015 | 7.5 1021 | 7. 10-7 |
| Kn53/CrN16 | CO 3-2 | (1.7 .1) 1016 | 2.7 1022 | 7. 10-7 |
| Kn53/CrN17 | CO 3-2 | (1.5 .1) 1016 | 1.4 1021 | 1.1 10-5 |
| Kn53/CrN18 | CO 3-2 | (1.1 .1) 1015 | 7.1 1021 | 1.6 10-7 |
| Kn53/CrN20W | CO 3-2 | (1.6 .7) 1016 | 9.4 1020 | 3.1 10-5 |
| Kn53/CrN22 | CO 3-2 | (1.3 .2) 1016 | 7.1 1021 | 1.6 10-7 |
| Kn51/CrN45 | CO 3-2 | (5.5 .2) 1015 | 4.1 1020 | 1.7 10-5 |
| Kn51/CrN12 | HCO+ 4-3 | (5 .4) 1012 | 7.5 1021 | 7 10-10 |
| Kn53/CrN16 | HCO+ 4-3 | (8 .4) 1012 | 1.4 1021 | 6 10-9 |
References
- Barlow et al. (2010) Barlow, M. J., Krause, O., Swinyard, B. M., et al. 2010, A&A, 518, L138, doi: 10.1051/0004-6361/201014585
- Barlow et al. (2013) Barlow, M. J., Swinyard, B. M., Owen, P. J., et al. 2013, Science, 342, 1343, doi: 10.1126/science.1243582
- De Looze et al. (2017) De Looze, I., Barlow, M. J., Swinyard, B. M., et al. 2017, MNRAS, 465, 3309, doi: 10.1093/mnras/stw2837
- De Looze et al. (2019) De Looze, I., Barlow, M. J., Bandiera, R., et al. 2019, MNRAS, 488, 164, doi: 10.1093/mnras/stz1533
- Draine & Salpeter (1979) Draine, B. T., & Salpeter, E. E. 1979, ApJ, 231, 77, doi: 10.1086/157165
- Dubner et al. (2017) Dubner, G., Castelletti, G., Kargaltsev, O., et al. 2017, ApJ, 840, 82, doi: 10.3847/1538-4357/aa6983
- Fabian et al. (2008) Fabian, A. C., Johnstone, R. M., Sanders, J. S., et al. 2008, Nature, 454, 968, doi: 10.1038/nature07169
- Fabian et al. (2011) Fabian, A. C., Sanders, J. S., Williams, R. J. R., et al. 2011, MNRAS, 417, 172, doi: 10.1111/j.1365-2966.2011.19034.x
- Ferland et al. (2008) Ferland, G. J., Fabian, A. C., Hatch, N. A., et al. 2008, MNRAS, 386, L72, doi: 10.1111/j.1745-3933.2008.00463.x
- Ferland et al. (2009) —. 2009, MNRAS, 392, 1475, doi: 10.1111/j.1365-2966.2008.14153.x
- Gomez et al. (2012) Gomez, H. L., Krause, O., Barlow, M. J., et al. 2012, ApJ, 760, 96, doi: 10.1088/0004-637X/760/1/96
- Grenman et al. (2017) Grenman, T., Gahm, G. F., & Elfgren, E. 2017, A&A, 599, A110, doi: 10.1051/0004-6361/201629693
- Hester et al. (1990) Hester, J. J., Graham, J. R., Beichman, C. A., & Gautier, III, T. N. 1990, ApJ, 357, 539, doi: 10.1086/168941
- Ivlev et al. (2018) Ivlev, A. V., Dogiel, V. A., Chernyshov, D. O., et al. 2018, ApJ, 855, 23, doi: 10.3847/1538-4357/aaadb9
- Kamenetzky et al. (2013) Kamenetzky, J., McCray, R., Indebetouw, R., et al. 2013, ApJ, 773, L34, doi: 10.1088/2041-8205/773/2/L34
- Liszt (2007) Liszt, H. S. 2007, A&A, 461, 205, doi: 10.1051/0004-6361:20065070
- Loh et al. (2011) Loh, E. D., Baldwin, J. A., Curtis, Z. K., et al. 2011, ApJS, 194, 30, doi: 10.1088/0067-0049/194/2/30
- Loh et al. (2010) Loh, E. D., Baldwin, J. A., & Ferland, G. J. 2010, ApJ, 716, L9, doi: 10.1088/2041-8205/716/1/L9
- Loh et al. (2012) Loh, E. D., Baldwin, J. A., Ferland, G. J., et al. 2012, MNRAS, 421, 789, doi: 10.1111/j.1365-2966.2011.20353.x
- Matsuura et al. (2017) Matsuura, M., Indebetouw, R., Woosley, S., et al. 2017, MNRAS, 469, 3347, doi: 10.1093/mnras/stx830
- Owen & Barlow (2015) Owen, P. J., & Barlow, M. J. 2015, ApJ, 801, 141, doi: 10.1088/0004-637X/801/2/141
- Padovani et al. (2018) Padovani, M., Galli, D., Ivlev, A. V., Caselli, P., & Ferrara, A. 2018, A&A, 619, A144, doi: 10.1051/0004-6361/201834008
- Priestley et al. (2017) Priestley, F. D., Barlow, M. J., & Viti, S. 2017, MNRAS, 472, 4444, doi: 10.1093/mnras/stx2327
- Rho et al. (2018) Rho, J., Gomez, H. L., Boogert, A., et al. 2018, MNRAS, 479, 5101, doi: 10.1093/mnras/sty1713
- Richardson et al. (2013) Richardson, C. T., Baldwin, J. A., Ferland, G. J., et al. 2013, MNRAS, 430, 1257, doi: 10.1093/mnras/sts695
- Sanders et al. (2004) Sanders, J. S., Fabian, A. C., Allen, S. W., & Schmidt, R. W. 2004, MNRAS, 349, 952, doi: 10.1111/j.1365-2966.2004.07576.x
- Sarangi et al. (2018a) Sarangi, A., Matsuura, M., & Micelotta, E. R. 2018a, Space Sci. Rev., 214, 63, doi: 10.1007/s11214-018-0492-7
- Sarangi et al. (2018b) —. 2018b, Space Sci. Rev., 214, 63, doi: 10.1007/s11214-018-0492-7
- Shaw & Ferland (2021) Shaw, G., & Ferland, G. J. 2021, ApJ, 908, 138, doi: 10.3847/1538-4357/abdab2
- Shaw et al. (2020) Shaw, G., Ferland, G. J., & Ploeckinger, S. 2020, Research Notes of the American Astronomical Society, 4, 78, doi: 10.3847/2515-5172/ab97ae
- Temim et al. (2017) Temim, T., Dwek, E., Arendt, R. G., et al. 2017, ApJ, 836, 129, doi: 10.3847/1538-4357/836/1/129
- van der Tak et al. (2007) van der Tak, F. F. S., Black, J. H., Schöier, F. L., Jansen, D. J., & van Dishoeck, E. F. 2007, A&A, 468, 627, doi: 10.1051/0004-6361:20066820
- Wallström et al. (2013) Wallström, S. H. J., Biscaro, C., Salgado, F., et al. 2013, A&A, 558, L2, doi: 10.1051/0004-6361/201322576