The Central 300 pc of the Galaxy Probed by Infrared Spectra
of H and CO:
III. Locations of Sgr B2 and Star
Abstract
Using a simple relation between the radial expansion velocity of diffuse gas in the Central Molecular Zone (CMZ) of the Galaxy and its distance from Sgr A∗ we estimate the physical depths within the CMZ of Star (2MASS 17470898-2829561) and two Sgr B2 far-infrared continuum sources with respect to the location of Sgr A∗. To do this we use velocity profiles of mid-infrared absorption lines of H and of far-infrared absorption lines of H2O+, OH+, and 13CH+. The distances to Star and to the Sgr B2 sources are found to be 90 pc greater than the distance to Sgr A∗. Our conclusion that Sgr B2 lies toward the rear of the CMZ is contrary to many previous models in which it has been placed shallower than Sgr A∗.
%================================================================
1 INTRODUCTION
The Galactic center’s (GC’s) giant molecular cloud complex Sgr B2 has played a major role in the discoveries of interstellar molecules. Beginning with the discovery of H2O (Cheung et al., 1969) about 70 molecules have been first observed in Sgr B2 (Woon, 2021) in emission in spite of its large distance and consequent high dilution factor relative to nearer molecular clouds.
There seems to be no consensus on the physical depth of Sgr B2 within the Central Molecular Zone (CMZ) of the Galaxy (Morris & Serabyn, 1996), a roughly disk-like region of radius 150 pc and thickness many tens of pc. It is not even known with certainty whether Sgr B2, which is approximately a distance of 100 pc on the plane of the sky from the supermassive black hole Sgr A∗, generally considered to lie at the very center of the CMZ (herein we use a GC distance of 8 kpc), is to the front or the rear of Sgr A∗ as viewed from the Sun. Initially Rohlfs & Braunsfurth (1982, see their Figure 10) placed Sgr B2 far behind Sgr A∗ in their Galactic center model inferred from observations of HI emission. Later (Sofue, 1995, Figure 10) positioned Sgr B2 as a part of his Arm I about 90 pc in front of Sgr A∗ from extensive analysis of the CO emission in the GC surveyed by Bally et al. (1987, 1988). Sawada et al. (2004, Figure 11) placed Sgr B2 slightly to the rear of Sgr A∗ from analyses of CO and OH spectra. Ryu et al. (2009) concluded Sgr B2 is on the near side from their X-ray study. On the other hand, both Bally et al. (2010, Figue 21) and Molinari et al. (2011, Figure 5) clearly placed Sgr B2 to the rear of Sgr A∗ from their mappings of the far-infrared dust continuum. A measurement of the relative proper motions of Sgr B2 and Sgr A∗, reported in a paper on the trigonometric parallax of Sgr B2 by Reid et al. (2009), led those authors to estimate that Sgr B2 is 130 60 pc in front of Sgr A∗, which might put it outside of the CMZ. Kruijssen, Dale, & Longmore (2015, Figure 6) placed Sgr B2 38 pc in front of Sgr A∗ on their proposed noncrossing orbit. Ridley et al. (2017, Figure 9) also have Sgr B2 in front of Sgr A∗, but by about 80 pc, which is near the front of the CMZ. Most recently Armilotta, Krumholz, & Di Teodoro (2020) concluded that Sgr B2 is on the far side of the CMZ based on the placement of Sgr B2 along Arm I by Sofue (1995, 2017), but adopting the alternative interpretation of Ridley et al. that Arm I is the far spiral arm and Arm II is the near spiral arm.
Among the sightlines toward 18 stars which were used as background sources for obtaining the infrared spectra of H presented in Oka et al. (2019), hereafter Paper I, and in Oka & Geballe (2020), hereafter Paper II, the sightline toward the star that these authors labeled Star (2MASS 17470898-2829561), located 84.5 pc east of Sgr A∗, stands out as having unique velocity profiles of lines of H, extending to much larger positive velocities than the profiles toward any of the other stars. Star , selected in a search for bright stars with smooth continua (Geballe et al., 2019), at Galactic longitude 05477, is located between the nominal centers of two giant molecular clouds, Sgr B2 at longitude 06667 and Sgr B1 at longitude 05059 and is about 17 pc west of the center of Sgr B2. The unprecedented strengths of its H and low overtone CO lines strongly suggest that it is physically associated with Sgr B (Geballe & Oka, 2010). Star , two stars, and to the east of it, together with Star and its nearby neighbors and , located near the western edge of the CMZ (see Table 2 of Paper I) have been the most important stars for elucidating the gas dynamics derived in Paper II (see its Figure 11 for their longitudinal locations in the CMZ). Geballe et al. (2021) provide details of spectra toward and of Star . Since this star is close to Sgr B2, the sightline toward it may pass through some of the same clouds as sightlines toward the bright far-infrared sources near the center of Sgr B2.
In this paper we introduce a new method of determining the locations within the CMZ of Star and Sgr B2 in the CMZ using velocity profiles of the infrared vibration-rotation lines of H and far-infrared rotational lines of H2O+, OH+, and CH+.
2 Radially Expanding Diffuse Gas Observed in the Infrared Spectrum of H
In Paper I we demonstrated that the most of the volume of the CMZ contains warm (200 K) and diffuse (50 cm-3) gas, where is the particle number density. In Paper II we concluded that this gas is moving radially outward from an origin near Sgr A∗ at speeds of up to 150 km s-1 with the outer circumferential surface of the expansion, located 150 pc from the center of the CMZ, possessing the highest speeds. The latter conclusion revives the idea of the Expanding Molecular Ring (EMR) at the boundary of the CMZ, proposed by Kaifu, Kato, & Iguchi (1972) and by Scoville (1972). However, there are three essential differences: (1) The expanding gas viewed in H does not form a ring but fills most of the volume of the CMZ; (2) the gas in the EMR is diffuse and thus much less dense than assumed previously; and (3) the gas is expanding purely radially, without the previously reported rotation. The first of these conclusions suggests that there is a one-to-one correspondence between radial velocity and radial location. As explained below for any CMZ sightline such a relation makes it possible to deduce the locations of continuum sources within the CMZ from observed velocity profiles of lines formed in the diffuse gas.
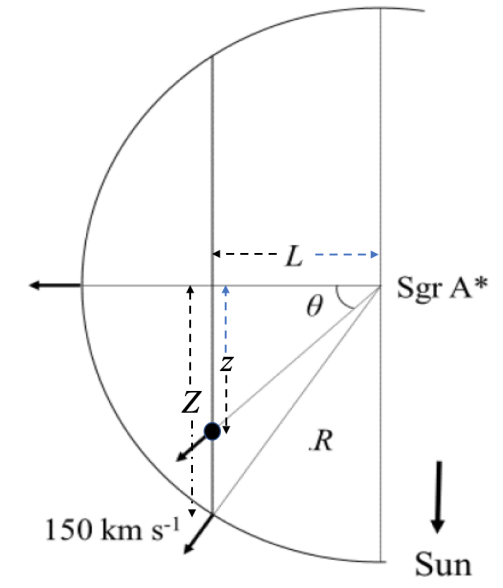
In Figure 1, for a sightline displaced on the sky by from Sgr A∗ the distance that its intersection with the circumferential surface of the CMZ is in front of Sgr A∗ is = and the radial velocity of the gas at the that location is = . The radial velocity at an interior point is unknown. To calculate it one would need to know the distribution of the gas velocities when the explosion occurred. (An estimate of the ejection velocity of the gas that is now at the front surface of the CMZ is given in the Appendix of Paper II.) Here we simply assume that the outward speed of the expanding gas along a radial ray at position is proportional to the distance from Sgr A∗; that is, and its radial velocity as viewed from the Sun is
| (1) |
This is a reasonable assumption in view of the results in Papers I and II. Using this relation, the depth of the position within the CMZ relative to Sgr A∗ is determined from the observed radial velocity simply as = . How accurately this assumption represents the actual variation of the speed of the gas is uncertain but the observed roughly trapezoidal velocity profiles of the absorption lines of H in diffuse gas (Paper II) qualitatively support it.
3 Determination of the Locations of Star and Sgr B2
From Figure 1 it is apparent that for an absorption line arising in the diffuse gas observed in the spectrum of a continuum source located anywhere within the CMZ, the location of the source is defined by the more positive velocity edge of the absorption. In Section 3.1, using the approximate equation (1) we determine the location of Star in the CMZ from velocity profiles of the infrared absorption spectrum of H, mainly observed by the Phoenix spectrometer (Hinkle et al., 1998) on the Gemini South Telescope. Likewise, in Section 3.2 we determine the locations of the far-infrared continuum sources Sgr B2(M) and Sgr B2(N), two high mass star-forming dense molecular cores separated on the sky by 2 pc (Sánchez-Monge et al., 2017) using far-infrared absorption spectra of H2O+, OH+ and 13CH+ observed by the Heterodyne Instrument for the Far-Infrared (HIFI, de Graauw et al., 2010) on the Space Observatory. While H resides both in dense( 5 102 cm-3) and diffuse ( 5 102 cm-3) clouds (see Miller et al., 2020, for descriptions of their basic properties as they pertain to H), the latter three molecular ions can exist only in diffuse clouds, as explained in Section 3.2.
The observed velocity extrema of the absorption lines of the above molecular species are listed in Table 1. We also show and briefly discuss the velocity profiles of H3O+ and NH3, which reside only in dense clouds. The results and their uncertainties are discussed in Section 4.
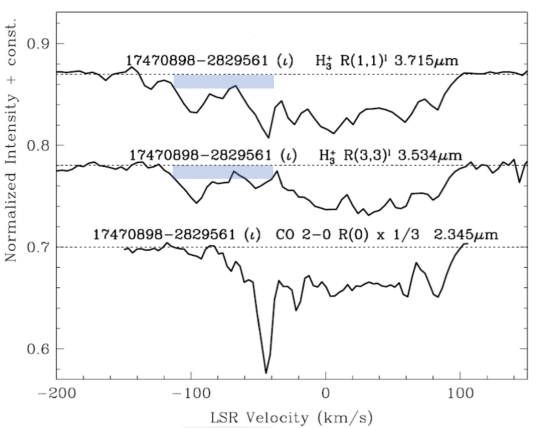
Figure 2, which reproduces a portion of Figure 7 of Paper II, contains the velocity profiles of the (1,1)l and (3,3)l lines of H and the = 20 (0) line of CO. In Paper II absorption at velocities more negative than km s-1 was ascribed to H in diffuse clouds, but the possibility was allowed that diffuse gas is also present at less negative velocities. At positive velocities the rough similarity of the two H line profiles to the CO line profile seems to suggest that, because observable CO = 20 absorption lines arises in dense gas (see Section 1.8 of Paper I), most of the H absorption toward Star also arises in that environment. However this conclusion is incorrect, as explained below.
Although H resides in both dense and diffuse clouds (see, e.g., Oka, 2013; Miller et al., 2020), in the CMZ one can distinguish between the two environments by comparing the profiles of three vibration-rotation lines, arising from the (,) = (1,1), (2,2), and (3,3) levels of the ground vibrational state (only two of which are shown in Figure 2). This is because although the (1,1) and (3,3) levels are populated both in dense clouds and in diffuse clouds (the latter level only when the diffuse gas is sufficiently warm, which is the case in the CMZ; see Paper I), the (2,2) level is populated only in clouds that are both warm and dense. Because H is nonpolar due to its equilateral triangular structure, ordinary rotational transitions are forbidden. However, symmetry-breaking forbidden transitions are allowed (Oka et al., 1971; Watson, 1971; Pan & Oka, 1986). Thus the pure rotational spontaneous transition (2,2)(1,1) can occur; it has a lifetime of 27 days (Neale, Miller, & Tennyson, 1996), for which the corresponding critical density is approximately 200 cm-3. Thus, the (2,2)l line can only be observed when is higher than 200 cm-3 and therefore can test if warm gas is dense or diffuse.
| Source | Molecular Transition | vLSR(min) | vLSR(max) |
|---|---|---|---|
| km s-1 | km s-1 | ||
| Star | H = 10 (1,1)l | ||
| Sgr B2(M) | o-H 111000 = 2.51.5 | ||
| Sgr B2(M) | OH+ = 10, = 01 | ||
| Sgr B2(M) | OH+ = 10, = 21 | ||
| Sgr B2(M) | OH+ = 10, = 11 | ||
| Sgr B2(M) | Mean | ||
| SgrB2(N) | OH+ = 10, = 01 | ||
| Sgr B2(N) | OH+ = 10, = 21 | ||
| Sgr B2(N) | OH+ = 10, = 11 | ||
| Sgr B2(N) | 13CH+ = 10 | ||
| Sgr B2(N) | Mean |
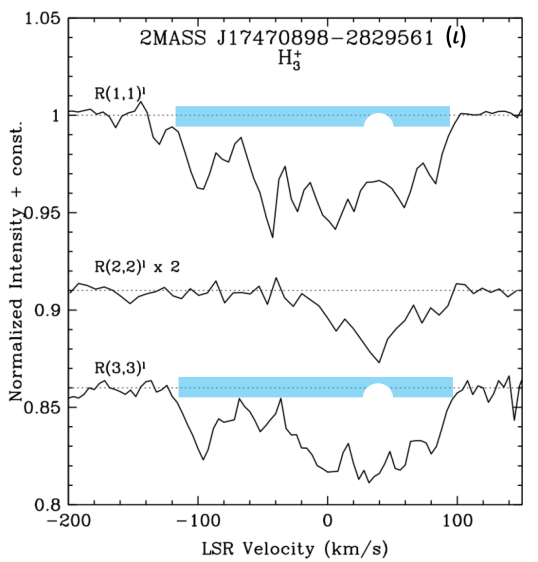
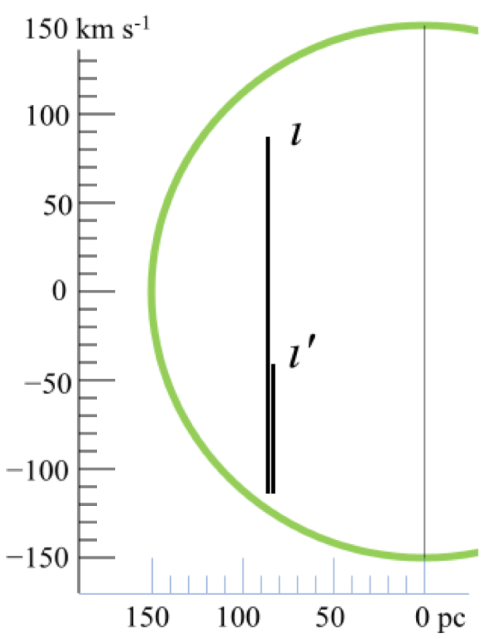
The velocity profiles toward Star of lines from all three of the above levels are shown in Figure 3. Based on the (2,2)l profile, H in dense clouds makes a significant contribution to the absorption near km s-1 but is much less prominent at other positive velocities, although the weak absorption indicates that dense molecular gas extends to a velocity of km s-1. At the velocity of maximum (2,2)l absorption, i.e. at +40 km s-1, the observed depths of the (1,1)l, (2,2)l, and (3,3)l lines are 3.61%, 1.34%, and 4.39%, respectively. Using the absorption strengths of these lines (see Table 1 of Paper I), the level populations of (1,1), (2,2) and (3,3) at that velocity are in the ratios 1.00 : 0.30 : 0.83. Away from +40 km s-1 the strength of the (2,2)l absorption rapidly decreases. In contrast both the (1,1)l and (3,3)l profiles are of roughly constant depth from 0 to 80 km s-1. This implies that in addition to dense gas, warm diffuse gas is present across virtually the entire positive velocity range of the absorption. Since the contributions of dense clouds and diffuse clouds to the (1,1)l and (3,3)l absorption profiles cannot be separated, one cannot easily determine the temperatures and densities of H in the dense gas. For the purposes of this paper, however, it suffices to note that with the possible exception of radial velocities near km s-1 a large fraction of the H resides in diffuse gas. In Figure 3 we therefore indicate the H in diffuse clouds as extending from to km s-1. Inserting km s-1 into equation (1) yields = pc; in other words, Star lies 90 pc behind Sgr A∗. The revised (, ) diagram for Star , corrected from that of Paper II, is shown in Figure 4.
3.1 Locations of Sgr B2(M) and Sgr B2(N)
Unlike H which resides both in dense and diffuse clouds, the cations H2O+, OH+, and CH+ reside only in diffuse clouds. This is because H2 destroys them through efficient hydrogen abstraction reactions: H2O+ + H2 H3O+ + H; OH+ + H2 H2O+ + H; and CH+ + H2 CH + H, respectively with high Langevin rate constants, 0.8310-9, 1.0010-9, and 1.2010-9 cm3 s-1, respectively (Anicich & Huntress, 1986). Thus, their observed velocity profiles correspond purely to velocities of diffuse gas. A complication for the H2O+ and OH+ absorption lines is the presence of hyperfine structure which complicates their profiles.
3.1.1 Comparison of Velocity Profiles of H toward Star and H2O+ toward Sgr B2(M)
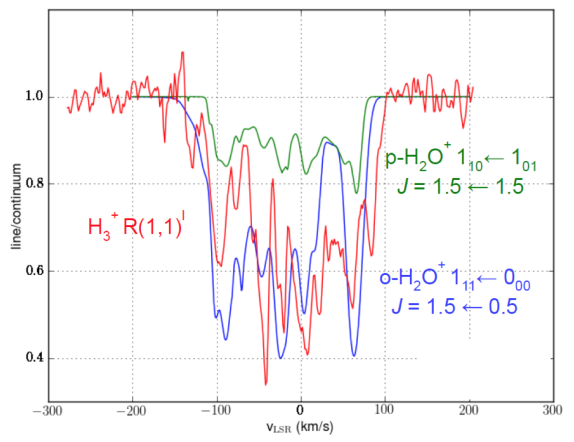
The absorption profile of the (1,1)l vibration-rotation line of H toward Star is compared to the ortho-H2O+ 111 000 = 1.50.5 and para-H2O+ 110 001 = 1.50.5 rotational transitions toward Sgr B2(M) (Schilke et al., 2010) in Figure 5. Since the permanent dipole moment of H2O+ (2.37 D, Wu et al., 2004) is 15 times greater than the transition dipole moment of H (0.158 D, Carney & Porter, 1976), for equal abundances the H2O+ lines would be 200 times stronger than the H line. The observed H absorption depth toward Star is about one-tenth of the depth of the ortho-H2O+ absorption toward Sgr B2(M), indicating that the column density of ortho-H2O+ is about one-twentieth of the column density of H.
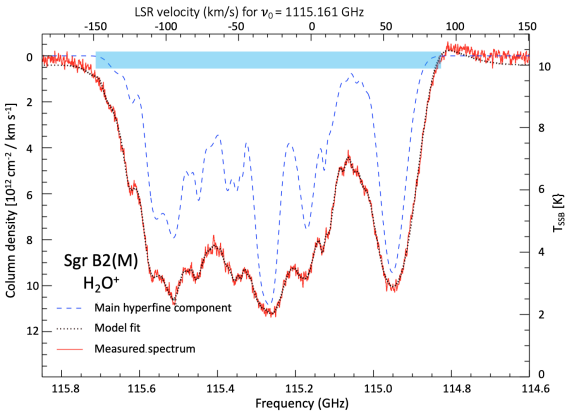
It is apparent from Figure 5 that the velocity profiles of H toward Star and those of ortho- and para-H2O+ toward Sgr B2(M) are similar in their velocity ranges and in some of their detailed structures. However, both the ortho- and para-H2O+ lines contain hyperfine structure, which is responsible for the differences in their profiles. We use the velocity profile of the strongest ortho hyperfine component derived by Ossenkopf et al. (2010, Figure 4), which is reproduced in Figure 6, for deducing more precisely the velocity extent of the diffuse gas in which the H2O+ is located.
The velocity resolution of HIFI is 1 km s-1 and the signal-to-noise ratios of the H2O+ and OH+ spectra are very high. Therefore, unlike the profiles of the H lines, whose full extents are uncertain by 10 km s-1, the actual extents of the far-infrared absorption lines are essentially the observed extents. From the main hyperfine component in Figure 6 we observe a full velocity range of to km s-1. From Equation (1) the positive velocity limit places Sgr B2(M) behind Sgr A∗ by 90 pc. Thus, to within the uncertainties Star and Sgr B2(M), although separated on the sky by 17 pc, are located the same distance behind Sgr A∗.
3.1.2 Velocity Profiles of OH+ and CH+ and the Locations of Sgr B2(M) and Sgr B2(N)
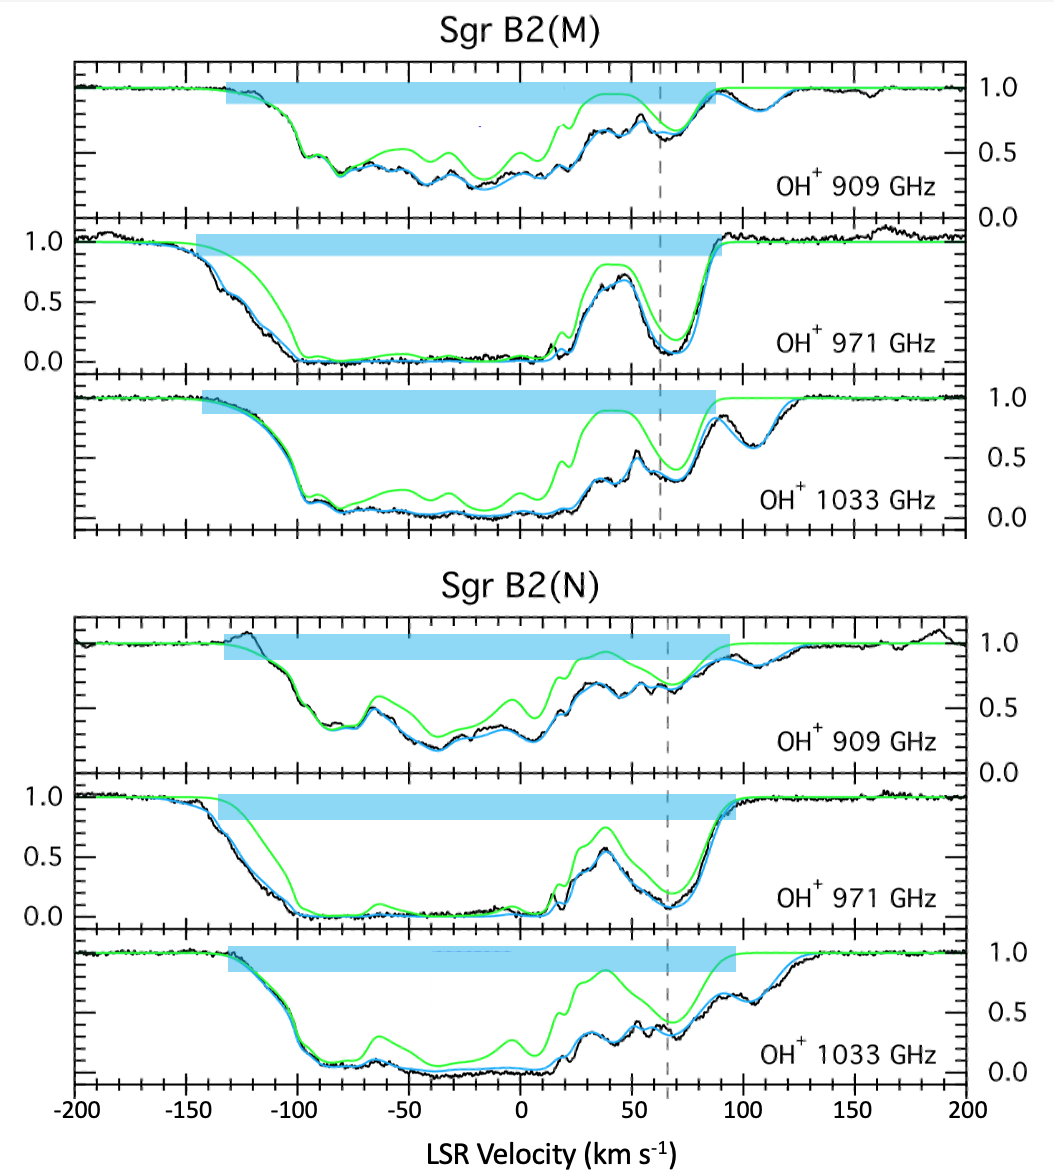
The velocity profiles of three OH+ lines observed by Indriolo et al. (2015) toward Sgr B2(M) and Sgr B2(N) are shown in Figure 7. Eyeball estimates of the velocity range for each fine structure component are given in Table 1. The positive velocity edges of the absorptions for Sgr B2(M) for these lines as well as the H2O+ line presented in the previous section agree with one another to a few kilometers per second (see Table 1); their average value is 89 km s-1, which differs from the value for H2O+ by only 1 km s-1. The positive velocity edges for Sgr B2(N) average to 97 km s-1, slightly higher than Sgr B2(M). This indicates that Sgr B2(N) lies slightly behind Sgr B2(M) and is further to the rear of the CMZ than either Sgr B2(M) or Star .
Unlike the triplet cation OH+, which has 3 symmetry, 12CH+ is of symmetry 1 and its spectrum does not have hyperfine structure (Amano, 2010a). That is not the case for 13CH+; its splitting, 1.63 MHz, is anomalously large, as explained by Amano (2010b). In terms of velocity, however, that splitting corresponds to 0.59 km s-1 and thus is unimportant here.
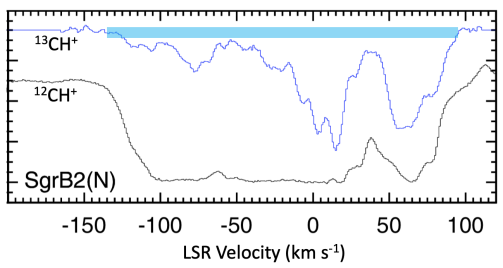
The observed velocity profiles of the = 10 transition of 12CH+ and 13CH+ toward Sgr B2(N) reported by Godard et al. (2012) are shown in Figure 8. We estimate the positive edge of the profile to be 96 km s-1, consistent with the values found from OH+ for this source.
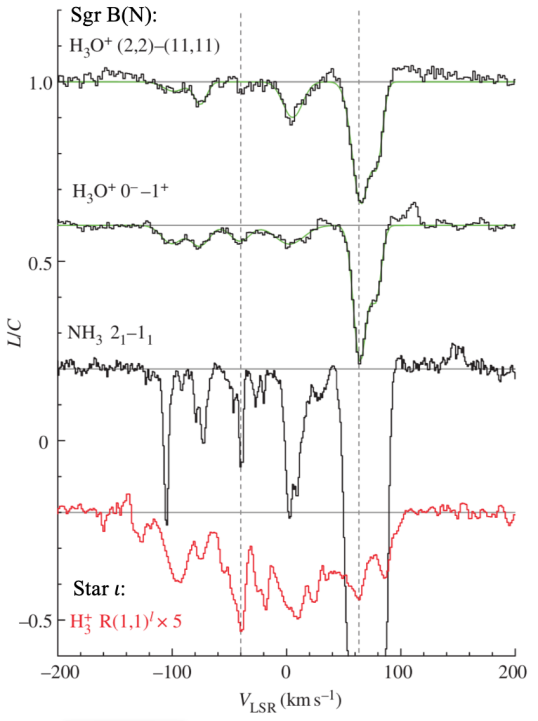
3.2 Comparisons of NH3 and H3O+ Absorption Line Profiles toward Sgr B2 with H Absorption Toward Star .
Although in this paper the dense clouds in Sgr B2 are not used to estimate the location of Sgr B2, it is of interest from a chemical perspective to compare the spectrum of H toward Star to spectra of NH3 and H3O+ obtained by Lis et al. (2012). Unlike OH+ and H2O+ the fully protonated H3O+ does not react with H2 and therefore is stable in dense clouds. Also unlike paramagnetic OH+ and H2O+, H3O+, like the isoelectronic molecule NH3, has no fine structure and only minute hyperfine structure.
In many ways H3O+ is similar to NH3 both chemically and spectroscopically, but there are two notable differences. (1) The abundance of H3O+ is less than that of NH3 because it is destroyed by dissociative electron recombination (although the effect of this on its abundance is much less in dense clouds than diffuse clouds) and because the proton affinity of H2O (7.22 eV) is less than those of some molecules that are abundant in dense clouds such as NH3 (8.85 eV) and HCN (7.43 eV). See, e.g., Table 1 of Oka (2013). Thus, NH3 destroys H3O+ through the proton hop reaction H3O+ + NH3 H2O + NH, which has a high exothermicity,1.42 eV, and a large Langevin rate constant, 2.4 10-9 cm3 s-1 (Anicich & Huntress, 1986). (2) The central charge of H3O+ attracts its three hydrogen atoms, resulting in the OH bonds being stronger than the NH bonds, making the bonds more like than , and causing the H3O pyramid to be shallower than the NH3 pyramid. This makes the frequency of the H3O+ inversion, 55.346 cm-1 (Liu & Oka, 1985) nearly 70 times higher than that of NH3, 0.793 cm-1.
Figure 9 shows velocity profiles of lines of both species toward Sgr B2(N) as well as H toward Star . It can be seen that the absorption components in the H3O+ and NH3 lines are at the same velocities, indicating that those species reside in the same dense clouds although absorption in the latter species is more than 10 times stronger than in the former. Their profiles bear only vague resemblances to the profile of the H line. This is not surprising in that (1) the H absorption line contains contributions both from dense gas and diffuse gas and (2) its sightline is displaced by 17 pc. They also are vastly different from the CO absorption profile toward Star shown in Figure 2. This indicates that although the H3O+ and NH3 seen toward Sgr B2 and the CO seen toward Star reside in dense clouds the clouds on their sightlines must have considerably different physical properties. Indeed it is well known that Sgr B2(M) and Sgr B2(N) contain dense cores (e.g., see Sánchez-Monge et al., 2017), whereas none are located on the sightline to Star (Geballe et al., 2021).
4 Discussion
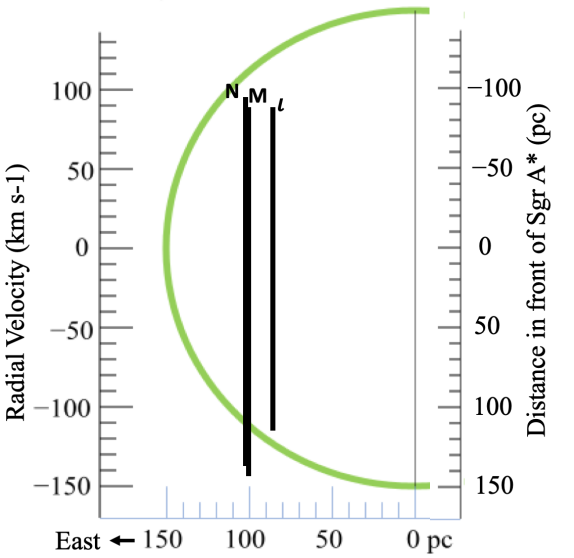
4.1 The Locations of Star and Sgr B2 in the CMZ
Figure 10 summarizes the main result of this work, which is based on the simple model in Section 2 for the velocity field of the warm diffuse gas in the CMZ, previously shown to be undergoing radial expansion from an origin at or near Sgr A∗ (Paper II). Star and Sgr B2 are both approximately 90 pc more distant than Sgr A∗. Such large distances behind Sgr A∗ puts them near the rear of the CMZ. Based on the model and to within the measurement uncertainties Sgr B2(N) lies slightly behind Sgr B2(M). The above conclusions are based on the positive velocity extremum of the observed absorption by the H (1,1)l line toward Star and the average of the positive velocity extrema of the observed absorption lines of three molecular ions, H2O+, OH+, and 13CH+ toward the Sgr B2 far-infrared continuum sources.
4.2 Uncertainties
The uncertainty in our estimate of the positive velocity extremum of the H line toward Star is approximately 10 km s-1. For the far-infrared lines observed which were observed toward Sgr B2 at much higher spectral resolution and much higher signal-to-noise ratios, the uncertainties in the estimated extrema are only a few kilometers per second. It is noteworthy that for all of the far-infrared lines toward each of the Sgr B2(M) and Sgr B2(N), the estimated positive velocity extrema of each of the lines agree to within the above uncertainty.
An additional source of uncertainty exists in the lines with significant hyperfine structure, which requires isolating a single hyperfine component to obtain accurate velocity extrema. One might expect that extrema of the 13CH+ profile, where the hyperfine structure is negligible (see Section 3.1.3.) and from OH+, which has simpler hyperfine structure than H2O+, should be more reliable than the value derived from H2O+. Note, however, that H2O+ was only observed toward Sgr B2(M) and the velocity maximum derived from it is fully consistent with those derived from the lines of OH+.
One might question if the use of extreme positive edges of the far-infrared velocity profiles is the most appropriate way to estimate the locations of background source. In the modeled spectra of the hyperfine components of H2O+ and OH+ only a miniscule fraction of the gas in the column has that velocity. It is conceivable that the motion of that gas is the result in small part of other processes besides the global radial expansion, such as interactions of the expanding gas with winds from some of the massive stars in Sgr B2. In addition, although on coarse scales the mass distribution in the inner few hundred parsecs of the Galaxy is isotropic (Sofue, 2013), Sgr B2 and Sgr B1 are probably local peaks in mass density and as such could affect the velocity field of the expansion in their vicinities. Our crude estimate of this effect is less than 10 km s-1.
Finally, the derived distances to these three objects are dependent on the expansion model for the diffuse gas. We have chosen the simplest of these models, radial velocity linearly proportional to distance from Sgr A∗, which assumes a single expulsion event centered on Sgr A∗, and a constant deceleration of the expanding gas distant from Sgr A∗, by more than 30 pc (see Paper II, Section 6 and its Appendix). Actual diffuse gas motions within the CMZ differing from this model by a few tens of km s-1 would not be inconsistent with the observed data in Paper II, but would not change our conclusion.
The effects of most of the above could shift the positive velocity absorption edge in either direction and it is difficult to quantify the possible magnitudes of some of them. However, we believe based on the observed organized radial expansion of the diffuse gas in the CMZ with maximum observed speeds at the edge of the CMZ and the high positive velocity extrema of the absorption lines in that gas toward Star , Sgr B(M), and Sgr B2(N), that the conclusion that these three objects lie far behind Sgr A∗, is inescapable.
The much larger differences in the negative absorption extrema toward these three sources have no bearing on the results of this paper and also are not surprising. The edge of the CMZ where the expanding gas encounters the Galactic interstellar medium, may not be circular or have a sharp boundary and the ejection velocities may be somewhat different in different directions. In addition there is nothing to sharply truncate the absorption on that edge, as there is at positive velocities in the form of the continuum sources Star , Sgr B2(M) and Sgr B2(N), which are embedded in the CMZ.
4.3 Chemistry of Diffuse CMZ Gas toward Sgr B
The continuous velocity profiles of the (1,1)l and (3,3)l absorptions of H in Figure 3, from high negative to high positive values, indicate that H in diffuse clouds exist largely uniformly within the CMZ on the sightline toward Star . As pointed out in Paper II and in Geballe et al. (2021) the deep and narrow absorption in the the (1,1)l spectrum at km s-1 arises in dense clouds in the 3 kpc spiral arm (Rougoor & Oort, 1960). Additional less prominent narrow absorption by H due to dense gas in the 4.5 kpc spiral arm (Menon & Ciotti, 1970) and the local spiral arm near 25 and 0 km s-1, respectively, are also apparent in the (1,1)l spectrum. These absorption components are also observed in many of the stars more centrally located in the CMZ (see, e.g., Figure 1 of Oka et al., 2005, and Paper II). The small shifts in radial velocities of these components toward stars within the CMZ are due to well-known velocity gradients along the foreground arms.
The above three components are absent in the velocity profiles of the (3,3)l line because the (3,3) level is not populated in low temperature gas. Apart from the spiral arm absorption features the shapes of the (1,1)l and (3,3)l absorptions profiles are similar, as is the case along the more central CMZ sightlines such as the one toward the brightest GCS 3-2 star in the Quintuplet Cluster (see Figure 1 of Oka et al., 2005). The continuous absorption by H over wide velocity ranges on many sightlines implies that the warm diffuse gas containing H and therefore also containing H2 are nearly ubiquitous in the CMZ (Paper I).
The velocity profiles of the H2O+, OH+, and 13CH+ absorption lines (Figures 6, 7, and 8, respectively), which also arise in the diffuse gas, indicate, however, that these molecular ions are not distributed as uniformly throughout the CMZ as H. Especially remarkable is the near complete absence of all three molecules near = km s-1. Whether this is due to chemistry, a true absence of diffuse gas at that velocity, or something else remains to be seen. We note that the velocity profiles of H (Figure 3) indicate a possible paucity of diffuse gas at this velocity, on a sightline 17 pc distant from sightlines to the Sgr B2 sources. Perhaps this paucity extends across Sgr B2.
5 Conclusion
Assuming a linear relation between radial velocity and radial location of the diffuse gas in the CMZ, which is based on the data and conclusion in Paper II of this series, we have used the maximum absorption velocities in spectra of H toward Star (2MASS J17470898-2829561) and in spectra of H2O+, OH+, and 13CH+ toward Sgr B2(M) and Sgr B2(N) to measure the depths of these sources in the CMZ relative to Sgr A∗. We find that each them lies 90 pc behind Sgr A∗, near the rear of the CMZ. For the Sgr B2 sources, this conclusion contradicts many previous analyses (Reid et al., 2009; Kruijssen, Dale, & Longmore, 2015; Ridley et al., 2017) in which Sgr B2 had been placed shallower than Sgr A∗ in the CMZ. Our conclusion agrees qualitatively with Figure 5 of Molinari et al. (2011). Note, however, that our face-on view of the CMZ is circular rather than an ellipse, with Sgr A∗ at the center of the circle. Our conclusion would be in good agreement with that of Sofue (1995, Figure10) if Arm I is the far spiral arm and Arm II is the near spiral arm, as proposed by Ridley et al. (2017) and contrary to Sofue’s assignment.
References
- Amano (2010a) Amano, T. 2010a, ApJL, 716, L1
- Amano (2010b) Amano, T. 2010b, JChPh, 133, 244305
- Anicich & Huntress (1986) Anicich, V. G. & Huntress, Jr., W. T. 1986, ApJS, 62, 553
- Armilotta, Krumholz, & Di Teodoro (2020) Armillotta, L., Krumholz, M. R., & Di Teodoro, E. M. 2020, MNRAS, 493, 5273
- Bally et al. (1987) Bally, J., Stark, A. A., Wilson, R. W., & Henkel, C. 1987, ApJS, 65, 13
- Bally et al. (1988) Bally, J., Stark, A. A., Wilson, R. W., & Henkel, C. 1987, ApJ, 324, 223
- Bally et al. (2010) Bally, J., Aguirre, J., Battersby, C., et al. 2010, ApJ, 721, 137
- Carney & Porter (1976) Carney, G. D. & Porter, R. N. 1976, J. Chem. Phys. 65, 3547
- Cheung et al. (1969) Cheung, A. C., Rank, D. M., Townes, C. H., Thornton, D. D, & Welch, W. J. 1969, Nature, 221, 626
- de Graauw et al. (2010) de Graauw, T., Helmich, F. P., Phillips, T. G., et al. 2010, A&A, 518, L6
- Geballe & Oka (2010) Geballe, T. R. & Oka, T. 2010, ApJ, 709, L70
- Geballe et al. (2019) Geballe, T. R., Lambrides, E., Schlegelmilch, B., Yeh, S. C. C., Goto, M., Westrick, C., Oka, T., & Najarro, F. 2019, ApJ, 872, 103
- Geballe et al. (2021) Geballe, T. R., Pendleton, Y., Chiar, J., & Tielens, A. G. G. M. 2021, ApJ, 912, 47
- Godard et al. (2012) Godard, B., Falgarone, E., Gerin, M., et al. 2012, A&A, 540, A87
- Hinkle et al. (1998) Hinkle, K. H., Cuberly, R. W., Gaughan, N. A., et al. 1998, Proc. SPIE, 3354, 810
- Indriolo et al. (2015) Indriolo, N., Neufeld, D. A., Gerin, M., et al. 2015, ApJ, 800, 40
- Kaifu, Kato, & Iguchi (1972) Kaifu, N., Kato, T., & Iguchi, T. 1972, Nature, 238, 105
- Kruijssen, Dale, & Longmore (2015) Kruijssen, J. M. D., Dale, J. E., & Longmore, S. N. 2015, MNRAS, 447, 1059
- Lis et al. (2012) Lis, D. C., Schilke, P., Bergin, E. A., Emprechtinger, M., & HEXOS Team. 2012, RSPTA, 370, 5162
- Liu & Oka (1985) Liu, D.-J. & Oka, T. 1985, PhRvL 54,1787
- Menon & Ciotti (1970) Menon, T. K. & Ciotti, J. E. 1970, Nature, 227, 579
- Miller et al. (2020) Miller, S., Tennyson, J., Geballe, T. R., & Stallard, T. 2020, RnMP, 92.1
- Molinari et al. (2011) Molinari, S., Bally, J., Noriega-Crespo, A., et al. 2011, ApJL, 735, L33
- Morris & Serabyn (1996) Morris, M. & Serabyn, E. 1996, ARA&A, 34, 645
- Neale, Miller, & Tennyson (1996) Neale, L., Miller, S., & Tennyson, J. 1996, ApJ, 464, 516
- Oka et al. (1971) Oka, T., Shimizu, F. O., Shimizu, T., & Watson, J. K. G. 1971, ApJ, 156, L15
- Oka et al. (2005) Oka, T., Geballe, T. R., Goto, M., Usuda, T., & McCall, B. J. 2005, ApJ, 632, 882
- Oka (2013) Oka, T. 2013, ChRv, 113, 8738 B. 8738
- Oka et al. (2019) Oka, T., Geballe, T. R., Goto, M., Usuda, T., McCall, B. J., & Indriolo, N. 2019, ApJ, 883, 54 (Paper I)
- Oka & Geballe (2020) Oka, T. & Geballe, T. R. 2020, ApJ, 902, 9 (Paper II)
- Ossenkopf et al. (2010) Ossenkopf, V., Müller, H. S. P., Lis, D. C., et al. 2010, A&A, 518, L111
- Pan & Oka (1986) Pan, F.-S. & Oka, T. 1986, ApJ, 305, 518
- Reid et al. (2009) Reid, M. J., Menten, K. M., Zheng, X. W., Brunthaler, A., & Xu, Y. 2009, ApJ, 705, 1548
- Ridley et al. (2017) Ridley, M. G. L., Sormani, M. C., Tre, R. G., Magorrian, J., & Klessen, R. S. 2017, MNRAS, 469, 2251
- Rohlfs & Braunsfurth (1982) Rohlfs, K., & Braunsfurth, E. 1982, A&A, 113, 237
- Rougoor & Oort (1960) Rougoor, G. W. & Oort, J. H. 1960, PNAS, 46, 1
- Ryu et al. (2009) Ryu, S. G., Koyama, K., Nobukawa, M., Fukuoka, R. & Tsuru, T. G. 2009, PASJ, 61, 751
- Sánchez-Monge et al. (2017) Sánchez-Monge, A., Schilke, P., Schmiedeke, A., et al. 2017, A&A, 604, A6
- Sawada et al. (2004) Sawada, T., Hasegawa, T., Handa, T., & Cohen, R. J. 2004, MNRAS, 349, 1167
- Schilke et al. (2010) Schilke, P., Comito, C., Müller, H. S. P., et al. 2010, ApJ, 521, L11
- Scoville (1972) Scoville, N. Z., 1972, ApJ, 175, L127
- Sofue (1995) Sofue, Y. 1995, PASJ, 47, 527
- Sofue (2013) Sofue, Y. 2013, PASJ, 65, 118
- Sofue (2017) Sofue, Y., 2017, MNRAS, 470, 1982
- Watson (1971) Watson, J. K. G. 1971, JMS, 40, 536
- Woon (2021) Woon, D. E. 2021, http://www.astrochymist.org/astrochymist_ism.html
- Wu et al. (2004) Wu, S., Chen, Y., Yang, X., et al. 2004, JMoS, 225, 96