Conditions for direct black hole seed collapse near a radio-loud quasar 1 Gyr after the Big Bang
Abstract
Observations of luminous quasars and their supermassive black holes at suggest that they formed at dense matter peaks in the early universe. However, few studies have found definitive evidence that the quasars lie at cosmic density peaks, in clear contrast with theory predictions. Here we present new evidence that the radio-loud quasar SDSS J0836+0054 at could be part of a surprisingly rich structure of galaxies. This conclusion is reached by combining a number of findings previously reported in the literature. Bosman et al. (2020) obtained the redshifts of three companion galaxies, confirming an overdensity of -dropouts found by Zheng et al. (2006). By comparing this structure with those found near other quasars and large overdense regions in the field at , we show that the SDSS J0836+0054 field is among the densest structures known at these redshifts. One of the spectroscopic companions is a very massive star-forming galaxy () based on its unambiguous detection in a Spitzer 3.6 m image. This suggests that the quasar field hosts not one, but at least two rare, massive dark matter halos (), corresponding to a galaxy overdensity of at least 20. We discuss the properties of the young radio source. We conclude that the environment of SDSS J0836+0054 resembles, at least qualitatively, the type of conditions that may have spurred the direct collapse of a massive black hole seed according to recent theory.
1 Introduction
Since their discovery, the study of luminous quasars within the first billion years of cosmic time has intersected with numerous areas in astrophysics from black holes to cosmology (Fan et al., 2000). Although they are the most luminous hydrogen-ionizing photon producing sources at their epoch, their relatively low number density impies that they probably did not play a major role in driving the overall reionization of the universe (Bouwens et al., 2015). Ironically, however, their rest-frame UV spectra offer some of the most direct ways we currently have of assessing the rapidly evolving neutral fraction of the intergalactic medium (IGM) (e.g., Mortlock et al., 2011; Becker et al., 2015; Eilers et al., 2017; Davies et al., 2018; Wang et al., 2020; Yang et al., 2020; Bosman et al., 2020). Estimates of the masses of their supermassive black holes (SMBHs) using established techniques indicate that at least some of these objects were able to accumulate masses similar to the SMBH at the center of the local giant elliptical M87 within less than 1 Gyr of the Big Bang, defying the most simple maximum accretion scenarios especially for the highest redshifts (e.g., Bañados et al., 2018b).
One of the main uncertainties at the current moment relates to the population of “seed” black holes from which they originated (e.g., Bromm & Yoshida, 2011; Greene, 2012; Volonteri, 2012; Mezcua, 2017; Inayoshi et al., 2020). Although in principle a SMBH could form from a 100 seed accreting at the Eddington rate for under 1 Gyr, it is not clear whether such high accretion rates could be sustained for such a long time (or shorter periods of super-Eddington accretion), especially in the presence of feedback in the forming galaxy (Inayoshi et al., 2016; Smith et al., 2018; Regan et al., 2019). One possible solution includes mergers between light black hole seeds in clusters of stellar remnants (Kroupa et al., 2020) or at the centers of merging (mini)halos, but long black hole merger time scales and the effect of merger recoil kicks could pose a problem for such a scenario (see Piana et al., 2021). An attractive, alternative scenario starts with the formation of a much more massive seed of , a so-called direct collapse black hole (DCBH) seed (e.g. Umemura et al., 1993; Eisenstein & Loeb, 1995; Koushiappas et al., 2004; Volonteri & Rees, 2005; Lodato & Natarajan, 2006). In order to accomplish this, models and simulations typically require some kind of mechanism that prevents cooling and fragmentation and stimulates the formation of the DCBH seed, through an enhanced local Lyman-Werner photon flux or through the dynamical heating of merging (mini)halos. These mechanisms, which could operate alone or in tandem, may prevent halos from forming stars at least until reaching the atomic cooling stage, at which point a runaway collapse to a massive seed occurs, either directly or by forming first a shortlived, supermassive star (e.g., Agarwal et al., 2016; Habouzit et al., 2016; Latif et al., 2018; Wise et al., 2019; Lupi et al., 2021; Piana et al., 2021).
Based on their low co-moving space density, high accretion power and large black hole masses, it is frequently argued that the first luminous quasars must have formed in very dense regions of the cosmic web (e.g., Fan et al., 2000; Springel et al., 2005; Li et al., 2007; Sijacki et al., 2009). It has thus been expected that these luminous quasars will be situated in or near large overdensities of dark matter, gas and galaxies that, in principle, we should be able to detect. Precisely this expectation has been tested for the last two decades in many different and complementary ways, but it has been challenging to interpret that work in a straightforward and clear-cut way (see, e.g., Overzier et al., 2009a; Overzier, 2016; Mazzucchelli et al., 2017; Decarli et al., 2017; Mignoli et al., 2020, and references therein for a variety of observational findings related to the environments of quasars).
These results are even more puzzling in the light of several significant large-scale overdensities that have been detected at similar redshifts with relative ease in fields not known to host luminous quasars (e.g., Ouchi et al., 2005; Toshikawa et al., 2012; Ota et al., 2018; Calvi et al., 2019). Although obscuration, variability or duty cycle can easily explain the real or apparent absence of luminous quasars in any of these structures, there are no obvious mechanisms that could temporarily hide any large-scale structure around the known quasars, if present. This is a rather strong, albeit indirect, argument against the explanation that the structures associated with the quasars are simply being missed because we lack observational sensitivity at these redshifts.
Another common explanation given for the apparent absence of galaxies clustered near quasars is that strong radiative feedback has raised the temperature floor of the surrounding IGM, thereby preventing the condensation of gas into galaxies (e.g., Utsumi et al., 2010; Bañados et al., 2013; Mazzucchelli et al., 2017). In this case, the quasars would still be surrounded by large matter overdensities as expected from theory, but those would be devoid of galaxies within the quasar ionization cone. In this scenario, however, it seems challenging to suppress any structure on scales out to many Mpc, uniformly around the quasar, and throughout its active and inactive phases as the observations appear to require. Besides, galaxies have been found within the ionization cones of some quasars (e.g., Mignoli et al., 2020; Bosman et al., 2020).
The apparent lack of clearly identifiable overdense environments around most quasars at studied to date is even more puzzling given current theories for massive seed formation. As explained above, these theories require large matter overdensities that could (1) provide a large Lyman-Werner photon background, and (2) enhanced merger rates of small dark matter halos that stimulate the collapse of a massive gas cloud into a DCBH seed (e.g., Wise et al., 2019; Regan et al., 2020; Lupi et al., 2021). Once the massive seed of has formed, the high merger and accretion rates in the overdense environment would be sufficient to achieve the 4-6 orders of magnitude growth necessary to form the SMBH in just a few hundred million years. Without invoking the DCBH scenario, it is a real challenge to explain the very large SMBH masses in at least some of the quasars at .
Quasar SDSS J0836+0054 at (denoted J0836 throughout this paper) is among a handful of objects for which a large potential overdensity of galaxies was found in early observations using the HST (Zheng et al., 2006, Z06). However suggestive this result, direct spectroscopic evidence for an overdensity associated with J0836 was still lacking. Recently, however, three galaxies having redshifts near that of the quasar were found as part of the study of Bosman et al. (2020, B20), confirming close association with the quasar for two objects from the Z06 sample, plus one new source. As we show in this paper, one of the companion galaxies is very bright at 3.6 m, indicative of a very high stellar mass. Based on these new results, we conclude that the reality of a structure of galaxies associated with J0836 has now been established. We compare the structure around J0836 with model expectations and recent literature results, including another recently confirmed large structure associated with quasar SDSS J1030+0524 at (Mignoli et al., 2020) as well as several field overdensities at . From these comparisons, we conclude that J0836 lies in a rather exceptional environment that at least qualitatively resembles the type of overdense environments required by the DCBH scenario.
We set the cosmological parameters to km s-1 Mpc-1, , , which gives a spatial scale of 5.95 physical kpc arcsec-1 and an age of 0.98 Gyr at (Bennett et al., 2014). We will use the prefix ‘p’ to indicate physical scales (e.g., pkpc) and the prefix ‘c’ to indicate co-moving scales (e.g., cMpc). We use AB magnitudes.
2 Data and samples
2.1 SDSS J083643.85+005453.3 (J0836)
The quasar J0836 was discovered as part of the Sloan Digital Sky Survey (SDSS) quasar survey (Fan et al., 2001), and is one of the brightest quasars at in the optical (Bañados et al., 2016), radio (Bañados et al., 2021) and X-rays (Wolf et al., 2021). Various redshift determinations in the range exist (Fan et al., 2001; Stern et al., 2003; Freudling et al., 2003; Kurk et al., 2007; Jiang et al., 2007; Shen et al., 2019), but we follow B20 who determined based on the O ii 1305 Å and C ii 1335 Å emission lines. J0836 is also one of the most distant known radio-loud quasars: it has a flux density of 1.1 mJy at 1.4 GHz, a 5 GHz (rest-frame) luminosity of W Hz-1 sr-1, a radio spectral index of -0.9 between 1.5 and 5 GHz, and is marginally resolved at VLBI resolutions of mas (40 pc) (Petric et al., 2003; Frey et al., 2003, 2005). Wolf et al. (2021) presented new observations at low radio frequency, showing that the radio spectral index flattens significantly below 1.4 GHz, consistent with a peaked radio spectrum. The compact radio size, steep spectral index and the evidence for a peaked spectrum may suggest that this is a young radio source in which the jets are still confined to (sub-)kpc scales. J0836 has an estimated black hole mass of (see Sect. 3.2 below).
| ID | EW | log( | |||||
| (J2000) | (J2000) | (Å) | |||||
| J0836 | 08:36:43.871 | +00:54:53.15 | – | 0.0 | – | – | |
| B-B20 | 08:36:46.280 | +00:54:10.55 | – | –0.011 | |||
| A-Z06/A-B20 | 08:36:45.248 | +00:54:10.99 | +0.052 | ||||
| B-Z06/C-B20 | 08:36:47.053 | +00:53:55.90 | –0.078 | ||||
| B′-A06 | 08:36:47.127 | +00:53:56.20 | – | – | – | – | |
| C-Z06 | 08:36:50.099 | +00:55:31.16 | – | – | – | – | |
| C2-Z06 | 08:36:50.058 | +00:55:30.54 | – | – | – | – | |
| C3-Z06 | 08:36:50.010 | +00:55:30.27 | – | – | – | – | |
| D-Z06 | 08:36:48.211 | +00:54:41.19 | – | – | – | – | |
| E-Z06 | 08:36:44.029 | +00:54:32.79 | – | – | – | – | |
| F-Z06 | 08:36:42.666 | +00:54:44.00 | – | – | – | – | |
| G-Z06† | 08:36:44.809 | +00:55:04.41 | – | – | – | – | |
| a Objects A-Z06 to G-Z06 from Zheng et al. (2006) and object B′-A06 from Ajiki et al. (2006). | |||||||
| b From Bosman et al. (2020). | |||||||
| † During this work a mistake was found in the coordinates for object G used in Table 1 and Figure 1 of Z06. | |||||||
| Here we give the correct coordinates. | |||||||
| †† Redshift difference of spectroscopic galaxies and J0836, . | |||||||
2.2 HST/ACS and Spitzer/IRAC images
We use images obtained with the HST/ACS in the filters F775W (; 4676 s) and F850LP (; 10,778 s). These data are described in detail in Z06. For the analysis in this paper, we retrieved the pipeline reduced mosaics from the Hubble Legacy Archive111https://hla.stsci.edu/, and performed new measurements using Source Extractor version 2.25.0 (Bertin & Arnouts, 1996). We applied a Galactic extinction correction of 0.1 and 0.07 mag to the and magnitudes, respectively. We also use Spitzer/IRAC 3.6 m observations with a total exposure time of 17 ks taken from Overzier et al. (2009b).
2.3 Galaxy samples and redshifts
The samples discussed in this paper are the following. We use the sample of photometrically selected -dropouts detected with HST/ACS from Z06. The dropout galaxies have 26.5 mag and colors 1.3–2.0, consistent with . There are seven objects in this sample (labeled A–G). Below, when referring to the Z06 objects we will use these IDs together with the suffix “Z06”. One of the dropouts (C-Z06) has two close companions in projection (labeled C2 and C3) that are fainter than the imposed limit in .
Ajiki et al. (2006) carried out broad and narrowband observations using the Subaru Suprime-Cam with filters ,,,,, and the narrowband filter sensitive to Ly at . They found one strong Ly emitting candidate at about 1″ or 6 kpc from object B-Z06. We will refer to this object as B′-A06. The remainder of the Z06 objects were not detected in ,,, which is consistent with them being genuine -dropouts and not foreground interlopers.
Finally, and key to the results presented in this paper, we use three spectroscopically confirmed Ly emitting objects from B20. Their selection was also based on the Subaru data from Ajiki et al. (2006). They used color selection criteria optimized to the redshift range , and supplemented spectroscopic targets with a photometric redshift selection. Of 19 candidates found in the region overlapping with the HST data, 3 corresponded to objects from Z06: A-Z06, B-Z06 and F-Z06. 11 of these were targeted with the Keck/DEIMOS, including A-Z06 and B-Z06. When referring to objects from the spectroscopic sample, we will use the suffix “B20”. Redshifts were obtained for three objects: “Aerith A” at (A-B20 which is identical to A-Z06), “Aerith B” at (B-B20 has no counterpart in Z06 because of its relatively small – color) and “Aerith C” at (C-B20 which is identical to B-Z06).
Object A-Z06/A-B20 is also detected in the NB816 narrowband, which is interpreted as continuum emission blueward of Ly (Bosman et al., 2020). Object B-B20 is not detected in the NB816. The redshift of B-Z06/C-B20 places the wavelength of its Ly emission in the NB816. A relatively bright object (B′-A06) has indeed been detected, as first reported by Ajiki et al. (2006). However, as explained in B20, the redshift of B-Z06/C-B20 was obtained at the location of its -band continuum, which is offset from the NB816 source B′-A06 by about 1″. It is thus possible that there are two galaxies at this location separated by about 6.3 kpc if at the same redshift. B20 report no other objects with redshifts close to that of J0836, while Meyer et al. (2020) report on a fourth source at that is not relevant to this paper.
Details on the samples are summarized in Table 1.
3 Analysis and results
3.1 Basic structure
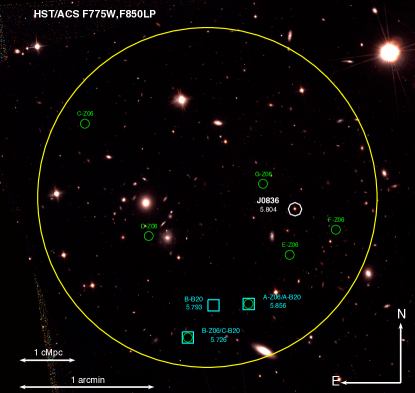
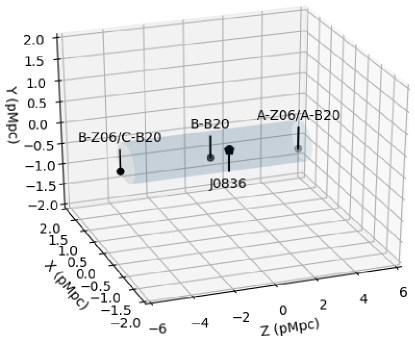
In Fig. 1 we show a false color image of the archival HST/ACS and bands of the J0836 field. The quasar itself is marked by a white polygon. The -dropouts from Z06 are marked by green circles, and the spectroscopically confirmed objects from B20 by cyan squares. The work of B20 is significant because it has confirmed, for the first time, that 2 out of the 7 objects from Z06 have redshifts close to that of the quasar (much closer than one would expect for a randomly distributed sample of -dropouts, see below). Moreover, they also found an additional object (B-B20), that lies closer to the quasar redshift than the other two. The proper distances along and perpendicular to the line of sight (l.o.s.) to the quasar (, ) are (3.64,0.28) pMpc for A-Z06/A-B20, (–0.67,0.33) pMpc for B-B20 and (–5.03,0.44) pMpc for B-Z06/C-B20, where a minus sign indicates objects in the foreground of the quasar. As further illustrated by Fig. 2, the three objects lie along a narrow cylinder (radius of 0.5 pMpc) oriented along the line of sight with a total length of about 8.7 pMpc (corresponding to the maximum redshift difference of ) and the quasar about mid-way. The length of this cylinder is on the larger side of the distribution of cosmic filament sizes found in cosmological simulations (Galárraga-Espinosa et al., 2020). However, we will refrain from calling this structure a filament because of the relatively small number of redshifts it is based on. Future data may show that the true three-dimensional structure around J0836 is very different from the simple ‘filament’ drawn in Fig. 2.
3.2 The quasar
Kurk et al. (2007) estimated a black hole mass of based on the Mg ii line. We have updated their estimate using newer measurements and calibrations. We use the black hole mass calibration from Vestergaard & Osmer (2009) together with the FWHM(Mg ii) measurement of Kurk et al. (2007) and the 3000 Å rest-frame luminosity of from Shen et al. (2019), finding , consistent with the estimate of Kurk et al. (2007), but 0.4 dex below the estimate of Shen et al. (2019) based on the problematic C iv line.
A dynamical mass estimate for the quasar host galaxy does not yet exist, but an order of magnitude estimate can be made by taking the results for a sample of quasars from Neeleman et al. (2021) (see also Venemans et al., 2016). They find that, on average, the quasar host galaxy dynamical masses are a factor of 7 lower than expected for their black hole mass and assuming the Kormendy & Ho (2013) relation for local bulges. With an estimated black hole mass of , this would imply a stellar (bulge) mass of . If we assume a typical stellar-to-dark-matter mass ratio of appropriate for the high mass end of the halo mass function at (Stefanon et al., 2021), this would imply a quasar host halo mass of . Although the uncertainty of this estimate is large, it is consistent with recent derivations based on [C ii] 158m velocity widths from Shimasaku & Izumi (2019) and proximity zone measurements from Chen et al. (2021).
| ID | Filter | |||
| (arcsec) | (arcsec) | (mag) | ||
| A-Z06/A-B20 | 0.20 | 0.37 | ||
| 0.16 | 0.38 | |||
| 3.6 m | – | – | ||
| B-B20 | 0.16 | 0.26 | ||
| 0.12 | 0.29 | |||
| B-Z06/C-B20 | 0.13 | 0.39 | ||
| 0.18 | 0.38 | |||
| B′-A06 | 0.10 | 0.35 | ||
| 0.10 | 0.16 |
† The sizes quoted are the radii containing 50 and 90% of the total flux as returned by Source Extractor. They were not corrected for the HST seeing of about (FWHM).
3.3 Massive companion galaxy A
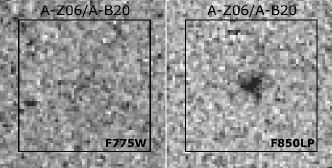
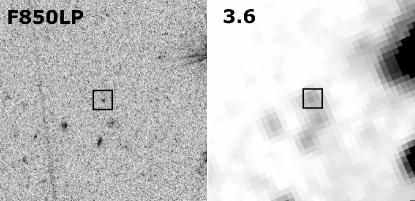
Overzier et al. (2009b) presented Spitzer/IRAC observations of the J0836 structure, and showed that object A-Z06/A-B20 is very bright at 3.6 m with mag. Assuming that its redshift was indeed , they concluded that it is among the brightest and most massive -dropout galaxies. Here we will revisit the analysis of A-Z06/A-B20. The and 3.6 m images are shown in Fig. 4.
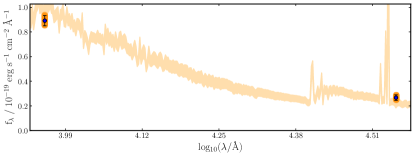
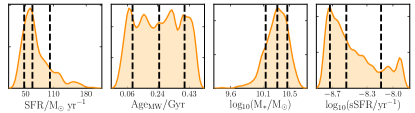
Using the redshift firmly established by B20, we can now make a much more secure determination of the properties of A-Z06/A-B20 based on the available photometry. Although the –[3.6] color is sensitive to age, dust, SFH and metallicity (and redshift), the 3.6 m flux probing rest-frames of around 5000 Å is an accurate (albeit relative) gauge of stellar mass at these redshifts (e.g., see Overzier et al., 2009b; Duncan et al., 2014; Bhatawdekar et al., 2019; Stefanon et al., 2021). We used the BagPipes code (Carnall et al., 2018) to fit the and 3.6 m photometry. The -band was excluded because it does not add any information about the intrinsic SED. The redshift was fixed to . We fit constant and exponential star formation histories with a Kroupa & Boily (2002) IMF. We set the maximum age to the age of the universe at . Because galaxies at are known to have a relatively strong contribution from emission lines (mainly [O iii] 4959,5007 Å) to their 3.6 m broadband flux, we used the option to include nebular emission with an ionization parameter . Assuming a constant star formation history and attenuation by dust according to the Calzetti et al. (2000) law, we find a stellar mass with a mass-weighted age of Gyr (), a metallicity , and mag (see Fig. 5). The stellar mass and mass-weighted age returned for an exponential star formation history model are essentially the same. Without the nebular emission, the stellar mass is about 0.1 dex higher. Restricting the metallicity to as in Stefanon et al. (2021), we find a stellar mass () with (without) the nebular emission with little change to the other parameters. Below we will use our first estimate of for the stellar mass of A-Z06/A-B20, as the other estimates are consistent within the errors. This stellar mass is two orders of magnitude higher than the minimum halo mass that was inferred by B20.
We can compare these results with recent results for the stellar mass function and stellar-to-halo mass ratios of galaxies at in the field from Stefanon et al. (2021). The stellar mass of A-Z06/A-B20 places it in the highest mass bin considered in that paper (, taking into account a division by a factor of 1.5 to convert from their Salpeter to our kroupa IMF. If we use their best-fit relation with mag measured for A-Z06/A-B20, we would naively expect , a full 1 dex below the actual mass measurement and thus indicative of the significant obscuration in this source.
The stellar mass estimate allows us to make an estimate of the mass of the typical dark matter halos that host objects like A-Z06/A-B20. Using an abundance-matching method, Stefanon et al. (2021) provide an estimate of the typical stellar-to-halo mass ratio for objects of this mass of , implying that A-Z06/A-B20 is hosted by a dark matter halo of . The J0836 field thus hosts at least one other massive dark matter halo, besides the quasar itself. Halos of this mass correspond to a virial radius of kpc, so the halos are really two individual halos given that their separation is about 3.6 pMpc. It is worth pointing out that according to theoretical predictions (Piana et al., 2021), the black hole occupation fraction of halos of this mass is around 1. It is thus possible that A-Z06/A-B20 also hosts a SMBH, but there is no evidence that it is currently active.
Although there are no structural measurements for the quasar host galaxy, for object A-Z06/A-B20 we measured a seeing-corrected half-light radius of 0.14″ in the -band. This corresponds to a physical half-light radius of 0.83 kpc, giving a stellar mass surface density of kpc-2. This should be considered an upper limit because the optical size is likely larger than that measured in the UV. These measurements place object A-Z06/A-B20 near the transition region between massive (compact) quiescent and star-forming galaxies at (Straatman et al., 2015), indicating that A-Z06/A-B20 may be near the end of its active star-forming phase.
3.4 Other companions
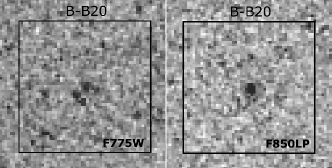
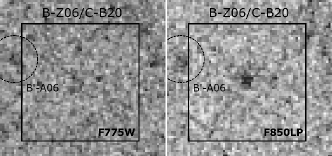
We checked the IRAC image for the other confirmed companions, but object B-B20 was not detected and object B-Z06/C-B20 (and thus also B′-A06) lies too close to a very bright foreground object to attempt a flux measurement. A direct stellar mass estimate can thus not be made. However, assuming that, unlike object A-Z06/A-B20, these objects do follow the relation of Stefanon et al. (2021) (reddening by dust can be neglected at these magnitudes, Bouwens et al. (2007)), the stellar masses would be a few times for B-B20 and B-Z06/C-B20 and a few times for B′-A06. The halo masses would be a few times and , respectively, based on the abundance matching results from Stefanon et al. (2021). The HST images of the objects are shown in Fig. 3 and basic measurements are given in Table 2.
In Sect. 4 below we will analyze the J0836 structure in terms of the probabilities of finding objects like the massive companion A-Z06/A-B20 and the more typical star-forming galaxies B-Z06/C-B20 and B-B20.
4 Overdensity analysis
Several past studies have evaluated the environment of J0836. Z06 found 7 photometrically-selected -dropouts brighter than 26.5 mag in the central 5 arcmin2 region around J0836 (see Fig. 1). These 7 objects represent a factor 6 overdensity based on a comparison with the much larger HST Great Observatories Origins Deep Survey (GOODS; Giavalisco et al., 2004) that was observed to a similar depth over an area of 316 arcmin2. Using a large -dropout sample extracted from GOODS by Bouwens et al. (2006), Z06 found that no single 5 arcmin2 region (a circle with a radius of 126) randomly drawn from GOODS contained as many as the 7 objects encountered in the J0836 field, with 4 being the highest. Furthermore, Overzier et al. (2009a) constructed a 4444 mock survey ( the area observed by GOODS) of galaxies at and showed that (surface) overdensities as found near J0836 are indeed very rare. However, in this large simulation even rarer regions were found due to extremely dense regions mostly associated with (forming) galaxy clusters. However, a definitive conclusion about the nature of the J0836 overdensity was not possible due to the lack of spectroscopic redshifts.
With the new spectroscopic data from B20, we can now quantify the nature of the overdensity associated with J0836 much more precisely. It is interesting that while only 2 of the 7 objects from Z06 were targeted spectroscopically by B20, they represent 2/3 of the spectroscopically confirmed objects near J0836. These two objects are also the brightest among the Z06 sample (-band magnitudes of 25.5 and 26 mag). The typical surface density and redshift distribution of -dropouts selected with HST is well known. According to Bouwens et al. (2007), the cumulative surface density is arcmin-2 to =26.5 mag, and based on their redshift distribution the (random) probability of finding a dropout in the redshift range () is 0.16. In this redshift range and in an area of 5 arcmin2 we would thus naively expect to find objects. With two Z06 objects spectroscopically confirmed in this region, the three-dimensional overdensity thus appears sigificant as well (). Here we did not take into account the third confirmed object from B20 because it did not pass the -dropout selection criteria used in Z06.
In the analysis below, the terms dropout and Lyman Break Galaxy (LBG) are used interchangeably to indicate continuum-selected star-forming galaxies. We will use the term Ly emitter (LAE) for the subset of star-forming galaxies with a prominent Ly emission line having a minimum rest-frame equivalent width (EW) of 20 Å. Using this criterion, at least 2 of the 3 B20 objects would classify as LAEs. We assume the redshift distribution of Bouwens et al. (2007) for -dropouts and that of Inami et al. (2017) as presented by Mignoli et al. (2020) for LAEs. According to these distributions the probabilities of finding a single LBG and LAE in the redshift range are 0.16 and 0.073, respectively. Of the 7 Z06 LBGs, two spectra were taken and both objects fell into this range, giving a probability of 0.026 based on the binomial distribution (2 out of 2 with ). Among the spectroscopic targets of B20, four objects with Ly were found, three of which fell in the redshift range near J0836. The probability of this occurrence at random is 0.0015 again using binomial statistics (3 out of 4 with ).
These small (but non-zero) probabilities are suggestive that the presence of the quasar J0836 has some effect on the clustering observed.
4.1 Clustering of two massive halos
In Section 3.3 we showed that one of the J0836 companions is an extremely massive galaxy, and the close clustering between the quasar and this object can provide additional strong constraints on the overdensity in this region. Above we showed that the massive companion A-Z06/A-B20 has a stellar mass of around and inferred halo mass . Based on the analysis of several hundreds of square arcminutes with deep HST and Spitzer/IRAC coverage, Stefanon et al. (2021) show how rare such massive objects are: the number density of -dropouts with is dex-1 Mpc-3. The volume of the J0836 structure is approximately 1724 cMpc3, estimated by taking a cylinder with radius of 3.1 cMpc and a length of 58.5 cMpc (corresponding to ). In this volume we thus expect to find of such massive -dropouts at random, while at least 1 was found (object A-Z06/A-B20) not counting the quasar. The discovery of such a rare massive object as part of the J0836 structure is thus additional evidence that the environment of the quasar is exceptional.
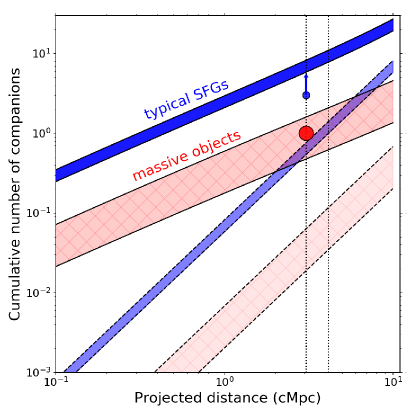
We can try to estimate how exceptional the J0836 environment is based on the clustering statistics of quasars and galaxies. The typical overdensity of galaxies found in a biased region depends on the amplitude of the quasar-galaxy cross-correlation function, , and the volume :
| (1) | |||||
The quasar-galaxy cross-correlation length has not been measured directly for the redshift and samples of our interest, but assuming that the clustering of both the quasars and the galaxies is described by power laws with similar slopes, their cross-correlation length is given by . Using the results from galaxy clustering measurements together with a halo occupation distribution model, Harikane et al. (2021) find that dark matter halos with average masses in the range at correspond to bias parameters of 7.7–10.1. A similar result is obtained using the Colossus222http://bitbucket.org/bdiemer/colossus cosmological framework (Diemer, 2018), which gives a bias of 8.7 for halos of (peak-height of 5.5). The auto-correlation length of galaxies with a similar bias parameter or halo mass was measured by Khostovan et al. (2019). They found Mpc ( Mpc) for LAEs with halo mass () at (). In the analysis below we will therefore take cMpc as an approximate value. With a quasar auto-correlation length of h-1 cMpc (see García-Vergara et al., 2017), the quasar-galaxy cross-correlation length in Eq. 1 becomes cMpc. If we assume a clustering power law slope , and a cylindrical volume with radius cMpc and length cMpc, the overdensity of halos expected in the J0836 field (not counting the quasar) is (29.6 for ).
From this we can then estimate the absolute number of such galaxies expected:
| (2) |
For an average field density of cMpc-3 (appropriate for objects of halo mass of order ; Khostovan et al., 2019; Stefanon et al., 2021), we then expect to find 0.5–1.6 of such objects in our cylindrical volume around the quasar, matching the one object that was found.
We can do a similar exercise for star-forming galaxies in more typical halos. The average co-moving abundance of dropouts with is cMpc-3. Assuming a typical bias of 5 and a correlation length of 5.5 cMpc, appropriate for this population of relatively bright dropout galaxies in halos of around at (Overzier et al., 2006a; Barone-Nugent et al., 2014; Khostovan et al., 2019), the quasar-galaxy cross-correlation length in Eq. 1 would be 15.8 cMpc.
In Fig. 6 we show the cumulative number of massive and typical companion galaxies expected in the J0836 field following these calculations with the red- and blue-shaded regions, respectively. We plot the number of objects as a function of the projected co-moving radius of a cylinder with a fixed length of 58.5 cMpc. The finding of 1 massive companion within 3.1 cMpc is consistent with the enhancement in clustering over the random expectation due to the presence of the massive quasar halo (upper red shaded curve and large circle). Doing the same calculation for more typical star-forming galaxies in lower mass halos, the number of 3 objects detected (small blue circle with arrow) is lower than that expected (upper blue-shaded region) by a factor of 2–3, but it is important to keep in mind that the spectroscopic sample is highly incomplete (for example, there are at least an additional 5 objects from Z06 that have not been targeted).
This analysis shows that the clustering observed in the J0836 field is consistent with what we would expect from the presence of a massive quasar halo. In Section 4.2 below we will compare the J0836 structure to several other dense structures of galaxies discovered in recent years, both near quasars and in the general field at . In this way we will be able to address the relative rarity of the J0836 structure in yet another way.
4.2 Comparison with other structures
In Sect. 3 above we presented statistical and theoretical evidence that the J0836 field appears to be much richer than the average cosmic region at based on (1) the photometric overdensity of Z06, (2) the spectroscopic overdensity of B20, and (3) the presence of a very massive companion galaxy. However, we cannot escape the fact that these calculations are a simplification as they do not take into account, for example, the complicated selection functions of candidates and confirmed objects and the small number statistics. One way of addressing these issues has been to use numerical simulations to evaluate the impact of such effects, as selection effects are easily incorporated and simulations offer large volumes from which statistics can be derived (e.g., Overzier et al., 2009a). On the other hand, however, we should be careful with this approach as well, as many aspects of these simulations remain to be tested by the very observations we try to interpret, and one cannot escape some degree of circular reasoning when comparing the two. Therefore, in this section we will try yet another approach of quantifying the J0836 structure, by comparing with a variety of structures that have been found near other quasars and in the field at .
4.2.1 SDSS J1030+0524
Among the luminous quasars at , there is currently only one other object for which the observations show a certain resemblance to J0836. Quasar SDSS J1030+0524 (J1030) at has been among a few, rare quasars with strong evidence for companion structure. The evidence consists of significant overdensities of (photometric) dropout galaxies on various scales (Stiavelli et al., 2005; Morselli et al., 2014; Balmaverde et al., 2017), and more recently spectroscopic evidence in the form of 4 LBGs and 2 LAEs within a of the quasar redshift (Decarli et al., 2019; Mignoli et al., 2020). The confirmed LBGs lie at 8–9′ away from the quasar, and at present we have no way of comparing this to the environment of J0836 on these scales. However, Mignoli et al. (2020) also found two LAEs much closer to J1030, LAE1 at (-4.98,0.14) pMpc and LAE2 at (2.6,0.13) pMpc using our cosmology. Although the proper distances along the l.o.s. are comparable, the projected separations are smaller by a factor of 2 in the case of the J1030 LAEs. However, it is important to note that they were selected in a very different way using a blind spectroscopic survey over a 1′1′ field centered on the quasar with VLT/MUSE. The LAEs in the J0836 field were found by targeting photometric dropout objects with slit spectroscopy. The physical properties of the two populations of LAEs are quite different: the J1030 LAEs are fainter in absolute magnitude ( mag) compared to those in J0836 (–20.8 mag). The EWs of the two LAEs near J1030 (11–27 Å) also appear somewhat lower than the three near J0836 (10–76 Å). The relatively high EWs and bright UV magnitudes of the J0836 LAEs are curious because typical LAEs show the opposite trend (e.g., De Barros et al., 2017), and could be related to the large quasar proximity zone in which they are situated (Bosman et al., 2020). We have checked that the LAEs in neither field are affected by Ly fluorescence due to the quasar’s strong ionizing radiation to a few % at most (see also Bosman et al., 2020). Again, we note that the selection techniques used in the two studies were very different. In the case of J0836, current data does not allow us to search for objects as faint as the two LAEs found near J1030. On the other hand, the fact that the J1030 integral field observations did not find any dropout objects with Ly as bright as the three objects found near J0836 means that they do not exist near J1030. Summarizing, the comparison shows that both J0836 and J1030 have a large spectroscopic excess of objects relatively close to the quasar (in terms of the projected separation, objects near J1030 are about twice closer than those near J0836), but the physical properties of these objects appear somewhat different (objects near J0836 are brighter in the UV and Ly than those near J1030).
4.2.2 VIKING J030516.92–315056.0 at
Ota et al. (2018) have detected a large-scale overdensity of star-forming galaxies around the quasar VIKING J030516.92–315056.0 at . Although several overdense peaks of (candidate) LBGs are found at 20–40 cMpc away from the quasar, just a single LBG candidate lies within the central 12 arcmin2 equivalent to one HST/ACS pointing. There are also no candidate LAEs in this region with a limiting rest-frame Ly of 15 Å and erg s-1, and the surface density of LAEs on larger scales appears to be underdense compared to a control field. There is thus no observational evidence that this particular quasar is surrounded by a structure of galaxies that is similar to that found near J0836, at least not on the relatively small scales probed by our study.
4.2.3 Other quasars at
A very useful literature overview of searches for structures associated with quasars at is given in Table 2 from Mazzucchelli et al. (2017). If we limit this list only to quasars for which there exists spectroscopic evidence for associated galaxies on scales similar to that probed by our J0836 study, only 4 out of the original 14 quasars stand out with reported overdensities. Among the quasars, this includes only J0836 itself, and J1030 at described in detail in Section 4.2.1 above. The two remaining objects are quasars at studied by Husband et al. (2013). In one of these, there are 3 objects within in an area similar in scale as the J0836 structure. In the other field, there are 6 confirmed LBGs within (plus an additional quasar), but except for one object these all lie on scales beyond that probed for J0836. Thus, it appears that J0836 and J1030 both represent quite remarkable environments, among all the quasars studied to date.
In addition, Decarli et al. (2017) derived unique information on the environments of quasars at based on the occurrence of companion objects identified based on the [C ii] 158m emission line (see also Trakhtenbrot et al., 2017, for similar findings at ). In a survey of 25 quasars, four quasars had close companions (within a projected 600 kpc and 600 km s-1). The companion galaxies are not detected in the rest UV, and represent a population of dusty star-forming objects with dynamical masses similar to those of their companion quasars. These massive, close companion objects are consistent with the expected cross-clustering between quasars and star-forming galaxies measured at lower redshifts (García-Vergara et al., 2017). However, the fact that only 4/25 quasars showed [C ii] 158m companions, indicates that this type of environment is far from typical. It is important to note that these Atacama Large Millimeter Array (ALMA) observations probe a much smaller field of view than in the other studies described in this paper (survey volume of 400 cMpc3), making any quantitative comparison difficult. Despite it being much further away from the quasar, the stellar mass of the massive companion of J0836 is similar to that of the companion objects identified by Decarli et al. (2017). However, no [C ii] 158m observations exist for the former.
Vito et al. (2021) also found evidence for a quasar at involved in a close pair, and Yue et al. (2021) found the first example of a pair of quasars at (projected separation of 10 pkpc). The separations are much smaller than the virial radius of the likely dark matter halos, suggesting that merger-induced triggering could play a role in at least a small fraction of the quasars.
4.2.4 COSMOS AzTEC-3 structure at
Capak et al. (2011) found strong clustering near the source COSMOS AzTEC-3 at consisting of a spectroscopically confirmed dropout object at and several photometric dropouts within a 2 cMpc (0.3 pMpc) radius (see also Riechers et al., 2014). A quasar at lies further away (at 13 cMpc). Although a detailed quantitative comparison is difficult because of the different selections and spectroscopic completeness involved, there appear to be strong similarities between J0836 and this structure in terms of the photometric and spectroscopic overdensities.
4.2.5 SXDF protocluster at
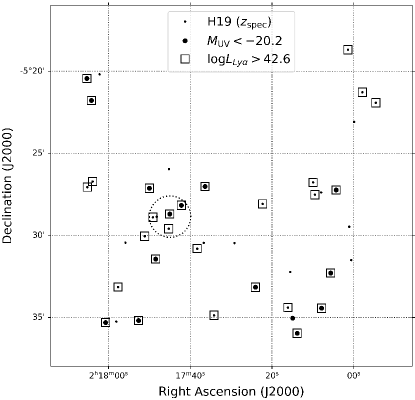
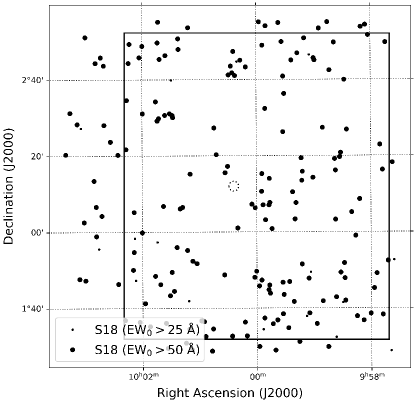
The Subaru XMM-Newton Deep Field (SXDF) hosts one of the densest structures known at (Ouchi et al., 2005; Jiang et al., 2018; Shibuya et al., 2018; Higuchi et al., 2019; Harikane et al., 2019). The structure labeled z57OD corresponds to an overdensity of LAEs with overdensity and significance of 7.2 when defined using a cylindrical region of 10 cMpc radius and 40 cMpc depth. The core of the structure is characterized by a narrow range in redshift (), but can be seen in maps with . In Fig. 7 we show the z57OD structure using the spectroscopic data from Harikane et al. (2019). Objects having absolute rest UV magnitudes brighter than -20.2 mag are indicated with large circles, and objects having Ly luminosities larger than 1042.6 erg s-1 are marked by red squares. The large dotted circle marks a circular 5 arcmin2 region that maximizes the number of known structure members, containing 4 members. Because the SXDF and J0836 structures are, respectively, narrow-band and dropout selected, it is difficult to make a direct quantitative comparison. However, the 4 objects encircled in Fig. 7 all have Ly luminosities at least as high as the 3 confirmed objects near J0836, and 2 of these have UV luminosities similar to those near J0836. Thus, at least on these scales, the J0836 and z57OD structures appear quite similar.
4.2.6 HUDF structure at
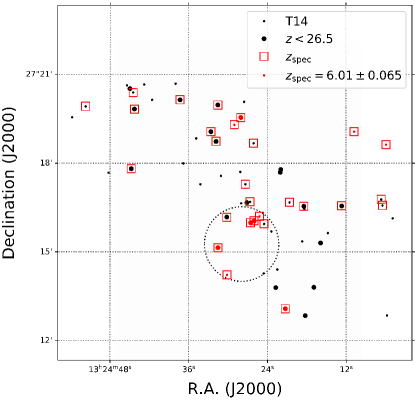
Malhotra et al. (2005) identified a structure of -dropout galaxies at in the HUDF. They followed up 29 (–0.9 objects with the ACS grism, finding 23 objects of which 15 are part of an overdensity of at least a factor of 2 along the line of sight. In Fig. 8 we show the HUDF structure, indicating objects with (–1.3 (small circles) and those brighter than mag (large circles). Objects within the redshift spike are marked red. The large dotted circle marks a circular 5 arcmin2 region that maximizes the number of structure members. In this region, there are 7 galaxies, with 3 being brighter than mag. The grism redshifts have an accuracy of , so we will only be able to compare the two structures within . The 3 objects thus appear to lie in a redshift interval that is at least as wide as that found for the confirmed objects around J0836. More importantly, the spectroscopic completeness of the Malhotra et al. (2005) sample is much higher than for the J0836 sample (about 62% versus 29%). The J0836 structure thus appears significantly more overdense compared to the HUDF structure, at least at the magnitude limits considered.
4.2.7 SDF protocluster at
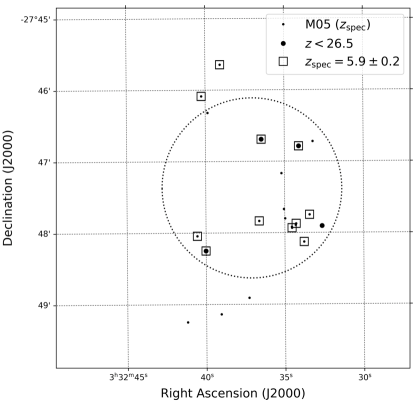
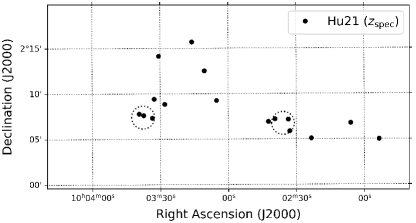
Among the most impressive large-scale structures known at is the protocluster discovered by Toshikawa et al. (2012, 2014) in the Subaru Deep Field (SDF). Among 28 spectroscopically confirmed -dropout objects at lies a structure of 10 objects at () and measuring cMpc on the sky. The selection of these objects is similar to the dropout selections of Z06 and B20, and the spectroscopic followup similar to that performed by B20 in the J0836 field. In Fig. 9 we show the SDF structure, indicating which objects have spectroscopic redshifts (red squares), which objects are brighter than mag (large circles), and which objects lie within of the redshift spike. The large dotted circle marks a circular 5 arcmin2 region that maximizes the number of structure members. In this region, there are 5 member galaxies, with 3 being brighter than mag. This indicates that the J0836 field resembles the densest part of the Toshikawa et al. (2014) structure.
4.2.8 CFHTLS structures at
Toshikawa et al. (2016) performed a color selection of -dropouts in the CFHTLS Deep Fields to a depth of mag (about ). They searched for surface overdensities in regions with a radius of 1 pMpc (2.9′), suitable for the identification of massive cluster progenitors according to numerical simulations and previous studies (Toshikawa et al., 2012, 2014, 2016). Five regions were found, and the two most significant overdensities (D1ID01 of 6.1 and D3ID01 of 7.6) were targeted by spectroscopy to confirm the dropout candidates. Three redshifts were obtained in D1ID01, with two objects separated by and 53″ (0.32 pMpc) and a third object not physically associated at much higher redshift. Two redshifts were obtained in D3ID01, with the two objects separated by and 83″ (0.49 pMpc). There are no quasars known to be associated with either structure. The three confirmed objects in the J0836 field lie within a projected 0.4 pMpc from the quasar (and about 0.1 pMpc from each other) and have . Based on the available photometric and spectroscopic evidence, the J0836 structure thus appears at least as densely populated as the two CFHTLS regions, which themselves represent significant overdensities compared to the general field at .
4.2.9 LAGER-z7OD1 protocluster at
Hu et al. (2021) presented a large overdensity of LAEs at , LAGER-z7OD1. The LAEs were narrow-band selected and have minimum Ly luminosities comparable to the LAEs near J0836 ( ). They find 16 spectroscopic LAEs clustered in a region cMpc3, where the last dimension corresponds to the redshift depth of . Drawing again random circular regions with a radius of 126, the maximum number of LAEs encountered is 3, centered around two peaks in the sky distribution of LAGER-z7OD1 (see Fig. 10). This shows that on these scales the structure found around J0836 is not too different from the densest peaks within this large-scale overdense region at .
4.2.10 SC4K survey of LAEs at
To assess the random chance of finding a given number of LAEs in the field, we used data from the 2 deg2 SC4K survey (Sobral et al., 2018). We select all narrow-band excess objects detected in the NB816 filter, which is sensitive to Ly at (FWHM), and thus comparable to the redshift width of the objects in the J0836 field (). The contamination by foreground objects in this sample is estimated at about 15%. It is important to note that the J0836 sample was not narrow-band selected, and the comparison is thus somewhat skewed. However, the LAEs in the SC4K survey have redshifts, Ly luminosities ( erg s-1) and rest-frame EWs (50 Å) comparable to the dropout objects confirmed in the J0836 field by B20. The SC4K survey can thus be used as a conservative reference field for estimating the clustering statistics of these objects (in other words, if we were to perform a survey like SC4K on the J0836 field, we are likely to find even more objects than currently selected, and thus the SC4K reference gives the maximum expectation). In Fig. 11 we show the sky distribution of LAEs from the SC4K survey. We performed a counts-in-cells analysis using a circular region with radius of 126 similar to that used in the J0836 field. The chance of randomly finding 2 LAEs in such a small area is at most 1%, and the chance of finding 3 LAEs is 0.1% (note that these numbers are likely skewed high due to the contamination of about 15% and the fact that the J0836 objects were not narrow-band selected). We can conclude from this analysis that the J0836 field contains a number of LAEs that is at least as large as only the densest location in the whole 2 deg2 SC4K survey.
4.2.11 Summary of the comparisons
Based on the various comparisons with known structures given above, it appears justified to conclude that the J0836 field is comparably rich as the peaks in other rare large-scale structures found at these redshifts. J0836 shows some characteristics of other quasar fields, such as the overdensity of star-forming galaxies found near SDSS J1030+0524 at (Mignoli et al., 2020) and the evidence of massive companion galaxies found near some quasars (Decarli et al., 2017; Yue et al., 2021; Vito et al., 2021), although the scales are very different for the latter. Compared to the non-quasar fields, the J0836 field appears as rich as some of the densest regions known in the field to date. However, the latter include many spectroscopically confirmed surface overdensities extending over angular scales that are much larger than we can probe with the J0836 data, and it is not known whether the similarities between J0836 and these fields would hold on those scales as well.
5 Summary and discussion
5.1 Summary
We have shown that the luminous radio-loud quasar J0836 at is likely part of a relatively rich structure of galaxies in the early universe. The evidence consists mainly of a photometric overdensity previously found by Z06, a spectroscopic overdensity identified by B20, and the presence of at least one very massive companion galaxy detected at 3.6 m with Spitzer/IRAC by Overzier et al. (2009b) allowing a stellar mass estimate. Based on a cross-correlation analysis of galaxies and quasars, we showed that the presence of these companion objects can plausibly be explained by an overdense environment associated with the quasar. We compared the global properties of the J0836 structure with those found near other quasars and in the field at similar redshifts, concluding that the structure resembles the densest peaks in the cosmic density field currently known at , at least at similar depths and scales as probed by our observations.
This study is significant for a number of reasons. First, it provides new evidence that the first luminous quasars are associated with relatively dense peaks in the cosmic density field. Second, the J0836 structure appears relatively unique among the population of quasars studied to date, with one system showing a similar propensity of clustered companion galaxies (Mignoli et al., 2020), and several other quasars showing evidence for direct interactions on much smaller scales (e.g., Decarli et al., 2017; Vito et al., 2021; Yue et al., 2021). Third, although the J0836 structure appears, in some aspects, similar to some of the most clustered regions of star-forming galaxies known at , these regions are clearly not unique to the quasars given that overdensities of galaxies have been discovered in the field as well, sometimes larger and more significant than what has been found near any quasar to date (e.g., Toshikawa et al., 2014; Harikane et al., 2019; Hu et al., 2021).
By combining these different clues, we will discuss a number of important open questions related to the formation of SMBHs, quasar environments and radio jets.
5.2 Insights into seed formation
One of the most important questions in the study of galaxies relates to the origin of the SMBHs. This question is particularly pertinent to the population of luminous quasars at , given that the masses of their SMBHs managed to rival that of M87 ( ; Event Horizon Telescope Collaboration et al., 2019) within 1 Gyr of the Big Bang. This notion has led to a substantial effort in theoretical modeling of possible seed black hole populations and their accretion histories with stellar mass and intermediate mass BHs emerging as the main candidates for the seeds (for reviews see, e.g., Bromm & Yoshida, 2011; Inayoshi et al., 2020; Volonteri et al., 2021).
The slightly longer cosmic times available to quasars at make it significantly “easier” to go from a 100 seed to a SMBH of a few times compared to the quasars at (e.g., Bañados et al., 2018b; Marinello et al., 2020; Pacucci & Loeb, 2021). For example, assuming constant accretion with Eddington ratios of 0.8–1.3 onto a seed formed at is able to produce a SMBH like that in J0836 by , while the quasar ULAS J1342+0928 at requires the existence of a 1000 seed as early as assuming standard Eddington rate accretion (Bañados et al., 2018b). There are at least two problems with the latter scenario: (1) it is not clear if such massive seeds could exist that early, and (2) it is not clear if such an efficient accretion rate could be sustained over such a long cosmic time.
In scenarios where the growth of SMBHs is allowed to start with an intermediate mass BH (IMBH) seed, the constraints on formation redshift, accretion rates and growth times are significantly relaxed. The biggest uncertainty with these scenarios, however, is whether there exist a viable channel for IMBH formation at early times. Models and simulations have identified a number of ways in which IMBH seeds can form, for example through the merging of numerous stellar mass seeds or through the collapse of massive gas clouds into a DCBH seed (see Sect. 1).
The results presented in this paper cannot constrain any of these scenarios, but the association of J0836 with a relatively dense cosmic structure is very interesting in light of a number of recent model predictions for DCBH formation. The various DCBH scenarios proposed all have in common that they require the quasar to form in an overdense region. The overdense region ensures that the primordial gas cloud is heated through an enhanced local Lyman-Werner photon flux and a high rate of merging (mini)halos (e.g., Wise et al., 2019; Lupi et al., 2021). After the collapse, the overdense environment can further ensure a steady accretion rate to form a SMBH and power a quasar.
The simulations of Wise et al. (2019) specifically point to a scenario in which the presence of an overdense region of star-forming galaxies several tens of kpc away stimulates the formation of a DCBH seed. When combined with sufficient dynamical heating of atomic cooling halos (ACHs) that are rapidly growing, the nearby star-forming complex only needs to provide a fraction of the LW flux assumed by earlier models. They find a density of DCBHs in overdense regions at of cMpc-3 with a global number density of cMpc-3 given the rarity of the overdense regions simulated by Wise et al. (2019). For normal and void regions of the universe, the number density of DCBH candidates is predicted to be lower by 3–6 orders of magnitude compared to the number density in overdense regions. It is important to point out that the overdense region chosen by Wise et al. (2019) corresponds to a dark matter halo of a few times at , which is still two orders of magnitude below the typical halo mass of the luminous quasars studied here. If overdense environments indeed enhance the number density of DCBHs by orders of magnitude, perhaps the proto-J0836 environment would make an ideal site.
The galaxies detected as part of the J0836 structure are unlikely the same as the ones that provided the required LW background at early times. For instance, if we take our model fit results for object A-Z06/A-B20 from Sect. 3.3 ( with a mass-weighted age of Gyr), we can see that even this massive galaxy likely was not around at . Its distance from J0836 is also much too great to have provided a significant Lyman-Werner intensity near the inferred site of seed formation (several Mpc instead of tens of kpc). However, the J0836 structure suggests that an overdense region that predates the formation of the quasar was probably present from early times. It is difficult to be more quantitative at this point. Deep observations with ALMA and the James Webb Space Telescope (JWST) could be used to quantify quasar environments on smaller scales and down to fainter galaxies of much lower bias, and these could then be compared to tailored simulations of DCBH collapse as performed by Wise et al. (2019).
Lupi et al. (2021) revisit the idea of synchronized pairs (SPs) of ACHs (Dijkstra et al., 2008; Visbal et al., 2014; Regan et al., 2017), where two halos separated by 1 kpc and star formation commencing in one halo 5 Myr prior to that in the other provides a high LW flux to drive the formation of a DCBH. They compare this scenario to the dynamical heating (DH) driven collapse similar to that discussed by Wise et al. (2019), but focusing specifically on the progenitor of a at . Although the dense environment stimulates the formation of SPs, the pristine halos of the pairs are also easily polluted by metals due to the enhanced supernova activity in the region. These polluted halos are assumed to cool and fragment, and no longer considered candidates for DCBH formation. Comparing this with the DH scenario in the same overdense region shows that, because of the clustering of LW sources in the overdense region, several DH seeds may be formed for each SP seed, although the initial mass of the DH seeds may be lower than the SP seeds. The studies by Wise et al. (2019) and Lupi et al. (2021) thus point in the same direction that overdense regions in the early universe may be a necessary ingredient for the formation of DCBHs.
One could argue that in principle each quasar at must have formed in such an overdense environment given their high halo masses (Chen et al., 2021). However, the finding of relatively rich environments around quasars such as J0836 and J1030 compared to other quasars must then imply that the conditions required for DCBH formation as suggested by theory may have been particularly well met for the progenitor regions of these sources.
5.3 Relevance of the radio jets
The fast growth rates of the SMBHs powering the quasars implies that we are seeing them at a time of potentially significant impact on the growth of the host galaxies through Active Galactic Nucleus (AGN) feedback. The (small) subset of quasars that are radio-loud are the first sources in which we could study, in principle, the interaction between powerful radio jets and the forming interstellar medium. Even though the fraction of quasars that is radio-loud is relatively small (10%, independent of redshift, see Bañados et al. (2015)), new radio surveys at low frequencies detect a significant fraction of the population of radio-quiet quasars at (Gloudemans et al., 2021). There is growing evidence that at least at low redshift faint radio structures present also in radio-quiet quasars may be disproportionally responsible for the feedback observed (e.g., Jarvis et al., 2021).
At these redshifts, there are still relatively few radio sources known. J0836 appears as the 8th most distant radio-loud AGN in the overview of Bañados et al. (2021, their Table 6). While optically the most luminous, it has the lowest radio-loudness parameter (). We determine a bolometric luminosity of erg s-1 using Richards et al. (2006), and with a black hole mass , we find an Eddington ratio of . This range indicates that J0836 lies along the upper envelope of Eddington ratios found for high redshift quasars compiled by Bañados et al. (2021).
The compact radio size (Frey et al., 2005), steep spectral index and evidence for a peaked radio spectrum (Wolf et al., 2021) suggest that J0836 is not beamed and that it is a young radio source in which the jets are still confined to the inner kpc scales. With a (projected) size of 40 pc and assuming a typical hot spot advancement speed of () (Giroletti & Polatidis, 2009), the kinematic age in the young source scenario is in the range yr. If the jets have an inclination angle as small as 1° along the line of sight (still large enough such that it does not become a blazar), the radio age could be as high as yr. This is much shorter than the most recent quasar phase of yr estimated by B20. Given these relatively short jet life-times compared to the black hole and quasar accretion time scales inferred for J0836, it appears unlikely that the (current) radio jets have had any meaningful impact on the growth of the SMBH. Alternatively, the radio jets could be recurrent, or the radio source is much older than inferred from its maximum linear size, as expected in the case of jets that are confined by a dense ISM (e.g., O’Dea & Saikia, 2021).
What does seem relevant, however, is the fact that J0836 represents yet another case of a high redshift radio-loud AGN associated with a relatively dense environment (e.g., Overzier et al., 2006b; Venemans et al., 2007; Hatch et al., 2014; Overzier, 2016). The ability of SMBHs to form strong radio jets is generally assumed to scale as a function of black hole mass, accretion rate and spin (Blandford & Znajek, 1977; Fanidakis et al., 2011), and all three parameters may be expected to be enhanced in overdense regions due to the enhanced gas accretion rates and merger activity. On the other hand, radio jets may be the consequence of energy extracted from the accretion disk, in which case the SMBH grows much faster due to higher accretion rates (Blandford & Payne, 1982). A recent discussion of this relevant to the jets in radio-loud quasars at is given by Connor et al. (2021).
Quasar J0836 is different from the radio-loud quasar PSO J352.4034-15.3373 at a very similar redshift (Bañados et al., 2018a; Rojas-Ruiz et al., 2021; Connor et al., 2021), mainly in the sense of its very compact linear size (40 pc versus 1.6 kpc; Frey et al., 2005; Momjian et al., 2018), radio power (rest-frame W Hz-1 versus W Hz-1; Wolf et al., 2021; Bañados et al., 2018a), and radio loudness parameter ( versus ; Bañados et al., 2021; Rojas-Ruiz et al., 2021). It also appears to be quite different from the distant radio galaxy TGSS J1530+1049 at discovered by Saxena et al. (2018) with rest-frame W Hz-1 and a radio morphology consisting of two radio components with a linear extent of 2.5 kpc Gabányi et al. (2018). However, all these sources are consistent with being relatively young radio sources in which the radio structures are comparable or within the scale of the host galaxies. These sources thus offer an excellent opportunity for investigating the interaction between radio jets, galaxy formation and SMBH growth.
5.4 Concluding remarks
The answer to the question of what were the seeds of today’s SMBHs is coming within our reach. Likely it will require the synthesis of data and clues from a wide variety of independent upcoming experiments. Gravitational wave astronomy has already begun to map the black hole mass gap (Abbott et al., 2020), and the proposed Laser Interferometer Space Antenna (LISA) mission (Amaro-Seoane et al., 2017) and Einstein Telescope (Punturo et al., 2010; Maggiore et al., 2020) will significantly widen the mass and distance range of detectable black hole mergers, thereby addressing directly the mass distribution of the population as a function of redshift. JWST could in principle detect massive DCBH seeds – if they exist – through their unique spectral signatures in the infrared, provided they are not too rare (Pacucci et al., 2016; Natarajan et al., 2017; Woods et al., 2019, 2021a). The Nancy Grace Roman Space Telescope, due to its much wider field of view, could perform a search employing gravitational lensing (Whalen et al., 2020). An upper limit on the number density of DCBH candidates could already be used to constrain the DCBH formation scenario, and perhaps shift the focus of modeling efforts to seeds originating from Population III stars instead. In any case, JWST will also map for the first time in detail the amount of black hole activity in typical galaxies during the first billion years, and the masses of SMBHs in (faint) quasars, thereby constraining the total black hole demographics and indirectly the seed population. Evidence for Population III stars either at high redshift or in the Local Group as well as advanced models could constrain the range of the masses of this first generation of stars and thus the mass range that their end-products could realistically achieve (e.g. Hirano et al., 2014; Placco et al., 2021; Woods et al., 2021a, b). Searches for IMBHs in globular clusters and dwarf galaxies will provide yet another unique constraint on the seed population (Greene, 2012; Mezcua, 2017; Latimer et al., 2021). The search for distant obscured black holes will also greatly benefit from the new capacity in the X-rays provided by the Athena or Lynx missions (Pacucci et al., 2015; Amarantidis et al., 2019). Extremely Large Telescopes will then be needed to confirm and characterize the sources found. Yet another window on the first stages of black hole formation will be provided at radio wavelengths. Deep radio surveys with the Square Kilometer Array may detect DCBHs through their core radio emission (Whalen et al., 2021), and also find the most distant objects in the universe capable of hosting radio jets, the smoking gun of massive, spinning black holes.
In the more immediate future, it will be extremely interesting to see (1) to what extend the compact radio structures seen in the most distant radio galaxies and quasars interact with the ISM of their young, forming host galaxies, (2) if there is any evidence for environmental triggers of this radio activity, and (3) to establish definitively what are the typical environments of the radio-loud and radio-quiet AGN at this important epoch. Several programs have been scheduled on the HST and the JWST that aim to do just that within the next two years (e.g., HST programs 16258/16693 and JWST programs 1205/1554/1764/2028/2078).
References
- Abbott et al. (2020) Abbott, R., Abbott, T. D., Abraham, S., et al. 2020, Phys. Rev. Lett., 125, 101102, doi: 10.1103/PhysRevLett.125.101102
- Agarwal et al. (2016) Agarwal, B., Smith, B., Glover, S., Natarajan, P., & Khochfar, S. 2016, MNRAS, 459, 4209, doi: 10.1093/mnras/stw929
- Ajiki et al. (2006) Ajiki, M., Taniguchi, Y., Murayama, T., et al. 2006, PASJ, 58, 499, doi: 10.1093/pasj/58.3.499
- Amarantidis et al. (2019) Amarantidis, S., Afonso, J., Messias, H., et al. 2019, MNRAS, 485, 2694, doi: 10.1093/mnras/stz551
- Amaro-Seoane et al. (2017) Amaro-Seoane, P., Audley, H., Babak, S., et al. 2017, arXiv e-prints, arXiv:1702.00786. https://arxiv.org/abs/1702.00786
- Astropy Collaboration et al. (2013) Astropy Collaboration, Robitaille, T. P., Tollerud, E. J., et al. 2013, A&A, 558, A33, doi: 10.1051/0004-6361/201322068
- Astropy Collaboration et al. (2018) Astropy Collaboration, Price-Whelan, A. M., Sipőcz, B. M., et al. 2018, AJ, 156, 123, doi: 10.3847/1538-3881/aabc4f
- Bañados et al. (2018a) Bañados, E., Carilli, C., Walter, F., et al. 2018a, ApJ, 861, L14, doi: 10.3847/2041-8213/aac511
- Bañados et al. (2013) Bañados, E., Venemans, B., Walter, F., et al. 2013, ApJ, 773, 178, doi: 10.1088/0004-637X/773/2/178
- Bañados et al. (2015) Bañados, E., Venemans, B. P., Morganson, E., et al. 2015, ApJ, 804, 118, doi: 10.1088/0004-637X/804/2/118
- Bañados et al. (2016) Bañados, E., Venemans, B. P., Decarli, R., et al. 2016, ApJS, 227, 11, doi: 10.3847/0067-0049/227/1/11
- Bañados et al. (2018b) Bañados, E., Venemans, B. P., Mazzucchelli, C., et al. 2018b, Nature, 553, 473, doi: 10.1038/nature25180
- Bañados et al. (2021) Bañados, E., Mazzucchelli, C., Momjian, E., et al. 2021, ApJ, 909, 80, doi: 10.3847/1538-4357/abe239
- Balmaverde et al. (2017) Balmaverde, B., Gilli, R., Mignoli, M., et al. 2017, A&A, 606, A23, doi: 10.1051/0004-6361/201730683
- Barone-Nugent et al. (2014) Barone-Nugent, R. L., Trenti, M., Wyithe, J. S. B., et al. 2014, ApJ, 793, 17, doi: 10.1088/0004-637X/793/1/17
- Becker et al. (2015) Becker, G. D., Bolton, J. S., Madau, P., et al. 2015, MNRAS, 447, 3402, doi: 10.1093/mnras/stu2646
- Bennett et al. (2014) Bennett, C. L., Larson, D., Weiland, J. L., & Hinshaw, G. 2014, ApJ, 794, 135, doi: 10.1088/0004-637X/794/2/135
- Bertin & Arnouts (1996) Bertin, E., & Arnouts, S. 1996, A&AS, 117, 393, doi: 10.1051/aas:1996164
- Bhatawdekar et al. (2019) Bhatawdekar, R., Conselice, C. J., Margalef-Bentabol, B., & Duncan, K. 2019, MNRAS, 486, 3805, doi: 10.1093/mnras/stz866
- Blandford & Payne (1982) Blandford, R. D., & Payne, D. G. 1982, MNRAS, 199, 883, doi: 10.1093/mnras/199.4.883
- Blandford & Znajek (1977) Blandford, R. D., & Znajek, R. L. 1977, MNRAS, 179, 433, doi: 10.1093/mnras/179.3.433
- Bosman et al. (2020) Bosman, S. E. I., Kakiichi, K., Meyer, R. A., et al. 2020, ApJ, 896, 49, doi: 10.3847/1538-4357/ab85cd
- Bouwens et al. (2006) Bouwens, R. J., Illingworth, G. D., Blakeslee, J. P., & Franx, M. 2006, ApJ, 653, 53, doi: 10.1086/498733
- Bouwens et al. (2007) Bouwens, R. J., Illingworth, G. D., Franx, M., & Ford, H. 2007, ApJ, 670, 928, doi: 10.1086/521811
- Bouwens et al. (2015) Bouwens, R. J., Illingworth, G. D., Oesch, P. A., et al. 2015, ApJ, 811, 140, doi: 10.1088/0004-637X/811/2/140
- Bromm & Yoshida (2011) Bromm, V., & Yoshida, N. 2011, ARA&A, 49, 373, doi: 10.1146/annurev-astro-081710-102608
- Calvi et al. (2019) Calvi, R., Rodríguez Espinosa, J. M., Mas-Hesse, J. M., et al. 2019, MNRAS, 489, 3294, doi: 10.1093/mnras/stz2177
- Calzetti et al. (2000) Calzetti, D., Armus, L., Bohlin, R. C., et al. 2000, ApJ, 533, 682, doi: 10.1086/308692
- Capak et al. (2011) Capak, P. L., Riechers, D., Scoville, N. Z., et al. 2011, Nature, 470, 233, doi: 10.1038/nature09681
- Carnall et al. (2018) Carnall, A. C., McLure, R. J., Dunlop, J. S., & Davé, R. 2018, MNRAS, 480, 4379, doi: 10.1093/mnras/sty2169
- Chen et al. (2021) Chen, H., Eilers, A.-C., Bosman, S. E. I., et al. 2021, arXiv e-prints, arXiv:2110.13917. https://arxiv.org/abs/2110.13917
- Connor et al. (2021) Connor, T., Bañados, E., Stern, D., et al. 2021, ApJ, 911, 120, doi: 10.3847/1538-4357/abe710
- Davies et al. (2018) Davies, F. B., Hennawi, J. F., Bañados, E., et al. 2018, ApJ, 864, 142, doi: 10.3847/1538-4357/aad6dc
- De Barros et al. (2017) De Barros, S., Pentericci, L., Vanzella, E., et al. 2017, A&A, 608, A123, doi: 10.1051/0004-6361/201731476
- Decarli et al. (2017) Decarli, R., Walter, F., Venemans, B. P., et al. 2017, Nature, 545, 457, doi: 10.1038/nature22358
- Decarli et al. (2019) Decarli, R., Mignoli, M., Gilli, R., et al. 2019, A&A, 631, L10, doi: 10.1051/0004-6361/201936813
- Diemer (2018) Diemer, B. 2018, ApJS, 239, 35, doi: 10.3847/1538-4365/aaee8c
- Dijkstra et al. (2008) Dijkstra, M., Haiman, Z., Mesinger, A., & Wyithe, J. S. B. 2008, MNRAS, 391, 1961, doi: 10.1111/j.1365-2966.2008.14031.x
- Duncan et al. (2014) Duncan, K., Conselice, C. J., Mortlock, A., et al. 2014, MNRAS, 444, 2960, doi: 10.1093/mnras/stu1622
- Eilers et al. (2017) Eilers, A.-C., Davies, F. B., Hennawi, J. F., et al. 2017, ApJ, 840, 24, doi: 10.3847/1538-4357/aa6c60
- Eisenstein & Loeb (1995) Eisenstein, D. J., & Loeb, A. 1995, ApJ, 443, 11, doi: 10.1086/175498
- Event Horizon Telescope Collaboration et al. (2019) Event Horizon Telescope Collaboration, Akiyama, K., Alberdi, A., et al. 2019, ApJ, 875, L6, doi: 10.3847/2041-8213/ab1141
- Fan et al. (2000) Fan, X., White, R. L., Davis, M., et al. 2000, AJ, 120, 1167, doi: 10.1086/301534
- Fan et al. (2001) Fan, X., Narayanan, V. K., Lupton, R. H., et al. 2001, AJ, 122, 2833, doi: 10.1086/324111
- Fanidakis et al. (2011) Fanidakis, N., Baugh, C. M., Benson, A. J., et al. 2011, MNRAS, 410, 53, doi: 10.1111/j.1365-2966.2010.17427.x
- Freudling et al. (2003) Freudling, W., Corbin, M. R., & Korista, K. T. 2003, ApJ, 587, L67, doi: 10.1086/375338
- Frey et al. (2003) Frey, S., Mosoni, L., Paragi, Z., & Gurvits, L. I. 2003, MNRAS, 343, L20, doi: 10.1046/j.1365-8711.2003.06869.x
- Frey et al. (2005) Frey, S., Paragi, Z., Mosoni, L., & Gurvits, L. I. 2005, A&A, 436, L13, doi: 10.1051/0004-6361:200500112
- Gabányi et al. (2018) Gabányi, K. É., Frey, S., Gurvits, L. I., Paragi, Z., & Perger, K. 2018, Research Notes of the American Astronomical Society, 2, 200, doi: 10.3847/2515-5172/aaec82
- Galárraga-Espinosa et al. (2020) Galárraga-Espinosa, D., Aghanim, N., Langer, M., Gouin, C., & Malavasi, N. 2020, A&A, 641, A173, doi: 10.1051/0004-6361/202037986
- García-Vergara et al. (2017) García-Vergara, C., Hennawi, J. F., Barrientos, L. F., & Rix, H.-W. 2017, ApJ, 848, 7, doi: 10.3847/1538-4357/aa8b69
- Giavalisco et al. (2004) Giavalisco, M., Ferguson, H. C., Koekemoer, A. M., et al. 2004, ApJ, 600, L93, doi: 10.1086/379232
- Giroletti & Polatidis (2009) Giroletti, M., & Polatidis, A. 2009, Astronomische Nachrichten, 330, 193, doi: 10.1002/asna.200811154
- Gloudemans et al. (2021) Gloudemans, A. J., Duncan, K. J., Röttgering, H. J. A., et al. 2021, arXiv e-prints, arXiv:2110.06222. https://arxiv.org/abs/2110.06222
- Greene (2012) Greene, J. E. 2012, Nature Communications, 3, 1304, doi: 10.1038/ncomms2314
- Habouzit et al. (2016) Habouzit, M., Volonteri, M., Latif, M., Dubois, Y., & Peirani, S. 2016, MNRAS, 463, 529, doi: 10.1093/mnras/stw1924
- Harikane et al. (2019) Harikane, Y., Ouchi, M., Ono, Y., et al. 2019, ApJ, 883, 142, doi: 10.3847/1538-4357/ab2cd5
- Harikane et al. (2021) Harikane, Y., Ono, Y., Ouchi, M., et al. 2021, arXiv e-prints, arXiv:2108.01090. https://arxiv.org/abs/2108.01090
- Hatch et al. (2014) Hatch, N. A., Wylezalek, D., Kurk, J. D., et al. 2014, MNRAS, 445, 280, doi: 10.1093/mnras/stu1725
- Higuchi et al. (2019) Higuchi, R., Ouchi, M., Ono, Y., et al. 2019, ApJ, 879, 28, doi: 10.3847/1538-4357/ab2192
- Hirano et al. (2014) Hirano, S., Hosokawa, T., Yoshida, N., et al. 2014, ApJ, 781, 60, doi: 10.1088/0004-637X/781/2/60
- Hu et al. (2021) Hu, W., Wang, J., Infante, L., et al. 2021, Nature Astronomy, 5, 485, doi: 10.1038/s41550-020-01291-y
- Husband et al. (2013) Husband, K., Bremer, M. N., Stanway, E. R., et al. 2013, MNRAS, 432, 2869, doi: 10.1093/mnras/stt642
- Inami et al. (2017) Inami, H., Bacon, R., Brinchmann, J., et al. 2017, A&A, 608, A2, doi: 10.1051/0004-6361/201731195
- Inayoshi et al. (2016) Inayoshi, K., Haiman, Z., & Ostriker, J. P. 2016, MNRAS, 459, 3738, doi: 10.1093/mnras/stw836
- Inayoshi et al. (2020) Inayoshi, K., Visbal, E., & Haiman, Z. 2020, ARA&A, 58, 27, doi: 10.1146/annurev-astro-120419-014455
- Jarvis et al. (2021) Jarvis, M. E., Harrison, C. M., Mainieri, V., et al. 2021, MNRAS, 503, 1780, doi: 10.1093/mnras/stab549
- Jiang et al. (2007) Jiang, L., Fan, X., Vestergaard, M., et al. 2007, AJ, 134, 1150, doi: 10.1086/520811
- Jiang et al. (2018) Jiang, L., Wu, J., Bian, F., et al. 2018, Nature Astronomy, 2, 962, doi: 10.1038/s41550-018-0587-9
- Khostovan et al. (2019) Khostovan, A. A., Sobral, D., Mobasher, B., et al. 2019, MNRAS, 489, 555, doi: 10.1093/mnras/stz2149
- Kormendy & Ho (2013) Kormendy, J., & Ho, L. C. 2013, ARA&A, 51, 511, doi: 10.1146/annurev-astro-082708-101811
- Koushiappas et al. (2004) Koushiappas, S. M., Bullock, J. S., & Dekel, A. 2004, MNRAS, 354, 292, doi: 10.1111/j.1365-2966.2004.08190.x
- Kroupa & Boily (2002) Kroupa, P., & Boily, C. M. 2002, MNRAS, 336, 1188, doi: 10.1046/j.1365-8711.2002.05848.x
- Kroupa et al. (2020) Kroupa, P., Subr, L., Jerabkova, T., & Wang, L. 2020, MNRAS, 498, 5652, doi: 10.1093/mnras/staa2276
- Kurk et al. (2007) Kurk, J. D., Walter, F., Fan, X., et al. 2007, ApJ, 669, 32, doi: 10.1086/521596
- Latif et al. (2018) Latif, M. A., Volonteri, M., & Wise, J. H. 2018, MNRAS, 476, 5016, doi: 10.1093/mnras/sty622
- Latimer et al. (2021) Latimer, C. J., Reines, A. E., Bogdan, A., & Kraft, R. 2021, ApJ, 922, L40, doi: 10.3847/2041-8213/ac3af6
- Li et al. (2007) Li, Y., Hernquist, L., Robertson, B., et al. 2007, ApJ, 665, 187, doi: 10.1086/519297
- Lodato & Natarajan (2006) Lodato, G., & Natarajan, P. 2006, MNRAS, 371, 1813, doi: 10.1111/j.1365-2966.2006.10801.x
- Lupi et al. (2021) Lupi, A., Haiman, Z., & Volonteri, M. 2021, MNRAS, 503, 5046, doi: 10.1093/mnras/stab692
- Maggiore et al. (2020) Maggiore, M., Van Den Broeck, C., Bartolo, N., et al. 2020, J. Cosmology Astropart. Phys, 2020, 050, doi: 10.1088/1475-7516/2020/03/050
- Malhotra et al. (2005) Malhotra, S., Rhoads, J. E., Pirzkal, N., et al. 2005, ApJ, 626, 666, doi: 10.1086/430047
- Marinello et al. (2020) Marinello, M., Overzier, R. A., Röttgering, H. J. A., et al. 2020, MNRAS, 492, 1991, doi: 10.1093/mnras/stz3333
- Mazzucchelli et al. (2017) Mazzucchelli, C., Bañados, E., Decarli, R., et al. 2017, ApJ, 834, 83, doi: 10.3847/1538-4357/834/1/83
- Meyer et al. (2020) Meyer, R. A., Kakiichi, K., Bosman, S. E. I., et al. 2020, MNRAS, 494, 1560, doi: 10.1093/mnras/staa746
- Mezcua (2017) Mezcua, M. 2017, International Journal of Modern Physics D, 26, 1730021, doi: 10.1142/S021827181730021X
- Mignoli et al. (2020) Mignoli, M., Gilli, R., Decarli, R., et al. 2020, A&A, 642, L1, doi: 10.1051/0004-6361/202039045
- Momjian et al. (2018) Momjian, E., Carilli, C. L., Bañados, E., Walter, F., & Venemans, B. P. 2018, ApJ, 861, 86, doi: 10.3847/1538-4357/aac76f
- Morselli et al. (2014) Morselli, L., Mignoli, M., Gilli, R., et al. 2014, A&A, 568, A1, doi: 10.1051/0004-6361/201423853
- Mortlock et al. (2011) Mortlock, D. J., Warren, S. J., Venemans, B. P., et al. 2011, Nature, 474, 616, doi: 10.1038/nature10159
- Natarajan et al. (2017) Natarajan, P., Pacucci, F., Ferrara, A., et al. 2017, ApJ, 838, 117, doi: 10.3847/1538-4357/aa6330
- Neeleman et al. (2021) Neeleman, M., Novak, M., Venemans, B. P., et al. 2021, ApJ, 911, 141, doi: 10.3847/1538-4357/abe70f
- O’Dea & Saikia (2021) O’Dea, C. P., & Saikia, D. J. 2021, A&A Rev., 29, 3, doi: 10.1007/s00159-021-00131-w
- Ota et al. (2018) Ota, K., Venemans, B. P., Taniguchi, Y., et al. 2018, ApJ, 856, 109, doi: 10.3847/1538-4357/aab35b
- Ouchi et al. (2005) Ouchi, M., Shimasaku, K., Akiyama, M., et al. 2005, ApJ, 620, L1, doi: 10.1086/428499
- Overzier (2016) Overzier, R. A. 2016, A&A Rev., 24, 14, doi: 10.1007/s00159-016-0100-3
- Overzier et al. (2006a) Overzier, R. A., Bouwens, R. J., Illingworth, G. D., & Franx, M. 2006a, ApJ, 648, L5, doi: 10.1086/507678
- Overzier et al. (2009a) Overzier, R. A., Guo, Q., Kauffmann, G., et al. 2009a, MNRAS, 394, 577, doi: 10.1111/j.1365-2966.2008.14264.x
- Overzier et al. (2006b) Overzier, R. A., Miley, G. K., Bouwens, R. J., et al. 2006b, ApJ, 637, 58, doi: 10.1086/498234
- Overzier et al. (2009b) Overzier, R. A., Shu, X., Zheng, W., et al. 2009b, ApJ, 704, 548, doi: 10.1088/0004-637X/704/1/548
- Pacucci et al. (2016) Pacucci, F., Ferrara, A., Grazian, A., et al. 2016, MNRAS, 459, 1432, doi: 10.1093/mnras/stw725
- Pacucci et al. (2015) Pacucci, F., Ferrara, A., Volonteri, M., & Dubus, G. 2015, MNRAS, 454, 3771, doi: 10.1093/mnras/stv2196
- Pacucci & Loeb (2021) Pacucci, F., & Loeb, A. 2021, MNRAS, doi: 10.1093/mnras/stab3071
- Petric et al. (2003) Petric, A. O., Carilli, C. L., Bertoldi, F., et al. 2003, AJ, 126, 15, doi: 10.1086/375645
- Piana et al. (2021) Piana, O., Dayal, P., Volonteri, M., & Choudhury, T. R. 2021, MNRAS, 500, 2146, doi: 10.1093/mnras/staa3363
- Placco et al. (2021) Placco, V. M., Roederer, I. U., Lee, Y. S., et al. 2021, ApJ, 912, L32, doi: 10.3847/2041-8213/abf93d
- Punturo et al. (2010) Punturo, M., Abernathy, M., Acernese, F., et al. 2010, Classical and Quantum Gravity, 27, 194002, doi: 10.1088/0264-9381/27/19/194002
- Regan et al. (2019) Regan, J. A., Downes, T. P., Volonteri, M., et al. 2019, MNRAS, 486, 3892, doi: 10.1093/mnras/stz1045
- Regan et al. (2017) Regan, J. A., Visbal, E., Wise, J. H., et al. 2017, Nature Astronomy, 1, 0075, doi: 10.1038/s41550-017-0075
- Regan et al. (2020) Regan, J. A., Wise, J. H., O’Shea, B. W., & Norman, M. L. 2020, MNRAS, 492, 3021, doi: 10.1093/mnras/staa035
- Richards et al. (2006) Richards, G. T., Lacy, M., Storrie-Lombardi, L. J., et al. 2006, ApJS, 166, 470, doi: 10.1086/506525
- Riechers et al. (2014) Riechers, D. A., Carilli, C. L., Capak, P. L., et al. 2014, ApJ, 796, 84, doi: 10.1088/0004-637X/796/2/84
- Rojas-Ruiz et al. (2021) Rojas-Ruiz, S., Bañados, E., Neeleman, M., et al. 2021, ApJ, 920, 150, doi: 10.3847/1538-4357/ac1a13
- Saxena et al. (2018) Saxena, A., Marinello, M., Overzier, R. A., et al. 2018, MNRAS, 480, 2733, doi: 10.1093/mnras/sty1996
- Shen et al. (2019) Shen, Y., Wu, J., Jiang, L., et al. 2019, ApJ, 873, 35, doi: 10.3847/1538-4357/ab03d9
- Shibuya et al. (2018) Shibuya, T., Ouchi, M., Konno, A., et al. 2018, PASJ, 70, S14, doi: 10.1093/pasj/psx122
- Shimasaku & Izumi (2019) Shimasaku, K., & Izumi, T. 2019, ApJ, 872, L29, doi: 10.3847/2041-8213/ab053f
- Sijacki et al. (2009) Sijacki, D., Springel, V., & Haehnelt, M. G. 2009, MNRAS, 400, 100, doi: 10.1111/j.1365-2966.2009.15452.x
- Smith et al. (2018) Smith, B. D., Regan, J. A., Downes, T. P., et al. 2018, MNRAS, 480, 3762, doi: 10.1093/mnras/sty2103
- Sobral et al. (2018) Sobral, D., Santos, S., Matthee, J., et al. 2018, MNRAS, 476, 4725, doi: 10.1093/mnras/sty378
- Springel et al. (2005) Springel, V., White, S. D. M., Jenkins, A., et al. 2005, Nature, 435, 629, doi: 10.1038/nature03597
- Stefanon et al. (2021) Stefanon, M., Bouwens, R. J., Labbé, I., et al. 2021, arXiv e-prints, arXiv:2103.16571. https://arxiv.org/abs/2103.16571
- Stern et al. (2003) Stern, D., Hall, P. B., Barrientos, L. F., et al. 2003, ApJ, 596, L39, doi: 10.1086/379206
- Stiavelli et al. (2005) Stiavelli, M., Djorgovski, S. G., Pavlovsky, C., et al. 2005, ApJ, 622, L1, doi: 10.1086/429406
- Straatman et al. (2015) Straatman, C. M. S., Labbé, I., Spitler, L. R., et al. 2015, ApJ, 808, L29, doi: 10.1088/2041-8205/808/1/L29
- Toshikawa et al. (2012) Toshikawa, J., Kashikawa, N., Ota, K., et al. 2012, ApJ, 750, 137, doi: 10.1088/0004-637X/750/2/137
- Toshikawa et al. (2014) Toshikawa, J., Kashikawa, N., Overzier, R., et al. 2014, ApJ, 792, 15, doi: 10.1088/0004-637X/792/1/15
- Toshikawa et al. (2016) —. 2016, ApJ, 826, 114, doi: 10.3847/0004-637X/826/2/114
- Trakhtenbrot et al. (2017) Trakhtenbrot, B., Lira, P., Netzer, H., et al. 2017, Frontiers in Astronomy and Space Sciences, 4, 49, doi: 10.3389/fspas.2017.00049
- Umemura et al. (1993) Umemura, M., Loeb, A., & Turner, E. L. 1993, ApJ, 419, 459, doi: 10.1086/173499
- Utsumi et al. (2010) Utsumi, Y., Goto, T., Kashikawa, N., et al. 2010, ApJ, 721, 1680, doi: 10.1088/0004-637X/721/2/1680
- Venemans et al. (2016) Venemans, B. P., Walter, F., Zschaechner, L., et al. 2016, ApJ, 816, 37, doi: 10.3847/0004-637X/816/1/37
- Venemans et al. (2007) Venemans, B. P., Röttgering, H. J. A., Miley, G. K., et al. 2007, A&A, 461, 823, doi: 10.1051/0004-6361:20053941
- Vestergaard & Osmer (2009) Vestergaard, M., & Osmer, P. S. 2009, ApJ, 699, 800, doi: 10.1088/0004-637X/699/1/800
- Visbal et al. (2014) Visbal, E., Haiman, Z., & Bryan, G. L. 2014, MNRAS, 445, 1056, doi: 10.1093/mnras/stu1794
- Vito et al. (2021) Vito, F., Brandt, W. N., Ricci, F., et al. 2021, A&A, 649, A133, doi: 10.1051/0004-6361/202140399
- Volonteri (2012) Volonteri, M. 2012, Science, 337, 544, doi: 10.1126/science.1220843
- Volonteri et al. (2021) Volonteri, M., Habouzit, M., & Colpi, M. 2021, Nature Reviews Physics, 3, 732, doi: 10.1038/s42254-021-00364-9
- Volonteri & Rees (2005) Volonteri, M., & Rees, M. J. 2005, ApJ, 633, 624, doi: 10.1086/466521
- Wang et al. (2020) Wang, F., Davies, F. B., Yang, J., et al. 2020, ApJ, 896, 23, doi: 10.3847/1538-4357/ab8c45
- Whalen et al. (2021) Whalen, D. J., Mezcua, M., Patrick, S. J., Meiksin, A., & Latif, M. A. 2021, ApJ, 922, L39, doi: 10.3847/2041-8213/ac35e6
- Whalen et al. (2020) Whalen, D. J., Surace, M., Bernhardt, C., et al. 2020, ApJ, 897, L16, doi: 10.3847/2041-8213/ab9d29
- Wise et al. (2019) Wise, J. H., Regan, J. A., O’Shea, B. W., et al. 2019, Nature, 566, 85, doi: 10.1038/s41586-019-0873-4
- Wolf et al. (2021) Wolf, J., Nandra, K., Salvato, M., et al. 2021, A&A, 647, A5, doi: 10.1051/0004-6361/202039724
- Woods et al. (2021a) Woods, T. E., Patrick, S., Elford, J. S., Whalen, D. J., & Heger, A. 2021a, ApJ, 915, 110, doi: 10.3847/1538-4357/abfaf9
- Woods et al. (2021b) Woods, T. E., Willott, C. J., Regan, J. A., et al. 2021b, ApJ, 920, L22, doi: 10.3847/2041-8213/ac2a45
- Woods et al. (2019) Woods, T. E., Agarwal, B., Bromm, V., et al. 2019, PASA, 36, e027, doi: 10.1017/pasa.2019.14
- Wright (2006) Wright, E. L. 2006, PASP, 118, 1711, doi: 10.1086/510102
- Yang et al. (2020) Yang, J., Wang, F., Fan, X., et al. 2020, ApJ, 904, 26, doi: 10.3847/1538-4357/abbc1b
- Yue et al. (2021) Yue, M., Fan, X., Yang, J., & Wang, F. 2021, arXiv e-prints, arXiv:2110.12315. https://arxiv.org/abs/2110.12315
- Zheng et al. (2006) Zheng, W., Overzier, R. A., Bouwens, R. J., et al. 2006, ApJ, 640, 574, doi: 10.1086/500167