Collective dynamics of heavy ion collisions in ATLAS
Helena Santos*, on behalf of the ATLAS Collaboration
Laboratório de Instrumentação e Física Experimental de Partículas, LIP
Av. Prof. Gama Pinto 2, Lisbon, Portugal
* helena@lip.pt
![]() 50th International Symposium on Multiparticle Dynamics
50th International Symposium on Multiparticle Dynamics
(ISMD2021)
12-16 July 2021
10.21468/SciPostPhysProc.?
Copyright 2021 CERN for the benefit of the ATLAS Collaboration. CC-BY-4.0 license.
Abstract
The latest measurements of collective behaviour in a variety of collision systems with the ATLAS detector at the LHC, including collisions at 13 TeV, Xe+Xe collisions at
5.44 TeV, and Pb+Pb collisions at 5.02 TeV, are presented. They include -[] correlations, which carry important information about the initial-state geometry of the
quark-gluon plasma and can shed light on any quadrupole deformation in the Xe nucleus, and measurements of flow decorrelations differential in rapidity, which probe the longitudinal structure of
the colliding system. These measurements furthermore provide stringent tests of the theoretical understanding of the initial state in heavy ion collisions.
1 Introduction
Heavy-ion collisions at the LHC produce the quark-gluon plasma (QGP) whose space-time evolution is described by hydrodynamics[1]. Owing to strong event-by-event density fluctuations in the initial state, the space-time evolution of the QGP also fluctuates event by event. These fluctuations lead to correlations of particle multiplicity in momentum space in both the transverse and longitudinal directions with respect to the collision axis. Studies of particle correlations in the transverse plane reveal strong harmonic modulation of the particle densities in the azimuthal angle, , where and represent the magnitude and event plane angle111The event plane is defined by the beam direction and by the direction of the impact parameter . of the -order azimuthal flow vector .
The Glauber Monte Carlo model[2] is used to obtain a correspondence between the total transverse energy deposited in the ATLAS[3] forward calorimeter (FCal) and the sampling fraction of the total inelastic A+A cross-section, allowing the setting of the centrality percentiles.
2 -[] correlations
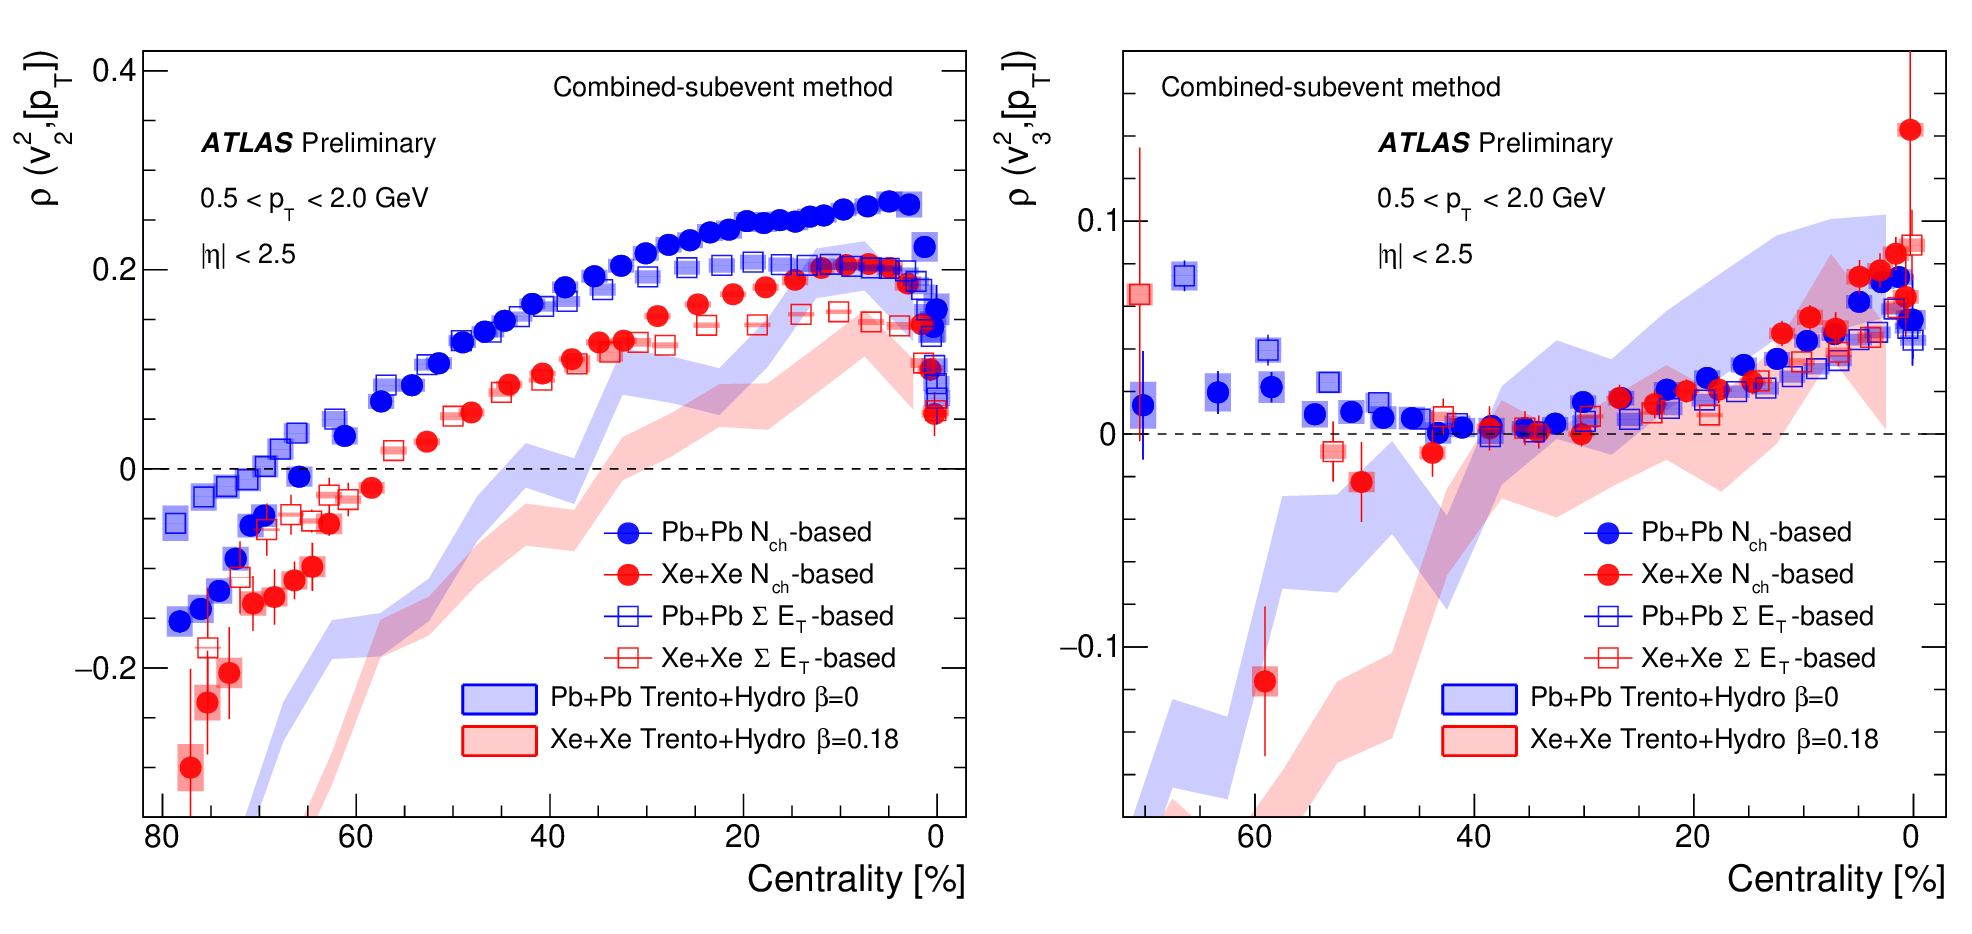
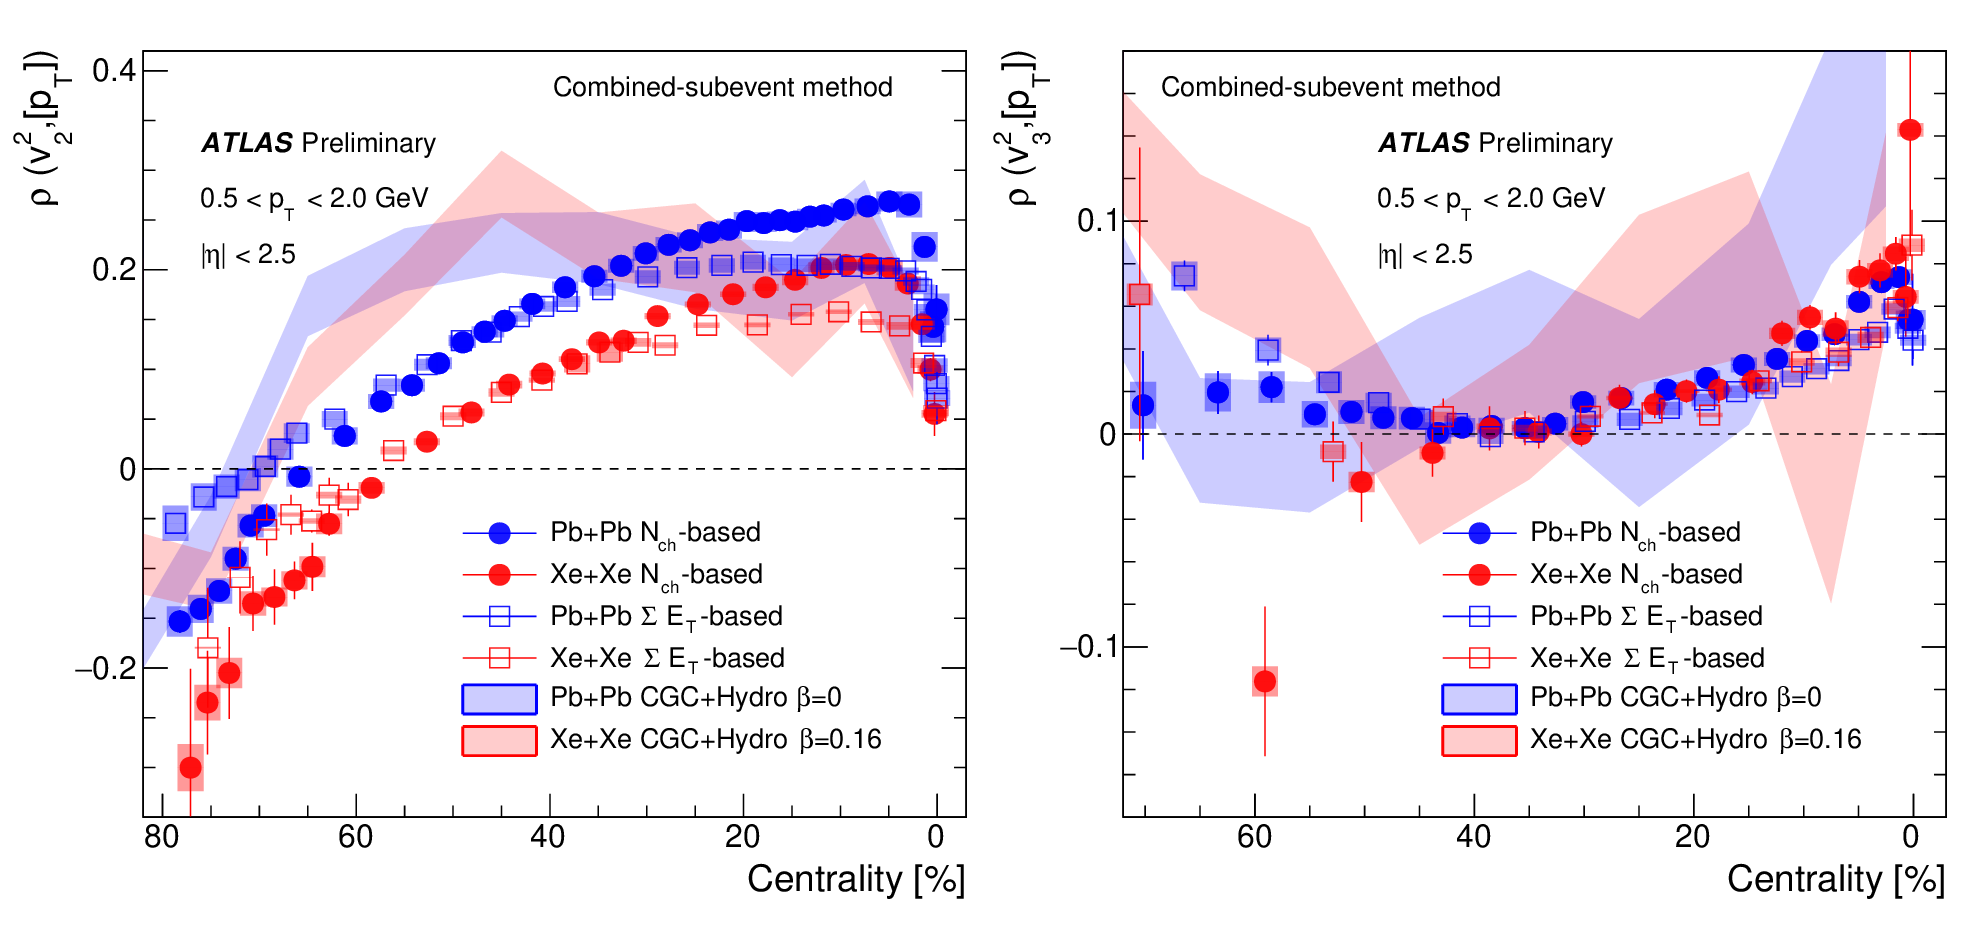
The goal of this measurement is to understand the system size dependence, and in particular the role of the Xe nucleus deformation, through comparisons between Pb+Pb and Xe+Xe collisions results. Model calculations show that are proportional to the eccentricities for = 2, 3, and 4 in central collisions[4]. Correlated fluctuations between the and the system size in the initial state are expected to generate dynamical correlations between and [] in the final state. The correlator , where is the average transverse momentum of particles in each event and is the variance of , is shown in Figure 1. A smaller magnitude of in Xe+Xe collisions is observed in all centrality range and there is a significant difference in the -based and -based (number of reconstructed charged particles and sum of the transverse energy depositions in the FCal, respectively) centrality binning. These systematic differences are much smaller in . The models Trento+Hydro[6] and CGC+Hydro[7] do not capture the trends in the data, either qualitatively or quantitatively. Although the correlations between and [] are sensitive to the nuclear deformations in the initial state, centrality fluctuations need to be taken into account in the understanding of the nuclear deformation effects on the Xe+Xe results[5].
3 Longitudinal decorrelation dynamics
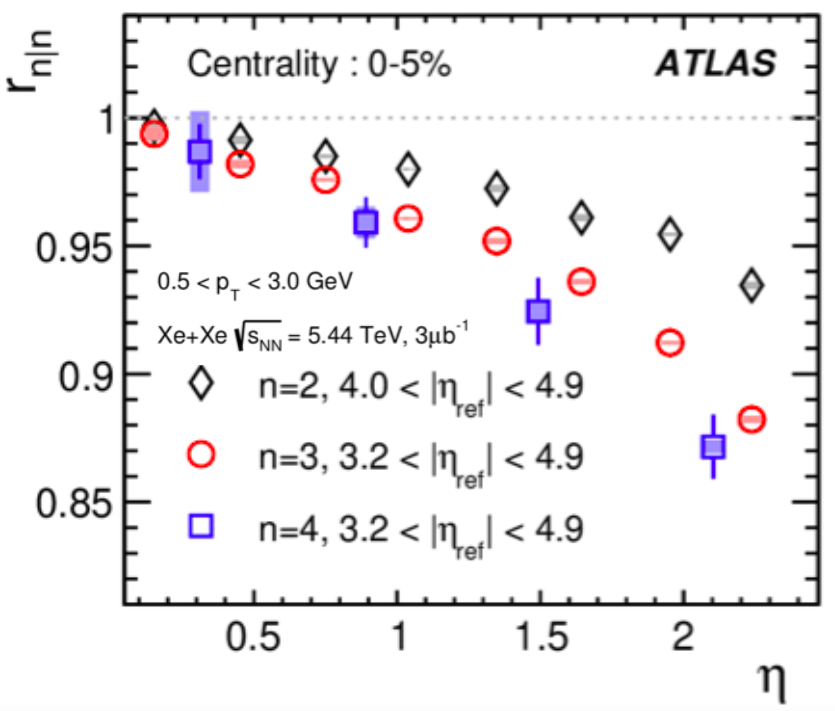
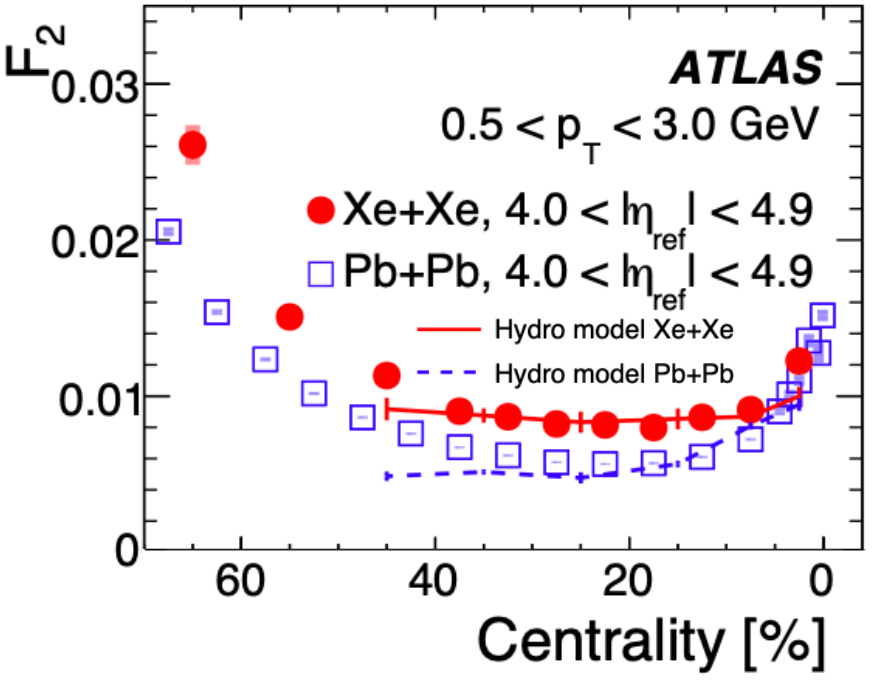
The longitudinal flow decorrelations are studied using the product of the particles weighted flow vectors in the Inner Detector[3] and in the FCal, averaged over events in a given centrality interval. The correlator, which quantifies the decorrelation between and -, and the slope parameter , which is obtained via a simple linear regression of the data, are shown in Figure 2 for Xe+Xe collisions. The > > decrease linearly with and shows a strong centrality dependence, being smallest in the 20–30% centrality interval and larger towards more-central and more-peripheral collisions. This strong centrality dependence is due to the average elliptic geometry in mid-central collisions, which dominates and makes this coefficient less sensitive to decorrelations, while the fluctuation-driven collision geometries dominate in central and peripheral collisions[8].
Funding information
The author acknowledges the financial support of Fundação para a Ciência e a Tecnologia (FCT) through FCT Researcher contracts CEECIND/03346/2017 and CERN/FIS-PAR/0002/2019.
References
- [1] C. Gale, S. Jeon and B. Schenke, Int. J. Mod. Phys. A 28, 1340011 (2013). 10.1142/S0217751X13400113.
- [2] M.L. Miller et al., Ann. R. Nucl. Part. Sci., 57 205 (2007). 10.1146/annurev.nucl.57.090506.123020.
- [3] ATLAS Collaboration, JINST 3, S08003 (2008). 10.1088/1748-0221/3/08/S08003.
- [4] F. G. Gardim, F. Grassi, M. Luzum and J.-Y. Ollitrault, Phys. Rev. C 85, 024908 (2012). 10.1103/PhysRevC.85.024908
- [5] ATLAS Collaboration, https://cds.cern.ch/record/2748818/files/ATLAS-CONF-2021-001.pdf.
- [6] G. Giacalone, https://arxiv.org/abs/2101.00168 [nucl-th].
- [7] G. Giacalone, B. Schenke and C. Shen, Phys. Rev. Lett. 125, 192301 (2020). 10.1103/PhysRevLett.125.192301.
- [8] ATLAS Collaboration, Phys. Rev. Lett. 126, 12230 (2021). 10.1103/PhysRevLett.126.122301.
- [9] X.-Y. Wu, L.-G. Pang, G.-Y. Qin, and X.-N. Wang, Phys. Rev. C 98, 024913 (2018). 10.1103/PhysRevC.98.024913.