declare dimen register=gap, gap’=4mm, declare count register=twist, twist’=1, family tree too/.style= draw, for tree= fill=gray!0, rounded corners=1pt, edge=thick, , where=level()¡(twist)parent anchor=children, draw, folder, grow’=0, if=level()==(twist)before typesetting nodes=child anchor=north, anchor=north, edge path’=(!u.parent anchor) – ++(0,-4pt) -— (.child anchor), if level=2 l sep = 4mm, before computing xy= l/.wrap pgfmath arg=##110pt-((*(gap))/6) , , , ,
Next2You: Robust Copresence Detection Based on Channel State Information
Abstract.
Context-based copresence detection schemes are a necessary prerequisite to building secure and usable authentication systems in the Internet of Things (IoT). Such schemes allow one device to verify proximity of another device without user assistance utilizing their physical context (e.g., audio). The state-of-the-art copresence detection schemes suffer from two major limitations: (1) they cannot accurately detect copresence in low-entropy context (e.g., empty room with few events occurring) and insufficiently separated environments (e.g., adjacent rooms), (2) they require devices to have common sensors (e.g., microphones) to capture context, making them impractical on devices with heterogeneous sensors. We address these limitations, proposing Next2You, a novel copresence detection scheme utilizing channel state information (CSI). In particular, we leverage magnitude and phase values from a range of subcarriers specifying a Wi-Fi channel to capture a robust wireless context created when devices communicate. We implement Next2You on off-the-shelf smartphones relying only on ubiquitous Wi-Fi chipsets and evaluate it based on over 95 hours of CSI measurements that we collect in five real-world scenarios. Next2You achieves error rates below 4%, maintaining accurate copresence detection both in low-entropy context and insufficiently separated environments. We also demonstrate the capability of Next2You to work reliably in real-time and its robustness to various attacks.
1. Introduction
The proliferation of the Internet of Things (IoT) urges the need for authentication systems that are both secure and usable. Copresence detection is a necessary prerequisite to zero-interaction authentication (ZIA)—a technique that allows one device to authenticate another based on their physical proximity. Specifically, copresence detection is used to mitigate relay attacks (Truong et al., 2014; Shrestha et al., 2014; Truong et al., 2019) or serve as a second authentication factor (Marforio et al., 2014; Mare et al., 2014; Karapanos et al., 2015), providing improved usability by minimizing user interaction. To achieve this, copresence detection schemes utilize devices’ context, which is represented as a set of sensor modalities (e.g., audio, signal strength) collected by devices from their ambient environment, hence they are known as context-based (Truong et al., 2019; Han et al., 2018; Fomichev et al., 2019). In addition to usability, context-based schemes have two extra advantages compared to user-assisted copresence detection methods (e.g., entering a verification code) (Han et al., 2018; Fomichev et al., 2019). First, they scale better to an ever-growing number of devices, including those that lack user interfaces. Second, context-based schemes rely on existing sensing capabilities of IoT devices, without requiring any established infrastructure (e.g., PKI) or dedicated hardware (e.g., NFC), facilitating interoperability (Fomichev et al., 2019; Karapanos et al., 2015).
The rationale for context-based copresence detection is that copresent devices, located inside an enclosed physical space (e.g., a room), will perceive similar context compared to devices outside this space. Hence, the security of such schemes relies on the unpredictability of the shared context, which depends on the intensity and variety of ambient activity such as sound or motion happening in the environment. To date, a number of context-based copresence detection schemes utilizing different sensor modalities have been proposed (Halevi et al., 2012; Truong et al., 2014; Mare et al., 2014; Shrestha et al., 2014; Karapanos et al., 2015; Shepherd et al., 2017; Truong et al., 2019; Shrestha et al., 2019). Some schemes are already used in commercial products such as Futurae Authentication (Futurae Technologies AG, 2019) and Apple Auto Unlock (Stute et al., 2018), making their security and utility crucial for real-world applications. However, these state-of-the-art schemes have two major limitations. First, they show reduced copresence detection accuracy, hence lower security, in the cases of low-entropy context (e.g., empty room with few events occurring) and insufficiently separated environments (e.g., adjacent rooms). In the first case, the context becomes predictable allowing the adversary to guess or manipulate it in a controlled manner (Fomichev et al., 2019; Shrestha et al., 2016). In the second case, close environments partly share the context (e.g., loud sound), confusing copresence detection if several devices start it simultaneously (Stute et al., 2019; Fomichev et al., 2019). Second, the state-of-the-art context-based schemes require devices to be equipped with common sensors such as microphones, limiting their utility, because many IoT devices have only a single sensor (e.g., power meter) (Han et al., 2018).
The above two limitations impair security and utility of context-based copresence detection schemes, hindering their adoption in the IoT. We address these limitations proposing Next2You, a novel copresence detection scheme based on channel state information (CSI). Figure 1 shows the design space of Next2You in comparison to state-of-the-art schemes. Specifically, Next2You has higher security, achieving accurate copresence detection in low-entropy context and insufficiently separated environments, and is deployable on devices with heterogeneous sensors, while performing similarly in terms of completion time and distance at which copresence detection is viable.
To the best of our knowledge, we are the first to demonstrate the feasibility of copresence detection based on CSI, leveraging its two advantages. First, CSI is mandatory information generated when Wi-Fi enabled devices communicate. The ubiquity of Wi-Fi in IoT devices (Twain, 2019) and increasing CSI availability in them (Halperin et al., 2011; Xie et al., 2015; Schulz et al., 2017) allow Next2You to run on devices that do not have common sensors but are equipped with Wi-Fi (e.g., a laptop and smart plug). Second, CSI is known to be location-sensitive, capturing variation of a wireless channel, which is affected by distance between devices, geometry and materials of surroundings (e.g., walls) as well as wireless spectrum busyness and mobility (Xi et al., 2016; Ma et al., 2019). Prior work has extensively utilized CSI for indoor device localization, including security-focused solutions (Xiong and Jamieson, 2013b; Fang et al., 2014, 2016). In Section 2, we review indoor localization schemes, showing their fundamental differences with Next2You in terms of purpose and operation (e.g., infrastructure- vs. ad hoc-based). Also, the assumptions made by many of these schemes are unrealistic for the IoT, namely they presume that devices have multiple antennas, significant processing power, and tight time synchronization, being able to capture hundreds of CSI measurements per second. Our goal is different, as we aim to detect copresence (e.g., if devices are in the same room) and not precise location. This is challenging because we need to obtain common CSI features for copresent devices within the same environment, ensuring that such features are distinctive among non-copresent devices in different environments. In addition, we evaluate Next2You on smartphones and the Raspberry Pi which have hardware typical of IoT devices (e.g., portable, one antenna), assuming realistic conditions such as loose time synchronization between devices and a few CSI measurements per second. Apart from ZIA, Next2You can enhance physical layer security by enabling a covert channel between colocated devices (Schulz et al., 2018) or be adapted for user or object occupancy detection (Gringoli et al., 2019; Zhu et al., 2020).
To achieve our goal, we propose using CSI magnitude and phase values in a neural network to capture robust wireless context commonly observed by copresent devices. We design the network such that it not only automatically learns relevant copresence features, which we corroborate with prior research, but also enables generalizability and high performance of Next2You. To demonstrate the effectiveness of Next2You, we collect CSI data in five real-world scenarios, including a busy office, an urban apartment, a rural house as well as parked and moving cars, resulting in over 95 hours of CSI measurements. We show that Next2You provides reliable copresence detection with error rates below 4% in both 2.4 GHz and 5 GHz frequency bands, and it is capable of running on off-the-shelf smartphones in real-time. Next2You maintains accurate copresence detection in challenging cases of low-entropy context and insufficiently separated environments. Through our real-world experiments, we demonstrate the robustness of Next2You copresence detection, its ability to generalize to new application scenarios, and its resilience to attacks.
In summary, we make the following contributions:
-
•
We design Next2You, a novel copresence detection scheme that combines CSI and neural networks, justifying their mutual suitability for copresence detection.
-
•
We collect a real-world dataset of CSI in five scenarios using off-the-shelf smartphones.
-
•
We implement Next2You and evaluate it based on the collected data, demonstrating its accurate copresence detection, considering different frequency bands, heterogeneous devices, and attack scenarios. We also show the capability of Next2You to work reliably in real-time.
-
•
We publicly release the collected dataset as well as the source code of our CSI data collection app, evaluation stack, and Next2You prototype.
2. Background and Related Work
In this section, we explain how context-based copresence detection works and review existing schemes, demonstrating the advantages of Next2You.
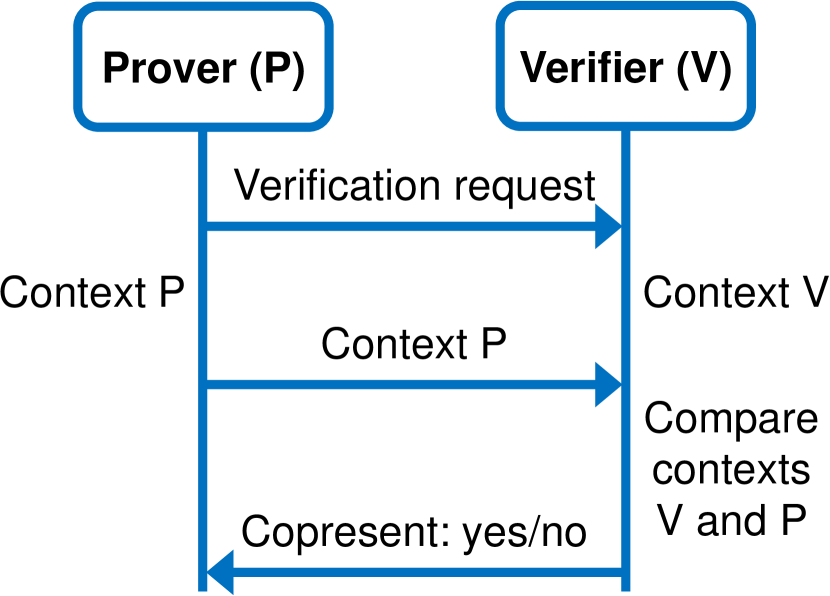
Background. The goal of context-based copresence detection is to determine without the need of infrastructure (e.g., access point (AP)) whether two devices reside inside the same enclosed space (e.g., room or car). The two devices involved in the copresence detection task are called a prover and verifier, where the former tries to proof its physical proximity to the latter as follows (cf. Figure 3).
First, the prover sends a copresence verification request to the verifier over a wireless channel such as Bluetooth. Second, both devices capture their context using available sensors for a predefined timeframe (e.g., 10 seconds). Third, the prover transmits its context readings to the verifier over the wireless channel. This channel is secured by means of a shared key, thus the context readings are encrypted and authenticated, protecting them from adversaries.
Such a shared key is assumed to be priorly established between the prover and verifier (e.g., via secure pairing (Fomichev et al., 2018; Putz et al., 2020)).
Fourth, the verifier compares its context readings with the ones sent by the prover and decides if they are copresent.
To compare context readings, the verifier can either use similarity metrics (e.g., cross-correlation) and check them against the set thresholds (Karapanos et al., 2015; Halevi et al., 2012; Shepherd et al., 2017) or compute features from context readings (e.g., median) and input them to a trained machine learning classifier (Truong et al., 2014; Mare et al., 2014; Shrestha et al., 2014; Truong et al., 2019; Shrestha et al., 2019).
Related Work: Copresence Detection.
To date, a number of context-based copresence detection schemes relying on various sensor modalities, including audio, radio signal strength, GPS as well as inertial measurement unit (IMU) (e.g., accelerometer, gyroscope) and environmental sensors (e.g., thermometer, barometer) have been proposed (Halevi et al., 2012; Truong et al., 2014; Mare et al., 2014; Shrestha et al., 2014; Karapanos et al., 2015; Shepherd et al., 2017; Truong et al., 2019; Shrestha et al., 2019).
Their details can be found in the survey by Conti and Lal (Conti and Lal, 2019).
The existing schemes require devices to have common sensors such as microphones, limiting their applicability, whereas Next2You only needs a Wi-Fi chipset, which is ubiquitous in IoT devices.
Recent works demonstrate that existing schemes have reduced copresence detection accuracy, hence lower security, in low-entropy context (e.g., empty room with few events occurring) and insufficiently separated environments (e.g., adjacent rooms) (Shrestha et al., 2018; Fomichev et al., 2019; Truong et al., 2019).
Specifically, Fomichev et al. (Fomichev et al., 2019) reproduce three state-of-the-art schemes, showing their vulnerability to the above threats using real-world data.
Similarly, Shrestha et al. (Shrestha et al., 2018) present successful context injection by a nearby adversary utilizing off-the-shelf home appliances.
Truong et al. (Truong et al., 2019) perform an efficient context manipulation attack, rendering their previous copresence detection scheme (Truong et al., 2014) insecure.
The aforementioned issues reveal an open challenge of accomplishing secure copresence detection without the need of shared sensors, which has motivated our scheme Next2You.
In Section 6, we demonstrate that Next2You achieves accurate copresence detection in low-entropy context and insufficiently separated environments, mitigating the corresponding attacks and outperforming state-of-the-art copresence detection schemes.
Related Work: Indoor Device Localization. In contrast to copresence detection, indoor localization assumes the availability of infrastructure, where the goal is to find either fine- or coarse-grained location of devices111Fine-grained localization is considered to have submeter accuracy, while coarse-grained localization can have room-level precision (i.e., a device is located in room A or B) (Yang et al., 2013). given a reference point (e.g., wireless router); indoor device localization schemes utilizing various sensor modalities are surveyed by Xiao et al. (Xiao et al., 2016).
However, we consider only those schemes that are based on wireless signals to enable a meaningful comparison with Next2You.
Figure 3 shows that the majority of proposed indoor localization schemes require infrastructure such as an AP to operate, while existing ad hoc localization methods are mostly theoretical, still assuming the presence of trusted anchors (Abouzar et al., 2016). Prior works rely on received signal strength (RSS) (Feng et al., 2011), CSI (Wang et al., 2016; Wu et al., 2012), time of arrival (ToA) (Pérez-Cruz et al., 2019), time difference of arrival (TDoA) (Niitsoo et al., 2018), or angle of arrival (AoA) (Xiong and Jamieson, 2013a) to achieve device localization. Specifically, for a device to be localized, it is required to (1) record RSS, CSI, ToA/ TDoA, or AoA from multiple APs in its vicinity (i.e., 3–30) at 10–100 measurements per second, (2) often have the line of sight with these APs, and (3), in the case of ToA/ TDoA or AoA, be equipped with multiple antennas. Moreover, many of these schemes rely on either dedicated bulky hardware (e.g., software defined radios), requiring calibration, or they need heavy post-processing and filtering of the data to accurately estimate CSI, compensating for hardware imperfections, which are native to wireless chipsets in off-the-shelf devices. The above requirements (i.e., many measurements per second, multiple antennas, heavy data processing) are excessive for the majority of IoT devices, and existing localization schemes cannot be used in environments with few ambient APs such in vehicular or rural settings. On the contrary, Next2You can work on simple devices with a single antenna requiring only 2–3 CSI measurements per second, that do not need heavy post-processing, and without any infrastructure such as APs (cf. Table 1).
{forest} family tree too, [Wireless signals, l sep = 3mm, s sep = 2mm [Indoor localization, l=3mm, s sep = 2mm, l sep = 0mm [Infrastructure-based, l=2mm, s sep = 0.3mm [ RSS (Feng et al., 2011), draw=none] [ CSI (Wang et al., 2016; Wu et al., 2012), draw=none] [ ToA (Pérez-Cruz et al., 2019) TDoA (Niitsoo et al., 2018) AoA (Xiong and Jamieson, 2013a) , draw=none] ] [Ad-hoc, l=2mm, s sep = 0.3mm [ RSS (Abouzar et al., 2016), draw=none] ] ] [Copresence detection, l=3mm, s sep = 2mm, l sep = 0mm [Infrastructure-based, l=2mm, s sep = 0.3mm [ RSS (Agata et al., 2015, 2016), draw=none] ] [Ad-hoc, l=2mm, s sep = 0.3mm [ CSI (Next2You), draw=none] ] ] ]
Leveraging on the rich literature on device localization, infrastructure-based copresence
detection schemes utilizing RSS have also been proposed (Agata et al., 2015, 2016).
However, the applicability of these schemes is limited due to the strong assumption on the infrastructure availability.
Practicality of RSS for Localization and Copresence Detection.
Despite being a simple measurement and available on many devices, RSS is known to be inaccurate and unstable, especially in complex environments with many obstacles and human/object motion, hindering reliable indoor localization (Yang et al., 2013; Wang et al., 2016; Wu et al., 2012).
This finding is also confirmed by Fomichev et al. (Fomichev et al., 2019) for the copresence detection scheme by Truong et al. (Truong et al., 2014), which uses the RSS measurements of ambient Wi-Fi APs and Bluetooth devices.
Specifically, they demonstrate that RSS has low relevance for copresence detection222A possible explanation for this result is that RSS can be regarded as a single measurement obtained from the high-dimensional CSI, thus incurring in information loss. not only in environments with scarce APs and Bluetooth devices (e.g., parking lot) but also in a busy office, where many APs and Bluetooth devices exist but the environment is complex.
Similarly, Zhu et al. (Zhu et al., 2020) shows that using a single-antenna smartphone requires multiple rounds of RSS measurements and significant processing to ensure their quality in order to achieve satisfactory indoor localization accuracy.
Furthermore, since RSS represents the power of the received signal, attacking any
localization or copresence detection scheme becomes trivial by simply increasing the power of adversarial devices. This threat is not considered by the existing schemes but is shown to be feasible by Zhu et al. (Zhu et al., 2020) using off-the-shelf hardware.
Next2You, on the other hand, is only limitedly affected by the increased power attack, as we demonstrate in Section 6.5.
Related Work: Other CSI Applications.
Other works utilize CSI for more elaborate tasks than copresence detection like user identification/authentication (Shi et al., 2017) or even imaging (Huang et al., 2014), which can be repurposed to detect copresence.
However, these techniques impose even higher requirements in terms of CSI measurements per second (e.g., up to 1000), number of antennas, calibration, and complexity of the data processing than the indoor localization schemes described above.
Thus, it is unlikely that such techniques can be practically used on IoT devices for copresence detection.
In summary, Next2You stands in contrast to the above copresence detection, indoor localization, and other CSI-based schemes being the first ad hoc copresence detection scheme that utilizes CSI, imposing minimum requirements (e.g., few CSI measurements per second, single antenna) on devices executing Next2You and addressing advanced attacks such as an increased power attack.
| Approach | Number of APs | CSI measurements per second | Number of antennas | Line-of-sight transmission | Processing overhead |
| Localization | 3–30 | 10–100 | Multiple | Often yes | Medium–high |
| Next2You | 0 | 2–3 | One | No | Low |
3. System and Threat Models
In this section, we present our system model, describing the goal, requirements, and assumptions of Next2You as well as our threat model, detailing adversary’s goal and capabilities.
System Model.
The main goal of Next2You is for one device (prover) to prove its copresence within a trusted boundary (e.g., inside a room) to another device (verifier) using their context.
We design Next2You to fulfill the following requirements: (1) be free of user interaction (usability), (2) provide reliable copresence detection in low-entropy contexts and insufficiently separated environments (robustness), and (3) work on off-the-shelf devices such as smartphones equipped only with a Wi-Fi chipset (deployability).
To achieve the set goal while satisfying the requirements, we make the following assumptions: (1) the prover
can send Wi-Fi frames to the verifier, which extracts CSI upon frame reception, (2) the prover and verifier share a secret key, allowing the verifier to ensure frame origin, mitigating replay attacks (e.g., by using a random nonce encrypted with a shared key).
Threat Model.
The goal of the adversary is to convince the verifier that they are copresent, while not being located within the trusted boundary. Specifically, the adversary aims to either impersonate a legitimate prover or launch a relay attack, where a pair of colluding adversaries forward messages between the prover and verifier.
We assume that the adversary can neither compromise the verifier or legitimate prover nor break the encryption between them.
However, the adversary fully controls the wireless channel (i.e., can drop, modify, or replay frames) and uses the following capabilities to achieve their goal.
In the first case (passive attack), the adversary located outside the trusted boundary sends Wi-Fi frames to the verifier, triggering CSI extraction.
The adversary is equipped with similar off-the-shelf hardware (e.g., smartphones) to the prover’s, thus they can stealthily deploy their devices right outside the trusted boundaries (e.g., in the adjacent office), increasing the attack surface (Zhu et al., 2020).
In addition, the adversary can move their devices along the perimeter of the trusted boundary and stay there for a prolonged time, including periods of low-entropy context (e.g., adjacent offices at night).
In the second case (active attack), the adversary has all the capabilities as in the passive attack and can additionally manipulate transmission of Wi-Fi frames such as sending frames of different types or increasing transmission power, aiming to match their CSI with that of legitimate devices inside the trusted boundaries.
We consider adversaries copresent with legitimate devices (e.g., within the same room) to be outside the scope of this work. Prior research shows that for audio such attacks can be mitigated, however, it limits copresence detection to distances below half a meter apart (Truong et al., 2019). In the case of CSI, a pairing scheme exhibits a similar trade-off: pairing devices must be no further than a few centimeters apart if the adversary is copresent (Xi et al., 2016).
4. System Design
In this section, we first explain the rationale for using CSI together with neural networks for copresence detection and then present the architecture of Next2You, describing its modules: data collection, data processing, and copresence decision-making.
4.1. System Overview
The main goal of Next2You is to allow the prover device to confirm its copresence to the verifier device. We consider the following use cases of Next2You: it determines copresence of devices located inside the same room or car. Such use cases are typical in the IoT, for example, in a smart home, devices are often moved between different rooms (e.g., smart lamp). Once the relocated device is deployed, the room’s smart hub can automatically provide access to the local subnetwork based on copresence. Similarly, in a connected car, passengers’ smartphones can seamlessly share content with the infotainment system due to their copresence.
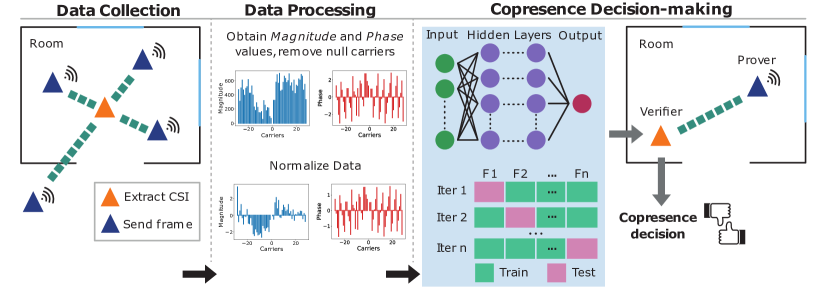
Next2You achieves copresence detection in three steps (cf. Figure 4). First, the data collection module allows the verifier to obtain representative CSI data collected by multiple devices at different spots inside a room or car. This is feasible because the number of IoT devices already reaches roughly a dozen per household (Aviva, 2020), increasing to hundreds in few years (Han et al., 2018), thus each room in a smart home will be densely covered by distributed IoT devices; the same trend is observed for connected cars (Shuman, 2019). Second, the data processing module converts the collected CSI data into magnitude and phase values of Wi-Fi subcarriers, removes irrelevant values, and performs data normalization. Third, the processed CSI data is input to the copresence decision-making module to train and validate a neural network model that is deployed on the verifier. Afterwards, the prover wishing to confirm its copresence sends a number of Wi-Fi frames to the verifier, which extracts CSI data upon frame reception, processes it as described above, and inputs the processed CSI to the trained neural network model that outputs a copresence decision.
4.2. Rationale for Using CSI and Neural Networks for Copresence Detection
In the following, we (1) justify the suitability of CSI for copresence detection, (2) rationalize why neural networks can best leverage location-sensitive properties of CSI to detect copresence, and (3) motivate the choice of Wi-Fi standards that we use for Next2You experimentation.
CSI as a Copresence Feature.
We demonstrate that CSI is useful for copresence detection because of two reasons. First, it provides a discretized frequency-domain representation of the channel impulse response (CIR), which captures a wireless fingerprint of an environment (e.g., a room) in terms of path-loss, fading, reflections, and scattering of the wireless channel (Ma et al., 2019).
Second, CSI is the default information generated when two Wi-Fi devices communicate, and it becomes increasingly available in off-the-shelf devices such as routers, laptops, and smartphones (cf. Section 7).
In the following, we provide an expression relating CSI and CIR via a linear transform, demonstrating that the former indirectly measures the latter, and thus captures a wireless fingerprint of an environment.
A signal propagating through an environment such as a room experiences changes that are distinctive to physical characteristics of the surroundings. Such changes—observed as magnitude and phase variations—characterize the communication channel, capturing geometry of the environment, distribution of objects within, and nature of the materials. Mathematically, the communication channel between a transmitter and receiver is represented by the CIR, which models the overall effect of reflectors, absorbers, path-loss, and complexity of the environment between them. 5(a) shows an example of two devices communicating inside the same room that we use for our explanation. We denote the continuous-time CIR of an -path baseband wireless communication channel as:
| (1) |
In Equation 1, is the Dirac delta function representing a delayed multi-path replica of the transmitted signal arriving at time with power . In particular, , where and denote the amplitude and phase of the -th replica, as shown in 5(a) and 5(b). We note that fully describes the communication channel between the transmitter and receiver. Nevertheless, there exist technical challenges in the wireless communication chain that hinder its accurate acquisition. Specifically, limitations in the sampling frequency and bandwidth incur in information loss, thereby preventing accurate knowledge of . As a result, only a surrogate version of the CIR can be obtained, which is expressed as:
| (2) |
Note that the discrete-time CIR in Equation 2 is a sampled version of the ideal continuous-time CIR in Equation 1. In particular, represents the time resolution (i.e., spacing in seconds between samples), which is inversely proportional to the channel bandwidth . If all are multiples of then and become equivalent. Otherwise, if some is not a multiple of , the energy of that element spreads across all the elements (i.e., energy leakage) owing to oscillations of the sampling function , which produce artificial small-valued samples, as depicted in 5(c). In general, due to sampling and bandwidth limitations, energy leakage inevitably occurs among the samples of . Thus, a more realistic representation of the measured CIR is given by:
| (3) |
Here, all are multiples of , and represents a discrete-time distorted version of , which may not only include perturbations due to sampling and bandwidth limitations but also due to amplitude quantization. We see that in 5(c) has prominent paths similarly to except for the additional spurious small-valued samples. Although cannot be completely captured, due to the reasons stated above, there is still valuable information in , which approximately describes the propagation environment. Thus, using CIR (or more precisely ) for copresence detection is a sound strategy. However, in the case of Wi-Fi that uses OFDM, the CIR is not readily available. Instead, every Wi-Fi device measures CSI, as it is required for channel estimation and equalization. Fortunately, in OFDM systems, CSI and CIR are related by a bijective mapping through the discrete Fourier transform (DFT) matrix (cf. Equation 4). It means that the matrix is invertible, ensuring one-to-one correspondence between CIR and CSI. Thus, for a given CSI measurement of a Wi-Fi frame with subcarriers, the resulting CIR is unique, and vice versa.
| (4) |
The CSI at the -th subcarrier is defined as , showing that the CSI at every subcarrier is a linear combination of all CIR elements.
While computing the CIR is possible, it requires additional processing (i.e., inverse discrete Fourier transform), which will be computationally expensive on commodity devices.
In contrast, CSI is inherently computed by every Wi-Fi device, capturing the same characteristics of the environment as the CIR.
Neural Networks: Leveraging CSI for Copresence Detection.
Despite capturing distinct characteristics of an environment (e.g., a room), CSI is sensitive to changes within such as motion and relocation of obstacles (Ma et al., 2019; Shi et al., 2017; Zhu et al., 2020).
To enable copresence detection, we need to obtain unique features of the environment embedded in CSI, ensuring their robustness to insignificant changes.
Hence, we require a technique that can accurately approximate data, capturing its distinct features but tolerating certain noise.
To the best of our knowledge, neural networks best fulfill this purpose, in addition to their other advantages (cf. Section 4.5).
We find that two points need to be considered to leverage CSI by neural networks for copresence detection.
First, CSI captures characteristics of the environment from the viewpoint of a transmitter-receiver pair, thus we need to provide a neural network with CSI observations from different spots inside the environment to obtain its general picture.
Collecting CSI in multiple spots is feasible due to the growing number of IoT devices equipped with Wi-Fi (cf. Section 4.1).
Second, for copresence detection, manually computed features from CSI frequently used by prior work (e.g., mean, power) (Ma et al., 2019) perform worse in the neural network than raw magnitude and phase values.
This happens because prior works engineer features capturing subtle CSI variations to detect a specific location, human, or activity.
Such features inevitably reduce the amount of useful information in CSI, hindering the generalization capability of neural networks.
The feature computation requires extra processing and more CSI data, and it prevents the representation and transfer learning provided by neural networks (cf. Section 4.5).
We design Next2You guided by the above two points, demonstrating the capability of our neural network to utilize the rich environment information embedded in CSI to automatically learn robust copresence features (cf. Section 6.4).
Wi-Fi Standards Used in Next2You.
To demonstrate the practicality of Next2You, we utilize IEEE 802.11n (at 2.4 GHz) and IEEE 802.11ac (at 5 GHz) Wi-Fi standards.
We choose them because of their favorable characteristics (described next) and ubiquity in various devices, ranging from simple sensors to powerful routers.
First, the lower carrier frequency of 2.4 GHz in IEEE 802.11n enables communication between distant devices due to its robustness to path-loss and blockage.
In contrast, the higher carrier frequency of 5 GHz in IEEE 802.11ac makes it more vulnerable to such phenomena but allows capturing subtle details of the environment due to its shorter wavelength.
Second, the narrower channel bandwidth of IEEE 802.11n (i.e., 20 MHz and 40 MHz) reduces the circuity requirements (e.g., 64-point and 128-point FFT chipsets), making it suitable for low-power IoT devices.
In contrast, the broader channel bandwidth of IEEE 802.11ac (i.e., up to 160 MHz) requires more expensive chipsets (e.g., 512-point FFT chipsets) but provides higher data rates for end-user devices such as laptops.
4.3. Data Collection
To obtain a realistic CSI dataset in an environment such as a room, we collect CSI from several copresent devices located inside it at different spots (e.g., on a desk, window sill), varying in terms of nearby obstacles and height above the floor. Similarly, we deploy a number of non-copresent devices outside the environment such as in an adjacent room, collecting CSI data from them as well. Thus, we obtain positive and negative copresence samples in comparable environments that are nearby. This allows a neural network to learn features that are common for copresent and distinct for non-copresent devices, considering the proximate environments. Both copresent and non-copresent devices are fixed, however, we introduce dynamics to their environments by having people within, who frequently move, change position of obstacles (e.g., relocate a chair, open a door), and use other Wi-Fi devices such as laptops and APs. The data collection is finished when a copresent device in each spot have recorded CSI data from other copresent devices and all non-copresent devices for several minutes.
4.4. Data Processing
We convert the raw CSI of a Wi-Fi frame to magnitude and phase shift values. Specifically, the magnitude and phase of the CSI at the subcarrier (denoted by ), are given by modulus and argument, as shown in Equation 5.
| (5) |
Here, and are the real and imaginary parts of . The number of subcarriers depends on the Wi-Fi channel bandwidth. For example, the 20 MHz channel in 802.11n consists of 64 subcarriers, resulting in 128 magnitude and phase values. In Next2You, we consider all subcarriers of a Wi-Fi channel in order to obtain a finer-grained wireless fingerprint of an environment (e.g., a room) captured by CSI. For example, similar to Shi et al. (Shi et al., 2017), we find that some subcarriers are more susceptible to noise than others with no discernible pattern observed. Such noise susceptibility might be distinctive to the environment, indicating a specific interference behavior. However, not all subcarriers provide meaningful CSI, namely null subcarriers, which do not carry any information (Gawłowicz et al., 2020). Thus, we remove magnitude and phase values of such subcarriers from our data. We normalize the computed magnitude and phase values to have the same range, making them suitable to train a machine learning classifier on. The structure of the processed CSI dataset is arranged in a matrix , as shown in Figure 6, where is the dimension of the feature vector for every measurement , is the number of useful subcarriers, while and denote the magnitude and phase of the -th subcarrier in the -th measurement.
4.5. Copresence Decision-making
To capture a wireless fingerprint commonly observed by copresent devices inside the same environment (e.g., a room), we input the processed CSI data to a machine learning classifier. Differently from existing copresence detection schemes utilizing machine learning (Halevi et al., 2012; Truong et al., 2014; Mare et al., 2014; Shrestha et al., 2014; Shepherd et al., 2017; Truong et al., 2019; Shrestha et al., 2019), we choose to use neural networks for the following reasons. First, neural networks under mild assumptions are universal function approximators, thus they have the potential for representing the classification function we are interested in learning (Hornik et al., 1989; Lu et al., 2017; Sonoda and Murata, 2017). Second, neural networks allow representation learning (Goodfellow et al., 2016), which replaces the manual feature engineering process, simplifying the modeling assumptions, saving time, and increasing accuracy. The prior work on wireless signal classification demonstrates that neural networks are capable of learning the right representation for this domain, producing high predictive accuracy results (Shi et al., 2019; O’Shea et al., 2018; Matuszewski and Sikorska-Łukasiewicz, 2017; Hauser et al., 2017). Third, the representation learning of neural networks enables transfer learning (Tan et al., 2018), where we can reuse the representation learned in one problem and embed it into the solution of another. This has become a standard practice in the deep learning community, where big networks are trained on massive amounts of data. Such pretrained networks are publicly shared with other researchers and practitioners who adapt them to new tasks without training from scratch, significantly lowering the computational costs. In Section 6.3, we leverage the capability for representation and transfer learning to demonstrate that our neural network can be adapted to new environments while reducing computational costs, making model training in Next2You feasible on battery-powered devices. Fourth, numerous deep learning frameworks, support for different devices, and constant improvements in neural networks facilitate the deployment of Next2You.
5. Implementation
In this section, we provide the implementation details of our CSI collector, copresence decision-making module, and Next2You prototype.
5.1. CSI Collector
For data collection, we develop an Android app, utilizing the Nexmon framework (Schulz et al., 2017) to extract CSI. Nexmon allows modifying the firmware of Broadcom Wi-Fi chipsets of Nexus 5 and Nexus 6P smartphones. We customize the original CSI-extractor (Schulz et al., 2018) to our needs, allowing us to conduct experiments with both Nexus 5 and Nexus 6P devices.
Our app works in two modes: the prover and verifier. The former broadcasts Wi-Fi frames at a predefined rate, while the latter listens for these frames, extracting CSI upon frame reception and storing it on a smartphone. The app allows CSI collection in both 2.4 GHz and 5 GHz Wi-Fi bands. As input, the number and bandwidth of a Wi-Fi channel on which the prover and verifier communicate needs to be provided. We experiment with a number of Wi-Fi channels in both frequency bands using two criteria: (1) the stability of CSI collection and (2) maximum transmission range. We find that many channels in the 2.4 GHz band vary significantly in terms of CSI collection stability, while the 5 GHz channels show a wide spread of transmission ranges. Our results obtained in various environments demonstrate that the channel 1 (20 MHz bandwidth, 2.4 GHz band) and channel 157 (80 MHz bandwidth, 5 GHz band) best satisfy the above criteria, thus we use them to collect CSI data in our experiments. With these channels, we obtain 128 and 510 magnitude and phase values from a single CSI measurement for 2.4 GHz and 5 GHz bands, respectively, which corresponds to using all subscarries of a Wi-Fi channel, including null ones. Furthermore, we implement different types of frames (i.e., Quality of service (QoS) and beacon) used by the prover and verifier as well as varying transmission power of the prover, allowing us to evaluate the robustness of Next2You and its resilience to attacks. Using frames of around 100 bytes in size, we find that Nexmon allows extracting CSI at the rate of up to 20 frames per second. In our experiments, we use several provers and a single verifier (cf. Section 6.1), thus we set the transmission rate of a prover to three frames per second, ensuring reliable CSI data collection on the verifier.
In addition, we port the functionality of the above app in the verifier mode onto the Raspberry Pi 3 Model B+ using the recent Nexmon CSI patch333https://github.com/seemoo-lab/nexmon_csi. This allows us to further explore the capability of Next2You to perform on heterogeneous devices.
5.2. Copresence Decision-making
We treat the problem of copresence detection as a binary classification task. Thus, we use the collected CSI data to train a machine learning classifier, predicting whether two devices are copresent (i.e., in the same room or car).
To collect CSI, we change in turns the position of the verifier (e.g., on a window sill, on a desk), resulting in a number of CSI datasets from different verifier-provers combinations (cf. Section 6.1). To estimate the performance of our classification approach, we use a 5-fold cross-validation (CV). This is a reasonable compromise between the computational costs of training the model and a good estimation of the predictive performance. Due to a larger number of non-copresent devices in our experiments, our dataset has an imbalanced distribution of the classes. Hence, we employ a stratified CV and classification metrics that are not affected by the imbalanced data (cf. Section 6.1). We construct the folds by (1) loading the CSI data from all verifier-provers combinations, (2) shuffling it with a set seed (i.e., 123), and (3) evenly sampling the data into each fold. Thus, we obtain five folds, each containing the same amount of data and ratio of positive and negative samples as the original CSI datasets from all verifier-provers combinations. Prior to training, we delete the irrelevant null subcarriers from the CSI data, resulting in 112 and 484 features (i.e., magnitude and phase values) per CSI measurement for 2.4 GHz and 5 GHz bands, respectively (cf. Figure 6). We normalize features in training and test sets using variance scaling (Zheng and Casari, 2018), ensuring that they have the same range, and thus are equally weighted by a classifier. The normalized features are obtained as:
| (6) |
Here, and are the mean and standard deviation of the -th feature, where .
As discussed in Section 4.5, we choose neural networks as a machine learning classifier, allowing us to avoid manual feature engineering. With the 5-fold CV, we need to train a neural network five times, thus we design it with performance and reasonable training time in mind. Specifically, we implement a neural network in Keras (Keras team, 2020) using four hidden layers with a decreasing number of neurons in each subsequent layer (i.e., 500, 300, 100, 20) and a softmax output layer (cf. Figure 7). We denote each input vector as , containing magnitude and phase values for every CSI measurement. Our network architecture has many neurons in the layers close to the input, reducing the number of neurons closer to the output. This gives the network enough capacity to learn a feature representation and gradually reduces the classifier’s complexity in the last layers. We do not use convolutions, as they introduce interdependencies among the features given the mask size and stride hyper-parameters. To avoid this hyper-parameter search, we use a dense neural network with enough neurons and layers to model CSI data collected in different environments (e.g., office rooms, cars). However, we leave as future work the test of pruning methods to reduce the network size as well as the behavior of convolutions and attention mechanisms (Frankle and Carbin, 2018; LeCun et al., 1989; Vaswani et al., 2017). We use the Leaky-ReLU (Xu et al., 2015) activation function for the hidden layers’ neurons, as it avoids the vanishing gradient problem and also back-propagates gradients for negative values. For the loss function, we utilize cross-entropy. To avoid overfitting, we keep the size of our network small and regularize by applying the dropout (Srivastava et al., 2014) after each hidden layer; the dropout rate is set to 0.2. We use the Adam optimizer (Kingma and Ba, 2014) with a learning rate of 0.001, and the batch size of 32, as often recommended (Brownlee, 2020). We train the network until convergence, setting the number of epochs to 35 and 25 for 2.4 GHz and 5 GHz bands, respectively.
5.3. Next2You Prototype
We implement a Next2You prototype working in real-time by combining the functionality of our CSI collector with the TensorFlow Lite framework (TensorFlow team, 2020), allowing us to use pretrained neural network models directly on smartphones. Specifically, the prototype extracts CSI from incoming frames, processes it to the required input format (i.e., removing null subcarriers, performing feature normalization), and feeds the processed CSI to the model, which, in turn, outputs a copresence prediction. For the prototype, we reuse the same neural network architecture described in Section 5.2. To leverage CSI temporality, we accumulate successive CSI measurements within a time window, generating a copresence prediction for each measurement and using a majority vote to obtain the final decision. We consider time windows of 5 and 10 seconds, which provide a fair trade-off between the speed and reliability of copresence detection, respectively (Truong et al., 2014).
6. Evaluation
In this section, we present a comprehensive evaluation of Next2You based on the real-world CSI data that we collect.
| Scenario | Number of devices | Accumulation round, minutes | Overall time, hours | |
| 2.4 GHz | 5 GHz | |||
| Office† | 12 | 35 (20) | 25 (20) | 44 |
| – Heterogeneous∗ | 12 | 20 | 20 | 8 |
| – Frame∗ | 12 | 20 | 20 | 8 |
| – Power∗ | 12 | 20 | 20 | 8 |
| Apartment | 12 | 20 | 20 | 8 |
| House | 10 | 20 | 20 | 4.7 |
| Parked Cars | 8 | 10 | 10 | 2.7 |
| Moving Cars | 8 | 20 | 10 | 4 |
†Collected over several days; ∗ Uses setup in 8(a); - Accumulation round at nighttime.
6.1. Experiment Setup
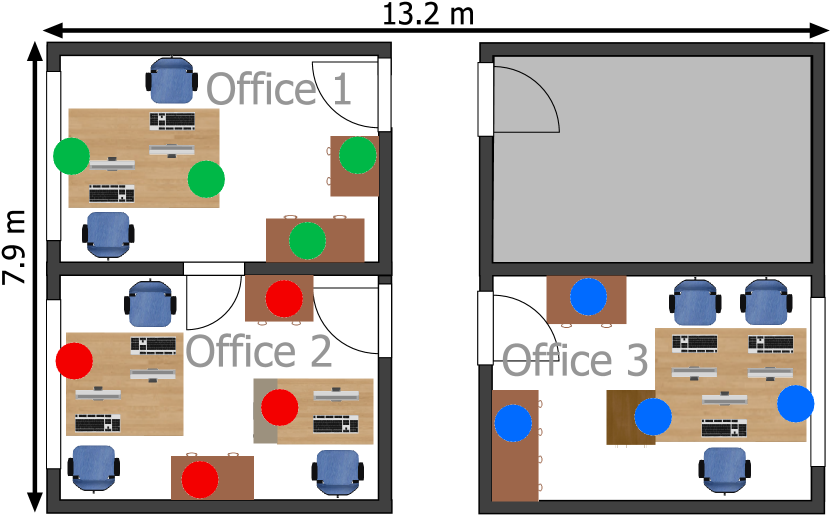
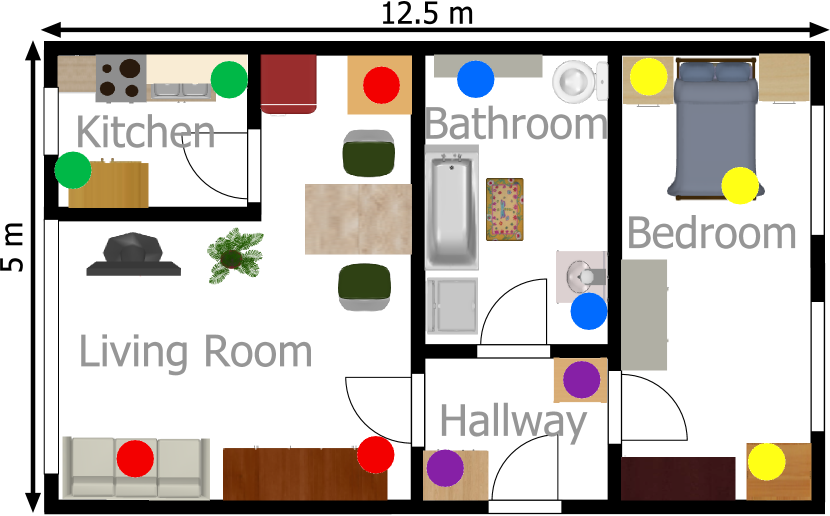
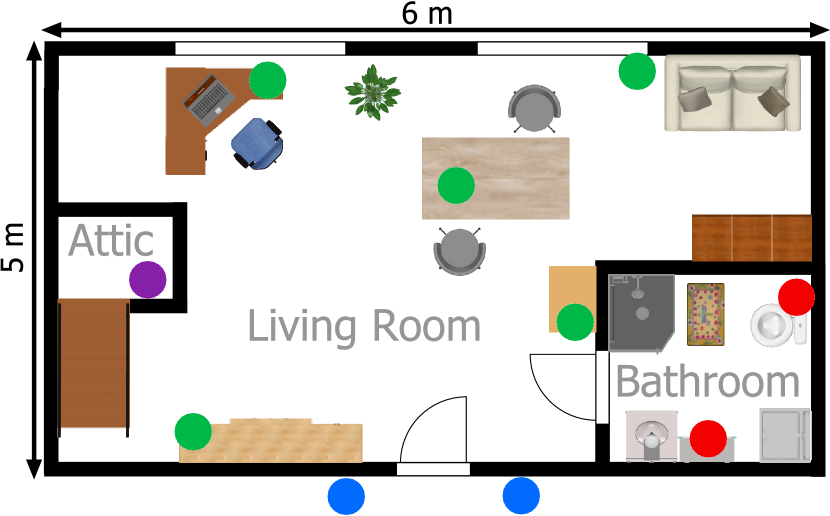
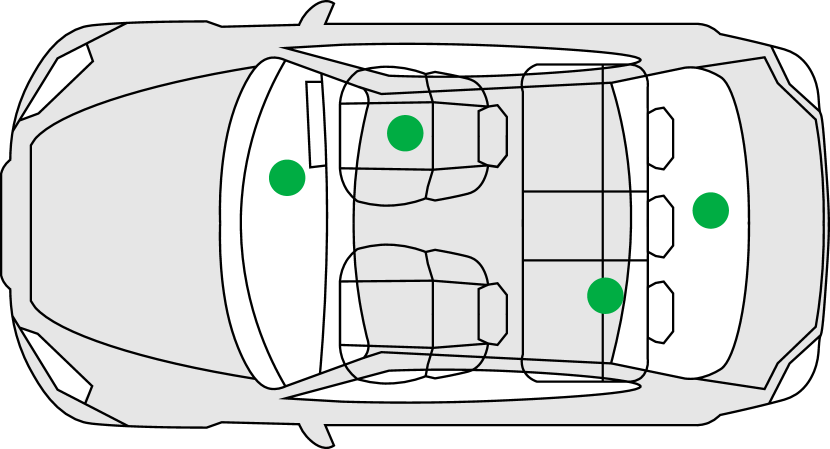
To evaluate the capability of Next2You to detect copresence inside the same office, room, or car, we collect CSI data in five different scenarios: office, apartment, house as well as parked and moving cars. These scenarios vary in terms of size and geometry, wall and obstacle materials, and the number of occupants. Specifically, the office consists of three office rooms: two adjacent offices and one across a hallway, occupied by one to three persons, the apartment is a two-room flat inhabited by two people, while the house is a single-person household, and the cars are either parked side by side without any occupants in them, or being driven one after another with a single person inside each car for a total of 120 km. To evaluate the impact of (1) heterogeneous devices, (2) different frame types, and (3) varying transmission power on copresence detection performance of Next2You, we collect CSI data in these three configurations reusing the office setup, resulting in heterogeneous, frame, and power scenarios. In the office, we collect the data over the course of several days, allowing us to assess copresence detection performance of Next2You at different times of the day (e.g., morning vs. night), while in other scenarios we record CSI for up to eight hours, as shown in Table 2. To capture CSI data, we use our app installed on Nexus 5 and Nexus 6P smartphones, and the Raspberry Pi 3 Model B+ (cf. Section 5.1), which are deployed in spots where IoT devices are typically found such as on a desk in the office, on a dashboard in the car, and near a TV set in the apartment (cf. Figure 8).
To obtain representative CSI data, we collect it at each spot in the scenario.
Specifically, during a data accumulation round, we have one device (verifier) capturing CSI data from all other devices (provers).
For example, if a device on a window sill in Office 1 is a verifier, then it collects CSI data from three copresent provers in Office 1 and eight non-copresent provers located in Offices 2 and 3 (cf. 8(a)).
In the next data accumulation round, we change the position of the verifier (e.g., to a desk in Office 1), capturing CSI from all provers again, repeating this procedure until we obtain CSI data from each spot in the scenario (e.g., all circles in 8(a)).
We set the length of the data accumulation round based on the amount of CSI data available from 2.4 GHz and 5 GHz frequency bands (i.e., 112 and 484 magnitude and phase values, respectively) and complexity of the scenario (i.e., the amount of motion and number of obstacles), as presented in Table 2.
Reproducibility and Reusability.
In total, we collect over 95 hours of CSI data.
We release the collected dataset and source code for data collection, evaluation, and Next2You prototype (Fomichev et al., 2021).
Ethical Considerations.
Due to the sensitivity of the CSI data (Zhu et al., 2020), we obtained the approval for this study from our institutional ethical review board, the participants residing in experimental locations gave informed consent for the collection, use, and release of the CSI data.
Performance Metrics.
We evaluate whether Next2You can correctly classify copresent and non-copresent devices (e.g., distinguish devices in Office 1 from devices in Offices 2 and 3, cf. 8(a)).
Specifically, we train a neural network model on the CSI data and compare its predictions with the ground truth, computing two performance metrics: Area Under the Curve (AUC) and Equal Error Rate (EER).
The former shows how well the model can distinguish between copresent and non-copresent classes, with a higher AUC indicating a more accurately discriminative model; AUC is invariant to class imbalance compared to other metrics (e.g., accuracy).
The latter is the intersection point of False Acceptance Rate (FAR) and False Rejection Rate (FRR), balancing the number of misclassified non-copresent and copresent devices, respectively.
The FAR represents the security of the system (i.e., non-copresent devices classified as copresent), while the FRR shows its usability (i.e., copresent devices classified as non-copresent), thus a low EER is desirable to achieve both these properties.
6.2. Copresence Detection Performance
The results of Next2You copresence detection performance from our experiments are provided in Table 3, where the two scenarios (i.e., frame and power) correspond to the active adversary, while the rest—represent the passive adversary (cf. Section 3). In these experiments, we train a neural network on both copresent and non-copresent samples, investigating how well Next2You performs on unseen CSI data in advanced attack scenarios (cf. Section 6.5). From Table 3, we observe that Next2You provides reliable copresence detection in different scenarios, achieving EERs between 0 and 0.04. Next2You shows more accurate copresence detection using the 5 GHz frequency band, and its performance decreases in larger environments with many obstacles as well as human and object motion (e.g., closing a door) compared to smaller stationary scenarios (e.g., office vs. parked cars).
| Scenario | Adversary | 2.4 GHz | 5 GHz | ||
| AUC | EER | AUC | EER | ||
| Office | Passive | 0.958 | 0.040 | 0.995 | 0.005 |
| – Heterogeneous | Passive | 0.982 | 0.014 | 0.996 | 0.002 |
| – Frame | Active | 0.988 | 0.010 | 0.993 | 0.005 |
| – Power | Active | 0.995 | 0.002 | 0.999 | 0.000 |
| Apartment | Passive | 0.961 | 0.022 | 0.984 | 0.012 |
| House | Passive | 0.993 | 0.007 | 0.984 | 0.015 |
| Parked Cars | Passive | 0.998 | 0.001 | 0.999 | 0.000 |
| Moving Cars | Passive | 0.996 | 0.002 | 0.997 | 0.001 |
0.00 - shows best achievable EER.
Impact of Frequency Band and Bandwidth. Table 3 reports that CSI data from the 5 GHz band allows distinguishing copresent and non-copresent devices more accurately. We see three reasons for this result. First, the higher sensitivity of 5 GHz to path-loss causes more severe power attenuation from non-copresent devices, limiting their communication range. Second, the shorter wavelength at 5 GHz (i.e., 6 cm), which is more easily perturbed by small-sized objects compared to 2.4 GHz (wavelength = 12.5 cm), allows discerning characteristics of the environment such as obstacle placement with higher granularity. Third, the broader channel bandwidth at 5 GHz (i.e., 80 MHz) improves the time resolution of the CIR. Thus, more CIR paths can be distinguished from one another (cf. 5(a)), resulting in more detailed CSI measurement, including information on distance ranges between devices inside the same environment.
From a security perspective, the shorter range of 5 GHz is beneficial, as it forces the adversary to stay closer to legitimate devices. For example, in the moving cars scenario, we had to drive two vehicles very slowly to maintain a distance of a few meters to be able to capture any CSI data from non-copresent devices. In reality, following another car in such a way will immediately raise suspicion, imposing a physical barrier on the adversary’s capability. However, the shorter communication range of 5 GHz can hinder usability—we see that the AUC and EER for the apartment and house in 5 GHz are the lowest among the scenarios (cf. Table 3), indicating that copresent devices in larger rooms with many obstacles inside experience a rapid decrease in performance.
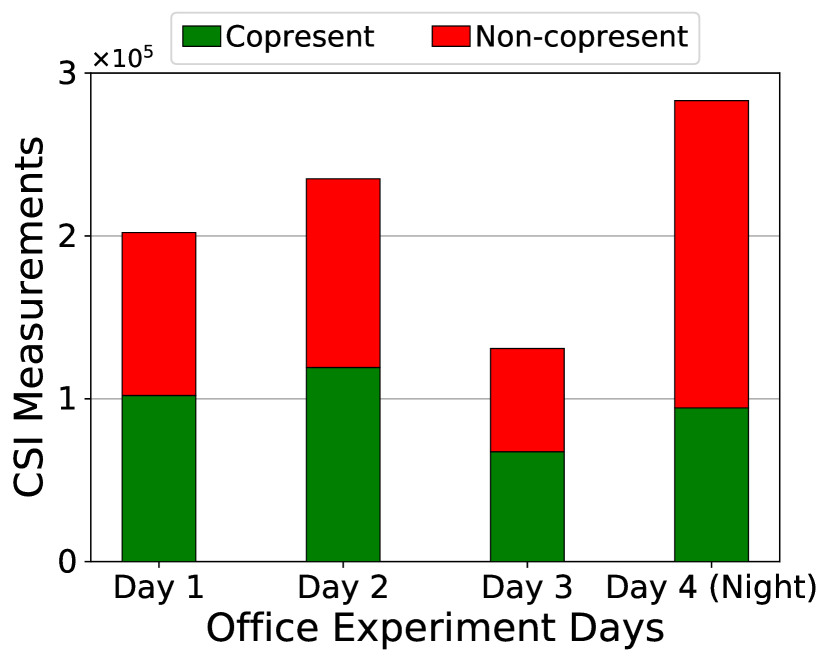
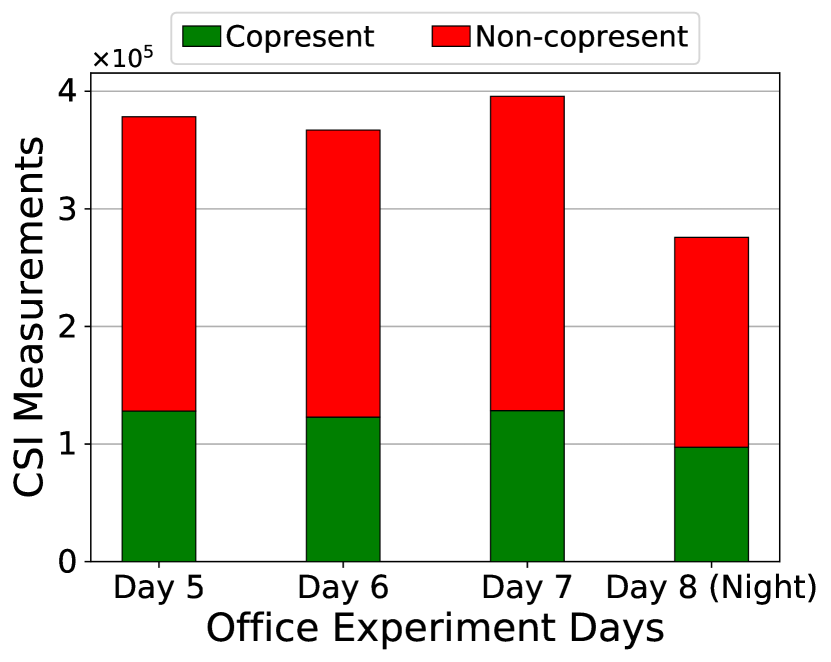
We study the structure of our CSI data, finding that for the 2.4 GHz band in the office, frame, and heterogeneous scenarios, the number of copresent and non-copresent CSI measurements does not conform to the expected ratio of roughly 30% to 70% (i.e., three copresent vs. eight non-copresent devices, cf. 8(a)). Instead, the number of copresent and non-copresent measurements is almost equal, which occurs only during working hours and not at night (cf. 9(a)). In contrast, all 5 GHz measurements (cf. 9(b) for the office) as well as 2.4 GHz in other scenarios, follow the expected ratio. We attribute this behavior to the crowded spectrum in the 2.4 GHz band during working office hours (e.g., heavy Wi-Fi and Bluetooth traffic), preventing many frames from non-copresent provers reaching the verifier in their wireless range due to interference. The spectrum busyness generally reduces the overall number of collected CSI measurements (e.g., Day 3 vs. Day 4 (Night) in 9(a)). This effect is beneficial for security, providing better separation between copresent and non-copresent devices. However, it may hinder usability or availability of Next2You in large environments (e.g., lecture hall) with many wireless devices operating in the same spectrum.
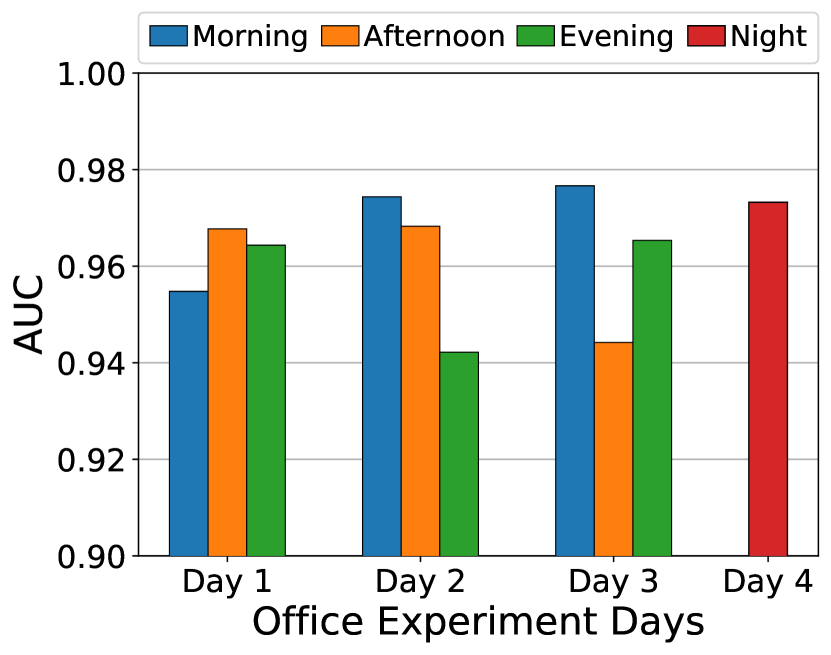
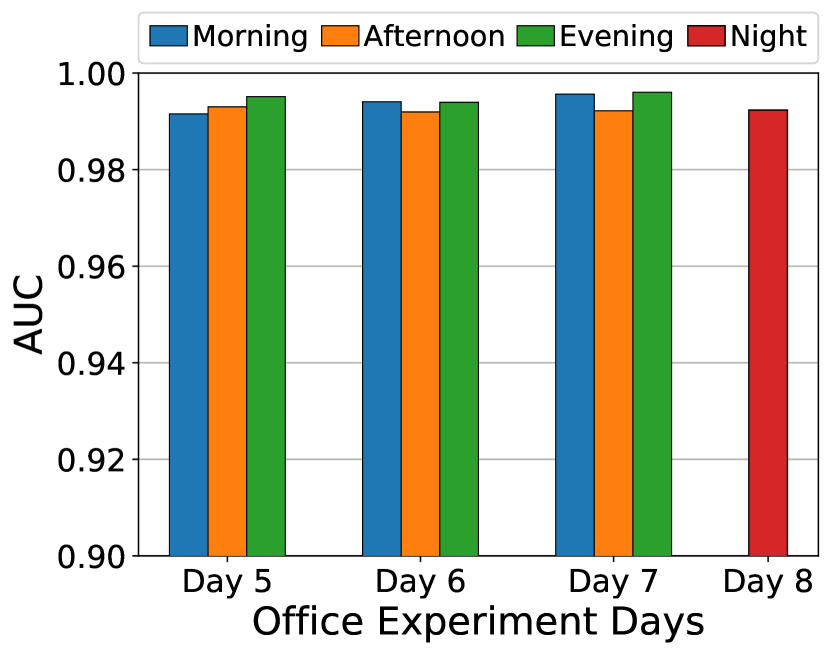
Impact of Time of Day.
Figure 10 depicts the AUC performance of Next2You at different times of day (i.e., morning, afternoon, evening, and night) in the office scenario.
This result is obtained on the CSI data collected at the same time of day on different days following the procedure described in Section 5.2.
We see that during a day (i.e., morning till evening), the 5 GHz band shows both higher and more consistent AUCs compared to 2.4 GHz, confirming its suitability for small- and medium-sized environments.
In addition, AUCs of different days retain similar trends in both frequency bands, suggesting that such factors as spectrum busyness (e.g., possibly congested 2.4 GHz spectrum at Day 3, cf. 9(a)) and motion do not significantly affect the performance of Next2You.
This finding is confirmed by the AUC at night, which remains comparable to the day AUCs in both frequency bands, despite the absence of motion and minimum spectrum busyness.
The high AUC at night shows that Next2You can cope with low-entropy context even for adjacent Offices 1 and 2 separated by a thin wall (cf. 8(a)).
Impact of Heterogeneous Devices.
To evaluate the capability of Next2You to work on heterogeneous devices, we make a customized port of the Nexmon CSI-extractor (Schulz et al., 2018) to the Nexus 6P smartphone, which has a different Wi-Fi chipset than Nexus 5, allowing us to send frames and extract CSI data with Nexus 6P.
We find that due to two transmitting antennas in Nexus 6P, the CSI resulting from a frame sent by Nexus 6P differs444To the best of our knowledge, the official port of the Nexmon CSI-extractor on Nexus 6P now also supports single or multiple spacial streams, which should address this limitation (cf. https://github.com/seemoo-lab/nexmon_csi). from CSI extracted by Nexus 5, which contains a single antenna.
Hence, we use a Nexus 6P smartphone to capture CSI data from frames sent by Nexus 5 devices.
Table 3 shows that the AUC and EER in the heterogeneous scenario are moderately better compared to the office (two scenarios share a setup, cf. 8(a)) in both frequency bands, indicating the practicality of Next2You on heterogeneous devices.
To confirm this evidence, we use the Raspberry Pi 3 Model B+, which has a different Wi-Fi chipset from Nexus smartphones, to collect CSI data from Nexus 5 devices in a setup similar to the heterogeneous scenario (i.e., three office rooms with seven smartphones overall), obtaining even slightly higher AUCs of 0.9955 and 0.9988 for 2.4 GHz and 5 GHz bands, respectively.
Impact of Frame Type.
To assess the robustness of Next2You, we change the transmitted data format extracting CSI from beacon instead of QoS frames.
We do not observe significant changes in the structure of collected CSI data (e.g., similar trends for CSI measurements, cf. Figure 9).
The AUC and EER in the frame scenario are noticeably better compared to the office in 2.4 GHz but are similar in the 5 GHz band (cf. Table 3).
We attribute the improved performance in 2.4 GHz to a shorter data accumulation round in the frame scenario (i.e., 20 vs. 35 minutes in the office, cf. Table 2), capturing fewer complex events such as relocation of obstacles, leading to more accurate copresence detection.
Thus, we demonstrate that Next2You is agnostic to the frame type, facilitating its deployability (e.g., one verifier can execute Next2You with several provers, each using a different frame type).
Impact of Transmission Power. We study if an adversary can attack Next2You by increasing the transmission power of non-copresent devices to overcome such effects as path-loss and shadowing (Shi et al., 2017). To find by how much the power needs to be increased, we increment it until we obtain the expected ratio of CSI measurements (i.e., roughly 30% to 70%) for copresent and non-copresent devices at 2.4 GHz in the office setup during working hours. Thus, all frames sent by non-copresent provers reach the verifier despite the interference and blockages as if they are “copresent”. We empirically find that the power needs to be increased by ten times to achieve this.
Table 3 shows that the AUC and EER of the power scenario are significantly better compared to the office in both frequency bands.
We verify this result by finding no noticeable difference between CSI magnitude555Nexus devices have Automatic gain control (AGC) enabled, thus power change is not reflected in the CSI, cf. https://github.com/seemoo-lab/mobisys2018_nexmon_channel_state_information_extractor/issues/2#issuecomment-384088517. and its variance in both scenarios as well as normalizing the CSI magnitude by a unit power and obtaining unchanged AUC and EER.
Based on the interpretation of hypotheses learned by our neural network from the CSI data (cf. Section 6.4), we conclude that increased power affects the statistical properties of CSI, making it easier to classify devices transmitting with different power.
Specifically, higher power produces additional CIR paths (cf. Section 4.2) originated from the adversary’s environment, distinguishing the CSI of non-copresent devices from copresent.
Real-time Performance and Impact of Mobility.
We evaluate the real-time performance of Next2You in the office scenario using our prototype (cf. Section 5.3) in two cases.
First, we adjust the position of smartphones within 50 cm from their initial spots (cf. circles in 8(a)), putting some devices on top of books or boxes.
Then, a device at each spot in turn acts as the verifier predicting copresence in real-time, while all other devices are provers.
In this case, Next2You correctly detects copresence around 95% of the time in both frequency bands, regardless of the CSI measurement window (i.e., 5 or 10 seconds).
Second, we challenge Next2You by introducing mobility.
Specifically, the provers are deployed as shown in 8(a), whereas the verifier is carried by a user.
The user continuously moves inside one of three offices or a hallway, approaching office doors from the hallway or walking close to a thin wall separating adjacent offices.
We note that the neural network models for 2.4 GHz and 5 GHz bands that are deployed on the mobile verifier have been trained on the CSI data collected by stationary devices, as described in Section 6.1.
| Location | 2.4 GHz | 5 GHz | ||||||
| 5 sec | 10 sec | 5 sec | 10 sec | |||||
| FAR | FRR | FAR | FRR | FAR | FRR | FAR | FRR | |
| Hallway | 0.111 | n/a | 0.083 | n/a | 0.016 | n/a | 0.009 | n/a |
| Office 3 | 0.075 | 0.203 | 0.054 | 0.085 | 0.000 | 0.329 | 0.000 | 0.298 |
| Office 2 | 0.196 | 0.262 | 0.131 | 0.220 | 0.128 | 0.274 | 0.065 | 0.326 |
| Office 1 | 0.148 | 0.382 | 0.190 | 0.308 | 0.027 | 0.238 | 0.000 | 0.200 |
Table 4 shows the FAR and FRR performance of Next2You in the case of mobility for each location, frequency band, and time window. We see that FAR when the verifier moves in the hallway varies from 0.111 to 0.009, decreasing with the higher frequency band and longer time window. Exploring the misclassified provers, we find that FAR is caused by devices that either have a line of sight with open office doors or located close to the hallway wall; closing offices’ doors reduces FARs to almost zero for both frequency bands and time windows. In Office 3, separated by the hallway, both FAR and FRR steadily decrease with a longer time window for 2.4 GHz. Inspecting FAR and FRR, we discover that the former is caused by devices from opposite Office 2 located near the door, while the latter comes from either heavily obstructed (i.e., window sill) or highest above the floor (i.e., office cabinet) devices. For 5 GHz, FAR remains zero for both time windows, while FRR is relatively high and does not change significantly. We find that a device on top of the office cabinet accounts for over 70% of the FRR, which we attribute to heavier attenuation and reflections due to the moving verifier being blocked by the user as well as the least amount of training data available for devices high above the floor. In adjacent Offices 1 and 2, FAR and FRR follow the above trends but are higher, especially for 2.4 GHz, showing the impact of insufficiently separated environments; FAR is overwhelmingly caused by devices from the adjacent office, while FRR, as before, comes from heavily obstructed and high above the floor devices.
The above results demonstrate that Next2You not only works reliably in real-time but also shows high potential for classifying mobile CSI data despite being trained on the stationary data.
In other words, the neural network is able to make a generalization, providing fairly accurate copresence detection for device locations that were not in the training dataset.
However, further research is required to improve this generalization capability, for example, by customizing the network’s architecture to reduce the impact of user motion (Abyaneh et al., 2018).
Comparison with Prior Work.
We compare the EER performance of Next2You with two state-of-the-art audio-based copresence detection schemes from Karapanos et al. (Karapanos et al., 2015) and Truong et al. (Truong et al., 2014). These schemes are evaluated by Fomichev et al. (Fomichev et al., 2019) in very similar to our office and car scenarios (i.e., adjacent offices, parked cars), allowing for a direct comparison.
Next2You shows at least 16-times lower EERs compared to the state-of-the-art audio schemes in the case of insufficiently separated environments such as adjacent offices, while in low-entropy context of parked cars Next2You preforms several orders of magnitude better (cf. Table 5).
6.3. Generalizability
We evaluate the capability of Next2You to generalize to new application scenarios (e.g., different apartment) by investigating how much effort is required for transfer learning, namely to reuse a pretrained neural network and retrain it with the data of the new environment. As stated in Section 4.5, we choose neural networks because of their inherent ability to automatically learn the feature representation. We leverage this property as follows: based on our network structure (cf. Figure 7), we observe that the first two layers (i.e., 500 and 300 neurons, respectively) are mostly dedicated to learning the CSI feature representation, while the last two layers (i.e., 100 and 20 neurons, respectively) are focusing on the classification task. Thus, we can learn the CSI feature representation once on the most comprehensive office dataset that contains the largest amount of CSI data, capturing complex geometry and motion, and then reuse this network and retrain it on other scenarios, significantly reducing the computations required for the learning step.
| Scheme | EER (Office) | EER (Car) | ||
| Full∗ | Night | Moving | Parked | |
| Next2You (this work) | 0.005 | 0.005 | 0.001 | 0.000 |
| Karapanos et al. (Karapanos et al., 2015) | 0.098 | 0.090 | 0.006 | 0.037 |
| Truong et al. (Truong et al., 2014) | 0.084 | 0.080 | 0.111 | 0.271 |
∗Aggregated performance over several days, including all times of day (i.e., morning till night).
| Scenario | AUC | |
| 2.4 GHz | 5 GHz | |
| Office | n/a | n/a |
| – Heterogeneous | 0.981 | 0.995 |
| – Frame | 0.986 | 0.985 |
| – Power | 0.987 | 0.995 |
| Apartment | 0.964 | 0.982 |
| House | 0.986 | 0.976 |
| Parked Cars | 0.999 | 0.999 |
| Moving Cars | 0.997 | 0.998 |
Specifically, we take the office model, which can be efficiently trained on a powerful machine or in the cloud, and set the first two layers to be non-trainable. We then retrain the last two layers of such office model on the train set of another scenario (e.g., house) and use the obtained model to classify copresence on the test set of this scenario, performing this procedure for each of our scenarios except the office. The resulting AUCs are within one percentage point from the AUCs of scenario models trained from scratch (cf. Table 3 vs. Table 6), confirming that our network architecture allows for feature representation and transfer learning successfully. Since the retrained model is much simpler, we can train for fewer epochs (e.g., we use 10) and reduce the number of floating point operations per second (FLOPS) in the forward training loop of our neural network by a factor of 7 and 13 for 2.4 GHz and 5 GHz bands, respectively. Given that modern end-user devices already perform in the giga FLOPS (The Weaver Computer Engineering Research Group, 2020) range, we consider it feasible to deploy and retrain Next2You in new scenarios using the described approach.
As all context-based schemes utilizing machine learning, Next2You requires initial data collection when being deployed in a new environment (Wu et al., 2020). For stationary devices, CSI data can be collected in the background: given a typical rate of 3–5 packets per second on IoT devices (Zhu et al., 2020), a representative dataset can be obtained in a matter of minutes. For mobile devices, a user will need to walk inside the environment (e.g., a room) for this time to collect typical CSI, which can similarly be done in the background during user’s daily routine (e.g., office hours).
6.4. Interpretability of Next2You Copresence Detection
Our results demonstrate that Next2You performs well in classifying copresent and non-copresent devices in a variety of scenarios (cf. Table 3), and it generalizes to new environments (cf. Section 6.3). However, neural networks might not learn the right hypothesis, yet achieve high classification results for the wrong reasons (Lapuschkin et al., 2019). To avoid this, we need to understand which factors play a role in a copresence decision produced by Next2You. Since CSI captures the combined scattering, path-loss, shadowing, and multi-path effects (Shi et al., 2017), which cannot be easily discerned, we identify features in the CSI data contributing to copresence detection and validate our findings against prior work on CSI-based localization and identification.
To interpret the copresence decision-making of Next2You, we apply a recently introduced Right for the Right Reasons (RRR) method (Ross et al., 2017), which identifies relevant features used by a neural network in a classification process. Thus, we can not only quantify parts of the CSI determining copresence but also harden Next2You against attacks by combining multiple hypotheses learned from CSI data (cf. Section 6.5). We utilize the RRR method as follows (details in Appendix A): (1) we train a neural network on our CSI data, obtaining a gradient mask, containing the features considered important by the network, (2) using this mask we find relative importance of these features in the whole training data, (3) we select and penalize features with relative importance above 10%, retraining the network on the same data to make it learn another hypothesis, (4) we repeat the above steps (1)–(3), increasing the number of penalized features until the AUC on the test data drops below 0.85; we choose the 10% feature importance and 0.85 stopping thresholds empirically.
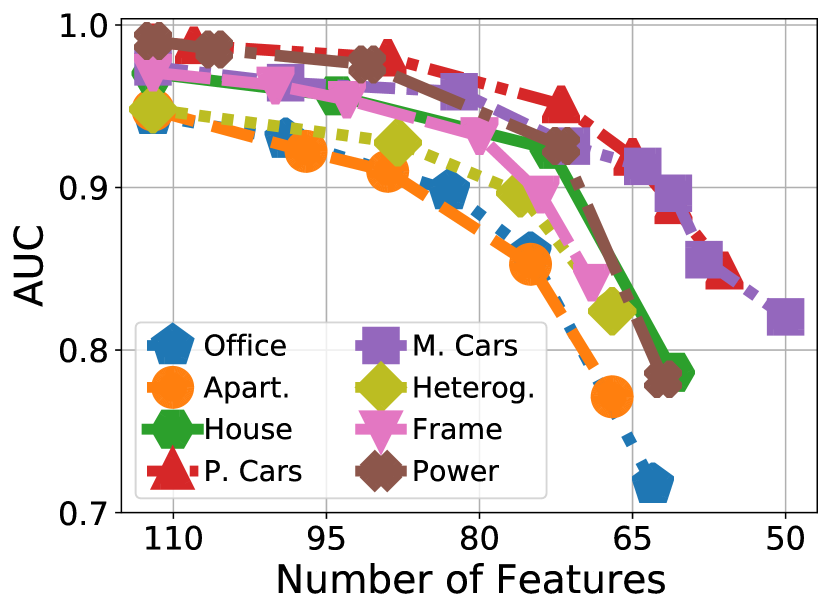
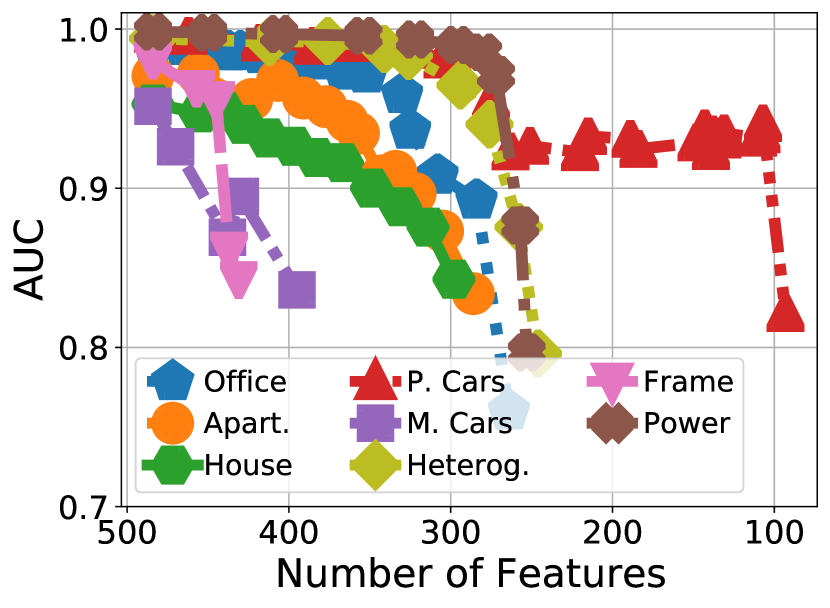
Figure 11 shows the AUC performance of different neural network models produced by the RRR method in 2.4 GHz and 5 GHz bands. We see that multiple models relying on different features can be trained from the CSI data, retaining high AUC, confirming the suitability of CSI for copresence detection. In larger and more complex scenarios (i.e., office, apartment, and house) more features are required to classify copresent and non-copresent devices, while in the smaller and simpler parked cars, we may need as few as four features. We observe distinct feature patterns in heterogeneous and power scenarios. In the former scenario, more features are required to distinguish copresent and non-copresent devices compared to the office (two scenarios share a setup, cf. 8(a)) in both frequency bands. Thus, a neural network likely captures properties of CSI-extracting hardware, which may by used to fingerprint specific types of devices, providing an additional layer of protection. In the latter scenario, the models often rely on 6–8 important features, originating from the CSI of subcarriers uniformly spread over a Wi-Fi channel, indicating that increased power affects statistical properties of the CSI.
We find that the neural network models in Figure 11 rely on CSI magnitude for all scenarios except the parked and moving cars, which start to use phases once magnitude features are penalized. In comparable scenarios (e.g., office and house), the models without penalization use similar important features resulting from the CSI of subcarriers located at the beginning, in the middle, or at the end of a Wi-Fi channel. These subcarriers are relevant because of their stability and low susceptibility to noise (Shi et al., 2017). Thus, they can accurately capture a particular effect in the environment such as shadowing due to large objects or scattering caused by window grids. Our findings about the important CSI features for copresence detection agree with prior work. For example, the CSI magnitude is known to be relevant in complex scenarios with many obstacles and human motion (Gong et al., 2016), while the phases contain too much noise, and thus are not useful (Liu et al., 2017). In the environments with shorter distances and fewer obstacles between devices, the phases can be successfully utilized (Sen et al., 2012), as we see in the parked and moving cars. We find that the magnitude and phases of adjacent Wi-Fi subcarriers are jointly identified as important features because similar frequencies are likely to be affected by the same phenomenon (e.g., scattering) (Shi et al., 2017). These results demonstrate the soundness of the RRR interpretations, confirming that Next2You is capable of learning a robust wireless fingerprint of the environment embedded in the CSI.
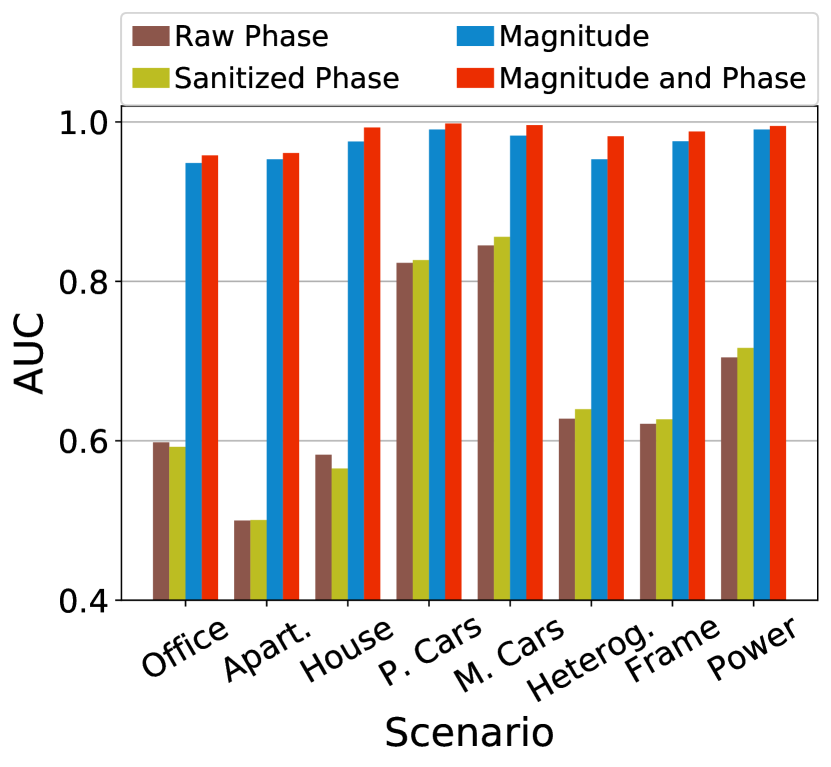
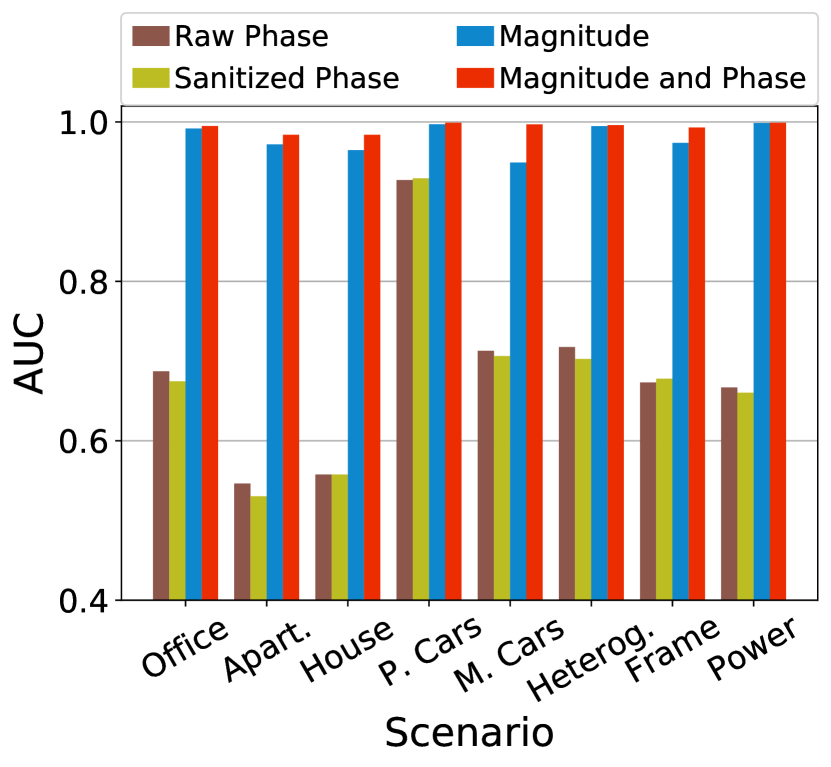
To quantify the contributions of CSI features to Next2You classification performance, we train a neural network on either magnitudes or phases (cf. Figure 12). We apply a phase sanitization method by Sen et al. (Sen et al., 2012) to overcome the problem of random phase behavior caused by unsynchronized clocks between devices and random noise, training the network on both raw and sanitized phases to allow their comparison. We see that in complex scenarios (e.g., apartment) copresence detection based on CSI phases is infeasible, reaching AUCs of around 0.5, indicating that the neural network classification is no better than a random guess. However, in the simpler environments of parked and moving cars, the phases become feasible for copresence detection, showing AUCs above 0.8 and 0.9 for 2.4 GHz and 5 GHz bands, respectively. The sanitized phases perform marginally better than the raw phases, which is in contrast with findings of prior work (Sen et al., 2012; Qian et al., 2014). Such a discrepancy is due simpler hardware in our experiments (i.e., smartphones), containing a single antenna, which has lower sensitivity and higher susceptibility to noise, compared to multiple antennas in routers used by the prior work. Our phase classification results agree with previous research, showing the higher relevance of 5 GHz phases for localization (Wang et al., 2017). The AUC performance based on magnitudes is stable across our scenarios, however using both magnitude and phase features results in consistently higher AUCs (cf. Figure 12). Thus, CSI phases indeed contain relevant copresence information, which can be utilized by a neural network to improve the overall classification performance.
The above results demonstrate the soundness of Next2You utilizing CSI and neural networks for copresence detection. We see a direct impact of the environment complexity on the capability of a neural network to make copresence predictions from the CSI data. The fact that the neural network captures distinct properties of diverse CSI data (i.e., heterogeneity, transmission power) confirms its inherent ability for autonomous representation learning and suitability for Next2You. We also find that using off-the-shelf devices in real-world scenarios may render existing methods for leveraging CSI inefficient (e.g., phase sanitization), urging the need to conduct experiments in realistic setups with heterogeneous hardware.
6.5. Advanced Attack Scenarios
We investigate the robustness of Next2You to advanced attacks and propose mitigation strategies. In the first attack, the adversary either precollects CSI data in a similar environment (e.g., car), where legitimate devices execute Next2You, or they train a neural network model on a comprehensive dataset (e.g., office) and use this model to predict copresence on the CSI data of simpler scenarios (e.g., parked cars). We find that such threats are feasible allowing the adversary to predict copresence with relatively high AUCs between 0.8 and 0.9. To mitigate this attack, we utilize multiple neural network models, each learning a different hypothesis, generated by the RRR method (cf. Section 6.4).
(2.4 GHz)
(5 GHz)
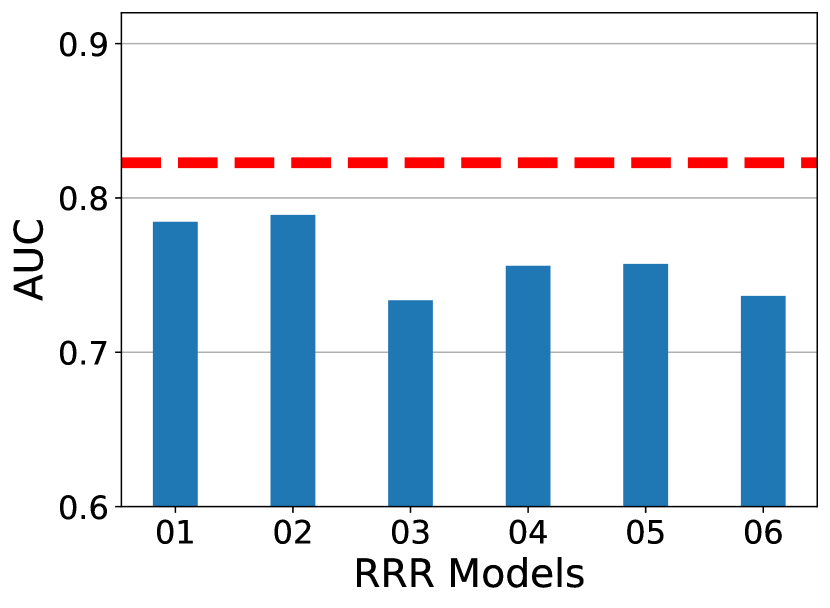
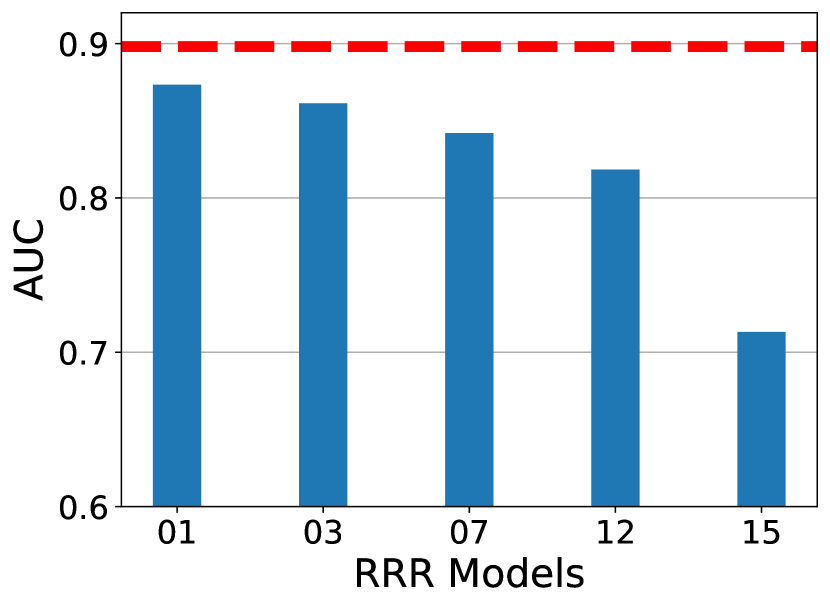
13(a) and 13(b) depict the AUC performance of different RRR models from Figure 11. The former, shows the models trained on the moving cars CSI and tested on the parked car data for 2.4 GHz, while the latter—the models trained on the office CSI and tested on the parked cars data for 5 GHz. We see that the RRR models with penalized features perform 12–25 AUC percentage points better when applied to the legitimate data compared to the adversarial data (cf. Figure 11 vs. Figure 13). In the adversarial case, the AUC drops from the model top-performing (cf. dotted red line in Figure 13) more rapidly than in the legitimate case. Thus, the above attack can be mitigated by training a number of the RRR models and combining their majority vote with thresholding for the final copresence decision (e.g., at least three models must have AUC above 0.9).
In the second attack, the adversary who knows that the neural network is trained on a single power level, which is typical for legitimate devices, increases the transmission power of their devices. We implement this attack by training our neural network on the CSI data combined from the office and power scenarios; in the latter scenario, we exclude high-power samples corresponding to non-copresent devices. Thus, we evaluate the capability of our neural network to classify the unseen high-power CSI data.
Table 7 shows that under the power attack, the performance of Next2You drops by 16 and 11 AUC percentage points for 2.4 GHz and 5 GHz, respectively. We find that devices in adjacent Offices 1 and 2 and near open doors (cf. 8(a)) are mostly affected by such an attack, accounting for the AUC drop. The fact that only neighboring devices in such a challenging scenario (i.e., insufficient separation between Offices 1 and 2) are vulnerable to this attack suggests its limited scope. To mitigate the attack, we tried applying different RRR models with penalized features, however, we observe a similar sharp drop in AUC from the top-performing model, as in Figure 13. This indicates that the neural network simply lacks enough cues to distinguish copresent and non-copresent devices under such an attack. We discuss which other data, in addition to CSI, can improve the robustness of Next2You in Section 7. To alleviate the effect of the increased power attack, we find that including only 10% of high-power samples brings classification performance very close to the baseline (cf. first row in Table 7). This clearly helps improve the performance of the classifiers, as it provides more data close to the boundaries of the classes. We highlight the utmost importance of training neural networks considering adversarial samples to harden Next2You.
| CSI data used for training (included samples) | Area Under the Curve ( AUC) | |
| 2.4 GHz | 5 GHz | |
| Office + Power (all samples) | 0.9781 | 0.9967 |
| Office + Power (no high-power samples) | 0.8165 | 0.8825 |
| Office + Power (10% of high-power samples) | 0.9313 | 0.9948 |
7. Discussion
In this section, we provide relevant discussion points for Next2You.
Robustness.
Our evaluation shows that Next2You provides reliable copresence detection with error rates below 4% and 1.5% for 2.4 GHz and 5 GHz bands, respectively (cf. Table 3).
We demonstrate the soundness of using CSI and neural networks for copresence detection (cf. Section 6.4), and find that Next2You can be hardened by training a number of neural network models, each relying on a different set of features, and combining their predictions (cf. Section 6.5).
However, Next2You might be vulnerable to the increased power attack if the neural network is trained without considering the advanced capabilities of the adversary.
To improve the robustness of Next2You, a number of physical layer metrics can be used in addition to CSI.
For example, the signal-to-noise ratio (SNR) estimated directly in a wireless chipset should capture a unique noise pattern in the environment of copresent devices.
Also, as shown by Won et al. (Won et al., 2017), CSI power levels are useful for traffic classification. In Next2You, these levels can be used to detect the increased power attack (cf. Section 6.5).
In addition, power delay profiles (PDPs), namely the squared magnitudes of the CIR, can be used as an additional input to a neural network, improving copresence detection accuracy by combining features from time (i.e., PDP or CIR) and frequency (i.e., CSI) domains.
Furthermore, devices running Next2You can measure the energy on different Wi-Fi channels to make copresence detection more reliable.
Specifically, the energy sensed by copresent devices on a given Wi-Fi channel depends on its busyness in their environment (i.e., amount of traffic, other wireless devices using the channel in this environment).
This energy will differ from measurements made by non-copresent devices, providing additional cues for differentiation.
With several antennas, a direction from which a signal arrives can be determined, as we detail in the following discussion point.
We also see that the temporal properties of CSI (i.e., behavior over time) increase the reliability of copresence detection (cf. Section 6.2).
Leveraging CSI Phase.
Our results demonstrate that the CSI phase is less relevant for copresence detection than the magnitude, especially in complex environments with many obstacles and large amount of motion.
Prior research uses multiple antennas to remove a phase offset by finding the difference between phases received on different antennas, or obtain the relative phase by subtracting phases of two successively received frames (Ma et al., 2019).
The former approach only works if devices have multiple antennas, however, as we discuss in next point, it is unlikely that commodity IoT devices will receive them.
The latter approach requires high packet rates (e.g., hundreds packets per second) to provide sufficient CSI granularity, while degrading fast in performance with reduced rates (Sen et al., 2012; Shi et al., 2017).
However, such high packet rates are impractical on IoT devices running on batteries.
The accurate phase estimation allows obtaining AoA and time of flight (ToF) (Ma et al., 2019), which have the potential for increasing the robustness of Next2You to advanced attacks.
Deployment Considerations.
To use Next2You, devices performing copresence detection should be capable of extracting CSI.
In recent years, several CSI extracting tools have emerged (Halperin et al., 2011; Xie et al., 2015; Schulz et al., 2017; Gringoli et al., 2019), enabling various devices such as routers, laptops, and smartphones with this capability.
Utilizing these tools, security researchers discover severe vulnerabilities in proprietary firmwares of popular Wi-Fi chipsets (Classen and Hollick, 2019; Mantz et al., 2019), highlighting the necessity for open-source wireless stacks, which will provide better security and functionality (e.g., finer-grained control over a wireless chipset).
Thus, we are positive that an increasing number of devices will receive the CSI-extraction capability, facilitating the deployment of Next2You.
Another deployment consideration is using Next2You on devices that have a different number of antennas, namely single or multiple.
As we discover in Section 6.2, the CSI of one and two antenna devices varies, hindering the deployment of Next2You, if we cannot disable the second antenna and its spatial stream.
This again urges the importance of finer-grained control over wireless chipsets.
For conventional 2.4 GHz and 5 GHz Wi-Fi, we do not expect low-power IoT devices (e.g., thermostat, smart lock) to have multiple antennas because of the size and energy constraints (i.e., two antennas require more processing), however, end-user devices such as smartphones, laptops, and routers will likely feature two or more antennas (Xue et al., 2018).
For higher frequency Wi-Fi based on mm-waves, even simple devices should be equipped with multiple antennas (Schultz, 2013).
Copresence Distance.
We consider devices to be copresent if they are located inside the same (office) room or car, which is commonly assumed by context-based copresence detection schemes (Karapanos et al., 2015; Truong et al., 2019; Fomichev et al., 2019). Our empirical results demonstrate that Next2You reliably detects copresence in rooms of up to meter size and in typical passenger cars (e.g., hatchback).
However, we see that the environments larger than meter in size might become problematic for the 5 GHz band.
Also, the presence of prominent obstacles in the environment (e.g., sizeable wardrobe set, moving walls) can reduce the copresence detection accuracy of Next2You.
On the other hand, increasing the transmission power will extend the applicability range of Next2You.
Overall, Next2You suits typical environments where copresence detection is applied, however, its parameters (e.g., used frequency band, transmission power) need to be adjusted for specific use cases.
8. Conclusion
In the age of the Internet of Things (IoT), the demand for secure and usable authentication systems is on the rise. Context-based copresence detection enables such systems, allowing one device to verify proximity of another device based on their physical context (e.g., audio), eliminating user interaction. We propose Next2You, a robust context-based copresence detection scheme utilizing channel state information (CSI). As its main contribution, Next2You provides reliable copresence detection, including the challenging cases of low-entropy context (e.g., empty room with few events occurring) and insufficiently separated environments (e.g., adjacent rooms), and it does not require devices to have common sensors such as microphones. We implement and evaluate Next2You in five real-world scenarios, demonstrating its high classification accuracy in distinguishing copresent and non-copresent devices, the capability of working in real-time, and resilience to various attacks. The obtained error rates below 4% show that Next2You outperforms the state-of-the-art copresence detection schemes, and it is deployable on off-the-shelf devices such as smartphones.
9. Acknowledgments
We would like to thank Timm Lippert, Robin Klose, and Arash Asadi for their assistance in conducting this research. This work has been co-funded by the Research Council of Norway as part of the project Parrot (311197), the German Research Foundation (DFG) as part of projects A3 and B5G-Cell within the Collaborative Research Center (CRC) 1053 – MAKI, as well as the German Federal Ministry of Education and Research and the Hessian Ministry of Higher Education, Research, Science and the Arts within their joint support of the National Research Center for Applied Cybersecurity ATHENE.
References
- (1)
- Abouzar et al. (2016) Pooyan Abouzar, David G Michelson, and Maziyar Hamdi. 2016. RSSI-based Distributed Self-localization for Wireless Sensor Networks used in Precision Agriculture. IEEE Transactions on Wireless Communications 15, 10 (2016), 6638–6650.
- Abyaneh et al. (2018) Amirhossein Yazdani Abyaneh, Ali Hosein Gharari Foumani, and Vahid Pourahmadi. 2018. Deep Neural Networks Meet CSI-Based Authentication. arXiv preprint arXiv:1812.04715 (2018).
- Agata et al. (2015) Yugo Agata, Jihoon Hong, and Tomoaki Ohtsuki. 2015. Room-level Proximity Detection using Beacon Frame from Multiple Access Points. In Asia-Pacific Signal and Information Processing Association Annual Summit and Conference (APSIPA). IEEE, 941–945.
- Agata et al. (2016) Yugo Agata, Jihoon Hong, and Tomoaki Ohtsuki. 2016. Room-level Proximity Detection based on RSS of Dual-band Wi-Fi Signals. In IEEE International Conference on Communications (ICC). IEEE, 1–6.
- Aviva (2020) Aviva. 2020. Tech Nation: Number of Internet-connected Devices Grows to 10 per Home. https://www.aviva.com/newsroom/news-releases/2020/01/tech-nation-number-of-internet-connected-devices-grows-to-10-per-home/.
- Baehrens et al. (2010) David Baehrens, Timon Schroeter, Stefan Harmeling, Motoaki Kawanabe, Katja Hansen, and Klaus-Robert Müller. 2010. How to Explain Individual Classification Decisions. The Journal of Machine Learning Research 11 (2010), 1803–1831.
- Brownlee (2020) Jason Brownlee. 2020. How to Control the Stability of Training Neural Networks With the Batch Size. https://machinelearningmastery.com/how-to-control-the-speed-and-stability-of-training-neural-networks-with-gradient-descent-batch-size/.
- Classen and Hollick (2019) Jiska Classen and Matthias Hollick. 2019. Inside Job: Diagnosing Bluetooth Lower Layers using Off-the-shelf Devices. In Proceedings of the 12th Conference on Security and Privacy in Wireless and Mobile Networks. 186–191.
- Conti and Lal (2019) Mauro Conti and Chhagan Lal. 2019. Context-based Co-presence Detection Techniques: A Survey. Computers & Security (2019), 101652.
- Fang et al. (2014) Song Fang, Yao Liu, Wenbo Shen, and Haojin Zhu. 2014. Where Are you From? Confusing Location Distinction using Virtual Multipath Camouflage. In Proceedings of the 20th Annual International Conference on Mobile Computing and Networking. 225–236.
- Fang et al. (2016) Song Fang, Yao Liu, Wenbo Shen, Haojin Zhu, and Tao Wang. 2016. Virtual Multipath Attack and Defense for Location Distinction in Wireless Networks. IEEE Transactions on Mobile Computing 16, 2 (2016), 566–580.
- Feng et al. (2011) Chen Feng, Wain Sy Anthea Au, Shahrokh Valaee, and Zhenhui Tan. 2011. Received-signal-strength-based Indoor Positioning Using Compressive Sensing. IEEE Transactions on Mobile Computing 11, 12 (2011), 1983–1993.
- Fomichev et al. (2021) Mikhail Fomichev, Luis F Abanto-Leon, Max Stiegler, Alejandro Molina, Jakob Link, and Matthias Hollick. 2021. Index of Supplementary Files from ”Next2You: Robust Copresence Detection Based on Channel State Information”. https://doi.org/10.5281/zenodo.5105815.
- Fomichev et al. (2018) Mikhail Fomichev, Flor Álvarez, Daniel Steinmetzer, Paul Gardner-Stephen, and Matthias Hollick. 2018. Survey and Systematization of Secure Device Pairing. IEEE Communications Surveys & Tutorials 20, 1 (2018), 517–550.
- Fomichev et al. (2019) Mikhail Fomichev, Max Maass, Lars Almon, Alejandro Molina, and Matthias Hollick. 2019. Perils of Zero-Interaction Security in the Internet of Things. Proceedings of the ACM on Interactive, Mobile, Wearable and Ubiquitous Technologies 3, 1 (2019), 10.
- Frankle and Carbin (2018) Jonathan Frankle and Michael Carbin. 2018. The Lottery Ticket Hypothesis: Finding Sparse, Trainable Neural Networks. arXiv preprint arXiv:1803.03635 (2018).
- Futurae Technologies AG (2019) Futurae Technologies AG. 2019. Futurae Authentication Suite. https://www.futurae.com/product/strongauth/
- Gawłowicz et al. (2020) Piotr Gawłowicz, Anatolij Zubow, Suzan Bayhan, and Adam Wolisz. 2020. Punched Cards over the Air: Cross-Technology Communication Between LTE-U/LAA and WiFi. In 21th IEEE International Symposium on a World of Wireless, Mobile and Multimedia Networks (WoWMoM 2020). IEEE, Virtual Conference.
- Gong et al. (2016) Liangyi Gong, Wu Yang, Zimu Zhou, Dapeng Man, Haibin Cai, Xiancun Zhou, and Zheng Yang. 2016. An Adaptive Wireless Passive Human Detection via Fine-grained Physical Layer Information. Ad Hoc Networks 38 (2016), 38–50.
- Goodfellow et al. (2016) Ian Goodfellow, Yoshua Bengio, and Aaron Courville. 2016. Deep Learning. MIT press.
- Gringoli et al. (2019) Francesco Gringoli, Matthias Schulz, Jakob Link, and Matthias Hollick. 2019. Free Your CSI: A Channel State Information Extraction Platform For Modern Wi-Fi Chipsets. In Proceedings of the 13th International Workshop on Wireless Network Testbeds, Experimental Evaluation & Characterization. 21–28.
- Halevi et al. (2012) Tzipora Halevi, Di Ma, Nitesh Saxena, and Tuo Xiang. 2012. Secure Proximity Detection for NFC devices based on Ambient Sensor Data. In European Symposium on Research in Computer Security. Springer, 379–396.
- Halperin et al. (2011) Daniel Halperin, Wenjun Hu, Anmol Sheth, and David Wetherall. 2011. Tool Release: Gathering 802.11n Traces with Channel State Information. ACM SIGCOMM CCR 41, 1 (2011), 53.
- Han et al. (2018) Jun Han, Albert Jin Chung, Manal Kumar Sinha, Madhumitha Harishankar, Shijia Pan, Hae Young Noh, Pei Zhang, and Patrick Tague. 2018. Do You Feel What I Hear? Enabling Autonomous IoT Device Pairing Using Different Sensor Types. In IEEE Symposium on Security and Privacy (SP). IEEE, 836–852.
- Hauser et al. (2017) Steven C Hauser, William C Headley, and Alan J Michaels. 2017. Signal Detection Effects on Deep Neural Networks utilizing Raw IQ for Modulation Classification. In IEEE Military Communications Conference (MILCOM). IEEE, 121–127.
- Hornik et al. (1989) Kurt Hornik, Maxwell Stinchcombe, Halbert White, et al. 1989. Multilayer Feedforward Networks are Universal Approximators. Neural Networks 2, 5 (1989), 359–366.
- Huang et al. (2014) Donny Huang, Rajalakshmi Nandakumar, and Shyamnath Gollakota. 2014. Feasibility and Limits of Wi-Fi Imaging. In Proceedings of the 12th ACM Conference on Embedded Network Sensor Systems. 266–279.
- Karapanos et al. (2015) Nikolaos Karapanos, Claudio Marforio, Claudio Soriente, and Srdjan Capkun. 2015. Sound-Proof: Usable Two-Factor Authentication Based on Ambient Sound. In 24th USENIX Security Symposium (USENIX Security 15). 483–498.
- Keras team (2020) Keras team. 2020. Keras: The Python Deep Learning library. {https://keras.io/}.
- Kingma and Ba (2014) Diederik P Kingma and Jimmy Ba. 2014. Adam: A Method for Stochastic Optimization. arXiv preprint arXiv:1412.6980 (2014).
- Lapuschkin et al. (2019) Sebastian Lapuschkin, Stephan Wäldchen, Alexander Binder, Grégoire Montavon, Wojciech Samek, and Klaus-Robert Müller. 2019. Unmasking Clever Hans Predictors and Assessing what Machines Really Learn. Nature Communications 10, 1 (2019), 1–8.
- LeCun et al. (1989) Yann LeCun, Bernhard Boser, John S Denker, Donnie Henderson, Richard E Howard, Wayne Hubbard, and Lawrence D Jackel. 1989. Backpropagation Applied to Handwritten Zip Code Recognition. Neural Computation 1, 4 (1989), 541–551.
- Liu et al. (2017) Jialin Liu, Lei Wang, Linlin Guo, Jian Fang, Bingxian Lu, and Wei Zhou. 2017. A Research on CSI-based Human Motion Detection in Complex Scenarios. In IEEE 19th International Conference on e-Health Networking, Applications and Services (Healthcom). IEEE, 1–6.
- Lu et al. (2017) Zhou Lu, Hongming Pu, Feicheng Wang, Zhiqiang Hu, and Liwei Wang. 2017. The Expressive Power of Neural Networks: A View from the Width. In Proceedings of the 31st International Conference on Neural Information Processing Systems. 6232–6240.
- Ma et al. (2019) Yongsen Ma, Gang Zhou, and Shuangquan Wang. 2019. WiFi Sensing with Channel State Information: A Survey. ACM Computing Surveys (CSUR) 52, 3 (2019), 1–36.
- Mantz et al. (2019) Dennis Mantz, Jiska Classen, Matthias Schulz, and Matthias Hollick. 2019. Internalblue-bluetooth Binary Patching and Experimentation Framework. In Proceedings of the 17th Annual International Conference on Mobile Systems, Applications, and Services. 79–90.
- Mare et al. (2014) Shrirang Mare, Andrés Molina Markham, Cory Cornelius, Ronald Peterson, and David Kotz. 2014. Zebra: Zero-effort Bilateral Recurring Authentication. In IEEE Symposium on Security and Privacy. IEEE, 705–720.
- Marforio et al. (2014) Claudio Marforio, Nikolaos Karapanos, Claudio Soriente, Kari Kostiainen, and Srdjan Capkun. 2014. Smartphones as Practical and Secure Location Verification Tokens for Payments. In NDSS, Vol. 14. 23–26.
- Matuszewski and Sikorska-Łukasiewicz (2017) Jan Matuszewski and Katarzyna Sikorska-Łukasiewicz. 2017. Neural Network Application for Emitter Identification. In 18th International Radar Symposium (IRS). IEEE, 1–8.
- Niitsoo et al. (2018) Arne Niitsoo, Thorsten Edelhäuer, and Christopher Mutschler. 2018. Convolutional Neural Networks for Position Estimation in TDoA-based Locating Systems. In International Conference on Indoor Positioning and Indoor Navigation (IPIN). IEEE, 1–8.
- O’Shea et al. (2018) Timothy James O’Shea, Tamoghna Roy, and T Charles Clancy. 2018. Over-the-air Deep Learning based Radio Signal Classification. IEEE Journal of Selected Topics in Signal Processing 12, 1 (2018), 168–179.
- Pérez-Cruz et al. (2019) Fernando Pérez-Cruz, Pablo M Olmos, Michael Minyi Zhang, and Howard Huang. 2019. Probabilistic Time of Arrival Localization. IEEE Signal Processing Letters 26, 11, 1683–1687.
- Putz et al. (2020) Florentin Putz, Flor Álvarez, and Jiska Classen. 2020. Acoustic Integrity Codes: Secure Device Pairing using Short-range Acoustic Communication. In Proceedings of the 13th ACM Conference on Security and Privacy in Wireless and Mobile Networks. 31–41.
- Qian et al. (2014) Kun Qian, Chenshu Wu, Zheng Yang, Yunhao Liu, and Zimu Zhou. 2014. PADS: Passive Detection of Moving Targets with Dynamic Speed using PHY Layer Information. In 20th IEEE International Conference on Parallel and Distributed Systems (ICPADS). IEEE, 1–8.
- Ross et al. (2017) Andrew Slavin Ross, Michael C. Hughes, and Finale Doshi-Velez. 2017. Right for the Right Reasons: Training Differentiable Models by Constraining their Explanations. In Proceedings of the 26th International Joint Conference on Artificial Intelligence (IJCAI-17). 2662–2670.
- Schultz (2013) B Schultz. 2013. 802.11 ad–WLAN at 60 GHz–A Technology Introduction. Rohde & Schwarz (2013).
- Schulz et al. (2018) Matthias Schulz, Jakob Link, Francesco Gringoli, and Matthias Hollick. 2018. Shadow Wi-Fi: Teaching Smartphones to Transmit Raw Signals and to Extract Channel State Information to Implement Practical Covert Channels over Wi-Fi. In Proceedings of the 16th Annual International Conference on Mobile Systems, Applications, and Services. ACM, 256–268.
- Schulz et al. (2017) Matthias Schulz, Daniel Wegemer, and Matthias Hollick. 2017. Nexmon: The C-based Firmware Patching Framework. https://nexmon.org
- Sen et al. (2012) Souvik Sen, Božidar Radunovic, Romit Roy Choudhury, and Tom Minka. 2012. You are Facing the Mona Lisa: Spot Localization using PHY Layer Information. In Proceedings of the 10th international conference on Mobile systems, applications, and services. 183–196.
- Shepherd et al. (2017) Carlton Shepherd, Iakovos Gurulian, Eibe Frank, Konstantinos Markantonakis, Raja Naeem Akram, Emmanouil Panaousis, and Keith Mayes. 2017. The Applicability of Ambient Sensors as Proximity Evidence for NFC Transactions. In IEEE Security and Privacy Workshops (SPW). IEEE, 179–188.
- Shi et al. (2017) Cong Shi, Jian Liu, Hongbo Liu, and Yingying Chen. 2017. Smart User Authentication Through Actuation of Daily Activities Leveraging WiFi-enabled IoT. In Proceedings of the 18th ACM International Symposium on Mobile Ad Hoc Networking and Computing. 1–10.
- Shi et al. (2019) Yi Shi, Kemal Davaslioglu, Yalin E Sagduyu, William C Headley, Michael Fowler, and Gilbert Green. 2019. Deep Learning for RF Signal Classification in Unknown and Dynamic Spectrum Environments. In IEEE International Symposium on Dynamic Spectrum Access Networks (DySPAN). IEEE, 1–10.
- Shrestha et al. (2019) Babins Shrestha, Manar Mohamed, and Nitesh Saxena. 2019. ZEMFA: Zero-Effort Multi-Factor Authentication based on Multi-Modal Gait Biometrics. In 17th International Conference on Privacy, Security and Trust (PST). IEEE, 1–10.
- Shrestha et al. (2014) Babins Shrestha, Nitesh Saxena, Hien Thi Thu Truong, and N Asokan. 2014. Drone to the Rescue: Relay-resilient Authentication using Ambient Multi-Sensing. In International Conference on Financial Cryptography and Data Security (FC). Springer, 349–364.
- Shrestha et al. (2018) Babins Shrestha, Nitesh Saxena, Hien Thi Thu Truong, and N Asokan. 2018. Sensor-based Proximity Detection in the Face of Active Adversaries. IEEE Transactions on Mobile Computing 18, 2 (2018), 444–457.
- Shrestha et al. (2016) Babins Shrestha, Maliheh Shirvanian, Prakash Shrestha, and Nitesh Saxena. 2016. The Sounds of the Phones: Dangers of Zero-Effort Second Factor Login based on Ambient Audio. In Proceedings of the 2016 ACM SIGSAC Conference on Computer and Communications Security. ACM, 908–919.
- Shuman (2019) Dave Shuman. 2019. Looking Under the Hood of the Connected Car. https://www.techradar.com/news/looking-under-the-hood-of-the-connected-car.
- Sonoda and Murata (2017) Sho Sonoda and Noboru Murata. 2017. Neural Network with Unbounded Activation Functions is Universal Approximator. Applied and Computational Harmonic Analysis 43, 2 (2017), 233–268.
- Srivastava et al. (2014) Nitish Srivastava, Geoffrey Hinton, Alex Krizhevsky, Ilya Sutskever, and Ruslan Salakhutdinov. 2014. Dropout: A Simple Way to Prevent Neural Networks from Overfitting. The Journal of Machine Learning Research 15, 1 (2014), 1929–1958.
- Stute et al. (2018) Milan Stute, David Kreitschmann, and Matthias Hollick. 2018. One Billion Apples’ Secret Sauce: Recipe for the Apple Wireless Direct Link Ad hoc Protocol. In Proceedings of the 24th Annual International Conference on Mobile Computing and Networking. ACM, 529–543.
- Stute et al. (2019) Milan Stute, Sashank Narain, Alex Mariotto, Alexander Heinrich, David Kreitschmann, Guevara Noubir, and Matthias Hollick. 2019. A Billion Open Interfaces for Eve and Mallory: MitM, DoS, and Tracking Attacks on iOS and macOS through Apple Wireless Direct Link. In 28th USENIX Security Symposium (USENIX Security 19). 37–54.
- Tan et al. (2018) Chuanqi Tan, Fuchun Sun, Tao Kong, Wenchang Zhang, Chao Yang, and Chunfang Liu. 2018. A Survey on Deep Transfer Learning. In International conference on artificial neural networks. Springer, 270–279.
- TensorFlow team (2020) TensorFlow team. 2020. Deploy machine learning models on mobile and IoT devices. {https://www.tensorflow.org/lite}.
- The Weaver Computer Engineering Research Group (2020) The Weaver Computer Engineering Research Group. 2020. The Top 50 Fastest Computers in the Weaver Research Group. http://web.eece.maine.edu/~vweaver/group/machines.html.
- Truong et al. (2014) Hien Thi Thu Truong, Xiang Gao, Babins Shrestha, Nitesh Saxena, N Asokan, and Petteri Nurmi. 2014. Comparing and Fusing Different Sensor Modalities for Relay Attack Resistance in Zero-Interaction Authentication. In IEEE International Conference on Pervasive Computing and Communications (PerCom). IEEE, 163–171.
- Truong et al. (2019) Hien Thi Thu Truong, Juhani Toivonen, Thien Duc Nguyen, Claudio Soriente, Sasu Tarkoma, and N. Asokan. 2019. DoubleEcho: Mitigating Context-Manipulation Attacks in Copresence Verification. In IEEE International Conference on Pervasive Computing and Communications (PerCom2019). IEEE.
- Twain (2019) Taylor Twain. 2019. 6 Most Commonly Used IoT Communication Protocols. {http://techgenix.com/iot-communication-protocols/}.
- Vaswani et al. (2017) Ashish Vaswani, Noam Shazeer, Niki Parmar, Jakob Uszkoreit, Llion Jones, Aidan N Gomez, Łukasz Kaiser, and Illia Polosukhin. 2017. Attention is All you Need. In Advances in Neural Information Processing Systems. 5998–6008.
- Wang et al. (2016) Xuyu Wang, Lingjun Gao, and Shiwen Mao. 2016. CSI Phase Fingerprinting for Indoor Localization with a Deep Learning Approach. IEEE Internet of Things Journal 3, 6 (2016), 1113–1123.
- Wang et al. (2017) Xuyu Wang, Lingjun Gao, and Shiwen Mao. 2017. BiLoc: Bi-modal Deep Learning for Indoor Localization with Commodity 5GHz WiFi. IEEE Access 5 (2017), 4209–4220.
- Won et al. (2017) Myounggyu Won, Shaohu Zhang, and Sang H Son. 2017. WiTraffic: Low-cost and Non-intrusive Traffic Monitoring System using WiFi. In 26th International Conference on Computer Communication and Networks (ICCCN). IEEE, 1–9.
- Wu et al. (2012) Kaishun Wu, Jiang Xiao, Youwen Yi, Dihu Chen, Xiaonan Luo, and Lionel M Ni. 2012. CSI-based Indoor Localization. IEEE Transactions on Parallel and Distributed Systems 24, 7 (2012), 1300–1309.
- Wu et al. (2020) Yuezhong Wu, Qi Lin, Hong Jia, Mahbub Hassan, and Wen Hu. 2020. Auto-Key: Using Autoencoder to Speed Up Gait-based Key Generation in Body Area Networks. Proceedings of the ACM on Interactive, Mobile, Wearable and Ubiquitous Technologies 4, 1 (2020), 1–23.
- Xi et al. (2016) Wei Xi, Chen Qian, Jinsong Han, Kun Zhao, Sheng Zhong, Xiang-Yang Li, and Jizhong Zhao. 2016. Instant and Robust Authentication and Key Agreement among Mobile Devices. In Proceedings of the 2016 ACM SIGSAC Conference on Computer and Communications Security. ACM, 616–627.
- Xiao et al. (2016) Jiang Xiao, Zimu Zhou, Youwen Yi, and Lionel M Ni. 2016. A Survey on Wireless Indoor Localization from the Device Perspective. ACM Computing Surveys (CSUR) 49, 2 (2016), 1–31.
- Xie et al. (2015) Yaxiong Xie, Zhenjiang Li, and Mo Li. 2015. Precise Power Delay Profiling with Commodity WiFi. In Proceedings of the 21st Annual International Conference on Mobile Computing and Networking. ACM, 53–64.
- Xiong and Jamieson (2013a) Jie Xiong and Kyle Jamieson. 2013a. Arraytrack: A Fine-grained Indoor Location System. In 10th USENIX Symposium on Networked Systems Design and Implementation (NSDI 13). 71–84.
- Xiong and Jamieson (2013b) Jie Xiong and Kyle Jamieson. 2013b. Securearray: Improving WiFi Security with Fine-grained Physical-layer Information. In Proceedings of the 19th Annual International Conference on Mobile Computing & networking. 441–452.
- Xu et al. (2015) Bing Xu, Naiyan Wang, Tianqi Chen, and Mu Li. 2015. Empirical Evaluation of Rectified Activations in Convolutional Network. arXiv preprint arXiv:1505.00853 (2015).
- Xue et al. (2018) Jiang Xue, Sudip Biswas, Ali Cagatay Cirik, Huiqin Du, Yang Yang, Tharmalingam Ratnarajah, and Mathini Sellathurai. 2018. Transceiver Design of Optimum Wirelessly Powered Full-Duplex MIMO IoT Devices. IEEE Transactions on Communications 66, 5 (2018), 1955–1969.
- Yang et al. (2013) Zheng Yang, Zimu Zhou, and Yunhao Liu. 2013. From RSSI to CSI: Indoor Localization via Channel Response. ACM Computing Surveys (CSUR) 46, 2 (2013), 1–32.
- Zheng and Casari (2018) Alice Zheng and Amanda Casari. 2018. Feature Engineering for Machine Learning: Principles and Techniques for Data Scientists. ” O’Reilly Media, Inc.”.
- Zhu et al. (2020) Yanzi Zhu, Zhujun Xiao, Yuxin Chen, Zhijing Li, Max Liu, Ben Y Zhao, and Haitao Zheng. 2020. Et Tu Alexa? When Commodity WiFi Devices Turn into Adversarial Motion Sensors. In 27th Annual Network and Distributed System Security Symposium (NDSS). The Internet Society.
Appendix
Appendix A Background on the Right for the Right Reasons Method
Before describing the Right for the Right Reasons ( Right for the Right Reasons (RRR) 111The original source code is available at https://github.com/dtak/rrr.) method (Ross et al., 2017), we consider two topics: interpretability and hypotheses space. Baehrens et al. (Baehrens et al., 2010) points to an interesting fact about these network functions, specifically, the gradient of the network’s output with respect to the input features is a vector normal to the decision boundary, and thus serves as a description of the model behavior near . In the RRR method (Ross et al., 2017), the authors propose to use these gradient vectors as explanations, and they further penalize those input gradients, making the network focus on relevant features and discarding irrelevant ones. With this approach, we can obtain explanations by finding which features are relevant for the prediction of an instance.
For the penalization term, the authors introduce the annotation matrix , which is a binary mask that indicates whether a feature should be relevant or not for a given instance. They then proceed to extend the standard loss functions by introducing a penalty function on the input gradients controlled by a parameter , namely . This penalty function and its influence value guide the optimization algorithm to find optimal parameters given the restrictions imposed by on the features, while minimizing the prediction error. To understand the parameter , let us consider the two extremes: if is low, the optimizer focuses only on the predictions, but if is high, it will focus on the importance of the features and ignore the quality of the predictions. Here, we use the recommended because it keeps the values from the standard loss and the penalty on the same order of magnitude, as suggested by Ross et al. (Ross et al., 2017). The above mentioned approach gives us interpretability by quantifying how much each feature contributes to the prediction of the network. However, it also gives us a way to obtain different classification hypotheses.
Each classifier encodes one classification hypothesis, but there might be many different alternative explanations for the classification of a dataset. We can obtain different hypothesis by computing the input gradients to get a magnitude ratio, specifically, we divide the input gradients by the component with the maximum magnitude. We then compute the features per instance above a threshold, setting it to 0.67 according to the original work (Ross et al., 2017). After that, we aggregate the values for all the instances and remove the top most important features. This allows us to obtain different parameters for our neural network architecture that classify the data according to other alternative explanations, as they will not have access to the same input features.