Metadata-informed community detection with lazy encoding using absorbing random walks
Abstract
Integrating structural information and metadata, such as gender, social status, or interests, enriches networks and enables a better understanding of the large-scale structure of complex systems. However, existing approaches to metadata integration only consider immediately adjacent nodes, thus failing to identify and exploit long-range correlations between metadata and network structure, typical of many spatial and social systems. Here we show how a flow-based community-detection approach can integrate network information and distant metadata, providing a more nuanced picture of network structure and correlations. We analyse social and spatial networks using the map equation framework and find that our methodology can detect a variety of useful metadata-informed partitions in diverse real-world systems. This framework paves the way for systematically incorporating metadata in network analysis.
Network theory assumes that the network structure of a complex system provides meaningful insights about its function, dynamics, and evolution [1, 2, 3]. For example, partitioning networks into significant groups of nodes helps researchers understanding how systems organise at different scales [4, 5, 6]. But focusing only on the network topology disregards potentially available metadata, link types or node labels that can enrich the plain network and provide valuable information about its large-scale organisation [7, 8].
Researchers have used such metadata to predict missing links in real-world networks [9, 10] and to better characterise dynamics and polarisation [11]. Encoding link-related metadata with multilayer networks has also proven effective for understanding various processes in systems with diverse relationships [12, 13, 14]. A promising research direction is to integrate metadata in community detection, the art of finding significant mesoscale structures in networks that can guide further research to understand the functioning of a system.
Different techniques to include exogenous information in network clustering have been explored [15, 16], with the aim of generalising community-detection methods and taking account of node-related metadata [17, 18, 19]. For instance, extended stochastic block models and flow-based methods can overcome the detectability limit when strong correlations between network structure and metadata are present. However, metadata provide no added value in the extended stochastic block models without clear pairwise correlations [17, 16]. And encoding non-aligned metadata in flow-based modules using the extended version of the map equation further divides the structural communities multiplicatively. While these methods have valid use cases, they cannot additively combine network structure and metadata, or exploit long-range interactions to highlight either the network structure or the metadata or any blending of the two.
We use random walks that remember their origins to enrich mesoscale network clustering with long-range interactions between structural information and node metadata. Assuming that each node of a graph is associated with some categorical, scalar, or vectorial metadata, we characterise the intertwined roles of those metadata with the structural constraints imposed by the underlying graph and detect functional communities. Building on the standard map equation, which casts community detection into a compression problem, we derive a lazy encoding scheme: we let the probability of encoding the transition of a walker between two nodes depend on the metadata of the previously encoded node and of the currently visited node. Equivalently, we apply the standard map equation on the flow graph obtained by considering a partially-absorbing random walk on that represents the probability of coding a step on a specific node . In our model, the probability of a walker starting at node to finishing at node depends on the node metadata at both and , integrating possible long-range interactions between structural information and metadata. By changing the baseline absorption probability of the walk, the proposed framework allows us to continuously tune the relative importance of network structure and metadata, making it easy to incorporate field-specific knowledge in the analysis.
We show that modular compression of absorbing random walks on various real-world networks reveals a variety of functional metadata-informed communities. In particular, we find that many social and spatial systems allow metadata-enriched partitions that differ substantially from those obtained from either structural network information or metadata clustering alone. For instance, analysing the spatial network of energy prices across Europe reveals regions that do not map directly to countries or price ranges but correspond to transnational areas characterised by socio-economic similarities.
I Model
We consider a connected and possibly weighted graph with nodes and edges. For simplicity, we assume that the graph is undirected, but a similar reasoning holds for primitive directed graphs as well. Assuming that nodes are associated with some categorical, scalar, or vectorial metadata such as gender, occupation, or income, there exists a function that maps each node to an element of the generic set , where for categorical data, and for scalar or vectorial data. As shown recently, the symbolic dynamics associated to the generic trajectory of an unbiased random walk on starting from node retains plentiful information about correlations and heterogeneity in the underlying distribution of metadata at different scales [20, 21].
In the absence of metadata, the symbolic dynamics are trivial. Yet, the underlying random-walk statistics, including node-to-node hitting times or the entropy rate, depend on the structure of : its degree distribution, degree-degree correlations, presence of clustering, communities, and so forth. Several algorithms for community detection exploit this connection between structure and dynamics. For example, Infomap [22] detects communities by capitalising on random walks’ propensity to remain trapped for relatively long times in densely-connected subgraphs.
Conversely, if the graph presents no structural heterogeneity, such as in an infinite lattice or a regular random graph, the statistics of depend only on the presence of correlations in node metadata, since spurious effects due to local trapping are averaged out in walks of infinite length.
We can interpolate between these two extremes by considering a partially absorbing random walk whose one-step transition probability from node to node is [23]
| (1) |
where the link weight between and represents the strength of the interaction between the two nodes. Additionally, a walker starting at node has a probability of being absorbed at the current node , where is some meaningful function of the metadata and . If a walker is absorbed at , its current trajectory ends at . By tuning the absorption probabilities according to the metadata at the start node and current node, and optimising the map equation on the resulting absorption graph, we can include a variable amount of metadata in the definition of meaningful communities.
The nodes’ absorption probabilities represent their traversal resistance to walkers depending on their origin and implicitly define the walkers’ horizon. For example, if , any walker starting at node will always terminate as soon as it reaches node . In this sense, node presents an infinite resistance to all walkers originating at . Conversely, if , typically none of the walkers starting at would ever stop at . By letting depend on the metadata and , we can drive the walkers starting at towards nodes with specific metadata. For example, if , walkers from node will only stop at nodes whose metadata values are identical to those at . In this case, the absorption graph will only comprise links among nodes associated with identical metadata values, irrespective of their actual distance on , and the map equation will be driven primarily by metadata information. Conversely, if for all , then the absorption graph is effectively the original graph , and its structure will exclusively drive the communities.
We define the absorption graph from the matrix . The weight of the directed link between and represents the probability that a random walk that started at node is absorbed at node after an arbitrary number of steps. The link weights can be expressed in terms of the absorption probabilities,
| (2) |
where is the probability for an absorbing walker that started at node at time to visit node at time . Thus, is the time integral of the probability for a walker to be absorbed at node at time when starting from node at time . The probability of finding a walker at node at time is governed by the master equation
| (3) |
which accounts for all the possible ways in which a walker can jump to node at time , given that the walker was not absorbed at time on any of the neighbours of . With for the probability to actually jump from node to node without being absorbed at , and , we can rewrite Eq. (3) as
| (4) |
where is the column vector of node occupation probabilities at time when the walk started from node at time . Equation (4) is formally identical to the master equation of a walker governed by the transition matrix , whose solution is
| (5) |
where . This means that Eq. (2) can be rewritten as
| (6) |
where is the column vector of absorption probabilities for walkers starting at node , and is the column vector of the edge weights of originating from node . If the underlying graph is connected, the matrix is in general dense since may be non-zero even if node and node are not directly connected by an edge. In this sense, can be interpreted as a conductance between and .
The absorption graph integrates structural and metadata information. The structural properties of depend on the structure of the underlying graph , on the distribution of metadata across the nodes, and on the function used to determine the absorption probabilities . Given a graph and node metadata, the absorption probabilities are the only free variables. Tuning the absorption probabilities contingent upon the problem and question at hand enables a continuous dependence of on and node metadata with categorical or scalar variables.
I.1 Exploiting the map equation for absorbing random walks
The partially absorbing random walk dynamics generalises the traditional diffusion dynamics employed by the map equation [24]. Given a partition of the set of nodes of a graph , the map equation over estimates the average codelength needed to describe movements of the random walk across the graph. In the original formulation, the map equation uses a high-level index codebook to identify communities or clusters and local modular codebooks to identify nodes inside communities. In this way, the map equation records transitions among nodes within the same community by using their local code words, and transitions between nodes in two different communities with three code words: one to exit from the current module codebook, one to enter the new module from the index codebook, and one for the destination node from the new module codebook. The standard map equation records every transition and relies only on the flow-graph defined by a uniform random walk on , and on the proposed partition .
When applying the map equation on the absorption graph defined in Eq. (6), the encoding procedure of the map equation works as for an underlying unbiased random walk. But the absorption graph, which represents the random walker’s absorption probabilities in each node depending on its origin, will account for the distribution of metadata in the graph. From a coding perspective, the map equation applied to the flow-graph of absorbing random walks corresponds to a lazy encoding scheme, where the encoding probability depends on the metadata of the previously encoded node and the currently visited node. Since the absorption probabilities can be tuned according to the application, this framework represents a powerful generalisation of the classical map equation.
I.2 Absorption probabilities for categorical metadata
The simplest example we consider is when each node is associated to a binary categorical variable such as high/low, rich/poor, /, and so on, and we assume that the probability for a walker to be absorbed at when starting from depends only on the categories and to which and belong, respectively. Without loss of generality, we assume that the available categories are just and set:
| (7) |
where and . This assignment allows us to model assortative, neutral, and disassortative absorption probabilities. If , the walker will be absorbed more frequently at nodes belonging to the same class of the starting node (assortative absorption), while for , absorption will be more probable at nodes belonging to a different class than the one of the starting node (disassortative absorption). For , absorption does not depend on class assignments any more (neutral absorption). Irrespective of the value of , the presence of an absorption probability , which in general is smaller than , means that the walker can traverse a large portion of the graph before being absorbed. In particular, in the limit , the actual structure of the graph becomes less and less relevant, and absorption is driven exclusively by categorical information. Conversely, when the probability for a walker to be absorbed at depends more on its distance from on than on metadata. In the special case where and , the timescale of diffusion and absorption are the same, categorical information becomes irrelevant, and the absorption graph is the original graph .
The simple synthetic graph consisting of three loosely interconnected cliques in Fig. 1 shows an example of this assignment. We use absorption probabilities based on Eq. (7) also for categorical metadata with more than two categories. We consider real-valued metadata when the distance between two categories can be quantified in a meaningful way and includes potentially interesting correlations between metadata and structure.
I.3 Absorption probabilities for real-valued metadata
The second example we consider is real-valued node metadata, where each node is assigned a real value . We assume that the absorption probability is inversely proportional to , so that will be higher if and are associated to similar metadata values. In general, we could choose to modulate the absorption probability through any decreasing function of , but in the following we will only consider the coding probability
| (8) |
Here, is the probability to code at when , is a scale parameter, so that larger values of correspond to higher absorption probability, and is the relative strength of metadata information. The complement of the metadata strength is the baseline coding probability
| (9) |
the probability to code when the distance is large.
For , when the relative strength of metadata is maximal, Eq. (8) is a proper generalisation of Eq. (7) for binary categories. In this case, we recover when and when , with . Equivalently, for standardised real-valued metadata with , metadata values that are standard deviations apart correspond to binary separation of categories.
II Results
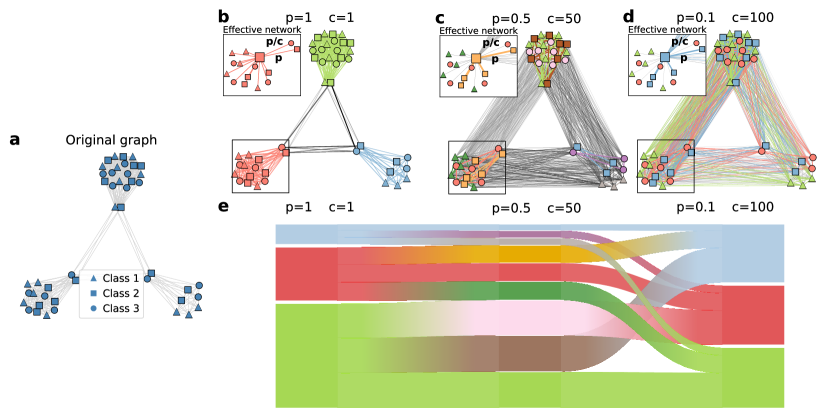
We analysed the range of community partitions found by the map equation’s search algorithm Infomap [22] on the absorption graphs of various synthetic and real-world systems. For each network, we constructed the absorption graph of Eq. (7) for different values of and . To illustrate how the absorption graph can integrate metadata and structural information, we start from a simple example: an unweighted synthetic network with three different classes equally distributed in three fully connected subgraphs with only a few links between them (Fig. 1a). In Fig. 1b-d, we show the partitions in communities identified by Infomap on the absorption graphs obtained for different values of and , corresponding to different ways of mixing structural and metadata information. When and (panel b), metadata play no role, and the best partition consists of three communities, corresponding to the three cliques. As expected, this partition is identical to the one obtained running Infomap on the original graph. When and the absorption graph is identical to the original graph . Varying and strikes a balance between metadata and structure, obtaining other meaningful partitions. When and , our method reveals a total of communities instead of just (Fig. 1c). Each clique has been split in three sub-modules, corresponding to the nodes’ metadata assignments. In general, for large values of , walkers are absorbed before having the chance to move between communities. However, for sufficiently small values of , walkers are able to move to other cliques, and to “see” other nodes belonging to the same class as that of their original node. This leads to another meaningful partition where nodes are grouped by metadata values (Fig. 1d).
II.1 Social contact networks
Several real world contact networks have metadata attached to nodes, providing explicit information about the function or position of any given individual in the system. For instance, the metadata can identify the role of each node of a hospital contact network, or the class to which students of a school belong. Taking into account this information can be crucial to correctly interpret how a system functions.
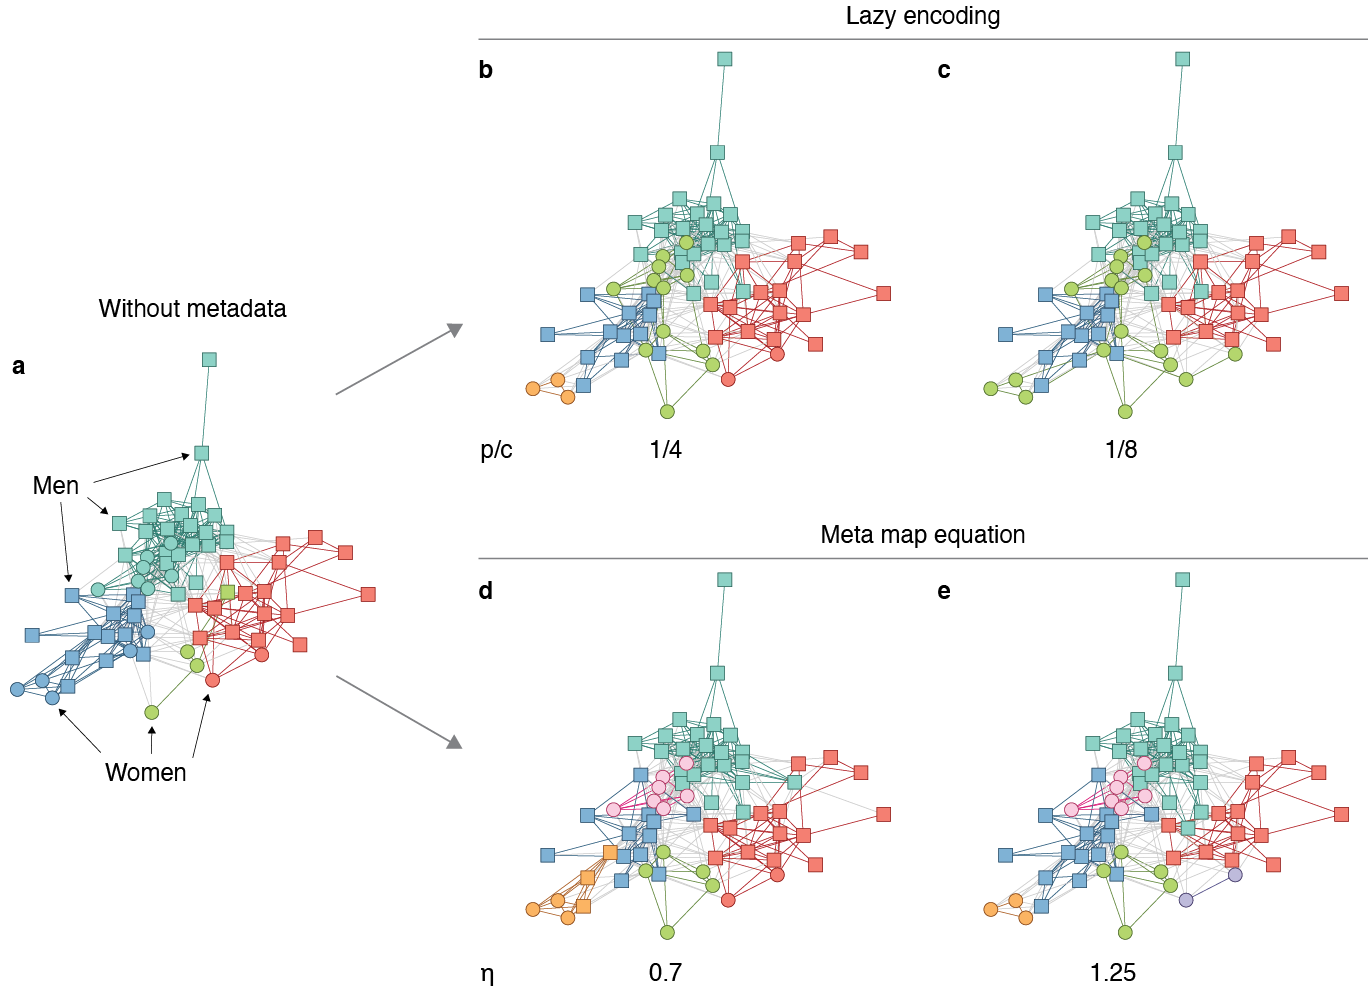
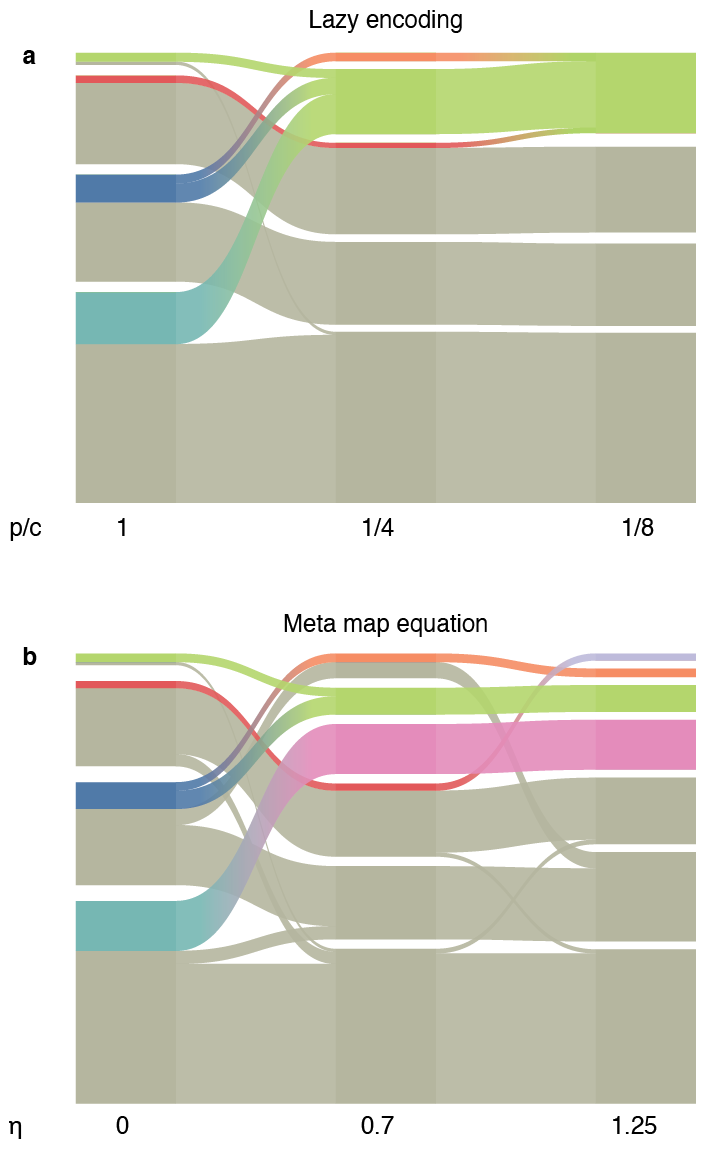
As a first example we considered the Lazega lawyers friendship network [25] with gender information. We report in Fig. 2 the partitions obtained by using different values of the parameters and . In panel a, and , so that no gender information is considered, and the partition is purely relying on the structure of the graph. In panel b and c, instead, the gender of each node increases in relevancy, leading to an almost complete separation between nodes of different genders in c. The transition between structure-focused and metadata-focused partitions is illustrated in the alluvial diagram in Fig. 3a. Infomap puts female nodes in a community of their own for sufficiently low values of , irrespective of the original structural cluster they belonged to. To compare our results with previous work, we reproduced the results obtained using the meta map equation using metadata rate and (ref. [18], Fig. 3). In panel d, the women start to separate from the men, but in different ways. Overall, increasing the meta data rate separates men and women, but tends not to join back clusters consisting of nodes of the same gender. When the metadata rate (panel e), men and women are completely separated, but same-gendered modules are never joined again. As before, the alluvial diagram in Fig. 3b shows how small sub-clusters of female nodes are isolated from larger clusters of male ones, and never aggregated.
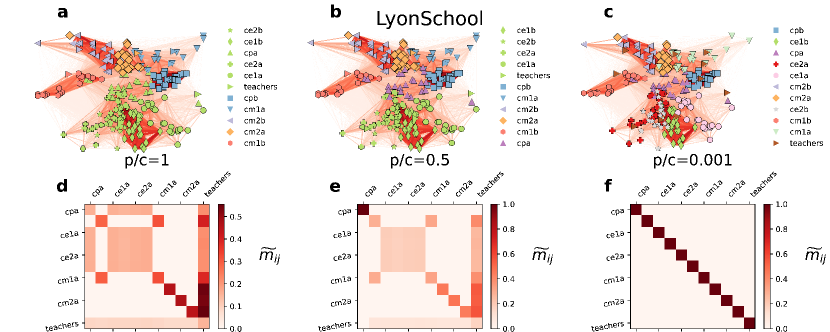
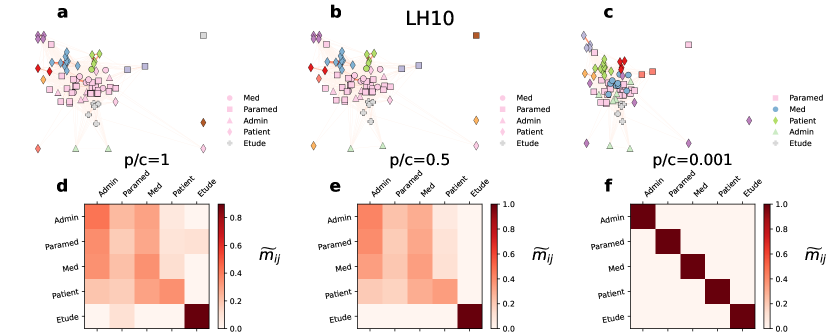
As another example of metadata-enriched social networks, we consider the Lyon School contact graph [26], which is one of several annotated social networks made available by the SocioPatterns project [27]. The graph reports the face-to-face interactions among students in a school of Lyon. For each node, we know whether the corresponding person is a student or a teacher and to which class she belongs. In total, the data set consists of a dense network with nodes, links, and eleven node classes (10 classrooms plus teachers). In Fig. 4, we display the partitions obtained for and (a), (b), and (c). By increasing , the class of each node becomes more relevant and the structural communities start to split. Teachers are the last metadata class to be recovered because the majority of face-to-face contacts of each teacher happen with pupils in their respective class. The matrices of class overlap (see Methods for details) clarifies the role of , and shows how all nodes assigned to the same class end up in the same community when is sufficiently large and the probability for a walker to be absorbed at any node is relatively small. For additional results using two other social networks, see Supplementary Figs. S-1 and S-2.
II.2 Organisation of activities in urban areas
The proposed methodology can help identify functional modules in spatial systems. Standard community detection algorithms often do not provide the desired results on spatially-embedded networks. The spatial constraints are too strong to allow communities whose nodes are too far apart from each other. However, metadata is often available in spatial networks, and taking this information into account when detecting modules is desirable in many concrete applications. Typical examples include analysing spatial correlation in the distribution of certain commercial activities or identifying spatial segregation according to a specific socio-economic indicator.
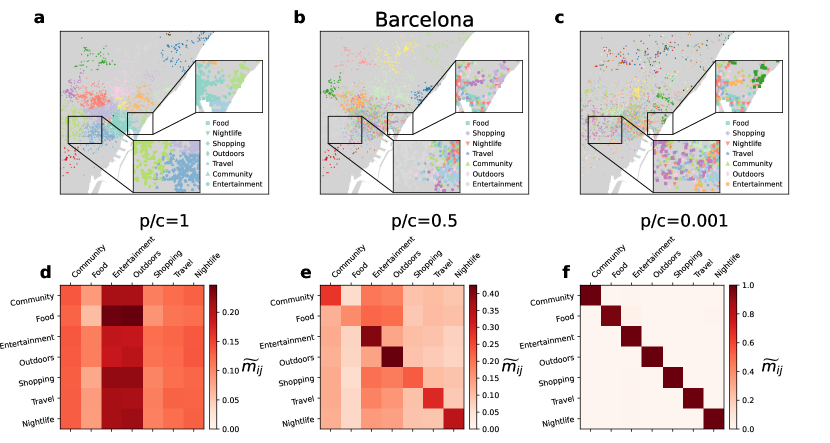
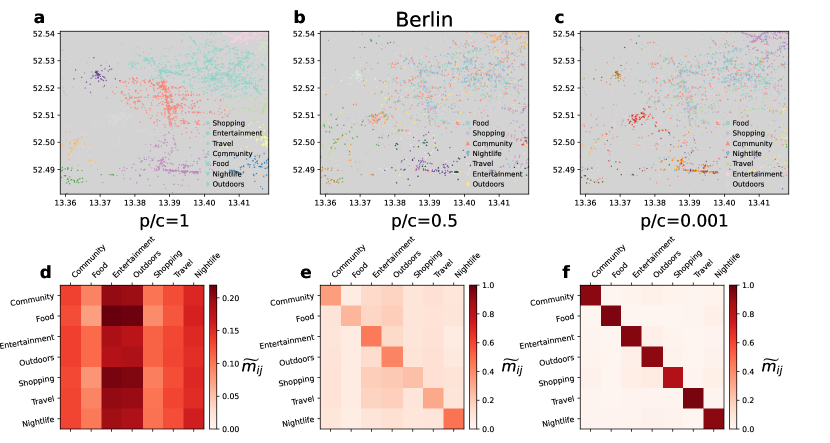
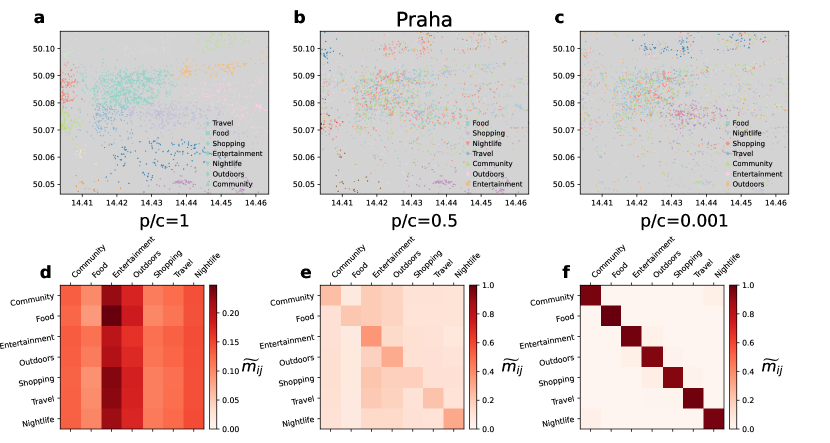
We consider a spatial data set constructed from the location-based social network Gowalla [28, 29], which includes the location and type of millions of venues across the world. Whereas in this data set each venue has multiple classes organised in a hierarchical way, we have only analysed the main six categories: food, nightlife, outdoors, community, entertainment and travel. The graph connecting the venues is spatial so that there is a link between any pair of venues if the distance separating them is lower than km and the weight of each link is given by [30]. Figure 5 shows the partitions obtained on the network of commercial activities in Barcelona for and (a), (b) and (c). For , the venues are organised in spatial communities, determined solely by the relative distance among nodes. Already for , some of the communities split out, leading to a grouping of venues of the same type. Still, the more isolated spatial communities do not split out until , where the vast majority of venues of the same category are clustered together. Whereas the results shown in Fig. 5 correspond to , by changing we can also tune the typical size of the spatial communities, with higher values leading to smaller groups. For additional results using three other cities, see Supplementary Figs. S-3 and S-4.
II.3 Income distribution and mobility in London
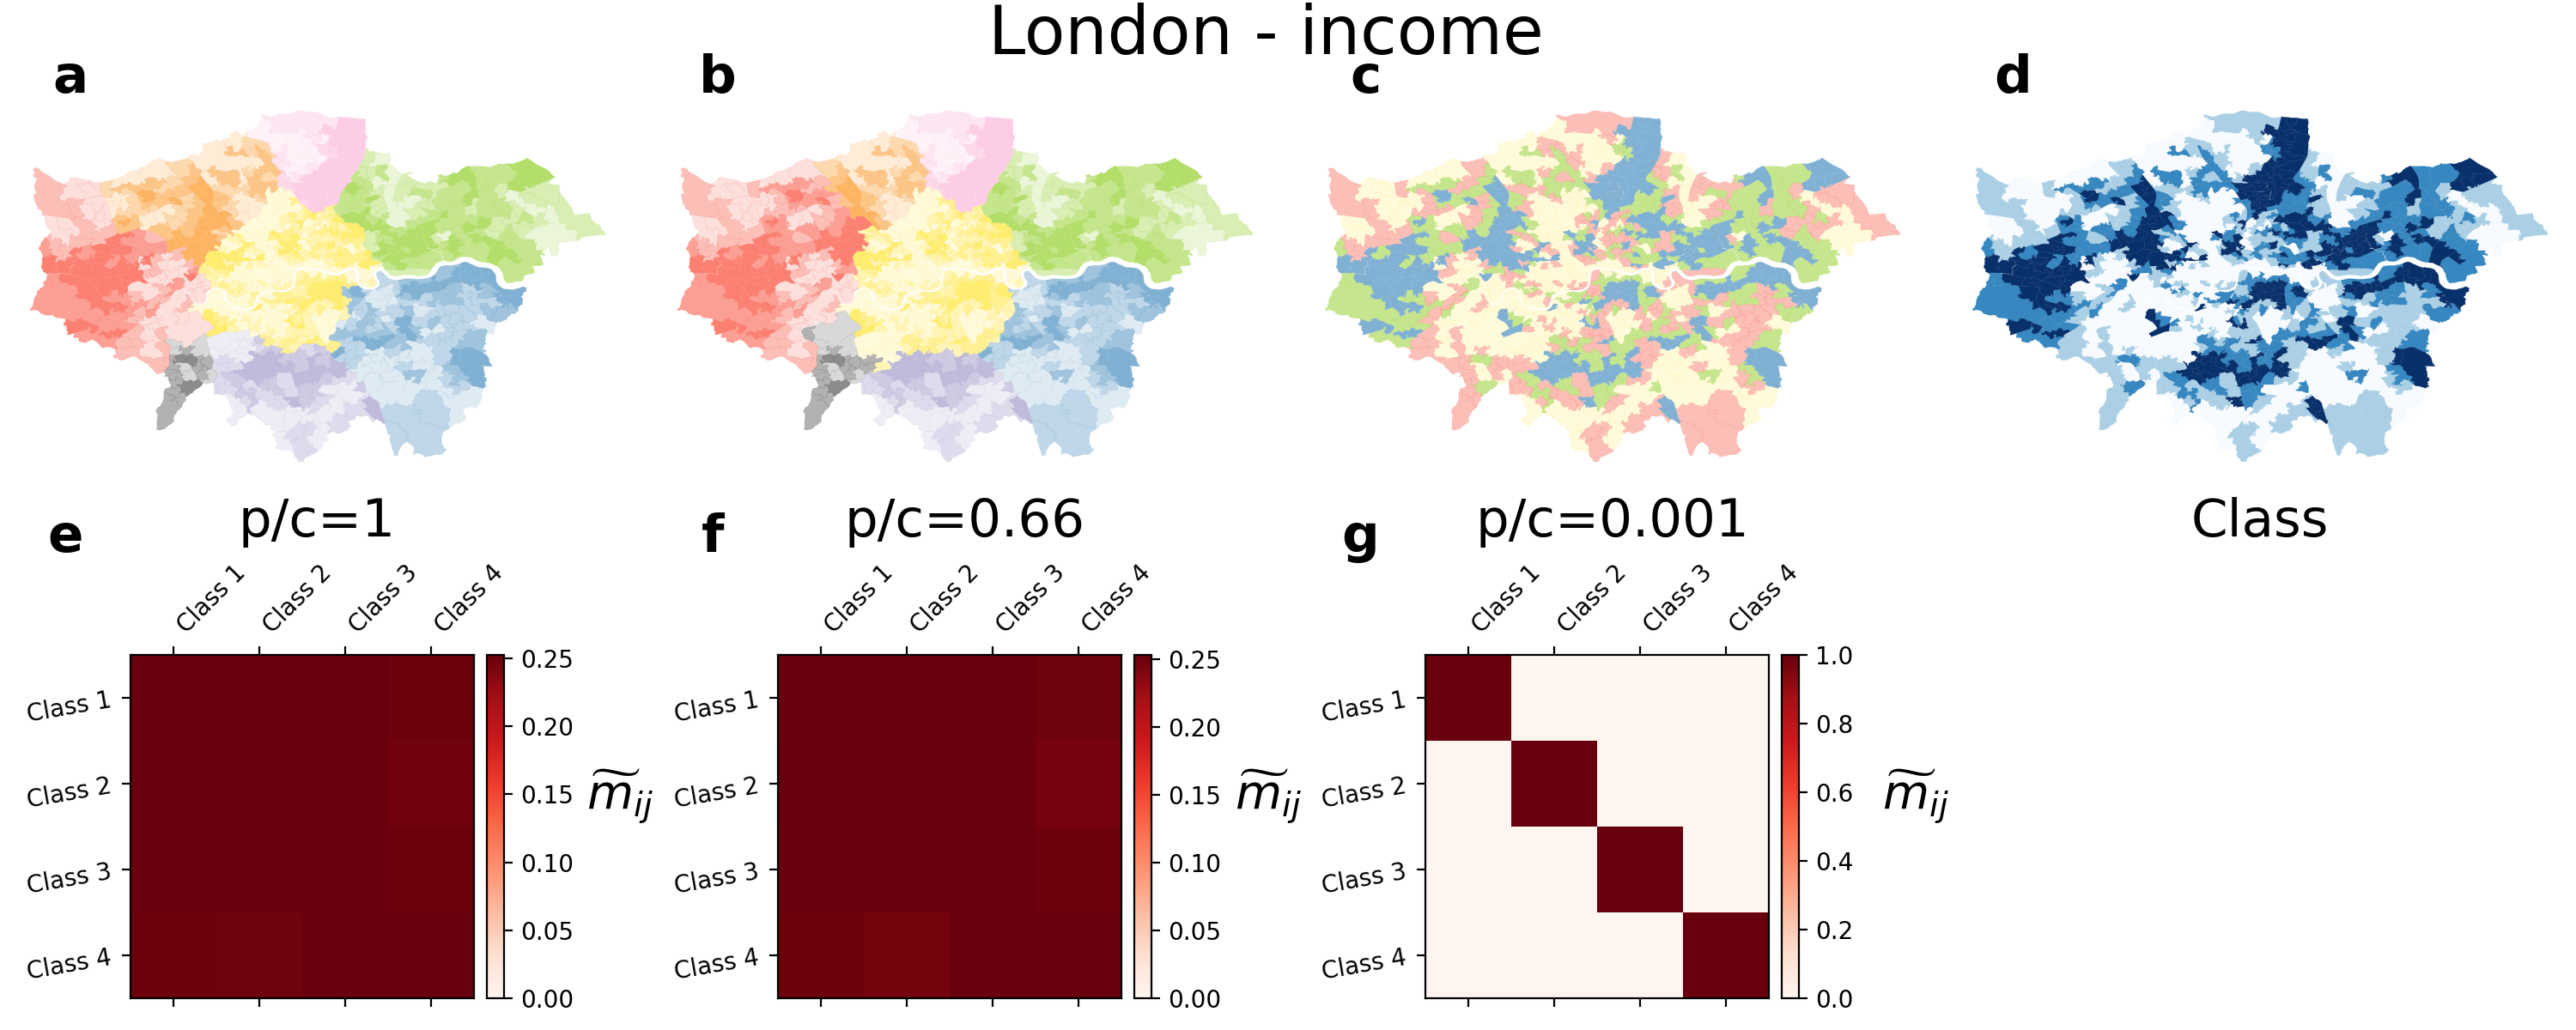
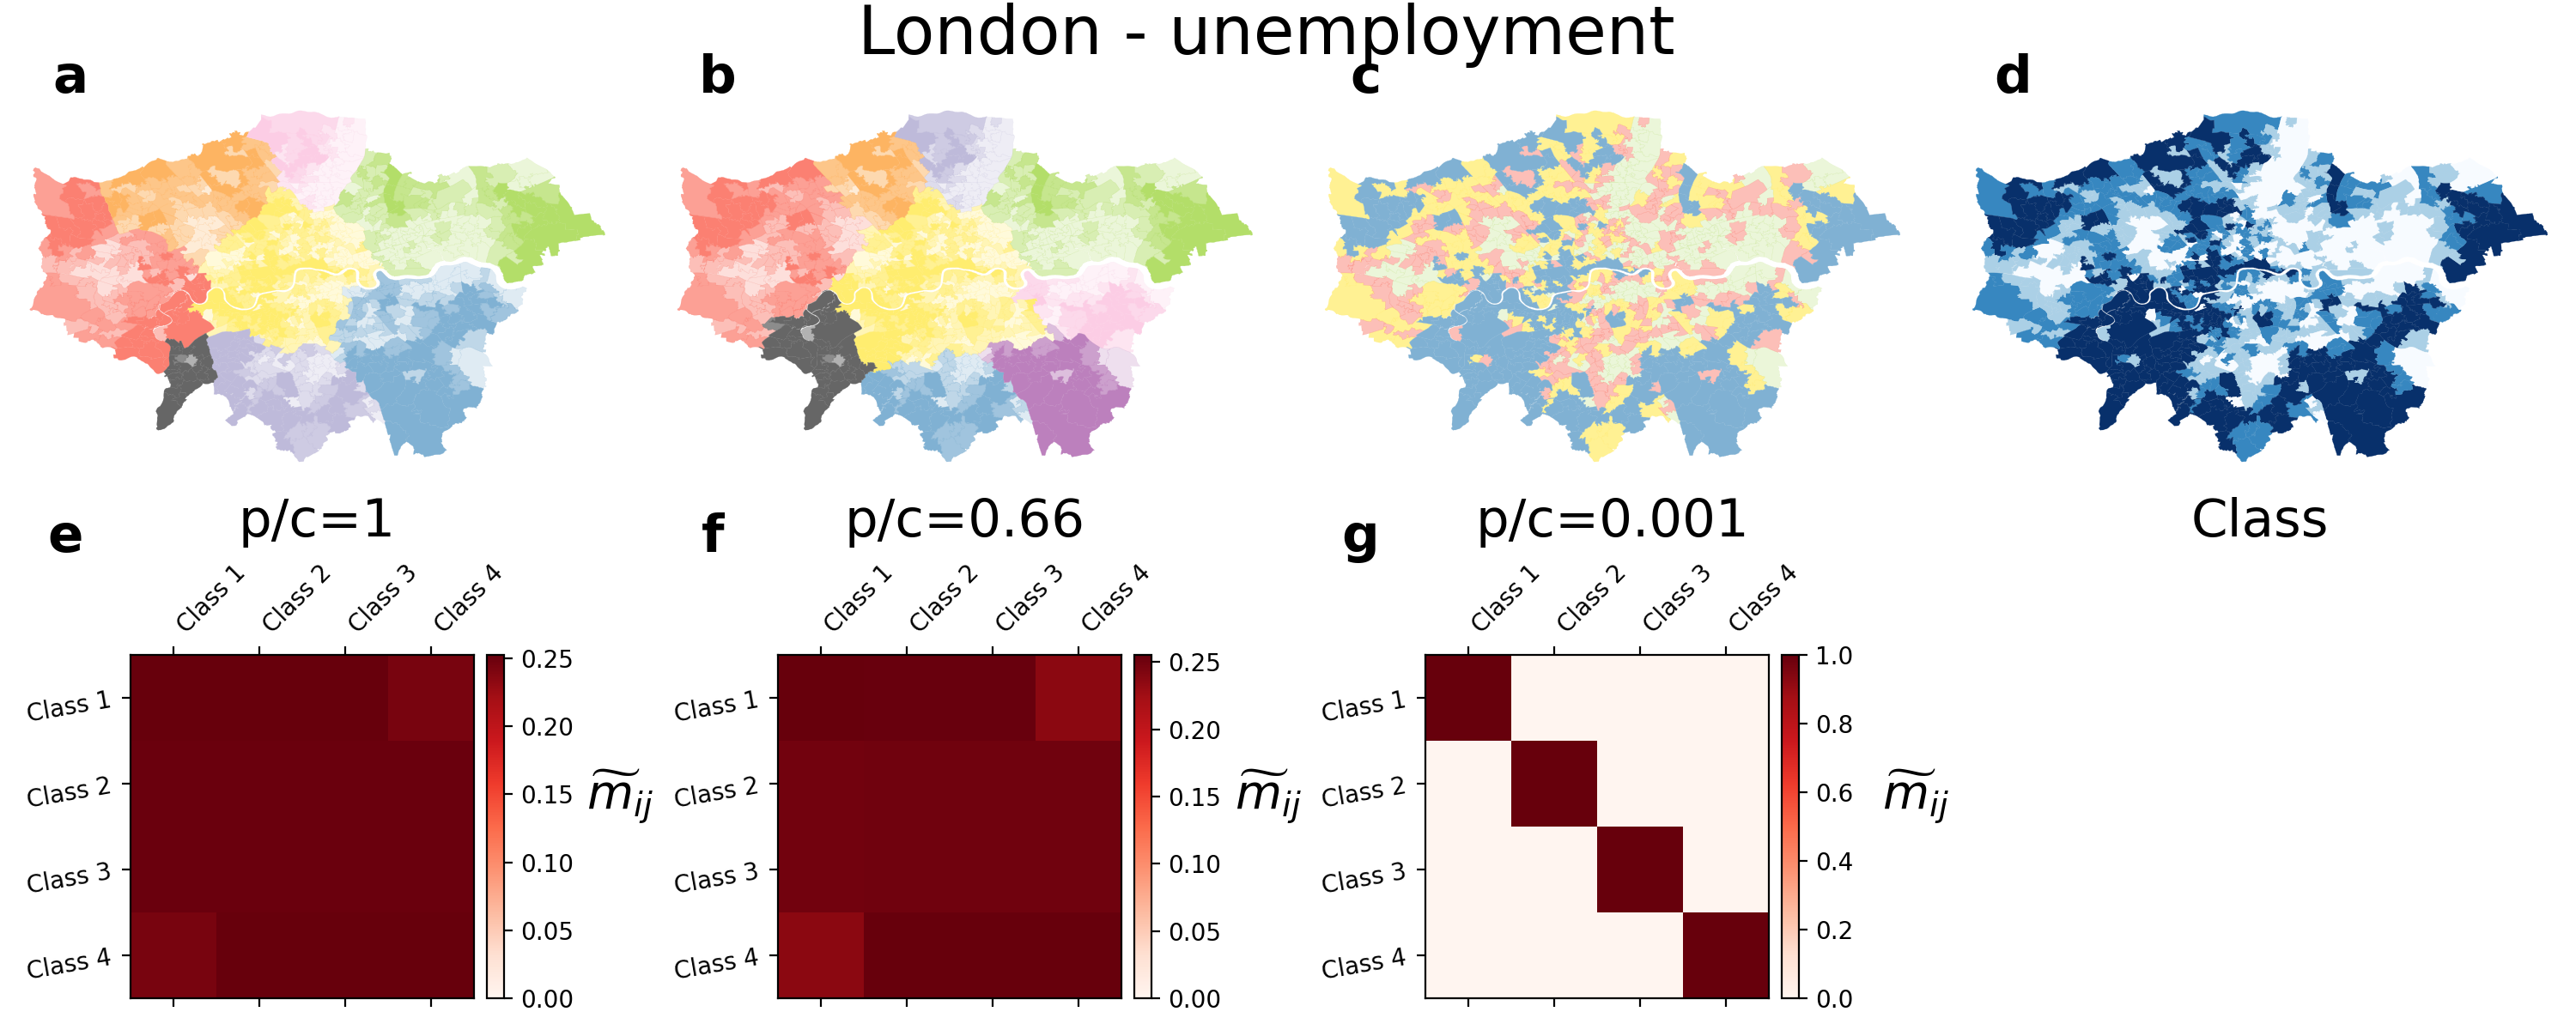
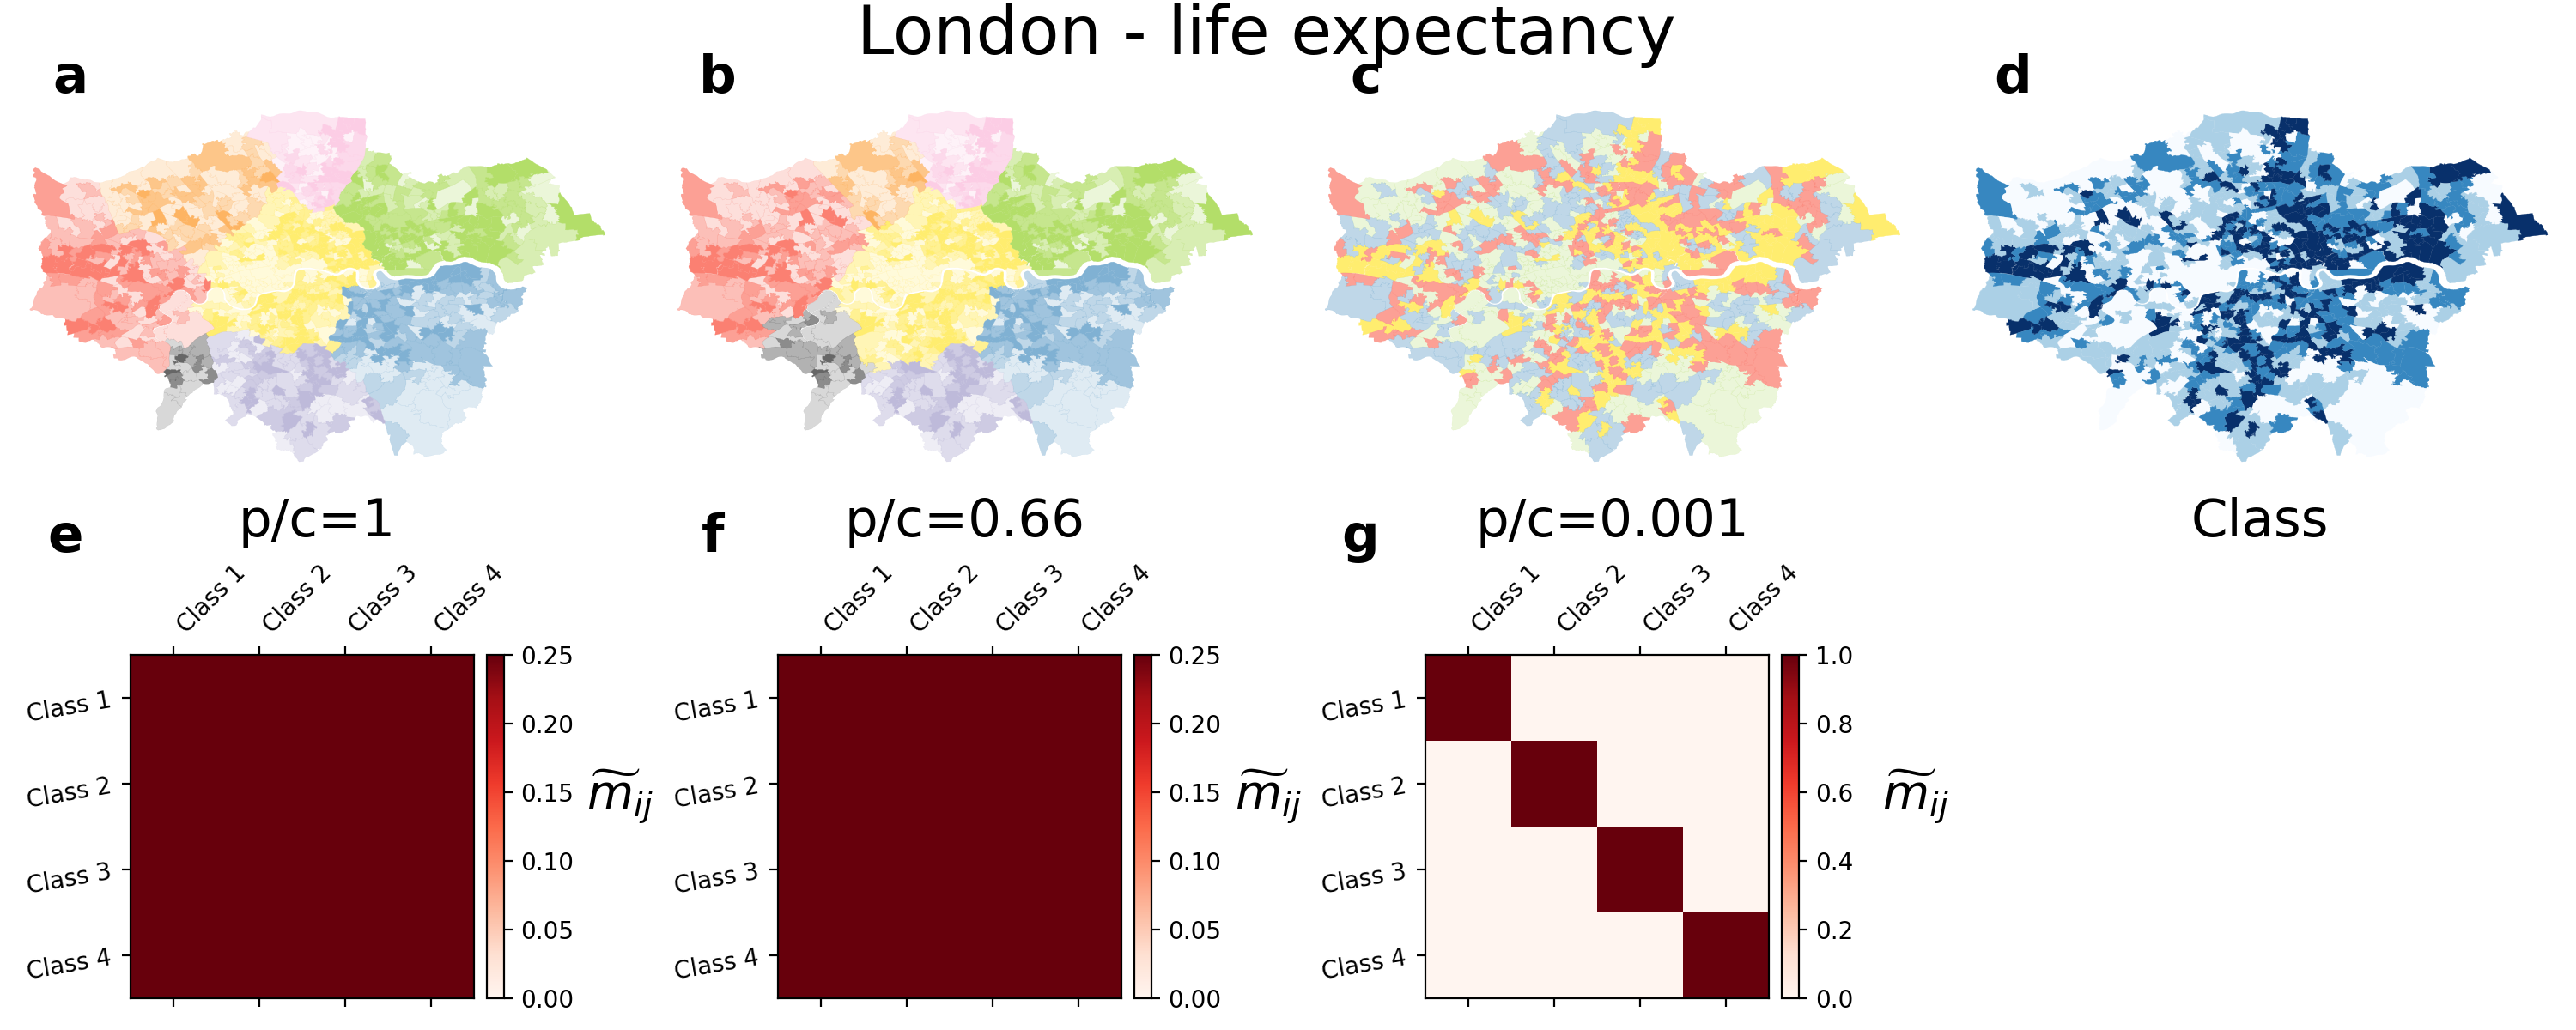
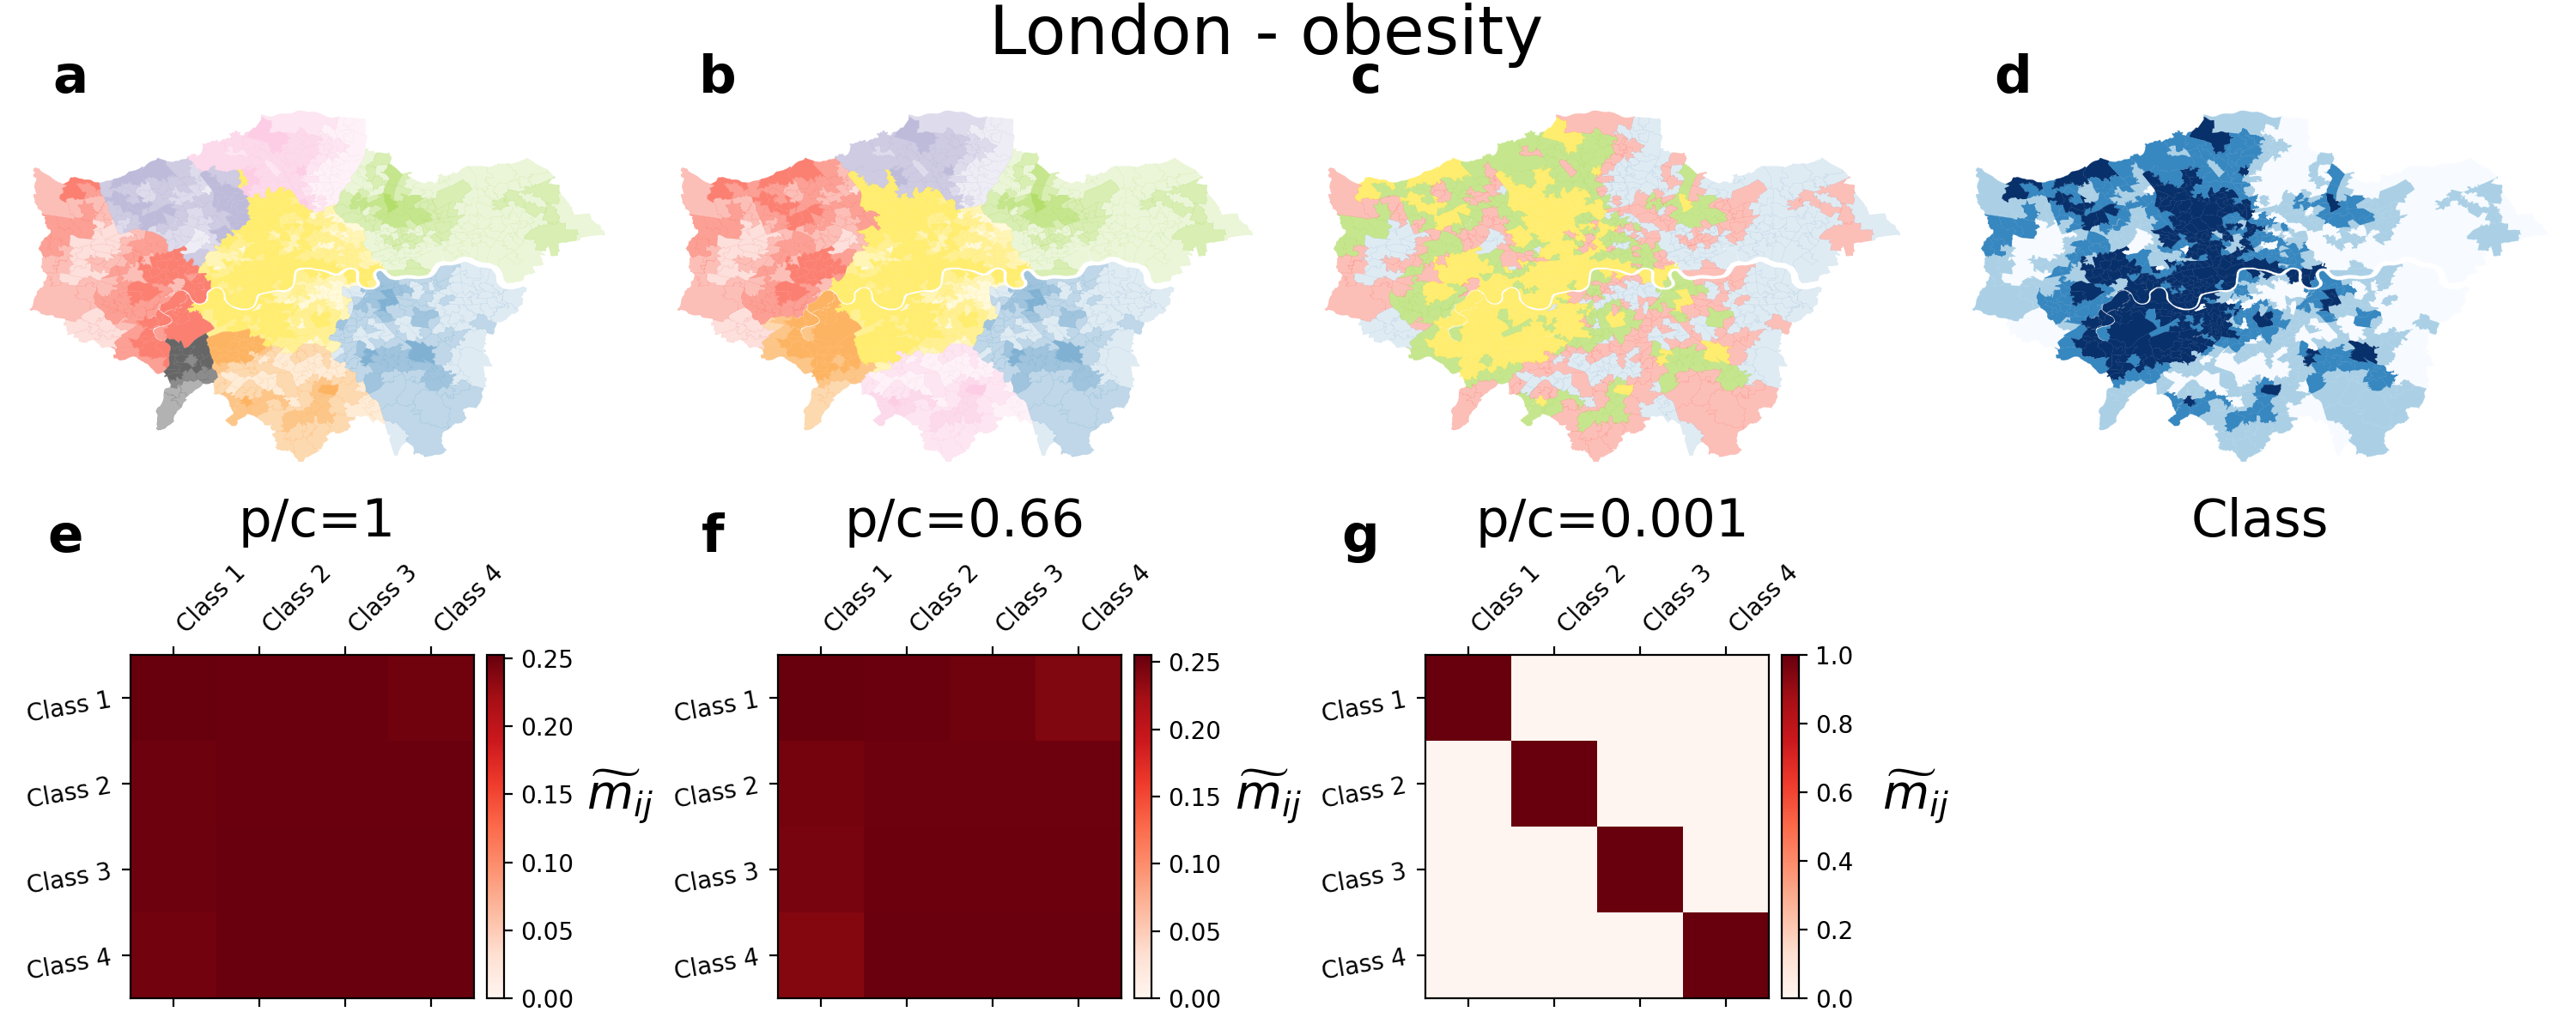
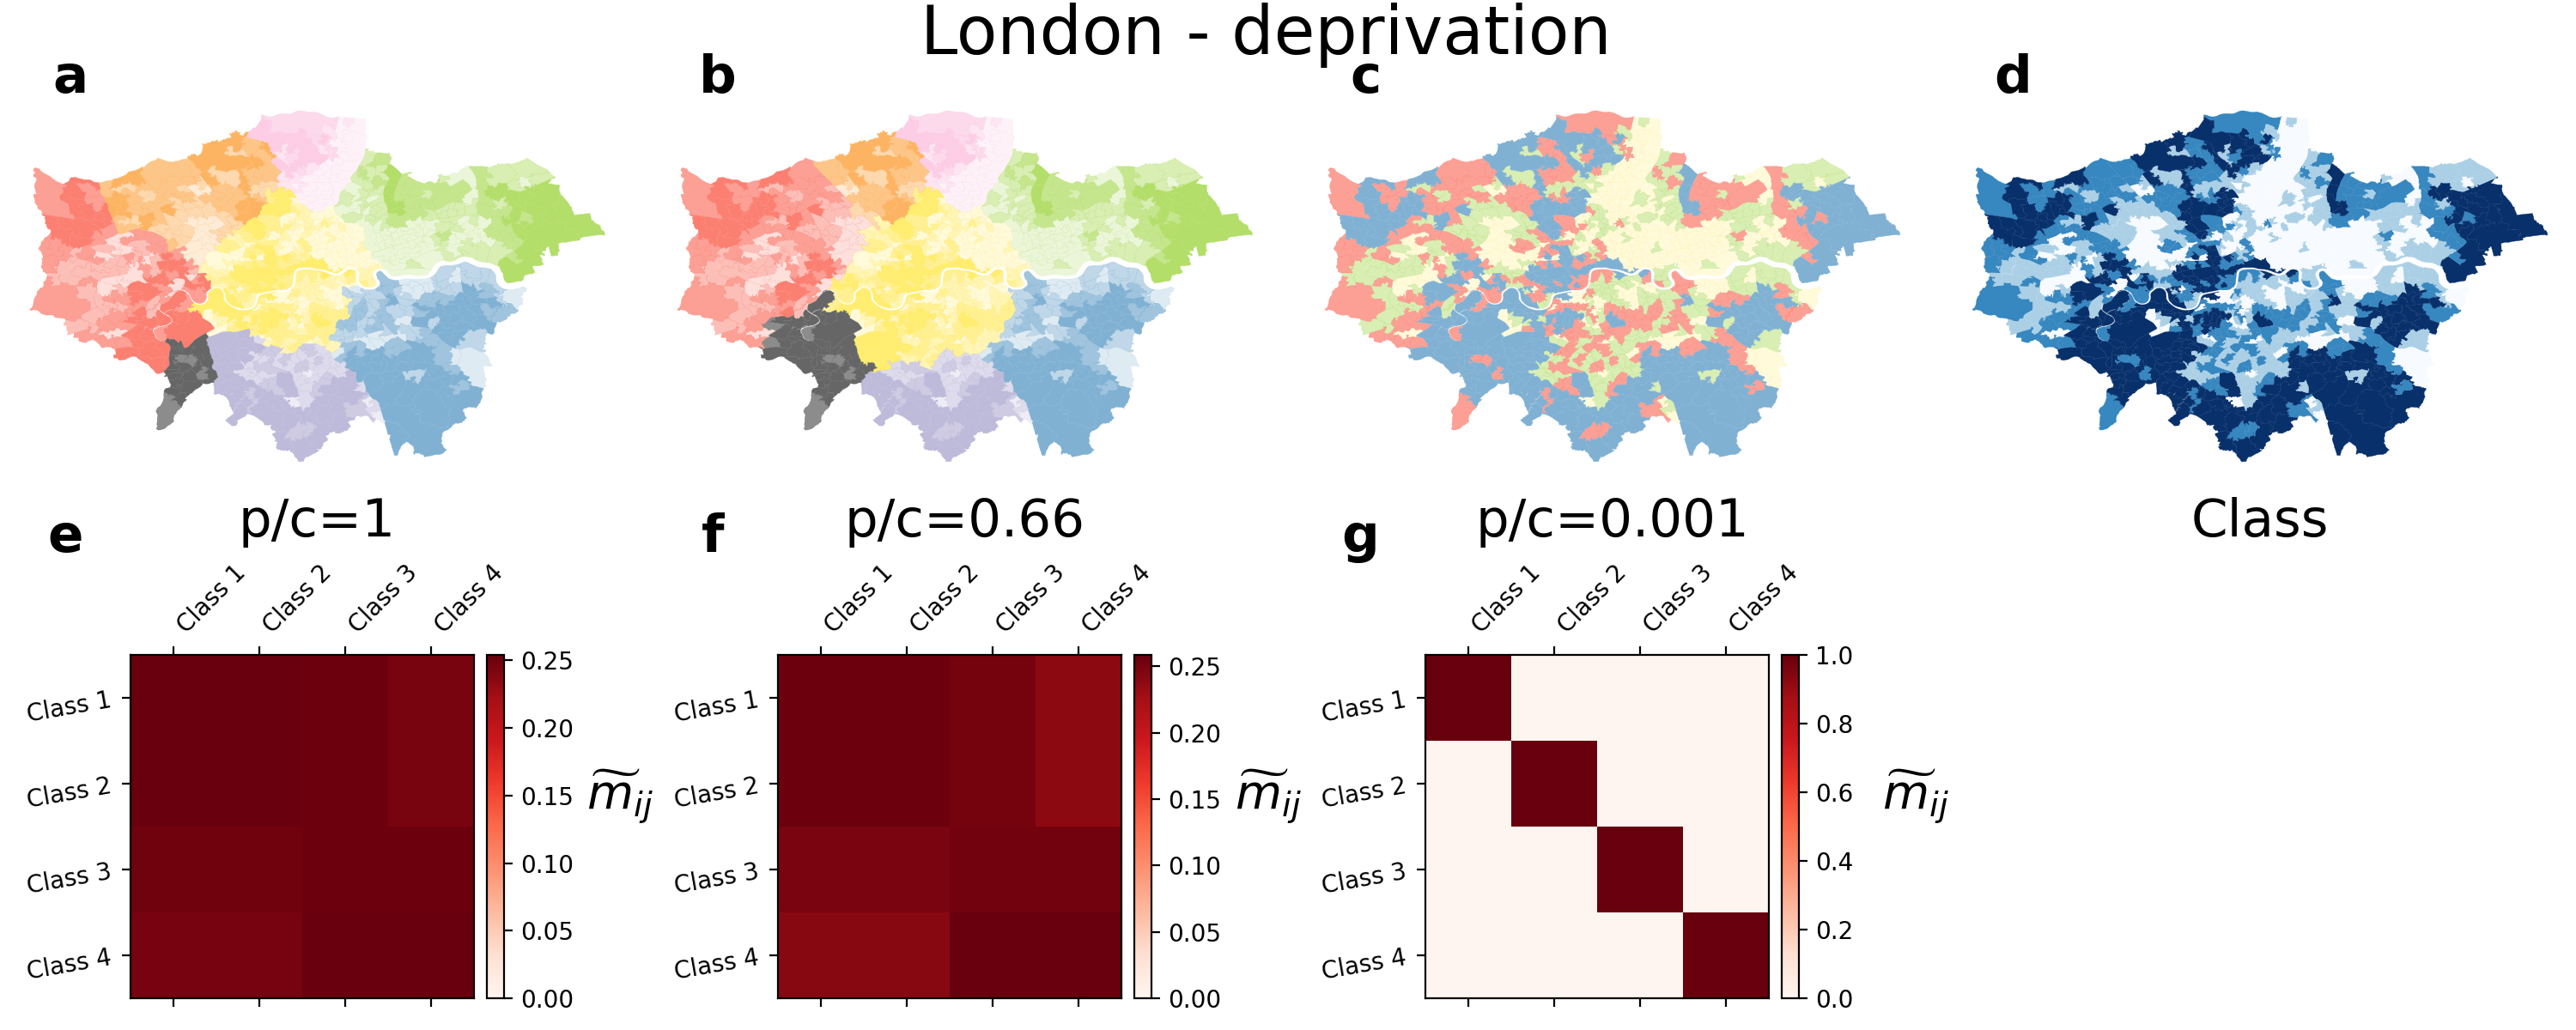
In spatial systems, networks can be defined in multiple ways, not only according to the distance separating two regions, but also according to the number of people that move between places. We show the partitions in communities obtained for the mobility network of London, where the median household income of an area is the relevant metadata. We considered Greater London at the level of Middle Layer Super Output Areas (MSOAs), where each MSOA is a node and the weighted network connecting MSOAs is based on the mobility of commuters (See Methods for details). Each node is associated to one of four classes according to the median income of the households in the corresponding region. Each class represents a quartile of the median income distribution, with class being most deprived and class the wealthiest. The results are shown in Fig. 6 for and (a), (b) and (c). By increasing the relative importance of metadata (Fig.6d), we obtained significant changes in the partitions. In particular, when is small, the modules are effectively determined mainly by spatial distance, while only four communities based on metadata information are obtained when . The changes in the partitions can be more clearly observed in Fig. 6e-g, where the increase of affects the number of MSOAs of the same income category assigned to the same community. In Supplementary Figs. S-5, S-6, S-7, and S-8 we show similar results for other metadata quantities.
II.4 Power grid network
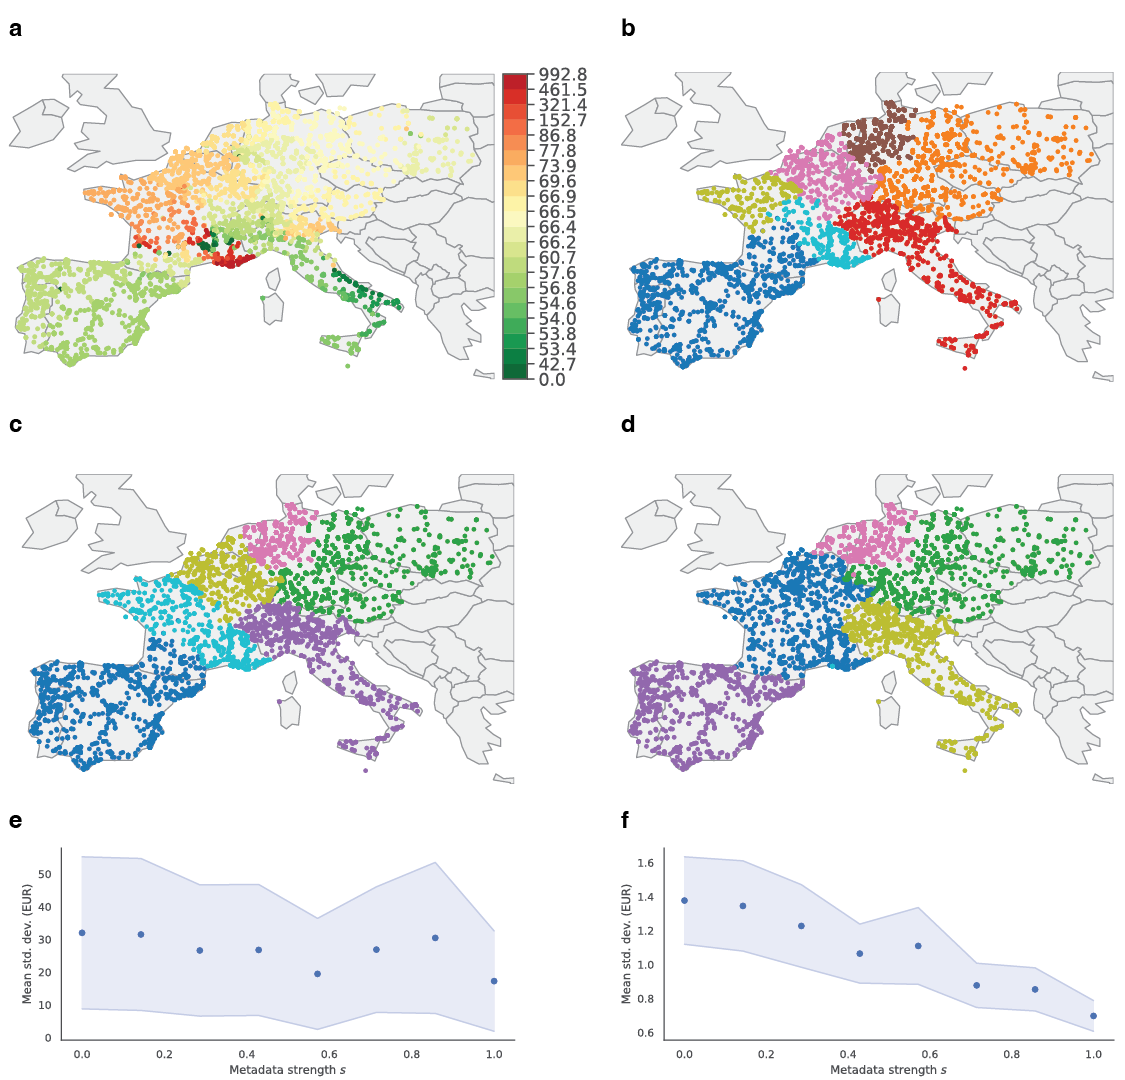
As a final example, we consider the European electrical power grid, which forms a transport network connecting electricity producers and consumers. This system is structured in a similar way to a road transport network, with “highways” between large hubs, connecting smaller neighbouring cities. Yet electricity can flow instantly all across Europe, making it a large and dynamic system to consider as a whole. Each node has an associated electricity price. In the analysed situation, the price distribution is relatively heterogeneous, with low-price regions mainly around southern Europe with high solar production, average-price ones in central Europe, and high-price regions in western Europe (Fig. 7a). Overall, prices are correlated in space, but price ranges do not necessarily map into countries or other political divisions. Bidding zones for energy markets were historically defined by country borders. However, the European Institutions wants to revise them to make energy markets more efficient over more coherent and connected price zones, or communities, that do not depend on country borders.
To include real-valued prices as metadata in the lazy encoding random walk, we derived the coding probability using the price distance between nodes. We started random walks per node to achieve ergodic visit rates, repeating the simulation with metadata strength varying between and . We ran 100 optimisation trials with Infomap for each simulation and chose the partition with the lowest codelength.
The resulting partitions have six or seven levels of nested modules, organised into six or seven top-level super modules (one module with four exceptionally high price nodes in Fig. 7d). Western Europe organises into fewer modules with increasing metadata strength , and the southern-western Europe border appear (Fig. 7b-d). With increasing metadata strength, the mean module-price variance decreases monotonically on the leaf level (Fig. 7f). On the top level, the behaviour is erratic but overall trending towards lower variance (Fig. 7e). Overall, incorporating metadata in the community detection task provided a more nuanced picture of the correlations between energy price and geography beyond country borders while still defining connected zones.
III Discussion
Integrating structural and metadata information beyond nodes’ first neighbours has been a standing challenge in network-based data analysis. We have shown how to include metadata in the map equation with metadata-dependent absorbing random walks. By coupling the absorption probability to the metadata of nodes, the absorbing random walk dynamics produce a tunable lazy encoding scheme: The metadata modulate a walker’s coding horizon, simultaneously accounting for the node classes’ distribution and their correlations in the network. This approach equips researchers with a tool for identifying mesoscale structures in networks based on link structure and discrete or continuous node metadata information.
Often metadata about the components of a system are as relevant as knowing how those components connect. A researcher must use her application-specific knowledge when deciding how much metadata information she should include when identifying functional modules of a complex system. Few algorithms for community detection consider metadata [15, 18], and those that do impose heavy constraints either on the relative role of structure and metadata or on the way they use metadata. For instance, current algorithms for detecting flow-based communities further divide communities into smaller metadata-based sub-clusters.
To enable related sub-clusters to merge or groups of nodes to move from one cluster to another based on their metadata, we propose a simple formalism to modify the encoding procedure of the map equation. Metadata-dependent absorption probabilities at each node induce an absorption graph that encodes the relative importance of structure and metadata. In general one could use any community-detection algorithm for weighted and directed links on the absorption graph, and interpret the results. However, using the map equation’s search algorithm Infomap provides a principled interpretation: A tunable lazy encoding scheme, which extends and generalises the standard map equation formalism in a natural way.
Tunable absorption probabilities allow the researcher to incorporate specific field knowledge in community detection easily. In the examples, we have shown how different values of and give various relevant solutions. In general, larger values of let walkers visit larger portions of the graphs before being absorbed, allowing for relatively distant nodes with similar metadata to be clustered together. Similarly, smaller values of tend to yield larger clusters. A single recipe for setting and is not only unavailable but also not needed. A user benefits from exploring the parameter space and selecting the most meaningful ranges of and that provide informative partitions.
Linking network structure and metadata through the dynamics of random walks on networks in our compression-based approach opens a new avenue for community detection. Various types of information about nodes and edges, such as the physical location of nodes, edge classes, or other exogenous classification and rankings, provide enticing directions to explore for new insights about complex systems.
IV Methods
IV.1 Class overlap
We assess the extent to which nodes with different categorical metadata information are assigned to the different (or the same) communities by proposing the class overlap between classes and . The class overlap
| (10) |
where are the communities reported by our algorithm, is the total number of nodes of class , and is the total number of nodes of class in module .
This quantity is equal to one when the classes and are evenly divided and zero when the nodes of those classes are in separate communities. For easy comparison between different classes, the final quantity we have considered is its row-normalised counterpart given by
| (11) |
This metric assesses how nodes with different (or equal) metadata information are assigned to the same community when the lazy encoding is tuned.
IV.2 Commuting network in London
The commuting data analysed in the income and mobility section (see data availability) includes the number of individuals that live in a spatial unit (MSOA) and work in a spatial unit . From those commuting patterns, we have built the mobility network between MSOAs in which the weight of a link going from a spatial unit to a spatial unit is given by . The graph is then a reflection of the back-and-forth trips performed by working individuals. While the graph produced is of directed type, in practice we can state that by construction.
V Acknowledgements
AB acknowledges the financial support of the Ministerio de Economía y Competitividad and the Ministerio de Ciencia e Innovación of Spain under grant no. FJC2019-038958-I. VN acknowledges support from the EPSRC New Investigator Award Grant No. EP/S027920/1.
VI Data availability
We obtained the Lazega lawyers friendship network[25] from https://www.stats.ox.ac-.uk/~snijders/siena/Lazega_lawyers_data.htm. The social contact networks are available from the SocioPatterns project[26, 27]. We downloaded the income and commuting data for London from https://data.gov.uk/dataset/d91901cb-13ee-4d00-906c-1ab36588943b/msoa-atlas and http://www.nomisweb.co.uk/census/2011/wu03EW, respectively. The Gowalla check-in data from ref. [29] can be downloaded from http://www.yongliu.org/datasets/. The power grid data set is available for download from https://github.com/mapequation/metadata-informed-community-detection-data.
Appendix A Additional results for contact networks
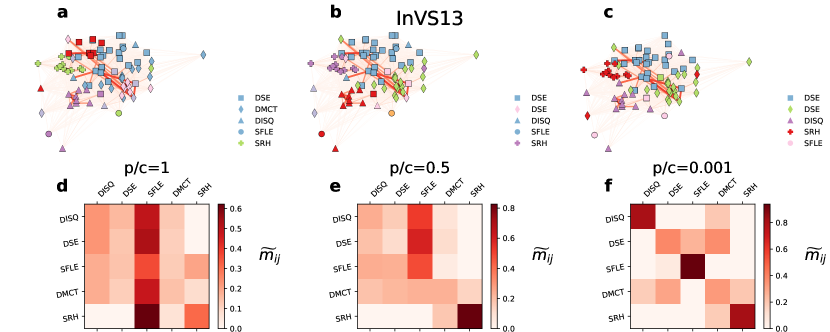
We provide in Supplementary Figs. S-8 and S-9 additional results of the communities detected for a workplace (InVS13) and a Hospital (LH10).
Appendix B Additional results for urban activities
In this section, we provide similar results on the spatial clusterisation for urban activities in Berlin (Supplementary Fig. S-10) and Prague (Supplementary Fig. S-11).
Appendix C Additional results for the commuting network of London
We provide in Supplementary Figs. S-12, S-13, S-15 and S-14 additional results for the London commuting graph when classes are assigned according to unemployment, life expectancy, deprivation and obesity respectively.
References
- Newman [2003] M. E. J. Newman, SIAM Review 45,, 167 (2003), eprint cond-mat/0303516.
- Barrat et al. [2008] A. Barrat, M. Barthélemy, and A. Vespignani, Dynamical processes on complex networks (Cambridge University Press, 2008), ISBN 9781107626256.
- Latora et al. [2017] V. Latora, V. Nicosia, and G. Russo, Complex Networks: Principles, methods and applications (Cambridge University Press, 2017), ISBN 9781107103184.
- Pons and Latapy [2005] P. Pons and M. Latapy, in International symposium on computer and information sciences (Springer, 2005), pp. 284–293.
- Newman [2006] M. E. Newman, Proceedings of the national academy of sciences 103, 8577 (2006).
- Lancichinetti and Fortunato [2009] A. Lancichinetti and S. Fortunato, Physical review E 80, 056117 (2009).
- Peel et al. [2018] L. Peel, J.-C. Delvenne, and R. Lambiotte, Proceedings of the National Academy of Sciences 115, 4057 (2018).
- Cinelli et al. [2020] M. Cinelli, L. Peel, A. Iovanella, and J.-C. Delvenne, Physical Review E 102, 062310 (2020).
- Bliss et al. [2014] C. A. Bliss, M. R. Frank, C. M. Danforth, and P. S. Dodds, Journal of Computational Science 5, 750 (2014).
- Hric et al. [2016] D. Hric, T. P. Peixoto, and S. Fortunato, Physical Review X 6, 031038 (2016).
- Bassolas and Nicosia [2021] A. Bassolas and V. Nicosia, Communications Physics 4, 1 (2021).
- De Domenico et al. [2013] M. De Domenico, A. Solé-Ribalta, E. Cozzo, M. Kivelä, Y. Moreno, M. A. Porter, S. Gómez, and A. Arenas, Phys. Rev. X 3, 041022 (2013), URL https://link.aps.org/doi/10.1103/PhysRevX.3.041022.
- Boccaletti et al. [2014] S. Boccaletti, G. Bianconi, R. Criado, C. del Genio, J. Gómez-Gardeñes, M. Romance, I. Sendiña-Nadal, Z. Wang, and M. Zanin, Physics Reports (2014), ISSN 0370-1573, URL http://dx.doi.org/10.1016/j.physrep.2014.07.001.
- Battiston et al. [2017] F. Battiston, V. Nicosia, and V. Latora, The European Physical Journal Special Topics 226, 401 (2017), ISSN 1951-6401, URL https://doi.org/10.1140/epjst/e2016-60274-8.
- Peel et al. [2017] L. Peel, D. B. Larremore, and A. Clauset, Science Advances 3 (2017), eprint https://advances.sciencemag.org/content/3/5/e1602548.full.pdf, URL https://advances.sciencemag.org/content/3/5/e1602548.
- Kitromilidis and Evans [2018] M. Kitromilidis and T. S. Evans, arXiv preprint arXiv:1802.07985 (2018).
- Newman and Clauset [2016] M. E. Newman and A. Clauset, Nature communications 7, 1 (2016).
- Emmons and Mucha [2019] S. Emmons and P. J. Mucha, Physical Review E 100, 022301 (2019).
- Smith et al. [2016] L. M. Smith, L. Zhu, K. Lerman, and A. G. Percus, ACM Transactions on Knowledge Discovery from Data (TKDD) 11, 1 (2016).
- Nicosia et al. [2014] V. Nicosia, M. De Domenico, and V. Latora, EPL (Europhysics Letters) 106, 58005 (2014).
- Bassolas et al. [2021] A. Bassolas, S. Sousa, and V. Nicosia, Journal of the Royal Society Interface 18, 20200961 (2021).
- [22] Edler, Daniel, Eriksson, Anton and Rosvall, Martin, The mapequation software package, http://www.mapequation.org, online; accessed 23 April 2021.
- Masuda et al. [2017] N. Masuda, M. A. Porter, and R. Lambiotte, Physics reports 716, 1 (2017).
- Rosvall and Bergstrom [2008] M. Rosvall and C. T. Bergstrom, Proceedings of the National Academy of Sciences 105, 1118 (2008).
- Lazega et al. [2001] E. Lazega et al., The collegial phenomenon: The social mechanisms of cooperation among peers in a corporate law partnership (Oxford University Press on Demand, 2001).
- Génois and Barrat [2018] M. Génois and A. Barrat, EPJ Data Science 7, 11 (2018).
- [27] SocioPatterns, SocioPatterns –, http://www.sociopatterns.org, online; accessed 23 April 2021.
- Cho et al. [2011] E. Cho, S. A. Myers, and J. Leskovec, in Proceedings of the 17th ACM SIGKDD international conference on Knowledge discovery and data mining (2011), pp. 1082–1090.
- Liu et al. [2014] Y. Liu, W. Wei, A. Sun, and C. Miao, in Proceedings of the 23rd ACM International Conference on Conference on Information and Knowledge Management (2014), pp. 739–748.
- Noulas et al. [2021] A. Noulas, S. Scellato, C. Mascolo, and M. Pontil, Proceedings of the International AAAI Conference on Web and Social Media 5, 570 (2021), URL https://ojs.aaai.org/index.php/ICWSM/article/view/14175.