On the Origin of Gamma-ray Flares from Bright Fermi Blazars
Abstract
The origin of -ray flares observed from blazars is one of the major mysteries in jet physics. We have attempted to address this problem following a novel spectral energy distribution (SED) fitting technique that explored the flaring patterns identified in the broadband SEDs of two -ray bright blazars 3C 279 () and 3C 454.3 (), using near-simultaneous radio-to--ray observations. For both sources, the -ray flux strongly correlates with the separation of the SED peaks and the Compton dominance. We propose that spectral hardening of the radiating electron population and/or enhancement of the Doppler factor can naturally explain these observations. In both cases, magnetic reconnection may play a pivotal role in powering the luminous -ray flares.
1 Introduction
The -ray emission from flat-spectrum radio quasars (FSRQs) offers a powerful diagnostic tool to probe the innermost regions of jets and their surroundings. FSRQs are a special class of active galactic nuclei (AGN) having relativistic jets oriented close to the line of sight to the observer and characterized by broad optical emission lines. The typical spectral energy distribution (SED) of an FSRQ is dominated by the non-thermal jet emission and is characterized by two broad bumps. In the widely accepted leptonic emission scenario, the low-energy bump produced by the synchrotron process peaks in the sub-millimeter (mm) or the infrared (IR)-optical energy regime. The high energy bump, on the other hand, produced by inverse Compton scattering, peaks in the MeV range, leading to a steep -ray spectrum in the GeV energy band (e.g., Ajello et al., 2020). These intriguing objects exhibit flux variations at all accessible wavelengths with the most extreme variability, on the timescale of hours or less, observed at GeV energies (see, e.g., Foschini et al., 2011). During high-activity states, many FSRQs show a rising -ray spectrum in , indicating a shift of the inverse Compton peak from MeV to GeV energies (cf. Paliya et al., 2016). In a few cases, the associated synchrotron peak is also observed to shift from far-IR to optical-UV energies (e.g., Angioni et al., 2019). On the other hand, there are observations indicating that only the inverse Compton peak shifted to higher frequencies without any significant change in the synchrotron peak (Paliya et al., 2016). Such contrasting behaviors indicate the complex interplay between particle acceleration and radiation mechanisms in relativistic jets and, at the same time, provide tantalizing clues to explore the underlying causes responsible for the flux variability. The key to understanding the origin of -ray flares lies in unraveling the spectral patterns shown by FSRQs across the electromagnetic spectrum.
We have attempted to address this outstanding problem by carrying out a systematic study of the broadband SEDs of two well-known -ray detected blazars, namely 3C 279 () and 3C 454.3 (). The motivation is to understand the evolution of the low- and high-energy SED peaks as a function of the -ray activity following a novel SED fitting approach which treated the SED peak transitions separately. We further developed a theoretical model to decipher the observed patterns revealing the origin of -ray flares. We selected 3C 279 and 3C 454.3 because these are among the brightest -ray blazars with hundreds of existing multi-wavelength observations supplemented with more-than-a-decade of continuous monitoring with the Fermi-Large Area Telescope (Fermi-LAT). The dense sampling has allowed us to study their multi-epoch SED evolution using contemporaneous data covering all accessible electromagnetic bands. Moreover, near-IR (NIR) to optical-ultraviolet (UV) spectra of both objects are strongly dominated by non-thermal synchrotron emission from the jet, with signatures of direct accretion disk emission only emerging in very low activity states (e.g., Pian et al., 1999) and at frequencies far beyond the synchrotron peak. Thus, we are able to reliably estimate the location of the synchrotron peak based on the observed NIR – UV spectra. The following cosmology parameters were adopted: km s-1 Mpc-1, , and (Planck Collaboration et al., 2016)
2 Data Reduction and Analysis
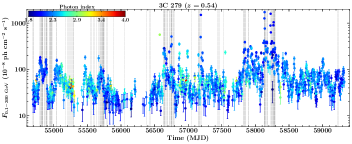
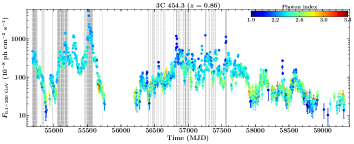
Gamma-rays: We analyzed 0.1300 GeV data taken with the Fermi-LAT between 2008 August 4 and 2021 May 5 (MJD 54683-59339) to generate 3-day binned -ray light curves and spectra. We followed the standard data reduction procedure111http://fermi.gsfc.nasa.gov/ssc/data/analysis/documentation/ fully described in various works (cf. Paliya et al., 2019) and we briefly elaborate it here. A 15∘ region of interest (ROI) was chosen to select SOURCE class events which were subjected to the relational filter ‘DATA_QUAL0 and LAT_CONFIG==1’ to determine good time intervals. Additionally, we adopted a zenith angle cut of to avoid contamination from Earth’s albedo. A binned likelihood fitting technique was used to determine the spectral parameters of sources of interest. For this purpose, we considered all -ray sources located within 20∘ from the center of the ROI and included in the fourth catalog of the Fermi-LAT detected sources (4FGL-DR2; Abdollahi et al., 2020; Ballet et al., 2020). The standard Galactic and isotropic background templates222https://fermi.gsfc.nasa.gov/ssc/data/access/lat/BackgroundModels.html were also used. The spectral parameters of all sources lying within the ROI were kept free in the likelihood fit, whereas, those lying outside ROI were fixed to their 4FGL-DR2 values. The significance of the -ray detection was quantified using maximum likelihood test statistic TS=2 where is the ratio of the likelihood values for models with and without a -ray point object. We first performed a likelihood fit for the whole duration covered in this work and then froze the spectra parameters of all sources whose TS values were found to be 25. This updated sky model was then used to generate 3-day binned light curve and spectra. In this study, we considered only those epochs during which the target quasars were significantly detected (5) in the -ray band. The generated light curves are shown in Figure 1.
X-rays: We used the “Swift-XRT data products generator333http://www.swift.ac.uk/user_objects/” (Evans et al., 2009) to extract 0.310 keV spectra from the observations taken with the Neil Gehrels Swift X-ray telescope in the time interval MJD 54683 – 59339. Based on the current count rate, this tool automatically takes into account the possible pile-up effects and choose the source and background regions of appropriate sizes. An absorbed power-law model was adopted to derive the source flux for each observation using the Galactic neutral hydrogen column density from Kalberla et al. (2005). The spectral fitting was carried out in XSPEC (Arnaud, 1996).
NIR-UV: Data from the Swift Ultraviolet and Optical telescope (UVOT — and filters), Steward observatory ( and bands; Smith et al., 2009) and Small and Medium Aperture Research Telescope System (SMARTS — and filters; Bonning et al., 2012) were used to extract the source magnitudes in the NIR, optical, and UV bands. They were corrected for the Galactic extinction following Schlafly & Finkbeiner (2011) and converted to flux units using the standard zero points (Bessell et al., 1998; Breeveld et al., 2011).
Radio: We considered the multi-frequency radio fluxes made available by the University of Michigan Radio Astronomy Observatory (UMRAO — 4.8, 8, and 14.5 GHz; Aller et al., 1985), the Submillimeter Array444http://sma1.sma.hawaii.edu/callist/callist.html (230 and 350 GHz; Gurwell et al., 2007), and the Atacama Large Milimeter/Submilimeter Array (ALMA — 35 GHz to 950 GHz; Bonato et al., 2019). The radio fluxes published in Angelakis et al. (2019) and Larionov et al. (2020) were also used.
3 Evolution of the SED Peaks
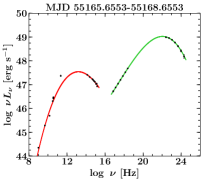
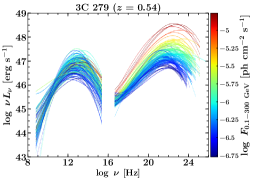
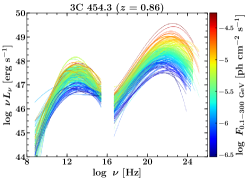
Our primary objective is to study the evolution of the SED peaks as a function of the -ray activity of 3C 279 and 3C 454.3. Therefore, from the -ray light curves, only those epochs were chosen that have at least one observation each in the radio and NIR-UV (covering the synchrotron peak), and X-ray and -ray (constraining the inverse Compton peak) bands. This criterion of selecting near-simultaneous data across the electromagnetic spectrum has led to the identification of 155 and 149 epochs for 3C 279 and 3C 454.3, respectively (Figure 1). To determine the peak frequencies and luminosities, we fitted a third-order polynomial following the Markov Chain Monte Carlo technique implemented in the software emcee (Foreman-Mackey et al., 2013). Both SED peaks were fitted independently and we derived the uncertainties based on the 16th, 50th, and 84th percentiles of the sample in the marginalized distribution. We show the results of this fitting procedure in Figure 2.
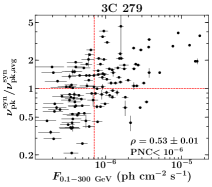
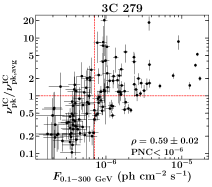
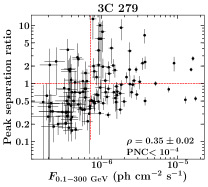
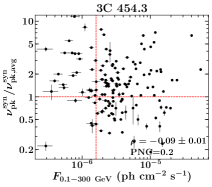
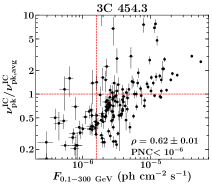
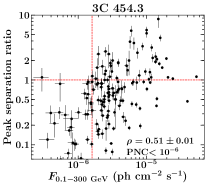
Figure 3 shows the variations of the synchrotron peak frequency (), inverse Compton peak frequency (), and their separation measured during various -ray flux states, normalized to those derived from their average activity state SEDs by Paliya et al. (2021). The strength of the correlation of the plotted quantities was determined by computing Spearman’s rank correlation coefficient () taking uncertainties into account. Both and have been found to correlate positively with the -ray activity for 3C 279. For 3C 454.3, follows the same trend though does not show any significant correlation with the -ray flux. Interestingly, the separation of both SED peaks strongly correlates with the -ray flux for both sources. This can be understood by comparing the and panels in Figure 3 which reveals that the extent of variation is larger for the latter. In other words, shifts considerably more than during -ray flares, thus leading to an overall increase in the SED peak separation.
We have also derived the ratio of the inverse Compton to synchrotron peak luminosities, also known as Compton dominance, and show it as a function of the -ray flux in Figure 4. In both cases, a strong correlation is found.
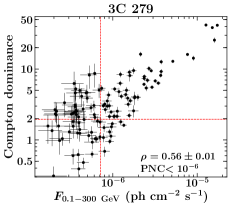
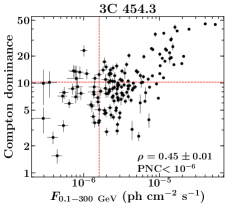
One possible caveat of this work could be the fact that we have considered near-simultaneous radio data to constrain the synchrotron peak. One can argue that the observed radio emission may originate from more extended regions, further down the jet, than the compact one radiating in NIR-to--ray bands due to the synchrotron self-absorption process. Though our analysis method does not rely on any such assumptions, we performed the following test to reveal its impact on the results. Since the radio emission produced by the plasma blob radiating NIR-to--rays is expected to be the observed flux, we recomputed and determine the strength of correlations described above by dividing the observed radio flux by 10. No assumption was made on the spectral shape of the self-absorbed radio flux. In all cases, the results followed the same trends and the derived correlations remain significant. The changes were noticed only in the derived ratios plotted in Figure 3 and 4. For example, decreasing the radio flux reduced the corresponding synchrotron peak luminosity thereby increasing the Compton dominance which still showed a strong correlation with the -ray flux, and for 3C 279 and 3C 454.3, respectively.
4 Physical Interpretation
The multiwavelength variability and correlation studies of both 3C 279 and 3C 454.3 have been extensively studied, especially during major flares (e.g., Giuliani et al., 2009; Vercellone et al., 2009; Raiteri et al., 2011; Hayashida et al., 2012; Jorstad et al., 2013; Paliya et al., 2015; Diltz & Böttcher, 2016; Bottacini et al., 2016; Larionov et al., 2020; Zhou et al., 2021).
In most works discussing the leptonic modeling of blazar SEDs, the -ray emission from FSRQs is dominated by inverse-Compton scattering of a target radiation field external to the jet, such as line-dominated optical – UV radiation from the Broad Line Region or infrared emission from a dusty torus from a relativistic non-thermal electron population assumed to be isotropic in the co-moving frame of an emission region moving with bulk Lorentz factor along the jet (e.g., Ghisellini et al., 2010; Böttcher et al., 2013). This results in relativistic Doppler boosting of the radiation with respect to the co-moving frame of the emission region by a factor of in frequency and a factor of in peak flux. In such models, therefore, we find that the synchrotron peak is determined by the source parameters as
| (1) |
and
| (2) |
where is the magnetic field and is the peak of the electron spectrum in a representation. In the case of FSRQs with an inverse-Compton peak in the MeV – GeV regime, inverse-Compton scattering to photon energies around the peak is likely dominated by Compton scattering in the Thomson regime. Therefore, the inverse-Compton peak location is determined by
| (3) |
and
| (4) |
where and are the energy density and peak frequency of the external radiation field in the stationary frame of the AGN.
The peak separation ratio therefore depends on source parameters as
| (5) |
and the Compton dominance as
| (6) |
As evident from Eq. (4), -ray flaring may be caused by several factors, which we will discuss in the following: (1.) an increase in the number of relativistic electrons ; (2.) a hardening of the radiating electron distribution, resulting in an increase in ; (3.) an increase in the energy density of the external radiation field, , and/or (4.) an increase in the bulk Lorentz factor and Doppler factor .
-
1.
A pure increase of the electron number density (without significant spectral changes or other parameter changes) will lead to an equal increase of both radiation components (synchrotron and inverse-Compton). It will not shift the peak frequency of either component and will not alter the Compton dominance. Hence, such a scenario is ruled out as the dominant cause of -ray variability by the significant correlation of both the peak separation and the Compton dominance with flux in both sources.
-
2.
A spectral hardening of the electron distribution, as expected in most particle acceleration scenarios, such as internal shocks or magnetic reconnection, shifting to higher values, without any other parameter changes, will lead an equal increase of the synchrotron and Compton peak frequencies and peak fluxes. In order to increase the peak separation, other parameter changes would need to be invoked. It has been found in several modeling studies of blazar variability (see, e.g., Zhang et al., 2015; Böttcher & Baring, 2019) that a reduction in the magnetic field accompanied by more efficient particle acceleration can successfully be invoked to reproduce the observed increase of the Compton dominance and peak separation. In particular, it may explain the lack of a correlation of the synchrotron peak frequency with the -ray flux, as we found for 3C454.3. Such a reduction of the magnetic field accompanying -ray flaring activity could indicate magnetic energy conversion, as in magnetic reconnection, transferring magnetic-field energy into relativistic particle energy.
An interesting alternative explanation has recently been suggested by Sobacchi & Lyubarsky (2019) and Sobacchi et al. (2021): Those authors propose that stochastic particle acceleration mediated by magneto-hydrodynamic (MHD) turbulence will cause the highest-energy particles to maintain small pitch angles with respect to the magnetic field. This will naturally reduce both the synchrotron peak frequency and the synchrotron flux. It may result in flaring due to enhanced particle acceleration, shifting to higher values, not leading to a significant increase of the synchrotron peak, while the inverse-Compton peak frequency and flux may increase significantly.
-
3.
Blazar variability models invoking a temporary increase of the energy density of the external target photon field for inverse-Compton scattering have been proposed in the form of a synchrotron mirror model, in which part of the jet synchrotron emission is reflected by a cloud near the jet trajectory (Böttcher & Dermer, 1999; Tavani et al., 2015) or by a stationary jet feature, as in the “ring of fire model” (MacDonald et al., 2017). If the particle acceleration characteristics in the emission region are not changing in such a scenario, as the emission region passes the mirror, the enhanced radiative cooling is naturally expected to decrease , thus, in fact, leading to a decrease of both the synchrotron and inverse-Compton peak frequencies as well as a reduction of the synchrotron peak flux. If these were the only changes in such a scenario, one would expect to see the observed increase in Compton dominance correlated with increasing flux, but not the increasing peak separation and the positive correlation of the peak frequencies with flux. In order to reproduce those latter correlations, a reduction of the magnetic field, along with increased particle acceleration efficiency (increasing ) would have to occur along with the passing of the mirror. While additional particle injection and acceleration may be the result of a shock caused by the mechanical interaction of the emission region with the obstacle (see, e.g., Barkov et al., 2012; Zacharias et al., 2017), one would expect a compression and, thus, increase of the magnetic field to result as well, leading to a decrease of the peak separation. Thus, it seems difficult to imagine a plausible scenario of an increasing external radiation field to reproduce the flux correlations found in our study.
-
4.
A change in the bulk Lorentz factor and Doppler factor will lead to enhanced Doppler boosting of both the peak frequencies and fluxes of both radiation components. If such a change were effected by a change in the viewing angle, not changing , both radiation components would be affected in the same way, in contrast to the observed peak separation vs. flux and Compton dominance vs. flux correlations. Thus, more plausible would be an increase of the Doppler factor, which, for initial viewing angles , will also lead to an increase of . Positive correlations of all quantities (both peak frequencies, peak separation, and Compton dominance) are expected in this case, as observed for 3C279 (see also Larionov et al., 2020) In order to explain the lack of a correlation between and -ray flux for 3C 454.3, a reduction of the magnetic field, as in scenarios 1. and 2., would need to be invoked.
5 Summary
In this work, we have studied the evolution of the SED peaks as a function of the -ray activity of two bright blazars with good multi-wavelength coverage. The separation of the SED peaks and the Compton dominance are found to strongly correlate with the -ray flux activity for both sources, indicating a similar mechanism to be responsible for the observed -ray flares. We have interpreted these findings based on the spectral hardening of the radiating electron population and/or enhancement of the Doppler factor. In both cases, magnetic reconnection may play a major role in powering the -ray flares. Similar results have been reported in various studies focused on the major flaring events detected from 3C 279 and 3C 454.3 (cf. Bonnoli et al., 2011; Shah et al., 2019). Furthermore, these objects have occasionally shown ‘unusual’ SEDs during flaring episodes that might not have been included in our analysis due to lack of near-simultaneous data e.g., at radio or X-ray wavelengths (e.g., 2013 December flare of 3C 279; Paliya et al., 2016). Such peculiar flaring events are crucial in understanding the origin of -ray flares and associated diverse radiative mechanisms by applying various physically-motivated models rather than the polynomial function used in this study. Therefore, the results presented here should be considered as representing the overall broadband spectral behavior of bright Fermi blazars as a function of their -ray activities. The proposed hypotheses can be tested for a larger sample of blazars with the accumulation of contemporaneous radio-to--ray data made available by the current- and next-generation of telescopes.
| Frequency | Luminosity | ||
|---|---|---|---|
| [1] | [2] | [3] | [4] |
| 54685.7 | 54688.7 | 22.402 | 46.9490.136 |
| 54685.7 | 54688.7 | 22.648 | 46.8760.103 |
| 54685.7 | 54688.7 | 22.893 | 46.803 0.083 |
| 54685.7 | 54688.7 | 23.139 | 46.7300.088 |
| 54685.7 | 54688.7 | 23.385 | 46.6570.114 |
| Frequency | Luminosity | ||
|---|---|---|---|
| [1] | [2] | [3] | [4] |
| 54682.7 | 54685.6 | 22.402 | 48.5020.032 |
| 54682.7 | 54685.6 | 22.718 | 48.4880.017 |
| 54682.7 | 54685.6 | 23.034 | 48.4340.021 |
| 54682.7 | 54685.6 | 23.350 | 48.3410.025 |
| 54682.7 | 54685.6 | 23.666 | 48.2080.035 |
References
- Abdollahi et al. (2020) Abdollahi, S., Acero, F., Ackermann, M., et al. 2020, ApJS, 247, 33, doi: 10.3847/1538-4365/ab6bcb
- Ajello et al. (2020) Ajello, M., Angioni, R., Axelsson, M., et al. 2020, ApJ, 892, 105, doi: 10.3847/1538-4357/ab791e
- Aller et al. (1985) Aller, H. D., Aller, M. F., Latimer, G. E., & Hodge, P. E. 1985, ApJS, 59, 513, doi: 10.1086/191083
- Angelakis et al. (2019) Angelakis, E., Fuhrmann, L., Myserlis, I., et al. 2019, A&A, 626, A60, doi: 10.1051/0004-6361/201834363
- Angioni et al. (2019) Angioni, R., Nesci, R., Finke, J. D., Buson, S., & Ciprini, S. 2019, A&A, 627, A140, doi: 10.1051/0004-6361/201935461
- Arnaud (1996) Arnaud, K. A. 1996, in Astronomical Society of the Pacific Conference Series, Vol. 101, Astronomical Data Analysis Software and Systems V, ed. G. H. Jacoby & J. Barnes, 17
- Ballet et al. (2020) Ballet, J., Burnett, T. H., Digel, S. W., & Lott, B. 2020, arXiv e-prints, arXiv:2005.11208. https://arxiv.org/abs/2005.11208
- Barkov et al. (2012) Barkov, M. V., Bosch-Ramon, V., & Aharonian, F. A. 2012, ApJ, 755, 170, doi: 10.1088/0004-637X/755/2/170
- Bessell et al. (1998) Bessell, M. S., Castelli, F., & Plez, B. 1998, A&A, 333, 231
- Bonato et al. (2019) Bonato, M., Liuzzo, E., Herranz, D., et al. 2019, MNRAS, 485, 1188, doi: 10.1093/mnras/stz465
- Bonning et al. (2012) Bonning, E., Urry, C. M., Bailyn, C., et al. 2012, ApJ, 756, 13, doi: 10.1088/0004-637X/756/1/13
- Bonnoli et al. (2011) Bonnoli, G., Ghisellini, G., Foschini, L., Tavecchio, F., & Ghirlanda, G. 2011, MNRAS, 410, 368, doi: 10.1111/j.1365-2966.2010.17450.x
- Bottacini et al. (2016) Bottacini, E., Böttcher, M., Pian, E., & Collmar, W. 2016, ApJ, 832, 17, doi: 10.3847/0004-637X/832/1/17
- Böttcher & Baring (2019) Böttcher, M., & Baring, M. G. 2019, ApJ, 887, 133, doi: 10.3847/1538-4357/ab552a
- Böttcher & Dermer (1999) Böttcher, M., & Dermer, C. D. 1999, Astrophysical Letters and Communications, 39, 129
- Böttcher et al. (2013) Böttcher, M., Reimer, A., Sweeney, K., & Prakash, A. 2013, ApJ, 768, 54, doi: 10.1088/0004-637X/768/1/54
- Breeveld et al. (2011) Breeveld, A. A., Landsman, W., Holland, S. T., et al. 2011, in American Institute of Physics Conference Series, Vol. 1358, American Institute of Physics Conference Series, ed. J. E. McEnery, J. L. Racusin, & N. Gehrels, 373–376, doi: 10.1063/1.3621807
- Diltz & Böttcher (2016) Diltz, C., & Böttcher, M. 2016, ApJ, 826, 54, doi: 10.3847/0004-637X/826/1/54
- Evans et al. (2009) Evans, P. A., Beardmore, A. P., Page, K. L., et al. 2009, MNRAS, 397, 1177, doi: 10.1111/j.1365-2966.2009.14913.x
- Foreman-Mackey et al. (2013) Foreman-Mackey, D., Hogg, D. W., Lang, D., & Goodman, J. 2013, PASP, 125, 306, doi: 10.1086/670067
- Foschini et al. (2011) Foschini, L., Ghisellini, G., Tavecchio, F., Bonnoli, G., & Stamerra, A. 2011, A&A, 530, A77, doi: 10.1051/0004-6361/201117064
- Ghisellini et al. (2010) Ghisellini, G., Tavecchio, F., Foschini, L., et al. 2010, MNRAS, 402, 497, doi: 10.1111/j.1365-2966.2009.15898.x
- Giuliani et al. (2009) Giuliani, A., D’Ammando, F., Vercellone, S., et al. 2009, A&A, 494, 509, doi: 10.1051/0004-6361:200810785
- Gurwell et al. (2007) Gurwell, M. A., Peck, A. B., Hostler, S. R., Darrah, M. R., & Katz, C. A. 2007, in Astronomical Society of the Pacific Conference Series, Vol. 375, From Z-Machines to ALMA: (Sub)Millimeter Spectroscopy of Galaxies, ed. A. J. Baker, J. Glenn, A. I. Harris, J. G. Mangum, & M. S. Yun, 234
- Hayashida et al. (2012) Hayashida, M., Madejski, G. M., Nalewajko, K., et al. 2012, ApJ, 754, 114, doi: 10.1088/0004-637X/754/2/114
- Jorstad et al. (2013) Jorstad, S. G., Marscher, A. P., Smith, P. S., et al. 2013, ApJ, 773, 147, doi: 10.1088/0004-637X/773/2/147
- Kalberla et al. (2005) Kalberla, P. M. W., Burton, W. B., Hartmann, D., et al. 2005, A&A, 440, 775, doi: 10.1051/0004-6361:20041864
- Larionov et al. (2020) Larionov, V. M., Jorstad, S. G., Marscher, A. P., et al. 2020, MNRAS, 492, 3829, doi: 10.1093/mnras/staa082
- MacDonald et al. (2017) MacDonald, N. R., Jorstad, S. G., & Marscher, A. P. 2017, ApJ, 850, 87, doi: 10.3847/1538-4357/aa92c8
- Paliya et al. (2016) Paliya, V. S., Diltz, C., Böttcher, M., Stalin, C. S., & Buckley, D. 2016, ApJ, 817, 61, doi: 10.3847/0004-637X/817/1/61
- Paliya et al. (2021) Paliya, V. S., Domínguez, A., Ajello, M., Olmo-García, A., & Hartmann, D. 2021, ApJS, 253, 46, doi: 10.3847/1538-4365/abe135
- Paliya et al. (2015) Paliya, V. S., Sahayanathan, S., & Stalin, C. S. 2015, ApJ, 803, 15, doi: 10.1088/0004-637X/803/1/15
- Paliya et al. (2019) Paliya, V. S., Ajello, M., Ojha, R., et al. 2019, ApJ, 871, 211, doi: 10.3847/1538-4357/aafa10
- Pian et al. (1999) Pian, E., Urry, C. M., Maraschi, L., et al. 1999, ApJ, 521, 112, doi: 10.1086/307548
- Planck Collaboration et al. (2016) Planck Collaboration, Ade, P. A. R., Aghanim, N., et al. 2016, A&A, 594, A13, doi: 10.1051/0004-6361/201525830
- Raiteri et al. (2011) Raiteri, C. M., Villata, M., Aller, M. F., et al. 2011, A&A, 534, A87, doi: 10.1051/0004-6361/201117026
- Schlafly & Finkbeiner (2011) Schlafly, E. F., & Finkbeiner, D. P. 2011, ApJ, 737, 103, doi: 10.1088/0004-637X/737/2/103
- Shah et al. (2019) Shah, Z., Jithesh, V., Sahayanathan, S., Misra, R., & Iqbal, N. 2019, MNRAS, 484, 3168, doi: 10.1093/mnras/stz151
- Smith et al. (2009) Smith, P. S., Montiel, E., Rightley, S., et al. 2009, arXiv:0912.3621. https://arxiv.org/abs/0912.3621
- Sobacchi & Lyubarsky (2019) Sobacchi, E., & Lyubarsky, Y. E. 2019, MNRAS, 484, 1192, doi: 10.1093/mnras/stz044
- Sobacchi et al. (2021) Sobacchi, E., Sironi, L., & Beloborodov, A. M. 2021, MNRAS, 506, 38, doi: 10.1093/mnras/stab1702
- Tavani et al. (2015) Tavani, M., Vittorini, V., & Cavaliere, A. 2015, ApJ, 814, 51, doi: 10.1088/0004-637X/814/1/51
- Vercellone et al. (2009) Vercellone, S., Chen, A. W., Vittorini, V., et al. 2009, ApJ, 690, 1018, doi: 10.1088/0004-637X/690/1/1018
- Wood et al. (2017) Wood, M., Caputo, R., Charles, E., et al. 2017, ArXiv e-prints. https://arxiv.org/abs/1707.09551
- Zacharias et al. (2017) Zacharias, M., Böttcher, M., Jankowsky, F., et al. 2017, ApJ, 851, 72, doi: 10.3847/1538-4357/aa9bee
- Zhang et al. (2015) Zhang, H., Chen, X., Böttcher, M., Guo, F., & Li, H. 2015, ApJ, 804, 58, doi: 10.1088/0004-637X/804/1/58
- Zhou et al. (2021) Zhou, B., Dai, B., & Yang, J. 2021, PASJ, 73, 850, doi: 10.1093/pasj/psab051