Towards Debiasing Temporal Sentence Grounding in Video
Abstract
The temporal sentence grounding in video (TSGV) task is to locate a temporal moment from an untrimmed video, to match a language query, i.e., a sentence. Without considering bias in moment annotations (e.g., start and end positions in a video), many models tend to capture statistical regularities of the moment annotations, and do not well learn cross-modal reasoning between video and language query. In this paper, we propose two debiasing strategies, data debiasing and model debiasing, to “force” a TSGV model to capture cross-modal interactions. Data debiasing performs data oversampling through video truncation to balance moment temporal distribution in train set. Model debiasing leverages video-only and query-only models to capture the distribution bias, and forces the model to learn cross-modal interactions. Using VSLNet as the base model, we evaluate impact of the two strategies on two datasets that contain out-of-distribution test instances. Results show that both strategies are effective in improving model generalization capability. Equipped with both debiasing strategies, VSLNet achieves best results on both datasets.
1 Introduction
The goal of temporal sentence grounding in video (TSGV) is to retrieve the temporal moment that matches a language query, from an untrimmed video. As a fundamental yet challenging task in the vision-language understanding area, TSGV attracts increasing attentions. A good number of models have been proposed recently Gao et al. (2017); Chen et al. (2018); Yuan et al. (2019a); Chen et al. (2020a); Xiao et al. (2021); Zhang et al. (2021a). In general, a model needs to have deep understanding of the video, the language query, and their cross-modal interactions to make accurate predictions.
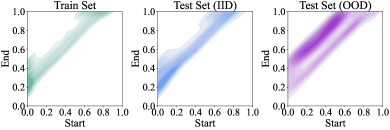
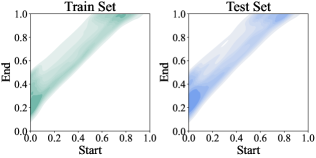
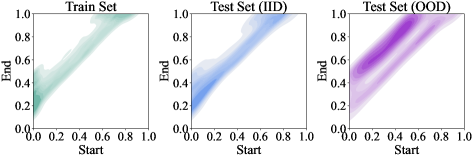
Recent studies Otani et al. (2020); Yuan et al. (2021) noted that 1) substantial distribution bias exists in benchmark datasets; 2) many TSGV models rely on exploiting the statistical regularities of annotation distribution for moment retrieval, to achieve good performance. We use the train set of Charades-CD dataset as an example to illustrate distribution bias, shown in Figure 1(a). The “Start” and “End” axes denote the normalized start and end time points of the annotated moments in videos. Observe that many annotated moments in the train set of Charades-CD locate in the normalized temporal region of of the video length. Hence, a TSGV model could make a good guess of start/end time points, even without taking into consideration the input video and language query. Consequently, the existing TSGV methods achieve impressive performance on the independent-and-identical distribution (iid) test set, but fail to generalize on the out-of-distribution (ood) test set (see Figure 1). For instance, without debasing, the VSLNet model reports on the iid test set of Charades-CD, but only on the ood test set of the same dataset (see Section 4 for details).
The aforementioned studies Otani et al. (2020); Yuan et al. (2021) well analyze the issue of distribution bias in TSGV datasets and models. However, they do not attempt to address the bias. To the best of our knowledge, this work is the first attempt to mitigate bias in TSGV models. Specifically, we propose two debiasing strategies, data debiasing and model debiasing.
From data perspective, bias is caused by the imbalanced distribution of moment annotations, i.e., many annotations are concentrated in several regions as shown in Figure 1. To mitigate the bias, we artificially re-balance the moment annotations via data augmentation, i.e., creating more samples through video truncation. Specifically, we partition each training video into multiple non-overlapping clips, and gradually cut background clips (i.e., clips that do not contain target moment) to form new videos. Each newly created video hence has a different start/end time point from the original training sample. Besides, each query corresponds to multiple videos of different lengths after data debiasing. This oversampling implicitly encourages a TSGV model to focus more on the interactions between query and target moment.
Our model debiasing strategy is inspired by the question-only branch in visual question answering (VQA) debiasing Cadene et al. (2019); Clark et al. (2019). Bias in VQA comes from the suspicious correlations between answer occurrences and certain patterns of questions, e.g., color of a banana is always answered as “yellow” regardless the input image contains a yellow or green banana. Bias in TSGV, on the other hand, is caused by the regularities in the moment boundaries. That is, a TSGV model with video- or query-only input could achieve fairly good performance by making a good guess of the distribution bias. Thus, our model debiasing is different from the strategies in VQA models. To debias, we add two unimodal models, i.e., video- and query-only branches, in addition to the TSGV model. Both unimodal models learn to capture the bias, and to disentangle bias from the TSGV model by adjusting losses to compensate for biases dynamically. Specifically, the gradients backpropagated through TSGV model are reduced for the biased examples and are increased for the less biased after loss adjustment.
We evaluate the proposed data and model debiasing strategies on the Charades-CD and ActivityNet-CD datasets, by using VSLNet as the base model. Both datasets are re-designed by Yuan et al. (2021) for the purpose of evaluating model biasing, with dedicated iid test set and ood test set (see Figure 1). Experimental results demonstrate their ability of well generalization on out-of-distribution test set. With both debiasing strategies, VSLNet achieves further improvements against the base model.
Our main contributions are: 1) to the best of our knowledge, we are the first to address distribution bias in TSGV task; 2) we propose two simple yet effective strategies, data debiasing (DD) and model debiasing (MD), to alleviate the bias issue from the data level and model level, respectively; 3) we conduct extensive experiments on benchmark datasets to demonstrate that both strategies effectively reduce the bias in TSGV base model, and also lead to further overall performance improvement.
2 Related Work
Temporal sentence grounding in video
Solutions to TSGV can be roughly categorized into proposal-based, proposal-free, reinforcement learning, and weakly supervised methods.
Proposal-based methods include ranking and anchor-based models. Ranking-based models Gao et al. (2017); Hendricks et al. (2017, 2018); Liu et al. (2018b); Chen and Jiang (2019); Ge et al. (2019); Xu et al. (2019); Xiao et al. (2021) solve TSGV with a propose-and-rank pipeline. Proposals (short video clips) are first generated, then the best ranked proposal for a query is retrieved via multimodal matching. Anchor-based models Chen et al. (2018); Yuan et al. (2019a); Zhang et al. (2019a, b); Wang et al. (2020) solve TSGV in an end-to-end manner. The model sequentially scores multiscale anchors ended at each frame and generates results in a single pass.
Proposal-free methods Lu et al. (2019); Yuan et al. (2019b); Ghosh et al. (2019); Chen et al. (2020a); Zhang et al. (2020b); Zeng et al. (2020); Li et al. (2021); Zhang et al. (2021b, c); Nan et al. (2021) tackle TSGV by learning fine-grained cross-modal interactions for video and query. The boundaries of target moment are then predicted or regressed directly. Reinforcement learning methods He et al. (2019); Wang et al. (2019); Hahn et al. (2020); Wu et al. (2020) formulate TSGV as a sequential decision-making problem. These methods imitate humans’ coarse-to-fine decision-making process. Adopting reinforcement learning algorithms, the models progressively observe candidate moments conditioned on the query. Weakly supervised methods Duan et al. (2018); Mithun et al. (2019); Gao et al. (2019); Song et al. (2020); Lin et al. (2020); Tan et al. (2021) consider the ground truth moments are unavailable in the training stage. These methods explore to learn the latent alignment between video content and language query, and retrieve the target moment based on their similarities.
Bias in TSGV task
The unimodal bias has been identified and well studied in VQA task Goyal et al. (2017); Agrawal et al. (2018). This bias is considered as the main issue for the generalization ability of VQA models. To remedy, adversary-based Ramakrishnan et al. (2018); Grand and Belinkov (2019) and fusion-based Cadene et al. (2019); Clark et al. (2019); Chen et al. (2020b); Liang et al. (2020) methods are proposed to mitigate the bias in VQA and make great progress.
Inspired by the studies on biases in VQA, Otani et al. (2020) first assessed how well benchmark results reflect the true progress in solving TSGV. They developed several bias-based models and evaluated their performances on TSGV datasets. Their results show substantial biases in TSGV datasets, and SOTA methods tend to fit on distribution bias to achieve good performance rather than learning cross-modal reasoning between video and query. Yuan et al. (2021) further analyze the moment annotation distributions of Charades-STA Gao et al. (2017) and ActivityNet Captions Krishna et al. (2017) datasets, and show the distributions of their train and test sets are almost identical. The authors then develop Charades-CD and ActivityNet-CD datasets, where each dataset consists of train, validation, iid and ood test sets. The performance gap between the iid and ood test sets effectively reflects the generalization ability of the TSGV model. Note that, both studies Otani et al. (2020); Yuan et al. (2021) aim to offer deep understanding on bias in TSGV, and they do not focus on debiasing models. A recent work Zhou et al. (2021) proposes to solve bias TSGV. However, it only aims to alleviate the bias caused by single-style annotations in the presence of label uncertainty. In contrast, our work focuses on addressing the annotation distribution bias of TSGV task.
3 Data Debiasing and Model Debiasing
We first define and formulate the TSGV task in feature space. Then we elaborate the proposed data and model debiasing strategies. The data debiasing strategy is model-agnostic, hence can be applied to any TSGV model in principle. The proposed model debiasing strategy is applicable to proposal-free models. Lastly, we use VSLNet Zhang et al. (2020a) as a backbone to illustrate how to apply the two debiasing strategies.
3.1 Preliminaries
We denote an untrimmed video with frames as , language query with words as , and as the start and end time of ground truth moment. The video is then split into units and encoded into visual features with pre-trained feature extractor. The query is initialized by pre-trained word embeddings as . The are mapped to the corresponding indices in the feature sequence, where . The goal of TSGV is to localize the moment starting at and ending at .
3.2 Data Debiasing
As shown in Figure 1, the iid test set shares identical distribution of start/end positions with the train set, while ood test has an entirely different distribution. From data perspective, this issue is caused by the fact that train set does not cover many moment annotations that start and end at different positions of the untrimmed video. Thus, we propose a simple data debiasing (DD) strategy to include more annotations with varying start/end positions.
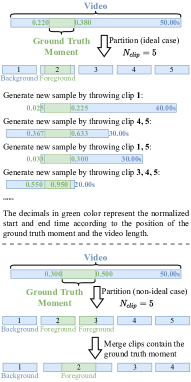
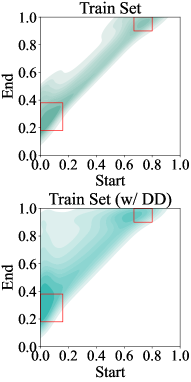
Ideally, the moment annotations of train set should uniformly distribute in the upper triangle area in the distribution plot (see Figure 1). To this end, we oversample annotations through video truncation. Illustrated in Figure 2(a), for each video-query pair, we first partition the video into multiple non-overlapping clips. If a clip overlaps with ground truth moment, then it is regarded as foreground, otherwise as background. If the ground truth moment happens to be partitioned into multiple clips, then these clips are merged back to ensure the ground truth moment is unaffected. Then we gradually truncate the video to generate new videos by throwing background clips from both ends. The newly generated videos hence are sub-clips of the original video, with their overall length reduced, but all contain the ground truth moment. The relative positions of start and end boundaries of ground truth moment are then well distributed. Because the correspondence between language query and ground truth moment does not change, this oversampling process makes each query correspond to multiple videos of different lengths. In this way, data debiasing implicitly encourages TSGV model to learn the multimodal matching between query and the target moment, with different amount of irrelevant content in videos. Note that, we do not rotate or permutate background clips, to ensure the semantic continuity in the generated videos.
We use the train set of Charades-CD as an example to illustrate the effect of DD in Figure 2(b). After data debiasing, moment annotation distribution of the augmented train set spreads to a much larger area than that of the original train set. Besides, the proportion of biased samples (highlighted in red rectangle in the figure) in the entire training samples reduces from to .
3.3 Model Debiasing
We propose model debiasing for proposal-free TSGV models, which directly learn cross-modal interactions between video and query, and directly predict boundaries of target moment. Next, we use the computation process of span-based proposal-free TSGV model to present our debiasing strategy; the strategy can be applied to regression-based model with minor adaptations.
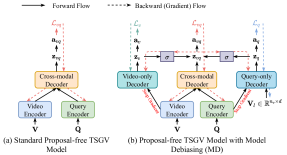
A span-based model usually consists of a video encoder , a query encoder , a cross-modal interaction module , and an answer predictor . The overall architecture is shown in Figure 3(a), where we combine the cross-modal interaction module and answer predictor as cross-modal decoder for better visualization, and . The training objective is defined as:
| (1) |
where is cross-entropy function, is one-hot labels for start (end) boundary, i.e., ().
Due to the existence of substantial data distribution biases in TSGV datasets, TSGV models tend to rely on the statistical regularities to generate predictions even without having to consider the video and query inputs Otani et al. (2020). Hence, a TSGV model with unimodal input (i.e., either video or query) could also achieve fair performance by capturing the distribution biases in TSGV datasets. Inspired by Cadene et al. (2019); Clark et al. (2019), we adapt unimodal models as separate branches and integrate them into TSGV model, illustrated in Figure 3(b). The unimodal models learn to capture the distribution bias, and force the TSGV model to focus on learning cross-modal interaction between video and query by altering its answer predictions.
Specifically, given the encoded visual () and textual () features, the TSGV model retrieves the answer with cross-modal decoder as:
| (2) |
Because the video-only branch does not contain query input, the video-only decoder generate answer by:
| (3) |
For query-only branch, as TSGV task requires to retrieve start and end boundaries of target moment, we follow Otani et al. (2020) to replace the with a learnable feature sequence in the same shape, to simulate visual input. The answer is computed as:
| (4) |
Note that, the structures of and are the same, but their parameters are not shared. Also, , , and are the same.
With biased prediction and , we modify the prediction of TSGV model as:
| (5) |
where denotes element-wise multiplication and is Sigmoid activation to map the biased prediction between and . The key of Eq. 5 is to dynamically alter the loss, by modifying predictions of the TSGV model, to prevent the model to pick up distribution biases from the dataset.
Given a biased sample, both unimodal branches and the TSGV model tend to generate high confidence to the correct answer and low confidence to others. The confidence score of the correct answer predicted by the TSGV model will be further increased with Eq. 5. Thus, the loss from a biased sample is much smaller. Accordingly, the gradient backpropagated through the TSGV model is very small, reducing the importance of this biased sample in training. On the contrary, the importance of a non-biased sample will be increased. The reason is, all the models tend to assign low confidence to the correct answer, hence the score is further decreased through Eq. 5. With a large loss, the TSGV model is forced on learning non-biased samples.
Finally, we jointly optimize the two unimodal models and the TSGV model as:
| (6) |
Note that, both and do not optimize the query () and video () encoders to prevent them from directly learning distribution biases. is used to optimize all the modules except the learnable feature sequence for query-only decoder. During inference, only the TSGV model is used.
3.4 Implementation
We use VSLNet Zhang et al. (2020a) as the backbone model to evaluate both debiasing strategies, due to its simple architecture and prominent performance. VSLNet consists of a transformer-based module as video encoder , a transformer-based module as query encoder , a video-query co-attention layer as cross-modal reasoning module , and the stacked LSTMs as answer predictor . Here, we replace the stacked LSTMs with stacked transformer blocks Vaswani et al. (2017) for faster training and inference.
In our implementation, the VSLNet is regarded as the standard TSGV model. Then we initialize a new answer predictor with stacked transformer blocks as video-only decoder. The query-only decoder is constructed by creating a new cross-modal reasoning module and a new answer predictor . As mentioned before, the and have the same structure but their parameters are not shared, while , and are the same. Finally, the VSLNet, query-only decoder and video-only decoder are integrated together following Figure 3(b).
4 Experiments
4.1 Experimental Setting
Datasets
We conduct experiments on Charades-CD (Cha-CD) and ActivityNet-CD (ANet-CD) datasets, prepared by Yuan et al. (2021). The two datasets originate from Charades-STA Gao et al. (2017) (Cha-STA) and ActivityNet Captions Krishna et al. (2017) (ANetCap) datasets, respectively. The train/test instances are reorganised by Yuan et al. (2021) into train, val, iid test and ood test sets. Robustness of video grounding models are measured by the performance gap between their iid and ood test sets. We also conduct experiments on Cha-STA and ANetCap to further validate our strategies. Statistics of the datasets are summarized in Table 1.
| Dataset | Split | # Videos | # Annotations |
|---|---|---|---|
| Charades-CD | train | 4,564 | 11,071 |
| val | 333 | 859 | |
| test-iid (iid) | 333 | 823 | |
| test-ood (ood) | 1,442 | 3,375 | |
| ActivityNet-CD | train | 10,984 | 51,415 |
| val | 746 | 3,521 | |
| test-iid (iid) | 746 | 3,443 | |
| test-ood (ood) | 2,450 | 13,578 | |
| Charades-STA | train | 5,338 | 12,408 |
| test | 1,334 | 3,720 | |
| ActivityNet Caps | train | 10,009 | 37,421 |
| test | 4,917 | 34,536 |
Evaluation Metric
The measure denotes the percentage of test samples that have at least one result whose Intersection over Union (IoU) with ground truth is larger than in top- predictions. The measure , is the discounted- proposed by Yuan et al. (2021). This metric introduces two discount factors computed from the boundaries of predicted and ground truth moments to restrain over-long predictions. We also report mIoU, which is the average IoU over all test samples. We set and .
Implementation Details
We utilize the d GloVe Pennington et al. (2014) vectors to initialize the words in query . For the video , we follow Yuan et al. (2021) with pre-trained I3D features Carreira and Zisserman (2017) for Cha-CD and Cha-STA, and C3D features Tran et al. (2015) for ANet-CD and ANetCap. For the model parameters, we follow Zhang et al. (2020a) and use the hidden size of for all hidden layers, the head size of 8 for multi-head attention, and the kernel size of 7 for convolutions. For data debiasing, we empirically partition each video into clips. Adam Kingma and Ba (2015) optimizer is used with batch size of and learning rate of for training.
4.2 Experimental Results
| Split | Method | mIoU | ||||
|---|---|---|---|---|---|---|
| =0.5 | =0.7 | =0.5 | =0.7 | |||
| iid | Q-only | 29.65 | 17.89 | 26.98 | 17.06 | 34.67 |
| V-only | 30.38 | 20.29 | 27.94 | 19.28 | 33.24 | |
| VSLNet | 60.51 | 41.07 | 56.12 | 39.25 | 54.39 | |
| ood | Q-only | 15.17 | 5.99 | 12.96 | 5.54 | 20.87 |
| V-only | 16.71 | 6.96 | 14.18 | 6.48 | 20.03 | |
| VSLNet | 48.18 | 28.89 | 43.29 | 27.20 | 45.56 | |
Bias in backbone model
We first study the performance of backbone model on the Cha-CD dataset. In particular, we separately train the standard VSLNet, query-only model (Q-only), and video-only model (V-only). The results are summarized in Table 2. Observe that both Q-only and V-only models achieve fair performance on iid test set, but poorer on ood test set, e.g., on iid versus on ood for Q-only model over the measure. Similar observation holds on the standard VSLNet. We conclude that the backbone model fails to generalize well on test set with ood samples.
| Split | Method | Charades-CD | ActivityNet-CD | ||||
|---|---|---|---|---|---|---|---|
| mIoU | mIoU | ||||||
| =0.5 | =0.7 | =0.5 | =0.7 | ||||
| iid | VSLNet | 56.12 | 39.25 | 54.39 | 43.40 | 31.37 | 47.57 |
| +DD | 55.01 | 36.78 | 53.42 | 42.45 | 28.28 | 45.90 | |
| +MD | 54.69 | 37.41 | 53.26 | 40.51 | 27.60 | 43.62 | |
| +DD+MD | 55.66 | 38.87 | 53.92 | 40.88 | 28.11 | 44.71 | |
| ood | VSLNet | 43.29 | 27.20 | 45.56 | 20.96 | 11.59 | 29.95 |
| +DD | 49.02 | 31.69 | 49.60 | 23.09 | 13.45 | 30.19 | |
| +MD | 49.26 | 31.64 | 49.49 | 25.33 | 14.41 | 30.55 | |
| +DD+MD | 50.37 | 32.70 | 50.30 | 25.05 | 14.67 | 30.56 | |
| all | VSLNet | 45.81 | 29.56 | 47.30 | 25.47 | 15.66 | 33.19 |
| +DD | 50.19 | 32.81 | 50.57 | 26.77 | 16.43 | 33.31 | |
| +MD | 50.63 | 33.33 | 50.40 | 28.38 | 17.05 | 33.17 | |
| +DD+MD | 51.40 | 34.08 | 51.01 | 28.25 | 17.43 | 33.42 | |
| Method | Charades-STA | ActivityNet Caps | ||||
|---|---|---|---|---|---|---|
| mIoU | mIoU | |||||
| =0.5 | =0.7 | =0.5 | =0.7 | |||
| VSLNet | 51.22 | 35.08 | 51.31 | 37.16 | 24.29 | 43.01 |
| +DD | 51.12 | 37.10 | 51.96 | 36.88 | 24.45 | 43.31 |
| +MD | 51.55 | 36.05 | 51.17 | 37.16 | 25.03 | 42.88 |
| +DD+MD | 53.97 | 38.06 | 52.18 | 37.45 | 25.26 | 43.26 |
Impact of data and model debiasing
Results of applying data debiasing (DD) and model debiasing (MD) strategies are summarized in Table 3, where “all” means all samples in both iid and ood test sets.111More complete results are summarized in Appendix. On both iid test sets, performance drop is observed after applying DD and MD strategies. The reason is both DD and MD prevent the model from exploiting distribution bias in training. On contrast, for ood test sets, both DD and MD significantly improve the performance. In addition, by combining DD and MD, further improvements are observed on ood test sets. Thus, the performance gaps between iid and ood sets are reduced further. On the combined test samples (iid + ood), DD and MD together bring performance increase on both datasets.
Table 4 reports results on original Cha-STA and ANetCap datasets. Note moment annotation distributions of train and test sets are almost the same for both Cha-STA and ANetCap datasets Yuan et al. (2021). Observe that small improvements are observed after applying DD and MD strategies on both datasets. The DD and MD encourage TSGV model to focus more on exploiting cross-modal reasoning between video and query, which contributes to the performance improvements.
| Split | mIoU | ||||
|---|---|---|---|---|---|
| =0.3 | =0.5 | =0.7 | |||
| iid | 4 | 65.82 | 54.75 | 37.46 | 53.75 |
| 5 | 65.79 | 55.01 | 36.78 | 53.92 | |
| 6 | 65.67 | 56.46 | 36.86 | 53.86 | |
| ood | 4 | 59.89 | 48.63 | 31.31 | 48.86 |
| 5 | 60.68 | 49.02 | 31.69 | 49.60 | |
| 6 | 59.45 | 48.81 | 30.80 | 49.33 | |
| all | 4 | 61.05 | 50.09 | 32.51 | 49.82 |
| 5 | 61.68 | 50.19 | 32.81 | 50.57 | |
| 6 | 60.67 | 50.31 | 31.99 | 50.22 | |
| Split | Method | mIoU | |||
|---|---|---|---|---|---|
| =0.3 | =0.5 | =0.7 | |||
| iid | VSLNet | 66.72 | 56.12 | 39.25 | 54.39 |
| +V-MD | 65.68 | 56.41 | 38.04 | 54.11 | |
| +Q-MD | 65.56 | 55.95 | 38.95 | 53.41 | |
| +MD | 65.22 | 54.69 | 37.41 | 53.26 | |
| ood | VSLNet | 55.85 | 43.29 | 27.20 | 45.56 |
| +V-MD | 58.21 | 47.50 | 30.53 | 48.42 | |
| +Q-MD | 57.90 | 46.63 | 30.33 | 47.60 | |
| +MD | 60.59 | 49.26 | 31.64 | 49.49 | |
| all | VSLNet | 57.98 | 45.81 | 29.56 | 47.30 |
| +V-MD | 59.67 | 49.25 | 32.00 | 49.53 | |
| +Q-MD | 59.40 | 48.45 | 32.02 | 48.74 | |
| +MD | 60.93 | 50.63 | 33.33 | 50.40 | |
Comparison with state-of-the-arts
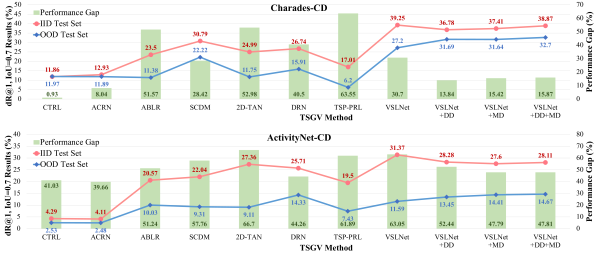
Figure 4 depicts the results of SOTA models on Cha-CD and ANet-CD datasets. We compare with 1) the proposal-based methods, CTRL Gao et al. (2017), ACRN Liu et al. (2018a) and SCDM Yuan et al. (2019a); 2) the proposal-free methods, ABLR Yuan et al. (2019b), 2D-TAN Zhang et al. (2020b) and DRN Zeng et al. (2020); 3) the RL-based method TSP-PRL Wu et al. (2020). All the results of these models are reported by Yuan et al. (2021). In general, our backbone model, and the version with DD and MD strategies, are superior to the compared SOTA models on both datasets.
Although the performance of these models varies greatly, we are more interested in their performance gap between iid and ood test sets. Specifically, we define the performance gap as:
where denotes absolute value operation, and represent the score of a model on iid and ood test sets, respectively. Smaller means the model is more robust.
On Cha-CD dataset, CTRL and ACRN achieve comparable performance gap between iid and ood test sets. Other methods, including VSLNet, show large performance gap between iid and ood test sets. Compared to those SOTAs, the gap of VSLNet is moderate, with . With data debiasing, of VSLNet decreases from to . DD strategy significantly improves the results on ood test set by balancing the distribution of train set to be more uniform. MD strategy also reduces the distinctly by disentangling the bias from the TSGV model with two unimodal branches during training.
On ANet-CD dataset, the performance gap between iid and ood test sets are more conspicuous than that on Cha-CD dataset. Specifically, of VSLNet is , the second largest among all models. By applying DD and MD strategies, the results on ood set increase and the results on iid set slightly decrease. After debiasing, of VSLNet reduces significantly.
Analysis of data debiasing strategy
We now study the effect of the number of clips in data debiasing (DD) strategy on Cha-CD dataset. We evaluate and report results in Table 5. Observe that performances of VSLNet+DD with different s are comparable on the iid test set. However, VSLNet+DD with consistently outperforms the model with other values on the ood test set. Besides, VSLNet+DD with also performs best over all test samples. Similar observations hold on the ANet-CD dataset.
Analysis of model debiasing strategy
Here we study the effect of each unimodal model, i.e., video-only and query-only branches on VSLNet. The results are summarized in Table 6. V-MD and Q-MD denotes debiasing using video-only or query-only branch only. Both V-MD and Q-MD strategies lead to significant improvement on the ood test set, and slight degradation on the iid test set. We observe the same on the ANet-CD dataset. This set of results indicate that model debiasing on both video and query sides are necessary for learning a robust TSGV model.
| Dataset | ||||||
|---|---|---|---|---|---|---|
| Cha-CD | 30.75s | 8.12s | 6.22 | 2.42 | 1,255 | 69 |
| ANet-CD | 117.60s | 37.14s | 14.41 | 4.82 | 13,707 | 901 |
Performance differences on Cha-CD and ANet-CD
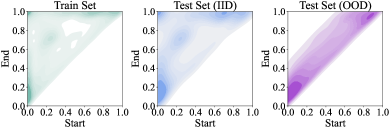
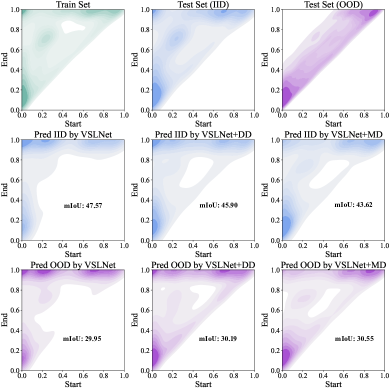
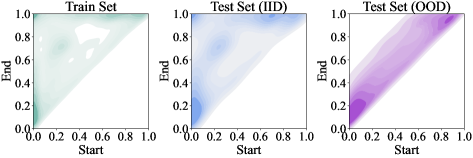
The data and model debiasing strategies show their strong generalization capability on the test set with out-of-distribution. However, we observe that the performance of the two strategies on ANet-CD dataset are inferior to that on Cha-CD dataset. Based on data statistics of the two datasets (see Table 7), ANet-CD dataset is more challenging than Cha-CD, because the average video and query lengths of ANet-CD are much larger. Besides, ANet-CD contains more than 900 different action verbs while Cha-CD has 69 verbs only. That is, the activities/events of ANet-CD are many more diverse than that in Cha-CD. This could contribute to the difficulty of debiasing ANet-CD. Figure 5 depicts the predicted annotation distributions of VSLNet and two proposed debiasing strategies on iid and ood test sets. Despite the improvements have been made by DD and MD, we observe that the predicted distributions of ood test set by VSLNet+DD/+MD remain similar to that of train set. In other words, the bias issue is more challenging to address on ANet-CD dataset.
5 Conclusion
In this work, we propose two simple yet effective strategies, data debiasing and model debiasing, to mitigate data distribution bias in TSGV task. We design the data debiasing strategy to balance the sample distribution by oversampling with video truncation. The model debiasing guides the TSGV model to learn accurate cross-modal interactions. With the help of two unimodal branches, we reduce the loss propagated to the TSGV model for biased samples and amplify the loss for non-biased samples. Through extensive experiments, we show that both data and model debiasing strategies contribute performance improvement on ood test sets.
References
- Agrawal et al. (2018) Aishwarya Agrawal, Dhruv Batra, Devi Parikh, and Aniruddha Kembhavi. 2018. Don’t just assume; look and answer: Overcoming priors for visual question answering. In IEEE Conference on Computer Vision and Pattern Recognition (CVPR).
- Cadene et al. (2019) Remi Cadene, Corentin Dancette, Hedi Ben younes, Matthieu Cord, and Devi Parikh. 2019. Rubi: Reducing unimodal biases for visual question answering. In Advances in Neural Information Processing Systems 32, pages 839–850. Curran Associates, Inc.
- Carreira and Zisserman (2017) João Carreira and Andrew Zisserman. 2017. Quo vadis, action recognition? a new model and the kinetics dataset. In IEEE Conference on Computer Vision and Pattern Recognition, pages 4724–4733.
- Chen et al. (2018) Jingyuan Chen, Xinpeng Chen, Lin Ma, Zequn Jie, and Tat-Seng Chua. 2018. Temporally grounding natural sentence in video. In Proceedings of the 2018 Conference on Empirical Methods in Natural Language Processing, pages 162–171.
- Chen et al. (2020a) Long Chen, Chujie Lu, Siliang Tang, Jun Xiao, Dong Zhang, Chilie Tan, and Xiaolin Li. 2020a. Rethinking the bottom-up framework for query-based video localization. In Proceedings of the AAAI Conference on Artificial Intelligence.
- Chen et al. (2020b) Long Chen, Xin Yan, Jun Xiao, Hanwang Zhang, Shiliang Pu, and Yueting Zhuang. 2020b. Counterfactual samples synthesizing for robust visual question answering. In Proceedings of the IEEE/CVF Conference on Computer Vision and Pattern Recognition (CVPR).
- Chen and Jiang (2019) Shaoxiang Chen and Yu-Gang Jiang. 2019. Semantic proposal for activity localization in videos via sentence query. In Proceedings of the AAAI Conference on Artificial Intelligence, volume 33.
- Clark et al. (2019) Christopher Clark, Mark Yatskar, and Luke Zettlemoyer. 2019. Don’t take the easy way out: Ensemble based methods for avoiding known dataset biases. In Proceedings of the 2019 Conference on Empirical Methods in Natural Language Processing and the 9th International Joint Conference on Natural Language Processing (EMNLP-IJCNLP), pages 4069–4082, Hong Kong, China. Association for Computational Linguistics.
- Duan et al. (2018) Xuguang Duan, Wenbing Huang, Chuang Gan, Jingdong Wang, Wenwu Zhu, and Junzhou Huang. 2018. Weakly supervised dense event captioning in videos. In Advances in Neural Information Processing Systems, volume 31. Curran Associates, Inc.
- Gao et al. (2017) Jiyang Gao, Chen Sun, Zhenheng Yang, and Ramakant Nevatia. 2017. Tall: Temporal activity localization via language query. In IEEE International Conference on Computer Vision, pages 5277–5285.
- Gao et al. (2019) Mingfei Gao, Larry Davis, Richard Socher, and Caiming Xiong. 2019. WSLLN:weakly supervised natural language localization networks. In Proceedings of the 2019 Conference on Empirical Methods in Natural Language Processing and the 9th International Joint Conference on Natural Language Processing (EMNLP-IJCNLP), pages 1481–1487, Hong Kong, China. Association for Computational Linguistics.
- Ge et al. (2019) Runzhou Ge, Jiyang Gao, Kan Chen, and Ram Nevatia. 2019. Mac: Mining activity concepts for language-based temporal localization. In IEEE Winter Conference on Applications of Computer Vision.
- Ghosh et al. (2019) Soham Ghosh, Anuva Agarwal, Zarana Parekh, and Alexander Hauptmann. 2019. ExCL: Extractive Clip Localization Using Natural Language Descriptions. In Proceedings of the 2019 Conference of the North American Chapter of the Association for Computational Linguistics, pages 1984–1990.
- Goyal et al. (2017) Yash Goyal, Tejas Khot, Douglas Summers-Stay, Dhruv Batra, and Devi Parikh. 2017. Making the v in vqa matter: Elevating the role of image understanding in visual question answering. In 2017 IEEE Conference on Computer Vision and Pattern Recognition (CVPR), pages 6325–6334.
- Grand and Belinkov (2019) Gabriel Grand and Yonatan Belinkov. 2019. Adversarial regularization for visual question answering: Strengths, shortcomings, and side effects. In Proceedings of the Second Workshop on Shortcomings in Vision and Language, pages 1–13, Minneapolis, Minnesota. Association for Computational Linguistics.
- Hahn et al. (2020) Meera Hahn, Asim Kadav, James M Rehg, and Hans Peter Graf. 2020. Tripping through time: Efficient localization of activities in videos. In The British Machine Vision Conference.
- He et al. (2019) Dongliang He, Xiang Zhao, Jizhou Huang, Fu Li, Xiao Liu, and Shilei Wen. 2019. Read, watch, and move: Reinforcement learning for temporally grounding natural language descriptions in videos. In Proceedings of the AAAI Conference on Artificial Intelligence, volume 33, pages 8393–8400.
- Hendricks et al. (2018) Lisa Anne Hendricks, Oliver Wang, Eli Shechtman, Josef Sivic, Trevor Darrell, and Bryan Russell. 2018. Localizing moments in video with temporal language. In Proceedings of the 2018 Conference on Empirical Methods in Natural Language Processing.
- Hendricks et al. (2017) Lisa Anne Hendricks, Oliver Wang, Eli Shechtman, Josef Sivic, Trevor Darrell, and Bryan C. Russell. 2017. Localizing moments in video with natural language. In 2017 IEEE International Conference on Computer Vision, pages 5804–5813.
- Kingma and Ba (2015) Diederik P. Kingma and Jimmy Ba. 2015. Adam: A method for stochastic optimization. In International Conference on Learning Representations.
- Krishna et al. (2017) R. Krishna, K. Hata, F. Ren, L. Fei-Fei, and J. C. Niebles. 2017. Dense-captioning events in videos. In IEEE International Conference on Computer Vision, pages 706–715.
- Li et al. (2021) Kun Li, Dan Guo, and Meng Wang. 2021. Proposal-free video grounding with contextual pyramid network. In Proceedings of the AAAI Conference on Artificial Intelligence.
- Liang et al. (2020) Zujie Liang, Weitao Jiang, Haifeng Hu, and Jiaying Zhu. 2020. Learning to contrast the counterfactual samples for robust visual question answering. In Proceedings of the 2020 Conference on Empirical Methods in Natural Language Processing (EMNLP), pages 3285–3292, Online. Association for Computational Linguistics.
- Lin et al. (2020) Zhijie Lin, Zhou Zhao, Zhu Zhang, Qi Wang, and Huasheng Liu. 2020. Weakly-supervised video moment retrieval via semantic completion network. In Proceedings of the AAAI Conference on Artificial Intelligence.
- Liu et al. (2018a) Meng Liu, Xiang Wang, Liqiang Nie, Xiangnan He, Baoquan Chen, and Tat-Seng Chua. 2018a. Attentive moment retrieval in videos. In The 41st International ACM SIGIR Conference on Research & Development in Information Retrieval, pages 15–24.
- Liu et al. (2018b) Meng Liu, Xiang Wang, Liqiang Nie, Qi Tian, Baoquan Chen, and Tat-Seng Chua. 2018b. Cross-modal moment localization in videos. In Proceedings of the 26th ACM International Conference on Multimedia, pages 843–851.
- Lu et al. (2019) Chujie Lu, Long Chen, Chilie Tan, Xiaolin Li, and Jun Xiao. 2019. DEBUG: A dense bottom-up grounding approach for natural language video localization. In Proceedings of the 2019 Conference on Empirical Methods in Natural Language Processing and the 9th International Joint Conference on Natural Language Processing, pages 5147–5156.
- Mithun et al. (2019) Niluthpol Chowdhury Mithun, Sujoy Paul, and Amit K. Roy-Chowdhury. 2019. Weakly supervised video moment retrieval from text queries. In Computer Vision and Pattern Recognition, pages 11592–11601.
- Nan et al. (2021) Guoshun Nan, Rui Qiao, Yao Xiao, Jun Liu, Sicong Leng, Hao Zhang, and Wei Lu. 2021. Interventional video grounding with dual contrastive learning. In Proceedings of the IEEE/CVF Conference on Computer Vision and Pattern Recognition (CVPR), pages 2765–2775.
- Otani et al. (2020) Mayu Otani, Yuta Nakahima, Esa Rahtu, and Janne Heikkilä. 2020. Uncovering hidden challenges in query-based video moment retrieval. In The British Machine Vision Conference (BMVC).
- Pennington et al. (2014) Jeffrey Pennington, Richard Socher, and Christopher Manning. 2014. Glove: Global vectors for word representation. In Proceedings of the 2014 Conference on Empirical Methods in Natural Language Processing (EMNLP), pages 1532–1543. Association for Computational Linguistics.
- Ramakrishnan et al. (2018) Sainandan Ramakrishnan, Aishwarya Agrawal, and Stefan Lee. 2018. Overcoming language priors in visual question answering with adversarial regularization. In Advances in Neural Information Processing Systems 31, pages 1541–1551. Curran Associates, Inc.
- Song et al. (2020) Yijun Song, Jingwen Wang, Lin Ma, Zhou Yu, and Jun Yu. 2020. Weakly-supervised multi-level attentional reconstruction network for grounding textual queries in videos. arXiv preprint arXiv:2003.07048.
- Tan et al. (2021) Reuben Tan, Huijuan Xu, Kate Saenko, and Bryan A. Plummer. 2021. Logan: Latent graph co-attention network for weakly-supervised video moment retrieval. In Proceedings of the IEEE/CVF Winter Conference on Applications of Computer Vision (WACV), pages 2083–2092.
- Tran et al. (2015) Du Tran, Lubomir Bourdev, Rob Fergus, Lorenzo Torresani, and Manohar Paluri. 2015. Learning spatiotemporal features with 3d convolutional networks. In Proceedings of the IEEE international conference on computer vision, pages 4489–4497.
- Vaswani et al. (2017) Ashish Vaswani, Noam Shazeer, Niki Parmar, Jakob Uszkoreit, Llion Jones, Aidan N Gomez, Ł ukasz Kaiser, and Illia Polosukhin. 2017. Attention is all you need. In Advances in Neural Information Processing Systems, pages 5998–6008. Curran Associates, Inc.
- Wang et al. (2020) Jingwen Wang, Lin Ma, and Wenhao Jiang. 2020. Temporally grounding language queries in videos by contextual boundary-aware prediction. In Proceedings of the AAAI Conference on Artificial Intelligence.
- Wang et al. (2019) Weining Wang, Yan Huang, and Liang Wang. 2019. Language-driven temporal activity localization: A semantic matching reinforcement learning model. In Proceedings of the IEEE Conference on Computer Vision and Pattern Recognition.
- Wu et al. (2020) Jie Wu, Guanbin Li, Si Liu, and Liang Lin. 2020. Tree-structured policy based progressive reinforcement learning for temporally language grounding in video. In Proceedings of the AAAI Conference on Artificial Intelligence.
- Xiao et al. (2021) Shaoning Xiao, Long Chen, Songyang Zhang, Wei Ji, Jian Shao, Lu Ye, and Jun Xiao. 2021. Boundary proposal network for two-stage natural language video localization. In Proceedings of the AAAI Conference on Artificial Intelligence.
- Xu et al. (2019) Huijuan Xu, Kun He, Bryan A. Plummer, L. Sigal, Stan Sclaroff, and Kate Saenko. 2019. Multilevel language and vision integration for text-to-clip retrieval. In Proceedings of the AAAI Conference on Artificial Intelligence, volume 33, pages 9062–9069.
- Yuan et al. (2021) Yitian Yuan, Xiaohan Lan, Long Chen, Wei Liu, and Wenwu Zhu. 2021. A closer look at temporal sentence grounding in videos: Datasets and metrics. arXiv preprint arXiv:2101.09028.
- Yuan et al. (2019a) Yitian Yuan, Lin Ma, Jingwen Wang, Wei Liu, and Wenwu Zhu. 2019a. Semantic conditioned dynamic modulation for temporal sentence grounding in videos. In Advances in Neural Information Processing Systems, pages 536–546.
- Yuan et al. (2019b) Yitian Yuan, Tao Mei, and Wenwu Zhu. 2019b. To find where you talk: Temporal sentence localization in video with attention based location regression. In Proceedings of the AAAI Conference on Artificial Intelligence, volume 33, pages 9159–9166.
- Zeng et al. (2020) Runhao Zeng, Haoming Xu, Wenbing Huang, Peihao Chen, Mingkui Tan, and Chuang Gan. 2020. Dense regression network for video grounding. In Proceedings of the IEEE/CVF Conference on Computer Vision and Pattern Recognition, pages 10287–10296.
- Zhang et al. (2019a) Da Zhang, Xiyang Dai, Xin Wang, Yuan-Fang Wang, and Larry S Davis. 2019a. Man: Moment alignment network for natural language moment retrieval via iterative graph adjustment. In Proceedings of the IEEE Conference on Computer Vision and Pattern Recognition, pages 1247–1257.
- Zhang et al. (2021a) Hao Zhang, Aixin Sun, Wei Jing, Guoshun Nan, Liangli Zhen, Joey Tianyi Zhou, and Rick Siow Mong Goh. 2021a. Video corpus moment retrieval with contrastive learning. In Proceedings of the 44th International ACM SIGIR Conference on Research and Development in Information Retrieval, SIGIR ’21, page 685–695, New York, NY, USA. Association for Computing Machinery.
- Zhang et al. (2021b) Hao Zhang, Aixin Sun, Wei Jing, Liangli Zhen, Joey Tianyi Zhou, and Rick Siow Mong Goh. 2021b. Natural language video localization: A revisit in span-based question answering framework. IEEE Transactions on Pattern Analysis and Machine Intelligence.
- Zhang et al. (2021c) Hao Zhang, Aixin Sun, Wei Jing, Liangli Zhen, Joey Tianyi Zhou, and Siow Mong Rick Goh. 2021c. Parallel attention network with sequence matching for video grounding. In Findings of the Association for Computational Linguistics: ACL-IJCNLP 2021, pages 776–790, Online. Association for Computational Linguistics.
- Zhang et al. (2020a) Hao Zhang, Aixin Sun, Wei Jing, and Joey Tianyi Zhou. 2020a. Span-based localizing network for natural language video localization. In Proceedings of the 58th Annual Meeting of the Association for Computational Linguistics, pages 6543–6554.
- Zhang et al. (2020b) Songyang Zhang, Houwen Peng, Jianlong Fu, and Jiebo Luo. 2020b. Learning 2d temporal adjacent networks formoment localization with natural language. In Proceedings of the AAAI Conference on Artificial Intelligence.
- Zhang et al. (2019b) Zhu Zhang, Zhijie Lin, Zhou Zhao, and Zhenxin Xiao. 2019b. Cross-modal interaction networks for query-based moment retrieval in videos. In Proceedings of the 42nd International ACM SIGIR Conference on Research and Development in Information Retrieval.
- Zhou et al. (2021) Hao Zhou, Chongyang Zhang, Yan Luo, Yanjun Chen, and Chuanping Hu. 2021. Embracing uncertainty: Decoupling and de-bias for robust temporal grounding. arXiv preprint arXiv:2103.16848.
Appendix A Detailed Experimental Settings and Results
This appendix provides detailed experiment settings, the visualization of the benchmark datasets and more complete results of different strategies on the benchmark datasets.
We utilize the d GloVe Pennington et al. (2014) vectors to initialize the lowercase words in query . For the video , we follow Yuan et al. (2021) with pre-trained I3D features Carreira and Zisserman (2017) for Cha-CD and Cha-STA, and pre-trained C3D features Tran et al. (2015) for ANet-CD and ANetCap. For all the benchmark datasets, we set the maximal visual sequence feature length as . For the model parameters, we follow Zhang et al. (2020a) and use the hidden size of for all hidden layers, the head size of 8 for multi-head attention, and the kernel size of 7 for convolutions. For data debiasing, we empirically partition each video into clips. Adam Kingma and Ba (2015) optimizer is used with batch size of and learning rate of for training. The model is trained by 100 epochs in total with early stopping tolerance of epochs. All experiments are conducted on a workstation with dual NVIDIA GeForce RTX 3090 GPUs.
Figure 6 depicts the moment annotation distributions of the evaluated datasets, i.e., Charades-STA Gao et al. (2017), Charades-CD Yuan et al. (2021), ActivityNet Captions Krishna et al. (2017) and ActivityNet-CD Yuan et al. (2021). Table 8 summarizes the complete results of , and mIoU by applying data debiasing and model debiasing strategies on top of VSLNet on the Charades-CD and ActivityNet-CD datasets. Table 9 summarizes the complete results of , and mIoU by applying data debiasing and model debiasing strategies on top of VSLNet on the Charades-STA and ActivityNet Captions datasets. Table 10 summarizes the complete results of VSLNet with data debiasing strategy over different number of clip on the Charades-CD and ActivityNet-CD datasets. Table 11 summarizes the complete results of VSLNet with different model debiasing strategies on the Charades-CD and ActivityNet-CD datasets.

| Split | Method | Charades-CD | ActivityNet-CD | ||||||||||||
| mIoU | mIoU | ||||||||||||||
| =0.3 | =0.5 | =0.7 | =0.3 | =0.5 | =0.7 | =0.3 | =0.5 | =0.7 | =0.3 | =0.5 | =0.7 | ||||
| iid | VSLNet | 75.09 | 60.51 | 41.07 | 66.72 | 56.12 | 39.25 | 54.39 | 63.18 | 49.16 | 32.37 | 52.41 | 43.40 | 31.37 | 47.57 |
| +DD | 74.73 | 59.54 | 38.40 | 65.79 | 55.01 | 36.78 | 53.42 | 62.08 | 47.95 | 30.10 | 51.81 | 42.45 | 28.28 | 45.90 | |
| +MD | 73.39 | 59.17 | 39.13 | 65.22 | 54.69 | 37.41 | 53.26 | 58.73 | 45.10 | 29.32 | 50.23 | 40.51 | 27.60 | 43.62 | |
| +DD+MD | 74.85 | 59.97 | 40.55 | 67.19 | 55.66 | 38.87 | 53.92 | 60.65 | 45.84 | 29.94 | 51.26 | 40.88 | 28.11 | 44.71 | |
| ood | VSLNet | 65.93 | 48.18 | 28.89 | 55.85 | 43.29 | 27.20 | 45.56 | 41.71 | 23.31 | 12.06 | 32.99 | 20.96 | 11.59 | 29.95 |
| +DD | 71.88 | 54.84 | 33.69 | 60.68 | 49.02 | 31.69 | 49.60 | 42.21 | 25.09 | 14.00 | 35.12 | 23.09 | 13.45 | 30.19 | |
| +MD | 70.79 | 54.90 | 33.30 | 60.59 | 49.26 | 31.64 | 49.49 | 42.43 | 27.70 | 15.01 | 36.08 | 25.33 | 14.41 | 30.55 | |
| +DD+MD | 70.10 | 55.82 | 34.70 | 60.81 | 50.37 | 32.70 | 50.30 | 42.78 | 27.33 | 15.10 | 36.16 | 25.05 | 14.67 | 30.56 | |
| all | VSLNet | 67.72 | 50.60 | 31.28 | 57.98 | 45.81 | 29.56 | 47.30 | 46.02 | 28.49 | 16.14 | 36.89 | 25.47 | 15.66 | 33.19 |
| +DD | 72.44 | 55.76 | 34.61 | 61.68 | 50.19 | 32.81 | 50.57 | 46.19 | 29.68 | 17.23 | 38.18 | 26.77 | 16.43 | 33.31 | |
| +MD | 70.25 | 55.79 | 35.30 | 60.93 | 50.63 | 33.33 | 50.40 | 45.70 | 31.19 | 17.88 | 38.92 | 28.38 | 17.05 | 33.17 | |
| +DD+MD | 71.03 | 57.03 | 36.06 | 62.06 | 51.40 | 34.08 | 51.01 | 46.38 | 31.09 | 18.14 | 39.21 | 28.25 | 17.43 | 33.42 | |
| Method | Charades-STA | ActivityNet Captions | ||||||||||||
| mIoU | mIoU | |||||||||||||
| =0.3 | =0.5 | =0.7 | =0.3 | =0.5 | =0.7 | =0.3 | =0.5 | =0.7 | =0.3 | =0.5 | =0.7 | |||
| VSLNet | 71.18 | 55.73 | 36.83 | 62.04 | 51.22 | 35.08 | 51.31 | 59.30 | 42.50 | 26.01 | 48.13 | 37.16 | 24.29 | 43.01 |
| +DD | 71.75 | 55.38 | 38.90 | 62.49 | 51.12 | 37.10 | 51.96 | 59.68 | 42.21 | 26.19 | 48.18 | 36.88 | 24.45 | 43.31 |
| +MD | 70.19 | 55.75 | 37.80 | 61.72 | 51.55 | 36.05 | 51.17 | 58.46 | 42.14 | 26.74 | 47.96 | 37.16 | 25.03 | 42.88 |
| +DD+MD | 70.05 | 58.49 | 39.92 | 62.27 | 53.97 | 38.06 | 52.18 | 59.66 | 42.89 | 26.99 | 48.99 | 37.45 | 25.26 | 43.46 |
| Split | Charades-CD | ActivityNet-CD | |||||||||||||
| mIoU | mIoU | ||||||||||||||
| =0.3 | =0.5 | =0.7 | =0.3 | =0.5 | =0.7 | =0.3 | =0.5 | =0.7 | =0.3 | =0.5 | =0.7 | ||||
| iid | 4 | 74.00 | 59.17 | 39.13 | 65.82 | 54.75 | 37.46 | 53.75 | 61.49 | 46.49 | 28.90 | 51.36 | 41.15 | 27.16 | 45.17 |
| 5 | 74.73 | 59.54 | 38.40 | 65.79 | 55.01 | 36.78 | 53.92 | 63.18 | 47.11 | 30.81 | 52.23 | 41.63 | 28.88 | 45.98 | |
| 6 | 74.24 | 61.24 | 38.52 | 65.67 | 56.46 | 36.86 | 53.86 | 61.92 | 46.30 | 30.45 | 51.46 | 41.21 | 28.61 | 45.63 | |
| ood | 4 | 70.43 | 54.28 | 33.24 | 59.89 | 48.63 | 31.31 | 48.86 | 42.56 | 26.47 | 14.07 | 35.31 | 24.04 | 13.45 | 30.39 |
| 5 | 71.88 | 54.84 | 33.69 | 60.68 | 49.02 | 31.69 | 49.60 | 43.09 | 26.81 | 14.33 | 35.63 | 24.29 | 13.74 | 31.30 | |
| 6 | 69.66 | 54.52 | 32.71 | 59.45 | 48.81 | 30.80 | 49.33 | 42.62 | 26.04 | 13.68 | 35.08 | 23.73 | 13.16 | 30.33 | |
| all | 4 | 71.13 | 55.55 | 34.40 | 61.05 | 50.09 | 32.51 | 49.82 | 46.36 | 30.49 | 17.05 | 38.53 | 27.47 | 16.24 | 33.35 |
| 5 | 72.44 | 55.76 | 34.61 | 61.68 | 50.19 | 32.81 | 50.57 | 47.12 | 30.88 | 17.64 | 38.96 | 27.77 | 16.77 | 34.18 | |
| 6 | 70.56 | 55.84 | 33.85 | 60.67 | 50.31 | 31.99 | 50.22 | 46.49 | 30.10 | 17.05 | 38.36 | 27.23 | 16.26 | 33.40 | |
| Split | Method | Charades-CD | ActivityNet-CD | ||||||||||||
| mIoU | mIoU | ||||||||||||||
| =0.3 | =0.5 | =0.7 | =0.3 | =0.5 | =0.7 | =0.3 | =0.5 | =0.7 | =0.3 | =0.5 | =0.7 | ||||
| iid | VSLNet | 75.09 | 60.51 | 41.07 | 66.72 | 56.12 | 39.25 | 54.39 | 63.18 | 49.16 | 32.37 | 52.41 | 43.40 | 31.37 | 47.57 |
| +V-MD | 73.63 | 60.87 | 39.61 | 65.68 | 56.41 | 38.04 | 54.11 | 61.27 | 46.88 | 30.16 | 51.80 | 41.94 | 28.41 | 45.09 | |
| +Q-MD | 73.51 | 60.39 | 40.83 | 65.56 | 55.95 | 38.95 | 53.41 | 60.88 | 46.14 | 30.94 | 51.67 | 41.37 | 29.15 | 45.00 | |
| +MD | 73.39 | 59.17 | 39.13 | 65.22 | 54.69 | 37.41 | 53.26 | 58.73 | 45.10 | 29.32 | 50.23 | 40.51 | 27.60 | 43.62 | |
| ood | VSLNet | 65.93 | 48.18 | 28.89 | 55.85 | 43.29 | 27.20 | 45.56 | 41.71 | 23.31 | 12.06 | 32.99 | 20.96 | 11.59 | 29.95 |
| +V-MD | 68.24 | 52.74 | 32.47 | 58.21 | 47.50 | 30.53 | 48.42 | 42.85 | 27.23 | 14.56 | 36.07 | 24.91 | 13.96 | 30.45 | |
| +Q-MD | 67.11 | 51.59 | 32.18 | 57.90 | 46.63 | 30.33 | 47.60 | 42.89 | 27.06 | 14.60 | 36.14 | 24.73 | 14.01 | 30.58 | |
| +MD | 70.79 | 54.90 | 33.30 | 60.59 | 49.26 | 31.64 | 49.49 | 42.43 | 27.70 | 15.01 | 36.08 | 25.33 | 14.41 | 30.55 | |
| all | VSLNet | 67.72 | 50.60 | 31.28 | 57.98 | 45.81 | 29.56 | 47.30 | 46.02 | 28.49 | 16.14 | 36.89 | 25.47 | 15.66 | 33.19 |
| +V-MD | 69.92 | 54.34 | 33.87 | 59.67 | 49.25 | 32.00 | 49.53 | 46.54 | 31.18 | 17.12 | 39.23 | 28.13 | 16.75 | 33.35 | |
| +Q-MD | 68.37 | 53.31 | 33.87 | 59.40 | 48.45 | 32.02 | 48.74 | 46.50 | 30.88 | 17.28 | 39.26 | 27.86 | 16.85 | 33.47 | |
| +MD | 70.25 | 55.79 | 35.30 | 60.93 | 50.63 | 33.33 | 50.40 | 45.70 | 31.19 | 17.88 | 38.92 | 28.38 | 17.05 | 33.17 | |