GWSkyNet-Multi : A Machine Learning Multi-Class classifier for LIGO–Virgo Public Alerts
Abstract
Compact object mergers which produce both detectable gravitational waves and electromagnetic emission can provide valuable insights into the neutron star equation of state, the tension in the Hubble constant, and the origin of the r-process elements. However, electromagnetic follow-up of gravitational wave sources is complicated by false positive detections, and the transient nature of the associated electromagnetic emission. GWSkyNet-Multi is a machine learning model that attempts facilitate EM follow-up by providing real-time predictions of the source of a gravitational wave detection. The model uses information from Open Public Alerts (OPAs) released by LIGO–Virgo within minutes of a gravitational wave detection. GWSkyNet was introduced in Cabero et al. (2020) as a binary classifier and uses the OPA skymaps to classify sources as either astrophysical or as glitches. In this paper, we introduce GWSkyNet-Multi, an extension of GWSkyNet which further distinguishes sources as binary black hole mergers, mergers involving a neutron star, or non-astrophysical glitches. GWSkyNet-Multi is a sequence of three one-versus-all classifiers trained using a class-balanced and physically-motivated source mass distribution. Training on this data set, we obtain test set accuracies of 93.7% for BBH-versus-all, 94.4% for NS-versus-all, and 95.1% for glitch-versus-all. We obtain an overall accuracy of 93.4% using a hierarchical classification scheme. Furthermore, we correctly identify 36 of the 40 gravitational wave detections from the first half of LIGO–Virgo’s third observing run (O3a) and present predictions for O3b sources. As gravitational wave detections increase in number and frequency, GWSkyNet-Multi will be a powerful tool for prioritizing successful electromagnetic follow-up.
1 Introduction
The LIGO Scientific and Virgo Collaborations (LVC) made a monumental discovery in their second observing run (O2) with the detection of the first gravitational wave (GW) originating from a binary neutron star merger. This event, known as GW170817, is the only GW source which has been associated with electromagnetic (EM) emission (Abbott et al. 2017a), marking a breakthrough for GW+EM multi-messenger astronomy. Multi-messenger astronomy has particularly exciting implications in fundamental physics — notably, joint GW and EM detections can place independent constraints on the Hubble constant (Abbott et al. 2017b), constrain the neutron star equation of state (Radice et al. 2018), and characterize the production of -process elements in compact binary coalescences (Mészáros et al. 2019). However, EM follow-up of GW events is hindered by high operating costs, competitive telescope time allocations, false positive GW alerts, and the short time during which the associated kilonova is detectable.
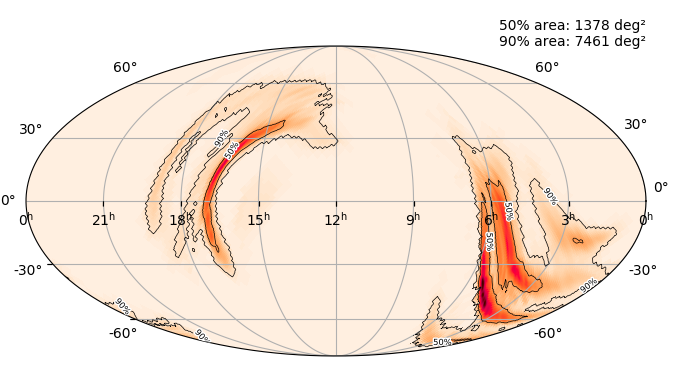
To facilitate EM follow-up, the LVC introduced the Open Public Alert (OPA) system for their third observing run (O3). OPAs are publicly available within minutes of a detection, and include a skymap (see Figure 1) indicating the localization region where a given event most likely originates from (Magee et al. 2015). An organized list of all the OPAs can be found on the Gravitational-wave Candidate Event Database (GraceDB, Stachie et al. 2021a). Although OPAs do not provide the raw GW data for a given event, they are useful in determining whether EM follow-up is warranted. To supplement the predictions available on GraceDB, Cabero et al. (2020) introduced a “real-versus-noise” binary classifier, known as GWSkyNet, which leverages OPAs to inform potential EM follow-up seconds after the OPA is published. GWSkyNet achieves a test set accuracy of 93.5% and correctly predicts 37 of the 40 O3a events published in the second Gravitational-Wave Transient Catalog (GWTC-2; Abbott et al. 2021a), before the publication of this catalog. This binary classifier demonstrates the great potential for applications of machine learning to classification of GW candidates in real-time from the information provided in OPAs. These positive results encourage the implementation of a new extension to now have a multi-class classifier.
Here we present GWSkyNet-Multi, our new multi-class classifier which is an extension of the original GWSkyNet, and assess its performance. In contrast with the previous binary classification, our novel multi-class classifier categorizes GW candidates into their possible progenitors: (1) binary black hole (BBH) mergers, (2) mergers involving a neutron star (NS) (either NS+NS or NS+BH), or (3) non-astrophysical glitches. GWSkyNet-Multi empowers EM astronomers to make decisions on whether to follow-up an event informed by predictions of the nature of the source that supplement the information available in OPAs (Chatterjee et al. (2020); LIGO/Virgo Public Alerts User Guide111https://emfollow.docs.ligo.org/userguide/). GWSkyNet-Multi is a sequence of three convolutional neural network (CNN) one-versus-all classifiers. As a CNN, GWSkyNet-Multi distinguishes itself from other prediction methods such as Stachie et al. (2021b) and Essick 2017 (skymap_statistics222https://github.com/reedessick/skymap_statistics) the latter of which employed mutual information distance of 2D GW skymaps to distinguish between signal and noise during O2. By running all of our models on a given event, we obtain three scores quantifying the possibility that a source belongs to each class. Furthermore, using a hierarchical scheme, a refined prediction is obtained. We present this hierarchical scheme in Figure 3.
All GWSkyNet-Multi and GWSkyNet models, and scripts required to make predictions for a given event, are made publicly available.333https://github.com/GWML/GWSkyNet.
The outline of this paper is as follows. In Section 2, we describe the new data set used for training and testing our new classifier and describe GWSkyNet-Multi. In Section 3, we asses the performance of each individual model and the overarching hierarchical classifier. We further make predictions for sources from the LVC O3 observing run. Section 4 describes the performance and interpretability of our models. In Section 5 we summarize our findings.
2 Methods
We begin by describing the data used to train and test GWSkyNet-Multi. We then discuss the model’s architecture and the creation of the multi-class classifier.
2.1 Data Set
The noise events in the data set consist of 1267 glitches from the first two observing runs of Advanced LIGO and Virgo, identified in Cabero et al. (2020) using catalogs of noise transients (Cabero et al., 2019; Zevin et al., 2017) and GW candidates from the second Open Gravitational-wave Catalog (Nitz et al., 2019). To construct a sufficiently large and balanced data set, we use gravitational waveform models from the LALSuite package (LIGO Scientific Collaboration 2018) to simulate 1000 GW events for each astrophysical source type: BBH, BNS mergers, and NSBH mergers. The noise realization for the simulated events is achieved by injecting the GW waveforms into Gaussian noise coloured with publicly available power sprectral densities (PSDs) from O1, O2, and O3 (Abbott et al. 2021). BH masses are drawn from astrophysically-motivated mass distributions described in Abbott et al. (2021b). We choose the “power law + peak” mass model and its corresponding mass-ratio distribution, using the median posterior values for the parameters of the model. NS masses follow a uniform distribution in the range . Spins are restricted to be along the direction of orbital angular momentum, with spin magnitudes constrained to be for BH and for NS.
The full data set contains 4267 events. We use 81% of this set for training, 9% for validation, and 10% is reserved for the test set.
2.2 Developing a Multi-Class Classifier
In order to make a prediction from an event, GWSkyNet-Multi uses the following inputs derived from the OPA FITS file generated by BAYESTAR (Singer et al. 2016):
-
1.
A skymap image;
-
2.
Three volume-projected images;
-
3.
A list of detectors observing at the time of detection;
-
4.
Estimated mean and maximum distance to the source of the GW;
-
5.
Four normalization factors (one for the skymap image, and one for each of the three volume-projected images);
-
6.
The logarithm of the Bayes factors for the signal versus noise hypothesis (LogBSN) and the coherence versus incoherence hypothesis (LogBCI).
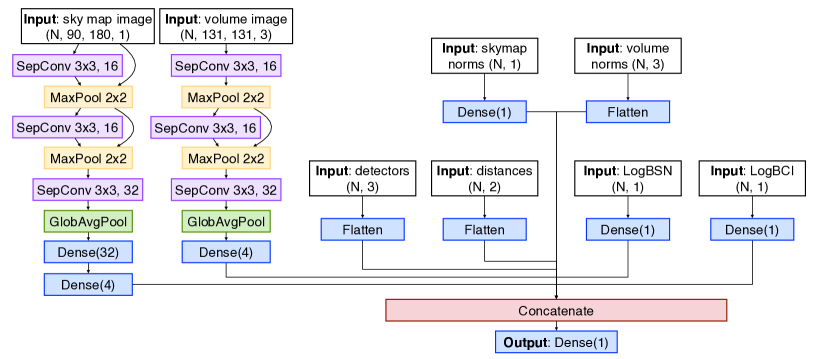
To generate a multi-class classifier, we use a sequence of three one-versus-all classifiers. All one-versus-all models have the same architecture, shown in Figure 2. Each model is used to classify an event as belonging to a given class versus all remaining classes, e.g., BBH-versus-all classifies events as either a BBH merger or anything which is not a BBH merger. We thus obtain three models: BBH-versus-all, NS-versus-all, and glitch-versus-all. We tune these models by varying the “learning rate”, a scalar used to vary the magnitude of the step size in a gradient descent algorithm, as well as the “batch size”, the number of examples used in each step during training. To find the hyperparameters leading to the best models for each class, we use Hparams444https://pypi.org/project/hparams/ to explore hyperparameter-space with learning rates ranging from to , and batch sizes ranging from 5 to 110. Once trained, all three models are applied to an event, and so we obtain a score quantifying the possibility that a candidate belongs to each class. Finally, to return a single prediction for our analysis, we use the hierarchical scheme shown in Figure 3.
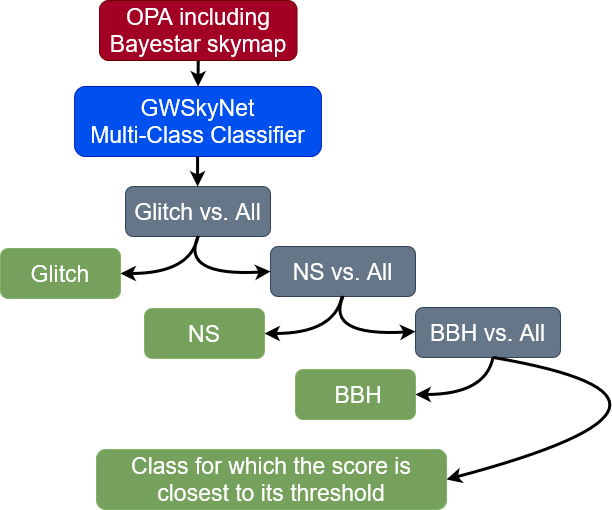
For a given input, if a one-versus-all classifier returns a score above the user-set prediction threshold, the candidate is classified as a member of that particular class. If the score is below the threshold, we proceed to the next classifier in the hierarchical scheme. If none of the scores are above the models’ thresholds, we classify the event based on which score was closest to its threshold.
We run models in order of best-performing to worst, based on both test set accuracies and scores:
| (1) |
| (2) |
where TP is the number of true positive predictions, TN is the number of true negatives, FP is the number of false positives, and FN is the number of false negatives. We primarily focus on the accuracy of each model, however we also restrict ourselves to using models with high F1 scores () as they predict a sufficient amount of TPs.
We employ a hierarchical scheme to ensure that the prediction of our best-performing one-versus-all model is given priority over the predictions of the less trustworthy models. As seen in the next section, our best-performing classifier is glitch-versus-all, followed by NS-versus-all, and finally BBH-versus-all. However, note that GWSkyNet-Multi provides the user with both the hierarchical prediction and the score for each individual classifier, to maximally inform EM follow-up.
3 Performance & Predictions
Next, we present the performance of each one-versus-all classifier, as well as the predictions of the multi-class classifier, for candidates in LIGO–Virgo’s O3 run.
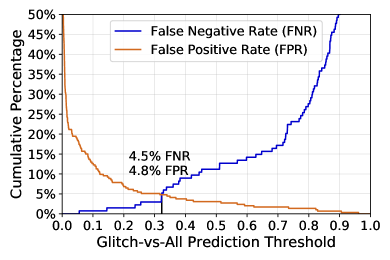
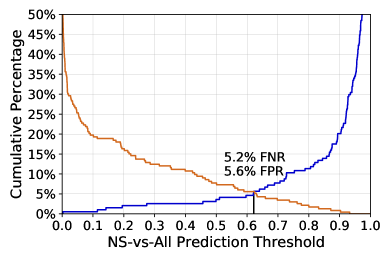
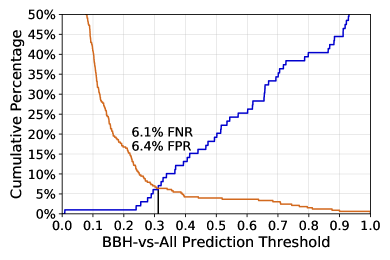
Figure 4 shows the FNR and FPR of the predictions on the test set made by each of the one-versus-all classifiers as a function of the threshold. We find that the best performance for each one-versus-all model occurs when the prediction threshold is set to the intersection between the false negative rate (FNR) and the false positive rate (FPR). However, the user may change this threshold in GWSkyNet-Multi to suit their preferences for the FPR and FNR of the classifiers. The accuracy and score for each one-versus-all classifier, applied to the 427 examples in the test set using the intersection threshold, are presented in Table 1.
| Classifier | Threshold | Accuracy | score |
|---|---|---|---|
| Glitch-versus-all | 32.3% | 95.1% | 0.96 |
| NS-versus-all | 62.2% | 94.4% | 0.95 |
| BBH-versus-all | 31.2% | 93.7% | 0.96 |
The glitch-versus-all, NS-versus-all, and BBH-versus-all classifiers achieve accuracies of 95.1%, 94.4%, and 93.7%, and scores of 0.96, 0.95, and 0.96, respectively. To calculate the accuracy for the overall multi-class classifier, the three one-versus-all models are run sequentially on the test set as described in Section 2.2. We obtain an overall test set accuracy of 93.4% with this hierarchical scheme. We also obtain multi-class predictions for O3a events with this hierarchical method. The hierarchical classifications and individual one-versus-all scores are reported in Table 2. Finally, although the refined classifications for O3b events have not yet been published, we present the predictions of GWSkyNet-Multi in Table 3.
| Candidate Name | GWTC-2 Label | GraceDB Label | GWSkyNet Binary | Glitch Score (%) | NS Score (%) | BBH Score (%) | Hierarchical Prediction |
|---|---|---|---|---|---|---|---|
| S190405ar | Glitch | RETRACTED | Glitch | 30.3 | 4.3 | 1.2 | Glitch* |
| S190408an | BBH | BBH | Real | 0.1 | 0.1 | 99.9 | BBH |
| S190412m | BBH | BBH | Real | 0.1 | 4.2 | 94.1 | BBH |
| S190421ar | BBH | BBH | Real | 23.8 | 0 | 100 | BBH |
| S190425z | BNS | BNS | Real | 89.5 | 99.9 | 0 | Glitch† |
| S190426c | NSBH | BNS | Real | 0.1 | 97.2 | 21.2 | NS |
| S190503bf | BBH | BBH | Real | 0.2 | 30.6 | 40.4 | BBH |
| S190510g | Glitch | Terrestrial | Glitch | 38.7 | 1 | 3.8 | Glitch |
| S190512at | BBH | BBH | Real | 0.1 | 0 | 99.7 | BBH |
| S190513bm | BBH | BBH | Real | 0.1 | 0 | 100 | BBH |
| S190517h | BBH | BBH | Real | 0.1 | 0 | 100 | BBH |
| S190518bb | Glitch | RETRACTED | Glitch | 99.9 | 96.8 | 4.2 | Glitch† |
| S190519bj | BBH | BBH | Real | 0.1 | 0 | 100 | BBH |
| S190521g | BBH | BBH | Real | 0.1 | 1.3 | 71.2 | BBH |
| S190521r | BBH | BBH | Real | 0.4 | 1.6 | 99.3 | BBH |
| S190524q | Glitch | RETRACTED | Glitch | 78.9 | 74.7 | 0.9 | Glitch† |
| S190602aq | BBH | BBH | Real | 0.1 | 6.4 | 91.9 | BBH |
| S190630ag | BBH | BBH | Real | 72.3 | 0 | 76.2 | Glitch† |
| S190701ah | BBH | BBH | Real | 0.1 | 0.2 | 97.7 | BBH |
| S190706ai | BBH | BBH | Real | 0.1 | 0 | 100 | BBH |
| S190707q | BBH | BBH | Real | 1 | 18.2 | 83.5 | BBH |
| S190718y | Glitch | Terrestrial | Glitch | 88.7 | 0.3 | 19.4 | Glitch |
| S190720a | BBH | BBH | Real | 3.2 | 3.3 | 96.7 | BBH |
| S190727h | BBH | BBH | Real | 0.2 | 0.1 | 98.4 | BBH |
| S190728q | BBH | BBH | Real | 0.1 | 15.6 | 90.8 | BBH |
| S190808ae | Glitch | RETRACTED | Glitch | 47.7 | 98.7 | 0.1 | Glitch |
| S190814bv | NSBH | NSBH | Real | 0.1 | 94.1 | 45.2 | NS† |
| S190816i | Glitch | RETRACTED | Real | 1.4 | 87 | 18.2 | NS |
| S190822c | Glitch | RETRACTED | Glitch | 60.8 | 100 | 9.2 | Glitch† |
| S190828j | BBH | BBH | Real | 0.1 | 0 | 100 | BBH |
| S190828l | BBH | BBH | Real | 0.1 | 0 | 99.9 | BBH |
| S190829u | Glitch | RETRACTED | Real | 70.6 | 63.4 | 0 | Glitch† |
| S190901ap | Glitch | BNS | Glitch | 76.6 | 90.1 | 0 | Glitch† |
| S190910d | Glitch | NSBH | Glitch | 45.6 | 0.5 | 0 | Glitch |
| S190910h | Glitch | BNS | Glitch | 99 | 0 | 0 | Glitch |
| S190915ak | BBH | BBH | Real | 0.1 | 0 | 99.9 | BBH |
| S190923y | Glitch | NSBH | Real | 16.9 | 63.6 | 3.9 | NS |
| S190924h | BBH | MassGap | Real | 0.1 | 30.9 | 58.6 | BBH |
| S190930s | BBH | MassGap | Real | 29.2 | 32.2 | 60.4 | BBH |
| S190930t | Glitch | NSBH | Glitch | 99.4 | 0 | 0 | Glitch |
Note. — GW190413, GW190413, GW190424, GW190514, GW190527, GW190620, GW190708, GW190719, GW190731, GW190803, GW190803, GW190909, GW190910, GW190929 were identified in the GWTC-2 catalog however, they did not produce OPAs at the time of detection and thus GWSkyNet does not make predictions on these events.
| Candidate Name | GraceDB Label | GWSkyNet Binary | Glitch Score (%) | NS Score (%) | BBH Score (%) | Hierarchical Prediction |
|---|---|---|---|---|---|---|
| S191105e | BBH | Glitch | 0.1 | 0 | 98.7 | BBH |
| S191109d | BBH | Real | 15.6 | 0 | 100 | BBH |
| S191110x | RETRACTED | Real | 90.2 | 86.6 | 17.9 | Glitch† |
| S191117j | RETRACTED | Real | 100 | 70.2 | 6.5 | Glitch† |
| S191120aj | RETRACTED | Glitch | 92.8 | 34 | 0.1 | Glitch |
| S191120at | RETRACTED | Real | 99.4 | 98.7 | 27 | Glitch† |
| S191124be | RETRACTED | Glitch | 95.1 | 91.2 | 5.6 | Glitch† |
| S191129u | BBH | Real | 0.8 | 0.5 | 77.1 | BBH |
| S191204r | BBH | Real | 0.1 | 3.1 | 84.1 | BBH |
| S191205ah | NSBH | Glitch | 50.4 | 97 | 0.1 | Glitch† |
| S191212q | RETRACTED | Real | 49.8 | 100 | 1.9 | Glitch† |
| S191213ai | RETRACTED | Glitch | 98.3 | 92.1 | 0 | Glitch† |
| S191213g | BNS | Real | 3 | 2.4 | 2.7 | BBH* |
| S191215w | BBH | Real | 0.1 | 0 | 100 | BBH |
| S191216ap | BBH | Real | 1.7 | 83.4 | 43.2 | NS† |
| S191220af | RETRACTED | Real | 5.6 | 99.8 | 4.7 | NS |
| S191222n | BBH | Real | 16.5 | 0 | 18.8 | BBH* |
| S191225aq | RETRACTED | Real | 0.2 | 98.5 | 8.7 | NS |
| S200105ae | Terrestrial | Real | 54.9 | 89.5 | 0 | Glitch† |
| S200106au | RETRACTED | Real | 0.7 | 84.8 | 9.9 | NS |
| S200106av | RETRACTED | Real | 32.7 | 58.9 | 2.6 | Glitch |
| S200108v | RETRACTED | Glitch | 98.4 | 25.7 | 10.1 | Glitch |
| S200112r | BBH | Real | 76.2 | 0 | 44.4 | Glitch† |
| S200115j | MassGap | Real | 0.2 | 27.5 | 27.8 | BBH* |
| S200116ah | RETRACTED | Real | 99 | 93.3 | 3.8 | Glitch† |
| S200128d | BBH | Real | 17.7 | 0 | 100 | BBH |
| S200129m | BBH | Real | 0.1 | 0.9 | 98.2 | BBH |
| S200208q | BBH | Real | 0.1 | 0 | 100 | BBH |
| S200213t | BNS | Glitch | 53 | 99.8 | 2.8 | Glitch† |
| S200219ac | BBH | Real | 0.1 | 0 | 99.9 | BBH |
| S200224ca | BBH | Real | 0 | 0 | 100 | BBH |
| S200225q | BBH | Real | 0.8 | 0 | 98.9 | BBH |
| S200302c | BBH | Glitch | 95.2 | 0 | 0.7 | Glitch |
| S200303ba | RETRACTED | Glitch | 63.4 | 0 | 85.1 | Glitch† |
| S200308e | RETRACTED | Real | 98.8 | 75.6 | 4.7 | Glitch† |
| S200311bg | BBH | Real | 0 | 1.7 | 95.8 | BBH |
| S200316bj | MassGap | Real | 0.2 | 0.3 | 99.3 | BBH |
Note. — S200105ae and S200115j were determined to be a real events in Abbott et al. (2021).
4 Discussion
To evaluate our model, we compare our O3 predictions with GWTC-2 (Abbott et al. 2021a), GraceDB, and GWSkyNet. We then characterize the interpretability of our model using Gradient-weighted Class Activation Mapping (Grad-CAM).
4.1 O3 Predictions Discussion
During the O3a observing run, 40 gravitational wave candidates were made available as OPAs containing BAYESTAR-generated skymaps. By comparing the hierarchical predictions with those of GWTC-2, we find that GWSkyNet-Multi correctly classifies 36 of the 40 events, including 6/7 of the retracted events. The four misclassified events are further discussed in the following subsections. Furthermore, in comparison to the GWSkyNet classifier, the new model shows more promising results on retracted events. When comparing the 8 retracted events for which GWSkyNet and GWSkyNet-Multi have contradicting predictions. GWSkyNet correctly classifies 1 as a glitch whereas GWSkyNet-Multi correctly classifies 7 as glitches. On non-retracted events, we achieve comparable accuracy to GWSkyNet and GraceDB which correctly predicted 30/33 and 28/33, respectively (GWSkyNet-Multi obtains 29/33).
4.1.1 S190425z
We misclassify S190425z (now GW190425) as a glitch, while the refined analysis presented in Abbott et al. (2020) determines that it was a binary neutron star merger. Although S190425z was a source of interest and many electromagnetic observers attempted to find a counterpart (Abbott et al. 2020), it was also one of the most poorly-localized events in O3. The 90% confidence region of this event was over 7000 as shown in Figure 1. Classification of this event will be challenging with any model. In such cases where localization is poor, it can be useful to examine the scores of each individual classifier rather than relying solely on the hierarchical classifier. In the case of S190425z, we see that the glitch-versus-all classifier assigns a score of 89.5% and the NS-versus-all classifier 99.9%. The misclassification is thus entirely due to the fact that the glitch-versus-all is placed before the NS-versus-all in the hierarchical scheme.
4.1.2 S190630ag
Similarly to the previous event, S190630ag is misclassified as a glitch, when the event was instead a BBH merger. However, our BBH-versus-all classifier has a score of 76.2%, which is above its threshold. The misclassification is thus again due to the hierarchical scheme, and shows why it is important to take all the one-versus-all scores into consideration.
4.1.3 S190816i
We misclassify S190816i as containing a NS, when it was instead a glitch. We note however that this source was initially classified as either a NSBH or Terrestrial on GraceDB with 83% and 17% probability, respectively, before being retracted. We further note the high false alarm rate (FAR) presented on GraceDB: 1 per 2.2067 years. The weak signal of this source, as evident in the FAR, is likely responsible for the initial misclassification on GraceDB and the misclassification by our models.
4.1.4 S190923y
As with S190816i, we misclassify S190923y as containing a NS, when it was instead a glitch. Similar to this previous source, this source was also initially classified as either a NSBH or Terrestrial on GraceDB with 68% and 32% probability, respectively. We further note the high false alarm rate (FAR) presented on GraceDB: 1.5094 per year.
4.2 Ambiguous Events
There are four O3 events whose scores are all below their respective classifier’s threshold, namely, S190405ar, S191213g, S191222n, S200115j. Of these events, the classifier score of S190405ar, S191222n, S200115j is highest in the correct class. We note that S200115j, which was labelled as MassGap by GraceDB, is classified with a near equal score by the NS-versus-all and BBH-versus-all classifiers. We further note that S191213g interestingly has low scores (less than 5%) in each of the three classes, which suggests that this candidate may be a unique source which was not well characterized by the training set.
In addition, there are 21 events in O3 where more than one prediction score is above the classifier’s threshold. For these events, including S190425z and S190630ag mentioned above in Sections 4.1.1 and 4.1.2, respectively, it is important to look at all the predictions scores in addition to the hierarchical prediction.
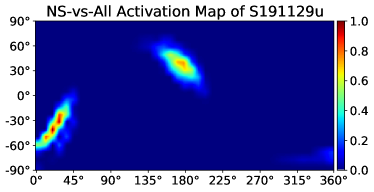
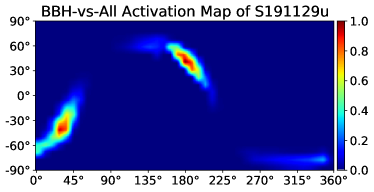
4.3 Interpretability
Intuitively, we expect that a given classifier would perform best when it focuses it’s attention on the high-probability regions of the skymap. We tested this intuition using Gradient-weighted Class Activation-Mapping (Grad-CAM)555https://github.com/ramprs/grad-cam/. Grad-CAM makes use of the fact that convolutional layers preserve spatial information to create an “activation map”. Each map is produced using gradients of the convolutional layers calculated with respect to the feature map activations. From the activation map, regions of a given skymap which receive the most attention in making a given classification are identified (Selvaraju et al. 2019). With Grad-CAM, we see that this intuition is generally correct. However, we caution that we observe a general trend in the glitch-versus-all classifier, where there is more attention on the low-probability regions than is present for the other classifiers (see Figure 5). Despite this fact, the glitch-versus-all classifier performs best of all the classifiers.
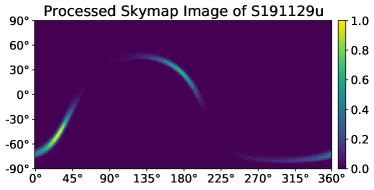
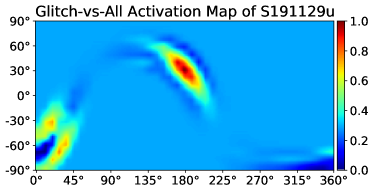
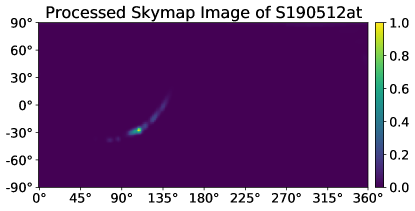
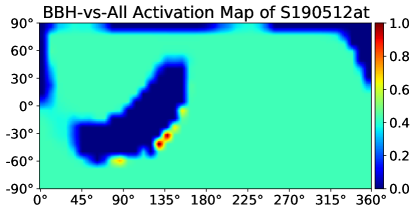
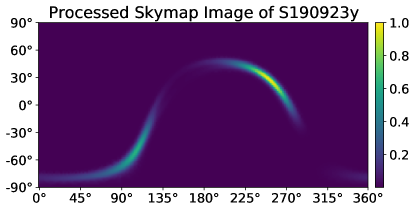
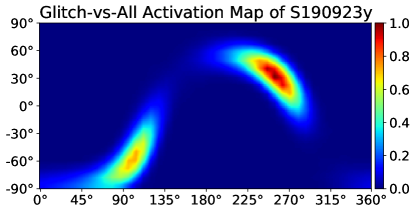
We also caution that there are notable exceptions to these expectations. For certain sources, the event is confidently and correctly classified, despite the model focusing on the exterior of the high-probability region. We show the example of S190512at in the top panels of Figure 6. In contrast, some sources are misclassified despite the relevant models placing all of their focus on the high-probability region of the given skymap. We show the example of S190923y in the bottom panels of Figure 6.
In sum, the activation map alone is not a good indication of the validity of a classification. We leave the exploration of other interpretability techniques for future work.
5 Conclusion
In this paper, we introduce GWSkyNet-Multi, a multi-class machine learning classifier that enhances the original GWSkyNet by further categorizing GW candidates as BBH mergers, mergers containing one or more NSs, or experimental glitches. GWSkyNet-Multi is created using three one-versus-all classifiers with high accuracy and scores. The glitch-versus-all, NS-versus-all, and BBH-versus-all classifiers have test set accuracies of 95.1%, 94.4%, and 93.7%, respectively, and all scores are above . The classifier also achieves comparable accuracies on the O3a events to GWSKyNet and higher accuracies than GraceDB. These results in addition to the high speed in which the classifiers predict are very encouraging towards the goal of increasing the success rate of EM follow-up of GW events, especially in the upcoming O4 observing run. Furthermore, with the addition of the Kamioka Gravitational Wave Detector (KAGRA), and other GW detectors, OPA skymaps will offer better localizations, which will also greatly increase the likelihood of successful EM follow-up.
Acknowledgements
The authors acknowledge funding from the New Frontiers in Research Fund Exploration program. N.V. and D.H. acknowledge funding from the Bob Wares Science Innovation Prospectors Fund. D.H. acknowledges support from the Canada Research Chairs (CRC) program and the NSERC Discovery Grant program. This research has made use of data, software and/or web tools obtained from the Gravitational Wave Open Science Center (https://www.gw-openscience.org/), a service of LIGO Laboratory, the LIGO Scientific Collaboration and the Virgo Collaboration. LIGO Laboratory and Advanced LIGO are funded by the United States National Science Foundation (NSF) as well as the Science and Technology Facilities Council (STFC) of the United Kingdom, the Max-Planck-Society (MPS), and the State of Niedersachsen/Germany for support of the construction of Advanced LIGO and construction and operation of the GEO600 detector. Additional support for Advanced LIGO was provided by the Australian Research Council. Virgo is funded, through the European Gravitational Observatory (EGO), by the French Centre National de Recherche Scientifique (CNRS), the Italian Istituto Nazionale di Fisica Nucleare (INFN) and the Dutch Nikhef, with contributions by institutions from Belgium, Germany, Greece, Hungary, Ireland, Japan, Monaco, Poland, Portugal, Spain.
Appendix A Confusion Matrices


References
- Abbott et al. (2017a) Abbott, et al. 2017a, Phys. Rev. Lett., 119, 161101, doi: 10.1103/PhysRevLett.119.161101
- Abbott et al. (2017b) —. 2017b, Nature, 551, 85–88, doi: 10.1038/nature24471
- Abbott et al. (2021) Abbott, Thomas D. Abbott, Sheelu Abraham, et al. 2021, SoftwareX, 13, 100658, doi: https://doi.org/10.1016/j.softx.2021.100658
- Abbott et al. (2020) Abbott, B. P., Abbott, R., Abbott, T. D., et al. 2020, ApJ, 892, L3, doi: 10.3847/2041-8213/ab75f5
- Abbott et al. (2021a) Abbott, R., Abbott, T. D., Abraham, S., et al. 2021a, Physical Review X, 11, 021053, doi: 10.1103/PhysRevX.11.021053
- Abbott et al. (2021b) —. 2021b, ApJ, 913, L7, doi: 10.3847/2041-8213/abe949
- Abbott et al. (2021) Abbott, R., et al. 2021, Astrophys. J. Lett., 915, L5, doi: 10.3847/2041-8213/ac082e
- Astropy Collaboration et al. (2018) Astropy Collaboration, Price-Whelan, A. M., Sipőcz, B. M., et al. 2018, AJ, 156, 123, doi: 10.3847/1538-3881/aabc4f
- Cabero et al. (2020) Cabero, M., Mahabal, A., & McIver, J. 2020, The Astrophysical Journal, 904, L9, doi: 10.3847/2041-8213/abc5b5
- Cabero et al. (2019) Cabero, M., Lundgren, A., Nitz, A. H., et al. 2019, Classical and Quantum Gravity, 36, 155010, doi: 10.1088/1361-6382/ab2e14
- Chatterjee et al. (2020) Chatterjee, D., Ghosh, S., Brady, P. R., et al. 2020, The Astrophysical Journal, 896, 54, doi: 10.3847/1538-4357/ab8dbe
- Essick (2017) Essick, R. C. 2017, PhD thesis, MIT
- LIGO Scientific Collaboration (2018) LIGO Scientific Collaboration. 2018, LIGO Algorithm Library - LALSuite, free software (GPL), doi: 10.7935/GT1W-FZ16
- Magee et al. (2015) Magee, R., et al. 2015, The Astrophysical Journal Letters, 910, 091021, doi: https://doi.org/10.3847/2041-8213/abed54
- Mészáros et al. (2019) Mészáros, P., Fox, D. B., Hanna, C., & Murase, K. 2019, Nature Reviews Physics, 1, 585–599, doi: 10.1038/s42254-019-0101-z
- Nitz et al. (2019) Nitz, A. H., et al. 2019, Astrophys. J., 891, 123, doi: 10.3847/1538-4357/ab733f
- Radice et al. (2018) Radice, D., Perego, A., Zappa, F., & Bernuzzi, S. 2018, The Astrophysical Journal, 852, L29, doi: 10.3847/2041-8213/aaa402
- Selvaraju et al. (2019) Selvaraju, R. R., Cogswell, M., Das, A., et al. 2019, International Journal of Computer Vision, 128, 336–359, doi: 10.1007/s11263-019-01228-7
- Singer & Price (2016) Singer, L. P., & Price, L. R. 2016, Phys. Rev. D, 93, 024013, doi: 10.1103/PhysRevD.93.024013
- Singer et al. (2016) Singer, L. P., Chen, H.-Y., Holz, D. E., et al. 2016, The Astrophysical Journal, 829, L15, doi: 10.3847/2041-8205/829/1/l15
- Stachie et al. (2021a) Stachie, C., Coughlin, M. W., Dietrich, T., et al. 2021a, Monthly Notices of the Royal Astronomical Society, 505, 4235–4248, doi: 10.1093/mnras/stab1492
- Stachie et al. (2021b) Stachie, C., et al. 2021b, Mon. Not. Roy. Astron. Soc., 505, 4235, doi: 10.1093/mnras/stab1492
- Zevin et al. (2017) Zevin, M., et al. 2017, Class. Quant. Grav., 34, 064003, doi: 10.1088/1361-6382/aa5cea