Complex magnetic phase diagram in noncentrosymmetric EuPtAs
Abstract
We report the observation of multiple magnetic transitions in single crystals of EuPtAs using magnetization, transport, and thermodynamic measurements. EuPtAs crystallizes in the noncentrosymmetric tetragonal LaPtSi-type structure (space group I41md) and undergoes a second-order antiferromagnetic transition at 14.8 K, which is followed by a first-order transition at about 7.5 K. Both transitions are suppressed by magnetic fields applied parallel and perpendicular to the c axis, and multiple field-induced transitions are observed for both field directions, leading to complex temperature-field diagrams with a dome-like magnetic phase for fields parallel to the c axis. Moreover, the dependence of the low temperature resistivity on the application of a training field, but the lack of remanent magnetization, suggests the presence of multiple antiferromagnetic domains in zero-field.
- PACS number(s)
I Introduction
Magnets with a noncentrosymmetric structure often exhibit complex magnetic structures due to the presence of Dzyaloshinskii-Moriya (DM) interaction [1, 2]. Unlike other exchange interactions which typically favor collinear spin structures, the DM interaction tends to orientate the spins perpendicular to each other. The competition between these competing tendencies can lead to noncollinear magnetic structures which could be topologically nontrivial in real space [3]. For example, a magnetic skyrmion phase with a topologically nontrivial spin texture has been experimentally discovered in MnSi, which has the chiral B20-type structure (space group P213) [4, 5, 6]. Subsequently, a series of additional compounds with the B20 structure have also been identified to host magnetic skyrmions, such as Fe1-xCoxSi [7, 8], FeGe [9, 10], and Cu2OSeO3 [11, 12]. Recently EuPtSi, which also crystallizes in a chiral cubic structure (LaIrSi-type, space group P213) [13], was shown to be an unusual example of an f-electron system hosting magnetic skyrmions [14, 15, 16], where the size of single skyrmion for [111] is only 18 , ten times smaller than those in MnSi [17]. In addition to these compounds with chiral structures, it was found that compounds with a noncentrosymmetric polar structure are also promising candidates for realizing skyrmions, such as GaV4S8 with a lacunar spinel structure [18], which hosts a Néel-type skyrmion phase. For CeAlGe with a polar tetragonal structure, evidence for a meron/antimeron phase has been reported, which has a double-k spin structure with a topological charge Q = 1/2 [19], in contrast to a skyrmion lattice which has a triple-k structure with Q = 1.
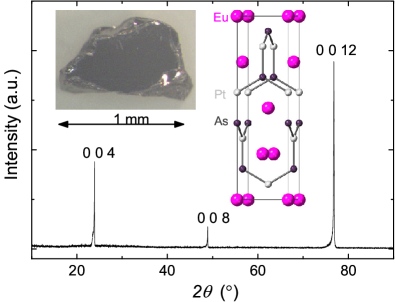
Although quite a few types of materials have been found to host skyrmion-like topological spin textures, such explorations in rare-earth compounds are still relatively limited after the report of EuPtSi, with the focus on some Gd-based centrosymmetric compounds where magnetic skyrmions with reduced size were commonly revealed in the absence of the DM interaction [20, 21, 22, 23]. Here we focus on the Eu-based compound EuPtAs. Unlike other reported members in the EuTX series [24], EuPtAs crystallizes in the polar tetragonal LaPtSi-type structure (space group I41md) [25] that is isostructural to CeAlGe. The crystal structure is displayed in the inset of Fig. II. For the Eu atoms, the nearest neighbor (NN) distance of 4.23 (in plane) is very close to the next nearest neighbor (NNN) distance 4.28 (out of plane), which are also comparable to the Ce-Ce distances in CeAlGe. However, in comparison to Ce3+ in CeAlGe, the Hund’s rule ground state of Eu2+ in EuPtAs has a total orbital angular momentum L = 0, which offers the opportunity to examine the magnetic properties in the same crystal structure but with greatly reduced magnetocrystalline anisotropy. On the other hand, the magnetic atoms in both compounds form nearly equilateral triangular sublattices where magnetic frustration is possible, which has been proposed to be another important mechanism for the realization of magnetic skyrmions, even in centrosymmetric compounds [20].
In this paper, we report magnetization, transport, thermodynamic measurements of EuPtAs single crystals grown by a Pb-flux method, revealing that EuPtAs undergoes two magnetic transitions in zero-field at 14.8 K and 7.5 K, which were both continuously suppressed in applied magnetic fields up to 9 T. We construct the magnetic field-temperature (H–T) phase diagrams for magnetic fields applied parallel and perpendicular to the easy c axis, featuring a number of field-induced magnetic phases.
II Experimental methods
Single crystals of EuPtAs were grown using a Pb-flux method. Eu pieces (99.9%), Pt powder (), and As grains () from Alfa Aesar were mixed in an off-stoichiometric ratio, and put into an alumina crucible together with excessive Pb ingots (). The crucible was sealed in an evacuated quartz ampule, which was slowly heated to 1100∘C and kept there for 2 days before being cooled at a rate of 3∘C/h to 750∘C, at which temperature the ampule was removed from the furnace and centrifuged. Shiny plate-like crystals with typical dimensions of were obtained. In order to remove the residual Pb flux, the crystals were etched in dilute hydrochloric acid and polished. A photograph of a piece of single crystal is shown in the inset of Fig. II. The crystal structure and orientation were characterized by x-ray diffraction (XRD) using a PANalytical X’Pert MRD diffractometer with Cu Kα1 radiation monochromated by graphite. The chemical composition was determined by energy-dispersive x-ray spectroscopy (EDS) using a Hitachi SU-8010 field emission scanning electron microscope. The electrical resistivity and heat capacity were measured using a Quantum Design Physical Property Measurement System (QD PPMS-9T) with a 3He insert. The magnetic susceptibility and magnetization were measured down to 2 K using a Quantum Design Magnetic Property Measurement System (QD MPMS-5T) and a vibrating sample magnetometer (VSM) on a Physical Property Measurement System (PPMS-14T).
III Results and discussions
III.1 Zero-field characterization
Figure II(a) shows the XRD pattern measured on a piece of plate-shaped single crystal, in which the diffraction peak positions match well with the expected (00)(=integer) peak positions for EuPtAs [25], indicating that the plate-like surface is oriented perpendicular to the c axis. The EDS measurements performed at multiple positions on the crystal show an average atomic ratio of 1 : 1.02 : 1.01 for Eu:Pt:As, which is very close to the stoichiometric EuPtAs composition.
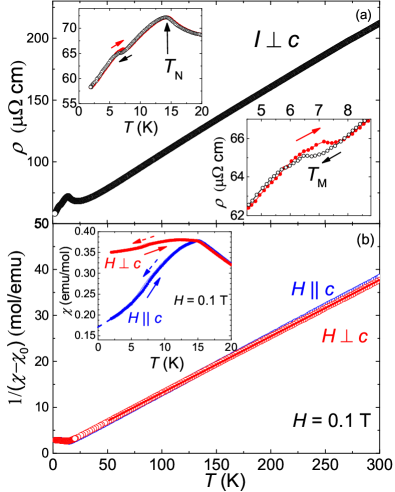
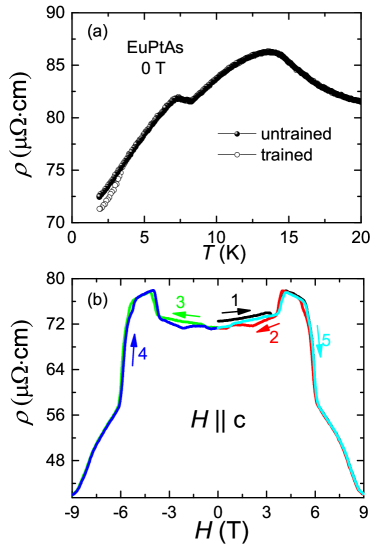
The temperature dependence of the electric resistivity , measured with a current , is shown in the main panel of Fig. II(a). The nearly linear behavior in is commonly observed for Eu2+-based intermetallics [26, 27], which is generally ascribed to arising from the electron-phonon scattering [27, 28]. At low temperature, shows a peak at the magnetic ordering temperature TN 14.8 K and a cusp at TM = 6.5 K upon cooling (7 K upon warming). While negligible differences are found at TN between the cooling and warming processes, hysteresis is observed at TM, as shown in the insets of Fig. II(a).
The temperature dependence of the magnetic susceptibility is displayed in Fig. II(b), where the high temperature behavior can be well described by the modified Curie-Weiss form with an effective magnetic moment of eff = 7.95B/Eu and a Weiss temperature = –4.7 K for , while for H , eff = 8.03/Eu and = –7.3 K. For both directions there is a temperature-independent susceptibility 0.004 emu/mol. The magnitude of eff is close to the expected value of 7.94 B for the well-localized Eu2+ electronic state with = 7/2. The inset of Fig. II(b) displays the low temperature for both and H c, where a cusp is clearly observed at , while a weak slope change with small thermal hysteresis occurs at . The anisotropic behavior in at indicates an antiferromagnetic (AFM) transition with the c-axis as the easy axis. In addition, extrapolation of the c axis susceptibility down to zero temperature gives a finite (0) of about 0.168 emu/mol, yielding the ratio (0)/(TN) = 0.44. This feature is inconsistent with a collinear AFM structure of the Eu spins along the c axis, for which (0) should be zero [29]. A possible explanation is that the Eu spins tilt away from the c axis, forming a noncollinear magnetic structure. Two consecutive magnetic transitions at low temperature are also observed in some other Eu-based intermetallics, for instance, EuPt2As2 [30] and EuPd2As2 [31]. While the spin structure change in EuPt2As2 is still not well-understood, the spins in EuPd2As2 are reported to be mainly orientated in the ab plane below , which cant towards the c axis upon crossing . Consequently, is flat between and and then decreases significantly below , while decreases continuously below with a smaller decreasing rate upon crossing [31]. However, both and for EuPtAs decrease monotonically below where displays a steeper drop. In addition, the rate at which both and decrease varies continuously with temperature, where there is an inflection point near . This is in contrast to that observed in EuPt2As2 [30] and EuPd2As2 [31], which might be due to a gradual spin canting with decreasing temperature.
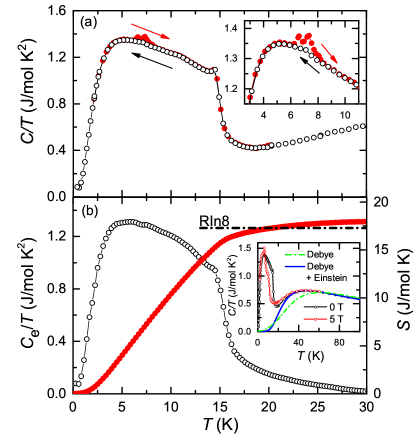
The temperature dependence of the specific heat as is shown in Fig. III.1(a). A jump at about 14.9 K and two small peaks centered at 7.3 K (upon warming) are observed. The former corresponds to the AFM transition at , while the later peaks arise due to the magnetic transition at , where the difference between warming and cooling processes is consistent with being a first-order transition. The magnetic entropy is shown in Fig. III.1 (b), which was calculated by integrating the electronic contribution C after subtracting the lattice contribution, where C was assumed to be linear to for 0.4 K. Note that due to the lack of a suitable nonmagnetic reference compound, the high temperature phonon contribution was fitted with various models. The results are shown in the inset of Fig. III.1(b), which indicates that a model combining both Debye and Einstein contributions [ [32]] can reasonably describe the experimental data at high temperatures, with fitted values of the Debye temperature D = 406 K, Einstein temperature = 111 K, and a weighting factor . The entropy released at TN is slightly less than R8, the full entropy expected for Eu2+ with an eight-fold degenerate ground state multiplet ( = 7/2). The integrated magnetic entropy reaches R8 at 20 K, and then saturates for 30 K. The additional entropy above 20K likely results from an incomplete subtraction of the phonon contribution [33]. A notable feature in C is a tail above . This could arise from magnetic fluctuations or short range magnetic correlations above , which seems to be further enhanced upon applying a magnetic field of 5 T in the present case, as shown in the inset of Fig. III.1(b).
III.2 In-field measurements
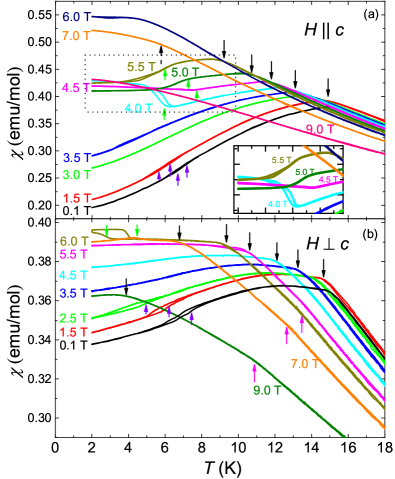
Figures III.1 (a) and (b) show for various magnetic fields applied along the axis and plane, respectively. With increasing field, TN is suppressed to lower temperatures with the corresponding peak becoming broader for both directions. TM is also continuously suppressed with fields, and is no longer observed down to 1.9 K for H 3 T. A field-induced transition [marked by the upward green arrows] is observed for H 3.5 T for . exhibits a rather linear behavior down to the lowest temperature after crossing this transition (see the inset), which displays a non-monotonic field-dependence, first shifting to higher temperatures, and then to lower temperatures with increasing field, before disappearing above 6 T. For , the field-induced transition appears for H 5.5 T, where there is an abrupt increase in below the transition, together with thermal hysteresis. In addition, anomalies are also resolved above for 3.5 T [upward magenta arrows] for , which become increasingly prominent at higher fields. These behaviors in (T) indicate multiple field induced phases in EuPtAs.
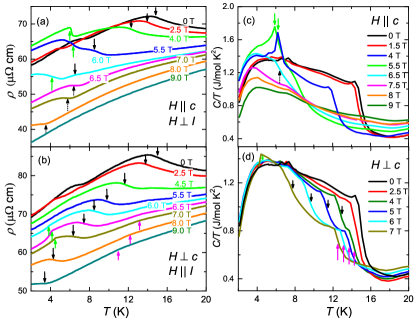
To further track the transitions in EuPtAs, and C(T) were measured in applied magnetic fields up to 9 T. Overall, the absolute value of is suppressed in applied fields, where anomalies at the various phase transitions are also detected. As shown in Fig. III.2(a), for the broad peak at and small cusp in at are both suppressed monotonically to lower temperatures, and the latter disappears at around 3 T. At higher fields an abrupt jump appears, and the field dependence of the anomaly is consistent with that found in for the same field direction. For 6 T, broad humps are observed in below 8 K, as shown by the dotted upward arrow. However, a lack of well-defined corresponding anomaly in and [dotted upward arrow in Fig. III.1(a) and Fig. III.2(c)] is observed, indicating that this may correspond to a crossover to the spin-polarized state. For 3 T along the axis, the small peaks in at disappear while another sharp peak is observed (vertical green arrows), which has an asymmetric shape with a tail on the low-temperature side. This is assigned to be a field-induced transition, which disappears in fields above 6 T, being consistent with and . As shown in Fig. III.2(c), all the data curves of display a broad hump at around 3 K. This feature is frequently observed in other Eu-based compounds with divalent Eu, and is generally ascribed to the Zeeman splitting of the = 7/2 mulitplet of the Eu2+ ions under internal and external magnetic fields [34, 36, 35].
For H c shown in Fig. III.2(b), in addition to the broad peak at and the small hump at (suppressed for 3 T), a weak but discernible slope change is observed at temperatures above in for 4 T, the position of which slowly shifts to lower temperature with increasing field. On the other hand, a clear sharp drop is observed at lower temperatures in the field range of 6.0–7.5 T [upward green arrows], which is assigned to be another field induced transition for H c. Note that all these transitions are also manifested in , as shown in Fig. III.2(d). shows an increase upon cooling prior to an abrupt jump at . This gradual increase is further enhanced under magnetic fields, which is likely due to short range correlations or fluctuations. The overall behavior for 3 T is similar to that for H c, however for 4 T, shows two steps upon cooling. From comparing the data of with and , it can be seen that the higher temperature step corresponds to a field induced transition above [magenta arrows], while the lower temperature step is the transition at , which becomes broader in higher fields. For = 6.0–7.5 T, an asymmetric peak is observed in [upward green arrow], which should correspond to the field induced transition below .
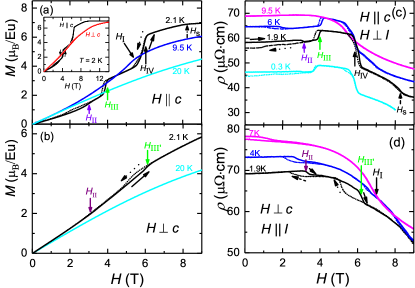
The isothermal magnetization M(H) and field dependence of the resistivity for and H c are displayed in Fig. III.2. Note that in all main panels, both the results for ramping up [0–9 T, solid lines] and ramping down processes [9–0 T, broken lines] are displayed, where the data at the lowest temperature were measured first after cooling from 300 K in zero-field, and the data at higher temperatures were subsequently measured. In , four anomalies can be resolved in the data measured upon ramping up the field at 2.1 K: a weak slope change with broad hysteresis at HII = 3.0 T, step-like increases at HIII = 3.9 T and HIV = 6.0 T, and a kink at HS = 8.2 T, above which is saturated at 7B/Eu, the saturated moment expected for fully polarized Eu2+ spins with J = 7/2. Near HIII, jumps by approximately 1B/Eu and then linearly increases with field. The extrapolation of this linear part to H = 0 yields a finite intercept. This is generally an indication of a spin-flip transition [37]. The same features occur at HIV, where the magnetization jump is about 2B/Eu. At temperatures above 7.5 K but below 15 K, only one transition can be found in M(H) which shows a relatively broad anomaly labelled HI in Fig. III.2(a). For 15 K, shows a sublinear field dependence with no detectable anomaly. All these transitions can also be observed in the isothermal data at the corresponding temperatures, as shown in Fig. III.2(c). For 7.5 K, the curves display a kink with a broad hysteresis loop in low fields, which then abruptly jumps (by about 4 -cm for 1.9 K) at HIII, flattens, and subsequently drops (by about 10 -cm for 1.9 K) at HIV. After that, the data decreases slowly with increasing field and bends at HS. At 7.5 K 15 K, exhibits a broad drop at fields corresponding to HI.
For H c, two transitions are observed in at 2 K: one at 3 T [labelled as ] showing a weak slope change, and another at 6.0 T [labelled as ] showing a sharp change of slope together with a hysteresis extending from 2.5 T to 6.1 T. Consistently, [Fig. III.2(d)] displays two step-like decreases at and with sizable hysteresis loops. With increasing temperature, () shifts to lower (higher) fields. Above 5 K, displays a single broad drop (labelled as ), at around 7 T for K. It can be seen below that the temperature dependence of and correspond to the field dependence of and , respectively. Magnetization measurements have been further performed up to 14 T at 2 K. As shown in the inset of Fig. III.2(a), the curves show no additional anomalies at higher fields for either field direction. Note that for fields applied parallel to the -axis, the magnetization saturates at HS with a moment of 7B/Eu, while perpendicular to the -axis there is no full saturation even up to 14 T.
Note that at 0.3 K and 1.9 K, the broad hysteresis loop in does not close when the field is reduced down to 0 T, while no zero-field hysteresis or remnant magnetization is observed in in Fig. III.2(a). We further found that the hysteresis near zero field is only observed in between the initial field scan after zero-field cooling, and the subsequent field-sweeps, as shown in Fig. III.2(b). On the other hand, the hysteresis at zero field also disappears if the sample is cooled in a field of 9 T and then measured upon ramping down to zero, and back up to 9 T. To further confirm the influence of cooling history on the zero-field resistivity, we also measured by adopting two different cooling processes: (1) the sample is cooled in zero field from 20 K to 1.9 K, and then the is measured upon warming; (2) the sample is cooled in an applied field of 9 T from 20 K to 1.9 K, and the field is then decreased to zero before measuring upon warming. Differences are expected for measured by different processes when there are multiple magnetic domains in the sample, which has been illustrated in a number of compounds, such as ferromagnetic domains in SrRuO3 [38] and MnP [39], all-in-all-out typed AFM domains in Nd2Ir2O7 [40], and competing domains in EuCuSb [42]. In these multi-domain cases, the above-mentioned process (1) was termed as measuring in the untrained state (multi-domain state), while process (2) was termed as measured in the trained state (domain-aligned state). Our data about EuPtAs is shown in Fig. III.2 (a), where a negative magnetoresistance is observed after the training processes, being consistent with that observed in shown in Fig. III.2 (b). This observation is similar to that in SrRuO3 and MnP with multiple ferromagnetic domains [38, 39], where the alignment of the magnetic domains along the field direction in the trained state leads to a reduction of the resistivity. This is in contrast to that reported for Nd2Ir2O7 and EuCuSb, which both show a positive magnetoresistance [42, 40], where it was proposed that Nd2Ir2O7 hosts metallic domain walls due to the non-trivial topology [40, 41], while in EuCuSb, the applied field may preferentially select for the domain with lower forming energy but higher resistance [42]. As such, the negative magnetoresistance upon applying a training field gives evidence for multiple magnetic domains. While the absence of remnant magnetization in zero-field suggests that these are antiferromagnetic domains, confirmation of their nature requires the microscopic characterization of the magnetic structure.
III.3 H–T phase diagrams
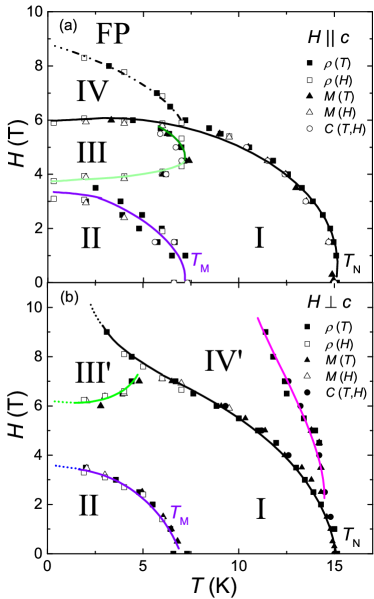
Based on all the data displayed above, we constructed the H–T phase diagrams for the two field directions. As shown in Fig. III.3, transition points from different measurements coincide well with each other. The phase diagrams for H c and H c show some similarities. For example, both TN and TM are monotonically suppressed to lower temperature, and a field-induced phase (phase III and phase III′) appears below . The suppression rates of and are comparable for 5 T, suggesting weak magnetocrystalline anisotropy. This is consistent with the small single-ion anisotropy expected for Eu2+, where the Hund’s rule ground state lacks an orbital moment ( = 0).
Differences between these two phase diagrams are also apparent. For H c, is abruptly suppressed at around 6 T, above which a phase IV appears at 6 T located between phase III and the field-polarized (FP) phase, where phase III has a dome shape below . While for , is suppressed considerably more slowly for 6 T, exhibiting a long tail stretching to higher fields. The field-induced transition (solid green line) appears to terminate upon intersecting (H) at around 5 K, which, together with (H), becomes the boundary of the field-induced phase III′. On the other hand, at higher fields there is evidence for a field-induced phase IV′ appearing above , and upon cooling for 7 T, there is a transition directly from this phase to phase III′. The rather complex phase diagrams could be a result of the presence of both Heisenberg-type magnetic exchange interactions and DM interaction, as have been observed in other noncentrosymmetric compounds [6, 14, 18].
There are some notable features of the field-induced phases III and phase III′. In the temperature dependent measurements, upon cooling through the transition into phase III: has a step-like increase under applied fields of 4–6 T, while displays a jump with thermal hysteresis in fields of 4–4.6 T, but a drop with thermal hysteresis in field range of 4.6–6 T, both exhibiting a rather linear behavior after cooling across the transition; shows a sharp asymmetric peak without hysteresis, and exhibits a tail on the lower temperature side. In the field dependent measurements, shows an abrupt increase at the lower field phase boundary while display a larger drop at the higher field phase boundary with sizable hysteresis at both phase boundaries. at 2.1 K jumps by approximately 1 /Eu at the lower boundary, and approximately 2 /Eu at the higher field boundary, but increases linearly in between. On the other hand, upon cooling into phase III′, exhibits a small but sharp drop, while a sharp increase is observed in followed by a flat plateau at 6 T. In , there is an asymmetric peak upon entering phase III′. undergoes a smaller drop upon crossing the lower boundary of phase III′, while shows a sharp change of slope (together with hysteresis) and increases sublinearly inside phase III′.
We are not able to determine the magnetic structures of these different phases solely from our present measurements of bulk properties. However, it is of particular interest to compare the phase diagrams of EuPtAs with those of EuPtSi and CeAlGe, both of which crystallize in noncentrosymmetric structures with the latter being isostructural to EuPtAs. EuPtSi shows a phase diagram that is typical for chiral B20 compounds when the field is applied along crystalline [111] direction, where the skyrmion-hosting A-phase arises out of the low field single-k helimagnetic phase [14, 15, 43]. Notably the A-phase in EuPtSi has a fully closed phase boundary, existing only in limited temperature- and field- ranges in the equilibrium conditions, although a metastable A-phase can extend down to 60 mK under field-cooling [44]. While for CeAlGe, the of 4.4 K is continuously suppressed to lower temperature, and two field-induced transitions below are observed, which descend nearly parallel to each other to lower temperature with increasing field, meaning that the boundary of the non-trivial merons/antimeron phase is open on the low temperature side, likely extending to zero temperature [19]. This is similar to the case for centrosymmetic Gd2PdSi3, where the skyrmion phase also lacks a boundary on the low temperature side [20], here shows abrupt increases and decreases on either side of the skyrmion phase boundary [45], which are similar to those observed for phase III in fig. III.2(c).
In order to microscopically characterize the magnetic structure of the different phases and to look for evidence of topologically nontrivial spin textures (especially , in phase III), it is both necessary to look for the presence of a topological Hall effect, and to perform neutron diffraction or magnetic x-ray scattering studies, which are currently underway.
IV Summary
In summary, we have synthesized single crystals of the noncentrosymmetric Eu-based compound EuPtAs and studied the physical properties by measuring the resistivity, heat capacity, and magnetic susceptibility. In zero-field, two transitions are found with a second-order AFM transition at TN = 14.8 K and a first-order transition at TM = 7.5 K, which were evidenced to be arising from well-localized 4f electronic states of Eu2+.
Measurements were performed in applied magnetic fields up to 9 T parallel and perpendicular to the c-axis, which allow us to construct the phase diagrams for both field directions. Our data show that both TN and TM are continuously suppressed by fields for both and , and there are multiple field-induced transitions for both directions, either above or below , including a dome-shaped phase III for . Furthermore, the resistivity measurements under different cooling processes show clear evidences for multiple magnetic domains in the zero-field phase. Our study shows the presence of complex temperature–field phase diagrams for EuPtAs, with two zero-field transitions and multiple field-induced phases. In order to characterize the spin-structure and microscopic nature of the magnetism in EuPtAs, it is of particular interest to determine the magnetic structures using neutron or x-ray scattering.
Acknowledgements.
We thank T. Shang for fruitful discussions, who acknowledges support from the Natural Science Foundation of Shanghai (Grant Nos. 21ZR1420500 and 21JC1402300). This work was supported by the National Key RD Program of China (No. 2017YFA0303100, No. 2016YFA0300202), the National Natural Science Foundation of China (No. 12034017 and No. 11974306), the Key RD Program of Zhejiang Province, China (2021C01002), and the Fundamental Research Funds for the Central Universities. W. Xie thanks support from the committee of SCES2019 (Okayama, Japan).References
- [1] I. Dzyaloshinsky, J. Phys. Chem. Solids. 4, 241 (1958).
- [2] T. Moriya, Phys. Rev. 120, 91 (1960).
- [3] N. Nagaosa and Y. Tokura, Nat. Nanotechnol. 8, 899 (2013).
- [4] E. Y. Ishikawa, K. Tajima , D. Bloch, M. Roth, Solid State Commun. 19, 525 (1976).
- [5] C. Pappas, E. Lelievre-Berna, P. Falus, P. M. Bentley, E. Moskvin, S. Grigoriev, P. Fouquet, and B. Farago, Phys. Rev. Lett. 102, 197202 (2009).
- [6] S. Muhlbauer, B. Binz, F. Jonietz, C. Pfleiderer, A. Rosch, A. Neubauer, R. Gergii, P. Böni, Science 323, 915 (2009).
- [7] X. Z. Yu, Y. Onose, N. Kanazawa, J. H. Park, J. H. Han, Y. Matsui, N. Nagaosa, Y. Tokura, Nature 465, 901 (2010).
- [8] W. Munzer, A. Neubauer, T. Adams, S. Muhlbauer, C. Franz, F. Jonietz, R. Georgii, P. Boni, B. Pedersen, M. Schmidt, A. Rosch, and C. Pfleiderer, Phy. Rev. B 81, 041203(R) (2010).
- [9] M. Uchida, N. Nagaosa, J. P. He, Y. Kaneko, S. Iguchi, Y. Matsui, and Y. Tokura, Phys. Rev. B 77, 184402 (2008).
- [10] H. Wilhelm, M. Baenitz, M. Schmidt, U. K. Rossler, A. A. Leonov, and A. N. Bogdanov, Phys. Rev. Lett. 107, 127203 (2011).
- [11] S. Seki, X. Z. Yu, S. Ishiwata, Science 336, 198 (2012).
- [12] T. Adams, A. Chacon, M. Wagner, A. Bauer, G. Brandl, B. Pedersen, H. Berger, P. Lemmens, and C. Pfleiderer, Phys. Rev. Lett. 108, 237204 (2012).
- [13] J. Evers, G. Oehlinger, J. Phys. Chem. Solids 62, 133 (1986).
- [14] M. Kakihana, D. Aoki, A. Nakamura, F. Honda, M. Nakashima, Y. Amako, S. Nakamura, T. Sakakibara, M. Hedo, T. Nakama, and Y. Ōnuki, J. Phys. Soc. Jpn. 87, 023701 (2018).
- [15] K. Kaneko, M. D. Frontzek, M. Matsuda, A. Nakao, K. Munakata, T. Ohhara, M. Kakihana, Y. Haga, M. Hedo, T. Nakama, and Y. Ōnuki, J. Phys. Soc. Jpn. 88, 013702 (2018).
- [16] S. Hayami and R. Yambe, J. Phys. Soc. Jpn. 90, 073705 (2021).
- [17] M. Kakihana, D. Aoki, A. Nakamura, F. Honda, M. Nakashima, Y. Amako, T. Takeuchi, H. Harima, M. Hedo, T. Nakama, and Y. Ōnuki, J. Phys. Soc. Jpn. 88, 094705 (2019).
- [18] I. Kezsmarki, S. Bordacs, P. Milde, E. Neuber, L. M. Eng, J. S. White, H. M. Ronnow, C. D. Dewhurst, M. Mochizuki, K. Yanai, H. Nakamura, D. Ehlers, V. Tsurkan and A. Loidl, Nat. Mater. 14, 1116 (2015).
- [19] P. Puphal, V. Pomjakushin, N. Kanazawa, V. Ukleev, D. J. Gawryluk, J. Ma, M. Naamneh, N. C. Plumb, L. Keller, R. Cubitt, E. Pomjakushina, and J. S. White, Phys. Rev. Lett. 124, 017202 (2020).
- [20] T. Kurumaji, T. Nakajima, M. Hirschberger, A. Kikkawa, Y. Yamasaki, H. Sagayama, H. Nakao, Y. Taguchi, T. Arima and Y. Tokura, Science 365, 914 (2019).
- [21] N. D. Khanh, T. Nakajima, X. Yu, S. Gao, K. Shibata, M. Hirschberger, Y. Yamasaki, H. Sagayama, H. Nakao, L. Peng, K. Nakajima, R. Takagi, T. Arima, Y. Tokura, and S. Seki, Nat. Nanotechnol. 15, 444 (2020).
- [22] M. Hirschberger, T. Nakajima, S. Gao, L. Peng, A. Kikkawa, T. Kurumaji, M. Kriener, Y. Yamasaki, H. Sagayama, H. Nakao, K. Ohishi, K. Kakurai, Y. Taguchi, X. Yu, T. Arima, and Y. Tokura, Nat. Commun. 10, 5831 (2019).
- [23] T. Nomoto, T. Koretsune, and R. Arita, Phys. Rev. Lett. 125, 117204 (2020).
- [24] S. Gupta, K. G. Suresh, J. Alloys Compd. 618, 562 (2015).
- [25] G. Wenski, A. Mewis, Z. Anorg. Alleg. Chem. 543, 49 (1986).
- [26] R. Mullmann, U. Ernet, B. D. Mosel, H. Eckert, R. K. Kremer, R.-D. Hoffmann and R. Pottgen, J. Mater. Chem. 11, 1133 (2001).
- [27] O. Bednarchuk, A. Ga̧gor and D. Kaczorowski, J. Alloys Compd. 622, 432 (2015).
- [28] N.F. Mott and H. Jones, The Theory of the Properties of Metals and Alloys, (Oxford University Press, Oxford, UK 1958).
- [29] V. K. Anand, and D. C. Johnston, Phy. Rev. B 94, 014431 (2016).
- [30] P. Zhang, H. F. Zhai, Y. P. Li, Z. Wang, J. Chen, S. Y. Zheng, Q. Tao, J. H. Dai, G. H. Cao, Z. A. Xu, J. Alloys Compd. 728, 959 (2017).
- [31] V. K. Anand, and D. C. Johnston, J. Phys.: Condens. Matter 26, 286002 (2014).
- [32] O. Bednarchuk, A. Ga̧gor, and D. Kaczorowski, J. Alloys Compd. 622, 432 (2015).
- [33] A. Maurya, P. Bonville, R. Kulkarni, A. Thamizhavel, S. K. Dhar, J. Magn. Magn. Mater. 401, 823 (2016).
- [34] W. B. Jiang, M. Smidman, W. Xie, J. Y. Liu, J. M. Lee, J. M. Chen, S. C. Ho, H. Ishii, K. D. Tsuei, C. Y. Guo, Y. J. Zhang, Hanoh Lee, and H. Q. Yuan, Phys. Rev. B 95, 024416 (2017).
- [35] S. Sullow, I. Prasad, M. C. Aronson, J. L. Sarrao, Z. Fisk, D. Hristova, A. H. Lacerda, and M. F. Hundley, A. Vigliante, and D. Gibbs, Phys. Rev. B 57, 5860 (1998).
- [36] V. K. Anand and D. C. Johnston, Phys. Rev. B 91, 184403 (2015).
- [37] S. Blundell, Magnetism in Condensed Matter, Oxford Press, New York (2001).
- [38] L. Klein, Y. Kats, A. F. Marshall, J. W. Reiner, T. H. Geballe, M. R. Beasley, and A. Kapitulnik, Phys. Rev. Lett. 84, 6090 (2000).
- [39] N. Jiang, Y. Nii, H. Arisawa, E. Saitoh, J. Ohe, and Y. Onose, Phys. Rev. Lett. 126, 177205 (2021).
- [40] K. Ueda, J. Fujioka, B.-J. Yang, J. Shiogai, A. Tsukazaki, S. Nakamura, S. Awaji, N. Nagaosa, and Y. Tokura, Phys. Rev. Lett. 115, 056402 (2015).
- [41] K. Ueda, J. Fujioka, Y. Takahashi, T. Suzuki, S. Ishiwata, Y. Taguchi, M. Kawasaki, and Y. Tokura, Phys. Rev. B 89, 075127 (2014).
- [42] H. Takahashi, K. Aono, Y. Nambu, R. Kiyanagi, T. Nomoto, M. Sakano, K. Ishizaka, R. Arita and S. Ishiwata, Phys. Rev. B 102, 174425 (2020).
- [43] C. Tabata, T. Matsumura, H. Nakao, S. Michimura, M. Kakihana, T. Inami, K. Kaneko, M. Hedo, T. Nakama, and Y. Ōnuki, J. Phys. Soc. Jpn. 88, 093704 (2019).
- [44] T. Sakakibara, S. Nakamura, S. Kittaka, M. Kakihana, M. Hedo, T. Nakama, and Y. Ōnuki, J. Phys. Soc. Jpn. 90, 064701 (2021).
- [45] H. Zhang, Q. Huang, L. Hao, J. Yang, K. Noordhoek, S. Pandey, H. Zhou, J. Liu, New J. Phys. 22, 083056 (2020).