A search for Planet 9 in the IRAS data
Abstract
I have carried out a search for Planet 9 in the IRAS data. At the distance range proposed for Planet 9, the signature would be a 60 m unidentified IRAS point source with an associated nearby source from the IRAS Reject File of sources which received only a single hours-confirmed (HCON) detection. The confirmed source should be detected on the first two HCON passes, but not on the third, while the single HCON should be detected only on the third HCON. I have examined the unidentified sources in three IRAS 60m catalogues: some can be identified with 2MASS galaxies, Galactic sources or as cirrus. The remaining unidentified sources have been examined with the IRSA Scanpi tool to check for the signature missing HCONs, and for association with IRAS Reject File single HCONs. No matches of interest survive. For a lower mass planet () in the distance range 200-400 AU, we expect a pair or triplet of single HCONs with separations 2-35 arcmin. Several hundred candidate associations are found and have been examined with Scanpi. A single candidate for Planet 9 survives which satisfies the requirements for detected and non-detected HCON passes. A fitted orbit suggest a distance of 22515 AU and a mass of 3-5 . Dynamical simulations are needed to explore whether the candidate is consistent with existing planet ephemerides. If so, a search in an annulus of radius centred on the 1983 position at visible and near infrared wavelengths would be worthwhile.
keywords:
Planets and satellites: terrestrial planets; minor planets, asteroids, general; infrared: general.1 Introduction
In the 1980s there had been a long history of interest in what would at that time have been a tenth planet, Planet X. There appeared to be unexplained residuals in the orbit of Neptune. Though these were much smaller than the Uranus residuals by which Le Verrier and Adams discovered Neptune, they had motivated Tombaugh‘s search for a new planet, which resulted in the discovery in 1930 of what we now know as the dwarf planet Pluto. It quickly became clear that Pluto was too small to explain the Neptune residuals and so the possibility of a tenth planet remained (see Batygin et al (2019) for a full historical account and references).
In 1983, while working on the preparation of the IRAS Point Source Catalog, I undertook a systematic search for Planet X in the IRAS data. The search was unsuccessful though it did yield a detection of Comet Bowell (Walker and Rowan-Robinson 1984). Amusingly a misunderstanding of an earlier IRAS science team briefing by senior NASA personnel resulted in a press story in 1983 that IRAS had discovered Planet X (see Rowan-Robinson 2013 for full details of how this misunderstanding arose).
Interest in Planet X flared up again in the late 1980s (Harrington 1988, Seidelmann and Harrington 1988, Jackson and Killen 1988, Neuhauser and Feitzinger 1991) and the Royal Astronomical Society staged a discussion meeting in 1991 on ‘Solar System Dynamics and Planet X‘. I gave a report on my IRAS searches and concluded that I was 70 certain that Planet X did not exist. The figure of 70 referred to the area of sky in which I was able to carry out my IRAS search. Reports of the meeting were given by Morrison (1992) and Crosswell (1991).
Subsequently a remeasurement of the mass of Neptune eliminated the Neptune residuals (Standish 1992). The absence of deviations from the orbits of the Pioneer and Voyager spacecraft shows that no unknown massive solar system planet resides in the plane of the ecliptic. Luhman (2014) has used WISE data to set severe limits on Saturn or Jupiter mass objects in the solar system out to 28,000 and 82,000 AU, respectively.
The discovery of dozens of new dwarf planets during the past twenty years has resulted both in the redefinition of Pluto as a dwarf planet and in their potentiality as probes of possible distant massive planets in highly inclined orbits. Batygin and Brown (2016) and Brown and Batyin (2016), developing an idea of Trujillo and Sheppard (2014), proposed that a planet of a few tens of earth-masses in an inclined and eccentric orbit at 280-1000 AU could explain alignments in the orbits of the Kuiper belt dwarf planets. As this was significantly more distant than the Planet X I was looking for in 1983, I thought it worthwhile to redo my IRAS search and set out quantitatively what are the constraints on such an object. Fienga et al (2016), Holman and Payne (2016), Iorio (2017), Millholland and Laughton (2017), Medvedev et al (2017), Caceres and Gomes (2018), Brown and Batygin (2019), Batygin et al (2019) and Fienga et al (2020), have given additional dynamical constraints on Planet 9‘s orbit. Specifically Fienga et al (2016) argue against d 370AU for a 10 planet, using Cassini radio ranging data, which they revise to d 650AU in Fienga et al (2020).
Sections 2 discusses the IRAS capability to detect moving objects, section 3 focuses on different categories of cool (1000 K) movers, sections 4 reviews unidentified sources in the IRAS PSCz and RIIFSCz surveys, section 5 discusses the IRAS 60 m single HCON database. Section 6 discusses a new search for warm, slow movers, relevant to the search for Planet 9. Section 7 discusses how a Planet 9 candidate might be recovered and section 8 gives my discussion and conclusions.
2 IRAS capability to detect movers
IRAS surveyed 98 of the sky at 12, 25, 60 and 100 m. The focal plane array consisted of two strips of detectors for each of the four bands. The resolution of IRAS at 60 m was 1 arcmin.
The confirmation strategy for the IRAS Point Source Catalog (PSC: IRAS Explanatory Supplement, 1984) was at four levels: (i) seconds confirmation, as sources crossed the two array strips for each waveband, (ii) hours confirmation (HCON) as the same area was observed on two or sometimes three successive orbits (iii) weeks confirmation, as the same process was repeated roughly one to two weeks later (1 of the sky received only a single HCON coverage) (iv) months confirmation, when the process was repeated six months later. At the termination of the mission 75 of the sky had achieved a third HCON coverage. 2 of the sky had no coverage at all. The IRAS coverage gaps, two ribbons of sky centred at ecliptic longitudes 160o and 240o, are edged by narrow strips in which only a single HCON was achieved.
This confirmation strategy allowed the identification of different categories of moving object:
(a) fast movers: Sources which passed seconds-confirmation but failed hours-confirmation were examined in real time at the IRAS ground station at Rutherford Appleton Laboratory. Several comets and Apollo asteroids were found and published (Davies et al 1984).
(b) medium movers: sources which passed hours-confirmation, and so were recorded as HCONs, but failed weeks-confirmation were retained in a ‘PSC Reject File’. These would include main-belt asteroids, which were published as the IRAS Asteroid and Comet Catalog (1986).
For areas covered by 3 hours-confirming coverages we would expect to see 3 separate HCONs.
(c) slow movers: sources which passed weeks confirmation but failed months confirmation would be present in the PSC but could have a separate single-HCON companion from the third coverage. These are the main cases of interest for a Planet 9 candidate.
(d) very slow movers: sources which pass months confirmation will be present in the PSC. Separate analysis of time-line data would be needed to reconstruct motions of moving sources which moved less than 1 arcmin in 6 months. However such objects would have to be at distances 7000 AU and so are not of interest as Planet 9 candidates.
What positional disagreement results in non-confirmation of HCONs ? This varies with direction on the sky but the 60 m (2-) error ellipses for confirmed sources have semi-axes typically 30 arcsec (cross-scan) by 10 arcsec (in-scan). I adopt 1 arcmin as the characteristic motion which could cause confirmation failure at 60 m.
3 IRAS sensitivity to cool movers
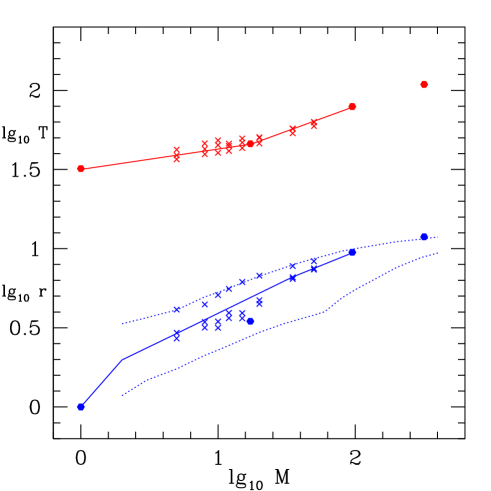
The capability of IRAS to detect cool ( 1000 K) nearby objects was discussed by Reynolds, Tarter and Walker (1980), who compared the expected sensitivity of IRAS to existing (partial) ground-based surveys. They gave the expected surface temperature of the known planets (and hypothetical objects of mass greater than Jupiter) if they were located at great distances from the Sun, and therefore radiating internal heat only. Figure 1 (upper part) shows their estimates of surface temperature for different masses and also the temperatures calculated by Fortney et al (2016) in their recent detailed study of possible Planet 9 models. My adopted mean relation is shown as a solid line. The lower part of Fig 1 shows the radii of the solar system planets, the model estimates of Fortney et al (2016), and also the range of model radii considered by Mordasini et al (2012) in their discussion of possible exoplanet models, again with my adopted mean line. We can then construct a mass-distance sensitivity diagram (Fig 2) which shows the distance to which different mass planets would be detectable in the four IRAS bands. The prime search-area for a Batygin and Brown object would be 5-20 , with the distance range being 280-1100 AU. At 60m IRAS would in principle have been able to detect a 5 planet to 220 AU, a 10 planet to 380 AU, and a 20 planet to 690 AU. But if we allow for the maximum radii considered by Mordasini et al (2012), a 5 planet could be detected to 350 AU, a 10 planet to 600 AU, and a 20 planet to 1000 AU. These are worthwhile limits.
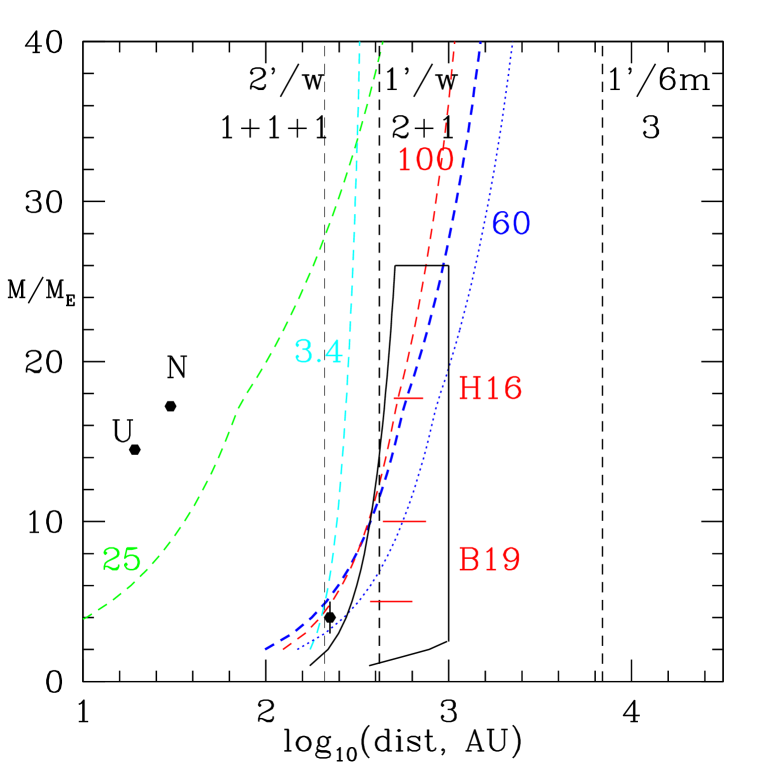
The main motion of distant solar system movers is an ellipse due to parallax, with major diameter 2, where . I have shown a vertical dashed line in Fig 2 corresponding to , essentially the most distant solar object for which IRAS could detect motion (1arcmin in 6 months). Two weeks-confirming HCONs would have a separation of 1 arcmin when , or d 415AU and this is also shown (thicker dashed line). For the proposed Planet 9 at 280-1100 AU, the expected parallactic motion in 6 months would be 6-24 arcmin, easily detectable by IRAS. Superposed on the elliptical motion on the sky due to parallax there would be a drift along a great circle due to the orbital motion, typically 0.3-1.3 arcmin in 6 months for d=1100-400AU.
Fienga et al (2016) have set a dynamic constraint of d370 AU for a 10 planet on a particular hypothetical Planet 9 orbit, based on the ephemeris of Saturn as observed by Cassini. Batygin et al (2019) have scaled this as to give the left-hand edge of the permitted region in Fig 2.
Fortney et al (2016) and Meisner et al (2018) have discussed the detectability of Planet 9 in the WISE W1 (3.4m) channel. We have shown the corresponding locus for an assumed WISE 3.4m sensitivity of 16.7 m(Vega), which Meisner et al (2018) have achieved for 70 of the sky. At 3.4m the emission from Planet 9 will be through a combination of reflected light from the Sun, which depends on the albedo at 3.4m, and emission. The net flux is highly dependent on assumptions about the Planet 9 atmosphere and abundances, especially of methane (Fortney et al 2016). We have adopted the Rayleigh scattering limit albedo of 0.75, though for most Planet 9 models, and for Neptune, the albedo would be orders of magnitude smaller than this. Even with this optimistic assumption and the adopted mean radius-mass line of Fig 1, the predicted 3.4 m flux from reflected light for Planet 9 in the expected mass-distance range is not really detectable by WISE. However the most extreme model of Fortney et al (2016) does give such strong molecular emission that the effective albedo becomes 1 and such model planets would be detectable by WISE at 3.4m. The range of radius predictions at a given planet mass makes the limiting distance estimates uncertain by .
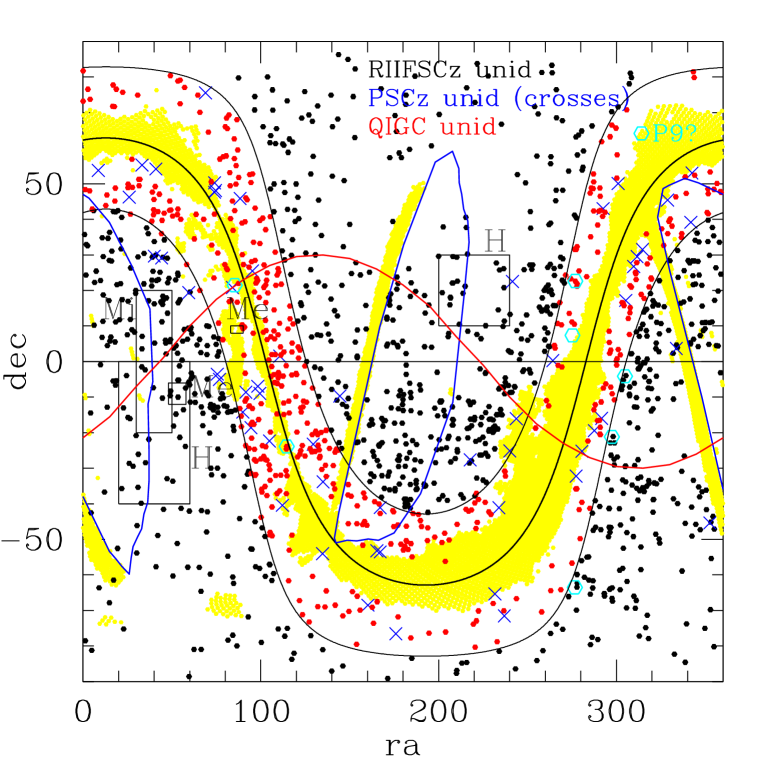
Unfortunately there are a number of alibis for Planet 9: (i) IRAS has no coverage at all in about 2 of the sky and only a single coverage in a further 1, (ii) some IRAS galaxy catalogues (e.g. PSCz, QIGC) impose additional constraints, excluding regions of the sky with high source-density flag at 12, 25, or 60 m (PSCz, QIGC), with high-source-density flag at 100 m (QIGC), or with high extinction (PSCz).These constraints, which have a similar effect, exclude a further of the sky. (iii) a quarter of the sky received only 2 hours-confirmed coverages, which makes detection of slow movers difficult, unless they are detected in 3 bands so that colour information can be used.
4 Unidentified sources in the IRAS surveys
Our starting point in any search for Planet 9 in the IRAS data is the unidentified sources in the IRAS Point source Catalog (PSC) and Faint Source Catalog (FSC) surveys. In this section I discuss the unidentified sources in the PSCz catalogue (Saunders et al 2000), as the most complete and well-studied compilation from the IRAS PSC survey, and in the RIIFSCz galaxy catalogue (Wang et al 2014), as the best studied compilation from the IRAS FSC survey.
4.1 Unidentified sources in PSCz
For slow movers we are interested in PSCz sources which are not identified with galaxies or Galactic objects. The IRAS PSCz survey sought to identify and get optical spectra of every IRAS PSC 60m sources brighter than 0.6Jy, after exclusion of Galactic sources and cirrus. The full catalogue consists of 15459 sources, of which 15200 have . Of the latter all but 791 (5.2) have measured redshifts (these numbers differ slightly from those given by Saunders et al 2000). sources are discussed below. The PSCz completeness limit is given as 98.5 outside the masked area (see Fig 5), ie for 85 of the sky.
I have examined these 791 sources in the NASAIPAC Extragalactic Database (NED). 493 were either identified with catalogued galaxies (especially with 2MASS galaxies), were identified galaxies in the RIFSCz catalogue (Wang et al 2014), were classified as cirrus in the literature, were classified as known Galactic sources, or were within 1.5 arcmin of a 2MASS galaxy. A plot of 60m flux versus K-band magnitude for IRAS Faint Source Catalogue galaxies shows that most, but not quite all, IRAS galaxies with 60 m flux density 0.6 Jy are likely to be detected as 2MASS sources.
The distribution of distances of the nearest 2MASS galaxy for sources not associated with 2MASS galaxies in NED is consistent with being the tail of a 30 arcsec Gaussian, which is a plausible value for the rms error in IRAS-2MASS associations. Most sources with separations less than 1.5 arc min are therefore likely to be real associations and few of those with larger separations are likely to be true associations. However because the size of the 60 m detectors (4.5x0.5 arc min), errors in processing can occasionally result in separations between an IRAS source and its associated galaxy of more than 1.5 arc min.
304 (2) sources remain unidentified in NED. Many of these are at , where identification is harder because of strong extinction in the optical and because of the high surface-density of stars, and where the probability of spurious cirrus sources is higher. Reviews of targeted searches for low latitude galaxies have been given by Kraan-Korteweg and Lahav (2000) and Staveley-Smith et al (2016). Examination of the Schlegel et al extinction maps (Schlegel et al 1998) suggests that a further 72 of these 304 unidentified sources are cirrus. 164 are classified as g or gf (‘faint galaxy’) in the NASA-HEASARC PSCz archive, although without confirmation of the source position by radio observations (available for only 27 of the sources) such an identification is ambiguous, since several faint objects lie within the IRAS error ellipse. For a further three, a radio association confirms the source as a galaxy. HEASARC identify a further 2 objects as stellar and 8 as cirrus. 3 are sources recovered by Saunders et al (2000) from the IRAS Reject File, but without a confirming galaxy or IRAS FSC association the reality of these sources is doubtful. The final number of unidentified IRAS PSCz sources is then 52, if ‘gf’ designation is accepted as an identification, and IRAS Reject File sources are rejected. However the resulting constraint on very slow movers brighter than 0.6 Jy at 60 m is still rather limited, that the surface-density is no greater than 0.001 per sq deg. But from Fig 2 it is clear that no very slow movers of interest (parallactic angle , ) would have 60 m flux-densities greater than 0.6 Jy. Unidentified PSCz sources could still be of interest as candidates for Planet 9 if they lay within the areas that received only 2 HCON coverages.
4.2 Unidentified sources in the RIIFSCz catalogue
The revised Imperial IRAS FSC redshift (RIIFSCz) catalogue (Wang et al 2014) is also of interest to look for unidentified 60 m sources to fainter fluxes than the PSCz catalogue. The IRAS Faint Source Catalog was processed in a different way to the PSC, essentially coadding all the IRAS data before searching for point sources. Moshir et al (2019) give the 90 completeness limit for the IRAS Faint Source Catalog at 60 m as 0.28 Jy and this is confirmed by 60 m source-counts. There are 2727 sources in the RIIFSCz brighter than 0.3 Jy which do not have a galaxy association. I have examined all of these using the National Extragalactic Database (NED) and find that 1720 have plausible associations with 2MASS galaxies, which I define as follows: for ‘bright’ 2MASS galaxies (K13.5) an association within 1.5 arcmin; for 2MASS galaxies with 13.5K14.5 an association within 1.0 arcmin; and for ‘faint’ 2MASS galaxies (14.5K15.5) an association within 30 arcsec. The redshifts of the associated galaxies, where available, are generally in the range 0.01-0.15. A few are associated with stars (68) or other Galactic sources (2). The remaining 937 sources, 3.1 of sources brighter than 0.3Jy, are unidentified and may be higher redshift(z0.1) galaxies or spurious sources. I investigate whether any of these can be associated with a single HCON source below (section 6.2).
The distribution on the sky of PSCz and RIIFSCz unidentified sources is shown in Fig 5.
5 The IRAS 60 m single HCON database
To find a Planet 9 candidate in the IRAS data we need to look for an unidentified point source associated with a separated single HCON source. Here I characterise in detail for the first time the IRAS single HCON database (Point Source Reject File). This consists of 21045 single HCONs with detections at 60 m. For one reason or another these have failed to be associated with IRAS PSC sources. These can include main-belt asteroids, planets, distant comets, cirrus, galaxies whose different HCONs did not get properly processed together, and point sources in areas of the sky which achieved only a single HCON coverage. Counts of 60m single HCONs suggest the 90 completeness limit is 0.45 Jy.
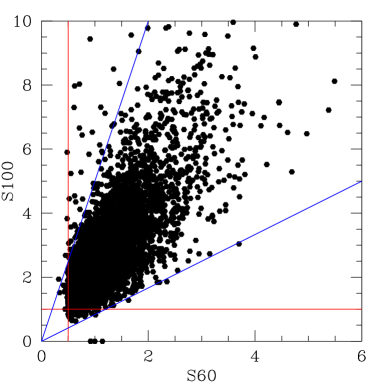
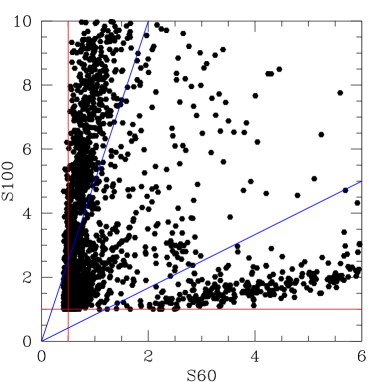
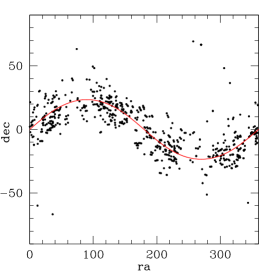
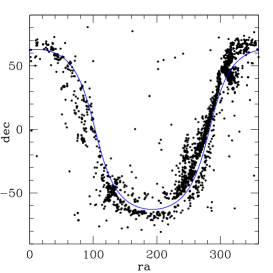
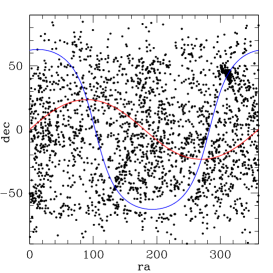
12760 of these have detections also at 100 m and for these Fig 3R shows S100 versus S60. For comparison a similar plot is shown (Fig 3L) for the QMW IRAS Galaxy Catalogue (Rowan-Robinson et al 1991). This contains 17706 galaxies and differs from PSCz in including sources with 60 m fluxes in the range 0.5-0.6 Jy). The straight lines which bound most IRAS galaxies correspond to = 0.7 and -0.1. Strong concentrations of single HCON sources lie outside the region occupied by galaxies. I divide the single HCONs into (i) hot sources ( ), (ii) warm sources (), (iii) cold sources ( . Figure 4 shows the sky distribution, RA versus dec, for the three classes, with the loci of the ecliptic and Galactic planes indicated.
It is apparent that most of the hot single HCONs are main-belt asteroids and that most of the cold single HCONs are Galactic cirrus. The warm sources show concentrations along the edges of the IRAS coverage gaps, with a strong concentrations where these gaps cross the Galactic plane. Otherwise the distribution of warm single HCONs is broadly isotropic, consistent with most being incorrectly processed bits of galaxies.
6 New search for warm slow movers (Planet 9 candidates)
We now look for Planet 9 candidates. Firstly I look for associations of unidentified sources from the different IRAS catalogues with single HCONs, which would be candidates for Planet 9 at distances 400 AU. Then I look for cross-associations of single HCONs, which would be candidates for a lower distance Planet 9.
6.1 Association of PSCz unidentified sources with single HCONs
To see whether there any candidates in the IRAS database for the hypothetical Planet 9, an object of a few tens of earth-masses at a distance of 280-1100 AU, I have first searched for 60 m-detected warm single HCONs (including 60 m only objects) at distances of 2-25 arcmin from the 52 unidentified PSCz sources at . 8 sources found 1HCON matches. There were two cases where multiple single HCONs were found associated with the same PSCz source. These are presumed to be either main-belt asteroids or due to cirrus or other Galactic structures. Each of the remaining associated single HCONs was examined for associations in NED. Associations of 1HCON sources with 2MASS galaxies were accepted up to 2 arcmin, allowing for the poorer error ellipse for single HCONs. A number of single HCONs were identified as due to cirrus from the Schlegel et al extinction maps.
One further constraint is that the PSCz source should be missing the third HCON. I have examined all 52 unidentified PSCz sources using the IRSA Scanpi tool, which allows the individual IRAS scans crossing any specified position to be examined. The signature of a Planet 9 candidate would be a source seen on the scans associated with the first two HCONs but missing on the third HCON. One source, 88.313751+45.864166, showed this signature, and has a single HCON nearby (87.50875+45.64139, at 36.3 arcmin), but the latter is detected on all three HCONs and is not a mover. Also the flux agreement is poor (0.8Jy for PSCz source, 0.4Jy for 1HCON), so this source is not a convincing candidate for Planet 9.
Of the 259 PSCz sources at , 105 did not have redshifts determined by Saunders et al (2000). I examined these for associations in NED and found 45 did not have associations. These 45 were then run with Scanpi. 2 were spurious, 4 were cirrus, 2 probably Galactic, and there were just two with the characteristic missing HCON profile: 74.024582+47.587219 and 85.358749+21.475834. The first does not have a nearby single HCON of interest (the nearest is at 36 arcmin and is not unidentified). The second has a nearby HCON (see Table 1) but this does not show any convincing detections on the Scanpi scans.
The conclusion of the search in PSCz is that no plausible candidate survives.
6.2 Association of RIIFSCz unidentified sources with single HCONs
I looked for associations of single HCONs with the 937 unidentified RIIFSCz sources, at separations between 2 and 25 arcmin. A total of 126 associations were found. The associated RIIFSCz sources were checked with Scanpi, looking for the pattern of detections on the first two HCONs and non-detections on the third. The single HCONs were examined with NED, so that identified sources could be rejected, and with Scanpi to check the reality of the sources.
There were three cases cases of interest ( listed in Table 1). However for two, the single HCON is not unidentified. The third RIIFSCz source is non really undetected on the third HCON and the flux match with the single HCON is poor.
The conclusion is that no Planet 9 candidate survives in the RIIFSCz catalogue.
6.3 Association of QMW IRAS galaxy catalogue unidentified sources with single HCONs
While the RIIFSCz takes our search down to 0.3 Jy, it does so only for . At we can use the QMW IRAS Galaxy Catalogue (QIGC: Rowan-Robinson et al 1991) to extend the search to 0.5 Jy. The completeness of QIGC is given as 80 in the flux-range 0.5-0.6Jy (Rowan-Robinson et al 1991). I therefore searched for unidentified IRAS PSC sources with 60 m fluxes in the range 0.5-0.6 Jy (from the QMW IRAS Galaxy Catalogue, see Fig 5), with single HCON associations at separations in the range of interest for Planet 9. 90 sources have 1HCON associations, 14 are unidentified: of these, 6 are spurious (Scanpi), 2 are extended at 60 m, 7 were candidates for having missing HCONs, and 2 of these are of interest (Table 1). For 114.505836-23.892778 the QIGC source and the single HCON have the appropriate pattern of detected and non-detected HCONs for a mover, in terms of 3- detections in Scanpi. However the non-detected HCONs are not very convincing because each has several 2- detections. For 276.900848+22.634167 the single HCON is not unidentified.

6.4 Cross associations of single HCONs
If Planet 9 lay at a distance 200 - 400 AU, it could be present in the IRAS Reject File of single HCONs as a triple of single HCONs with two separated by a few arc minutes and a third at 10-35 arc mins. The signature would be that the source would only be detected on one HCON pass each time, i.e. there must be non-detections as well as detections. In the areas which received only 2 HCONs there could be two single HCONs separated by a few arc minutes (see below). Finally in the case of a faint planet 9 candidate at 280-1000 AU in the 3 HCON sky there could be two single HCONs separated by 6-25 arc minutes if the source failed one of its first two HCONs. For completeness I have explored all of these possibilities.
There are 15162 warm 60 m single HCONs (including those undetected at 100 m). Many are spurious detections (Scanpi shows no pass with detection ), or are clearly extended, due to cirrus. To cut down on the large number of uninteresting matches with cirrus, extended or spurious sources, I require the 100 m flux or upper limit to be 3.5Jy. This reduces the probability of a chance association with a single HCON within 25 arcmin at any given position on the sky to 7.
Some single HCONs are main-belt asteroids. From Fig 3 these would be fainter (and smaller) asteroids, with S60 3 Jy, otherwise they would be detected at 100 m and excluded as ‘hot’ movers. Fig 6 shows the distribution of single HCONs in a 40 sq deg area close to the ecliptic plane in which the tracks of at least 12 main-belt asteroids can be seen. The triplet of sources labelled U are due to Uranus. The central source is Uranus itself. The two much fainter flanking sources appear to be glints from Uranus (they are too far from Uranus to be the latter‘s brighter moons). In fact of the 88 single HCONs in this area of the sky as many as 74 can be attributed to asteroids. These detections of Uranus and asteroids demonstrate the IRAS capability to detect faint moving objects.
There are 532 pairs of single HCONs at separations 2-25 arcmin. I examined all of these with Scanpi and found one possible case of interest, 275.30018+7.33028 (Table 1), seen on its first HCON pass but not on the second six months later. However the Scanpi scans on the paired single HCON show it to have been detected on two out of four scans, so not a mover.
My triples search, requiring one association at 1-6 arcmin, and a second at 10-35 arcmin, yields 75 triplets, all of which I examined with Scanpi and in NED. One of these, 314.83499+64.21527, is definitely of interest as a candidate for a mover and is discussed in the next section.
Finally a search for close pairs of single HCONs, with separations 2-6 arcmin, yielded 76 pairs (after excluding Saturn glints). These were examined in Scanpi without yielding any further cases of interest.
| name | RA (1950) | dec | b | S25 | S60 | S100 | comment | |
|---|---|---|---|---|---|---|---|---|
| (1950) | (Jy) | dist(‘) | ||||||
| PSCz | ||||||||
| Q05414+2128 | 85.358749 | 21.475834 | 0.27 | 1.04 | 2.79 | undetected on 3rd HCON, close to predicted Planet 9 orbit | ||
| R05419+2156 | 85.48292 | 21.93889 | 0.326 | 0.631 | 2.490 | 28.6 | none of 7 scans show a convincing detections | |
| RIIFSCz | ||||||||
| F20189-0408 | 304.745880 | -4.145520 | 0.310 | 0.321 | 1.736 | |||
| R20195-0430 | 304.88586 | -4.50111 | 0.250 | 0.419 | 1.304 | 22.9 | 2M gal at 9 arcsec, zsp=0.1106, not unidentified | |
| F19499-2111 | 297.479980 | -21.197281 | 0.195 | 0.340 | 0.894 | faint sources, br star at 6 arcsec | ||
| R19515-2105 | 297.87750 | -21.09750 | 0.458 | 0.565 | 1.000 | 23.0 | br 2M gal at 36 arcsec, zsp=0.03360, not unidentified | |
| F18264-6330 | 276.61043 | -63.50469 | 0.113 | 0.497 | 1.666 | not really undetected on 3rd HCON | ||
| R18242-6346 | 276.06082 | -63.78194 | 0.250 | 0.925 | 1.437 | 22.4 | undetected on first two HCONs but poor flux match | |
| QIGC | ||||||||
| 738014-235334 | 114.50584 | -23.89278 | 0.25 | 0.55 | 2.17 | |||
| R07378-2349 | 114.46250 | -23.82944 | 0.604 | 0.603 | 2.641 | 4.5 | non-detection on first two HCONs unconvincing | |
| 1827362+223803 | 276.90085 | 22.63417 | 0.25 | 0.56 | 1.43 | |||
| R18272+2246 | 276.81000 | 22.77472 | 0.250 | 0.448 | 1.274 | 9.8 | radio, br 2M gal at 9 arcsec, not undetected | |
| 1HCONs | ||||||||
| R18212+0719 | 275.30018 | 7.33028 | 0.275 | 0.548 | 1.671 | non-detection on 2nd HCON | ||
| R18216+0724 | 275.42291 | 7.41306 | 0.250 | 0.513 | 2.480 | 9.0 | source seen on 2 out of 4 scans on 1st HCON | |
| R20593+6413 | 314.83499 | 64.21527 | 0.250 | 0.558 | (2.509) | clear non-detection on 3rd and 4th HCON | ||
| R20592+6411 | 314.80624 | 64.18917 | 0.250 | 0.627 | 3.251 | 1.7 | clear non-detection on 3rd and 4th HCON | |
| R20562+6408 | 314.07373 | 64.14889 | 0.250 | 0.538 | 2.680 | 20.3 | clear non-detection on first 3 HCONs, Planet 9 candidate |

6.5 A planet 9 candidate
The triplet of single HCONs R20593+6413, R20592+6411, R20562+6408, is definitely of interest as a candidate for Planet 9. There were in fact four hours-confirming passes over this area of sky: (1) June 27-28, 1983, (2) July 13, (3) July 23-24 (4) Sept 19-20. The Scanpi detection profile of the 3 single HCONs during these passes is shown in Table 2, which gives the ratio of the number of detections number of possible detections.
HCONs 1 and 2, separated by 1.7 arcmin, appear to be cross-scan split detections of the same source, detected most strongly on pass 1. Neither were detected on passes 3 or 4. HCON 3 was detected on pass 4 but not on passes 1-3. So the pattern of detections and non-detections matches that expected for a slow-moving object, which has moved 20.3 arcmin in 11.9 weeks, or 1.7 arcmin per week.
Before we consider what the orbit of such an object might be, it should be noted that the source(s) lie at low Galactic latitude (b = 9 deg), in a region strongly affected by cirrus (Fig 7R). The detections are not of high quality, do not show a strong correlation with a point-source profile, and therefore allow a suspicion of being extended and thus cirrus.
| pass | (1) | (2) | (3) | (4) |
|---|---|---|---|---|
| R20593+6413 | 45 | 2 | 02 | 07 |
| R20592+6411 | 66 | 35 | 04 | 05 |
| R20562+6408 | 04 | 06 | 02 | 47 |
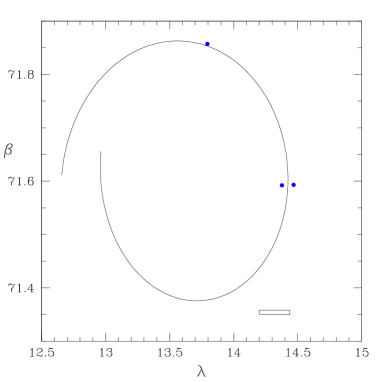
The expected orbit of Planet 9 is a combination of a parallactic ellipse with major axis parallel to the ecliptic plane, semi-major axis and semi-minor axis , and the proper motion, which we may approximate as a straight line of length per year, with position angle (in ecliptic coordinates) .
This very approximate orbit fit gives d = 225 15AU, , and centre of the parallactic ellipse at ()(2000.0) = (13.62, 71.62) , and is illustrated in Figure 7L. Scanpi signal-to-noise values of all the possible detections at the locations on the preferred orbit corresponding to the times of the four HCON passes are shown in Table 3. For a slow-moving source on this orbit we should ideally see good detections on the diagonal of this array and none off the diagonal. While the outcome is not ideal, it is quite suggestive. This is even more suggestive in the plots of individual scans (available online), where 7 of the 8 off-diagonal scans do not show any evidence of a source at the central location on the scan, while all of the on-diagonal ones do. Despite the poorer quality of the IRAS data at this low Galactic latitude, both the HCON data and the individual averaged detector scans are consistent with the idea of the detection of a moving object.
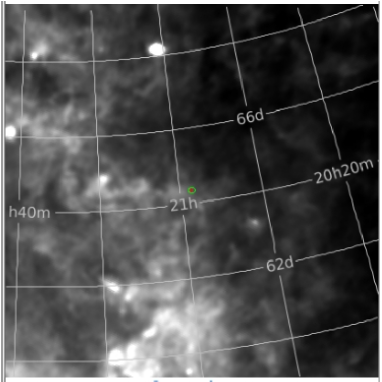
Figure 8 shows a possible orbit from 1983 to 2100, calculated using The Project Pluto package Find Orb. However the IRAS data are not accurate enough to allow an orbit to be determined and we can only say that at 2100.0 the candidate object should be within an annulus of radius 2.5-4o, centred on ()(2000.0) = (13.62, 71.62).
| time | (2000) | scan (1) | scan (2) | scan (3) | scan (4) | |
|---|---|---|---|---|---|---|
| 1983 June 28 6.7hrs | 14.4214 | 71.5869 | 2.9, 3.1, 2.47, 0, 2.7, 2.8 | 2.7, 0, 2.7, 2.2, 2.47 | 0, 2.1, 0 | 0, 0, 0, 0 |
| 1983 July 13 17.6hrs | 14.4063 | 71.6551 | 2.9 2.1 2.4 2.6 2.46 2.8 | 0, 3.1, 0, 2.49 | 3.0, 0 | 3.6, 0, 0, 0, 0, 3.8, 0 |
| 1983 July 23 23.4hrs | 14.3722 | 71.6913 | 0, 0, 0, 0, 0, 2.49 | 0, 0, 0, 3.1, 0 | 2.9, 0 | 0, 0, 0, 0, 0 |
| 1983 Sept 20 5.7hrs | 13.7554 | 71.8560 | 0,0, 2.2, 0 | 0, 0, 0, 0, 0, 0 | 0, 0, 0, 0 | 3.1, 2.4, 2.3, 2.7, 3.4, 2.6 |
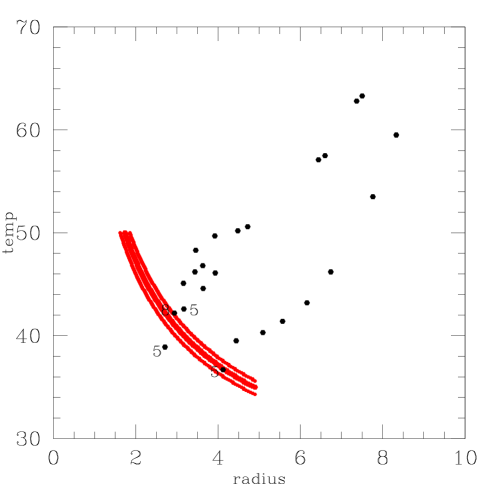
Figure 9 shows planetary temperature versus radius, with the expected locus of a 60m source of 0.57 Jy (red loci, corresponding to distances of 210, 225 and 240 AU) together with locations of the Fortney et al (2019) Planet 9 models. The strong cirrus in the vicinity of the source make a significant 100m detection or upper limit impossible.
The candidate discussed here would be likely to have mass 3-5 , with the ephemerides limits (Batygin et al 2019) suggesting a mass at the lower end of the range. However this candidate is rather different from the Batygin and Brown (2019) proposal on which the ephemerides limit of Fienga et al (2016), from which the Batygin et al (2019) constraint is extrapolated, is based. This candidate is of significantly lower mass and at much higher ecliptic latitude. It would clearly be desirable to reconsider the ephemerides limits for an object with this orbit.
7 Recovery of Planet 9 candidate 1983-present
A planet of mass 3-5 , radius 1.5-5 , at a distance of 210-240 AU, should in principle be relatively easy to recover from survey data in the intervening period. The major difficulty is the closeness of the candidate planet to the Galactic Plane, making the detection of even a relatively bright moving object difficult against the very high surface density of stars.
The Palomar Digital Sky Survey (DPOSS) surveyed the entire northern sky in the late 1980s and early 1990s and released a catalogue but only for (Reid et al 1991, Djorgovski 1999).
Meissner et al (2018) carried out a search for moving objects in the WISE survey data, but only for 70 of sky, and not including the area of interest.
The best dataset for this search is the Panstarrs ‘3 ’ survey in bands g,r,i,z,y of the entire sky north of dec = -30o, carried out in 2009-14 (Chambers et al 2019). Approximately half of the gri observations were carried out in a series of 4 exposures, quads, all separated by about 15 minutes, so completed within 1 hour. By analogy with IRAS I will refer to these sets of observations taken within about an hour as HCONs. These observations were then repeated several times each year over the 5 years of the survey. In one hour our Planet 9 candidate would have moved about 0.6 arcsec, so would be registered as a point-source, ie a single HCON, albeit with only 4 detections out of the target 60 for the survey. Wainscott et al (2015) reported a search for Near Earth Objects (NEOs) with Panstarrs, but not yet at high ecliptic latitude or low Galactic latitude.
Mallama et al (2017) give predicted colours and magnitudes for solar system planets, and we can use these to estimate colours and magnitudes for Neptune, Jupiter or Pluto -like objects, scaled for r=3.66 at a distance 225 AU , with an uncertainty of 0.3 dex in distance and radius. For Jupiter-like colours, (g,r,i,z = 16.84, 16.26, 16.41, 16.73), for Neptune-like colours, (g, r, i, z = 16.79, 16.95, 18.04, 18.90), and for Pluto-like colours, (g, r, i, z = 18.02. 17.22, 16.99, 16.99), respectively. These suggest the search can be restricted to (r-i) 1.0 and (g-r) 1.5.
I used VizieR to extract Panstarrs single HCONs within 2.5-4.0 deg of the 1983 position. Many are too bright to be of interest, so I restricted the search to . The majority are part of point sources seen on all 4 or 5 years of observation, so I restricted the search to sources with less than 5 detections. I examined detections for each candidate using MAST. There were a small number of genuine single HCONs but none form the expected radial line of HCONs corresponding to the 5 years of Panstarrs observation. Moreover none of the ‘single HCONs’ in this area of the sky are in fact true quads. Typically one triplet of gri observations was carried out on a single night, within one hour, while other repeat observations are carried out 4-10 nights later. Since in 4-10 days our candidate object would have moved 1-3 arcmin, different bands would be displaced by this amount and would not be combined into a single source. However Planet 9 could still have been seen as sets of triplet detections in a roughly radial line, a year apart in time. A search for HCON triplets in the expected annulus did not result in any candidates of interest.
The failure to recover the candidate in the Panstarrs data suggests that this candidate object is not in fact real, though the fact that the quad strategy was not implemented in the region of sky of interest makes this conclusion uncertain. Given the poor quality of the IRAS detections, at the very limit of the survey, and in a very difficult part of the sky for far infrared detections, the probability of the candidate being real is not overwhelming. However given the great interest of the Planet 9 hypothesis, it would be worthwhile to check whether an object with the proposed parameters and in the region of sky proposed, is inconsistent with the planetary ephemerides. Fienga et al (2020) state that a 5 planet would have to be at a distance 500 AU to be consistent with the planetary ephemerides, but their simulations do not appear to include cases at such high ecliptic latitudes as my candidate. If simulations showed that the candidate here is not inconsistent with the planetary ephemerides, a more sophisticated search of the Panstarrs database would be worthwhile.
8 Discussion
The analysis here takes the discussion of identifications of the PSCz galaxy catalogue a little further than Saunders et al (2000), and the identification of RIIFSCz sources significantly further than Wang et al (2014). 0.3 of the PSCz galaxies at (52 sources) remain unidentified, and 3 of RIIFSCz sources remain unidentified.
I have given a fairly full discussion of the nature of the IRAS 60 m single HCON sources in the IRAS PSC Reject Catalogue. Most are main belt asteroids, galaxies or cirrus. I do not find a convincing example of an unidentified PSCz or RIIFSCz source associated with an unidentified single HCON at a separation of 1-30 arc min, which would be a candidate for a ninth planet. Iorio (2014, 2016) and Fienga et al (2016, 2020) have already given dynamical arguments which severely constrain the type of object postulated by Batygin and Brown (2016).
Searching for close pairs or triplets of single HCONs, I have found a candidate for a planet at 210-240 AU in the 1983 IRAS data. It is at very high ecliptic latitude and at low Galactic latitude, which may explain why it has not been found in previous searches for a 9th planet. Dynamical studies are needed to check whether such an object is consistent with the ephemerides of other solar system objects and whether this object can account for the clustering of the orbits of Kuiper belt dwarf planets. The IRAS detections are not of the highest quality but it would be worth searching at optical and near infrared wavelengths in an annulus of radius 2.5-4 deg centred on the 1983 position. This candidate could be ruled out if radio or other observations confirmed the reality (and stationarity) of the IRAS sources at the 1983 1HCON positions.
IRAS had a significant capability to detect a planet in the outer solar system of mass 10 or greater, especially if it had an extended gaseous envelope. For the 70 of the sky which had a third IRAS HCON coverage, the region of Fig 2 to the left of the 60 m limit is excluded. However even within the areas that did not receive a third HCON, Planet 9 would have been detectable as an unidentified PSCz source (for d 400 AU) or as a close pair of single HCONs (for d =200-400 AU). IRAS would have been able to detect a 10 planet to 380-600 AU, and could have detected a 20 planet to 690-1000 AU (with the higher limit corresponding to an extended planetary atmosphere). The 90 completeness limit for these searches at 60 m is 0.45 Jy for . Between and the IRAS mask (see Fig 5), the completeness limit is 90 down to 0.6 Jy, and 80 between 0.5 and 0.6 Jy. These are worthwhile constraints for the Planet 9 search.
9 Acknowledgements
This work would not have been possible without the data tools and date archives provided by IRSA, NED, HEASARC, VizieR and MAST.
10 Data availability
All data used in this paper have been taken from public archives.
11 Note added in proof
In a paper published after this paper was submitted, Brown and Batygin (2021, AJ in press) have carried out new simulations of Planet 9 candidates capable of explaining the clustering of orbits of Kuiper belt dwarf planets. Their preferred planetary mass, 6.2 +2.2 -1.3 , and perihelion, 300 +85 -60 AU, are now quite close to those of my Planet 9 candidate. However the preferred direction on the sky for their Planet 9 object is very far from my candidate, so my object, if real, may not be the cause of the orbit clustering.
References
- (1) Batygin K., Brown M.E., 2016, AJ 151, 22
- (2) Batygin K., Adams F.C., Brown M.E., Becker J.C., 2019, Physics Reports 805, 1
- (3) Brown M.E., Batygin K., 2016, ApJ 824, L23
- (4) Brown M.E., Batygin K., 2019, AJ 157, 62
- (5) Caceres J., Gomes R., 2018, AJ 156, 157
- (6) Crosswell K., 1991, New Scientist, Nov 30
- (7) Davies J.K. et al, 1984, Nature 309, 315
- (8) Fienga A., Laskar J., Manche H., Gastineau M., 2016, AA 587, L8
- (9) Fienga A., Di Ruscio A., Bernus L., Deram P., Durante D., Laskar J., Iess L., 2020, AA 640, A6
- (10) Fortney J.J., Marley M.S., Laughlin G. et al, 2016, ApJL 824, L25
- (11) Harrington R.S., 1988, AJ 96, 1476
- (12) Holman M.J., Payne M.J., 2016, AJ 152, 94
- (13) Iorio L., 2017, Astrophys.Space.Sci.Supp. 362, 111
- (14) IRAS Explanatory Supplement, 1988, eds C.A.Beichmann, G.Neugebauer, H.J.Habing, P.E.Clegg, Chester, T.J. (NASASTI)
- (15) The IRAS Asteroid and Comet Survey, 1986, ed. D.L.Matson, JPL D-3698 (Pasadena: JPL)
- (16) Jackson A.A., Killen R.M., 1988, MNRAS 235, 593
- (17) Kraan-Korteweg R.C., Lahav O., 2000, Astron.Astroph.Rev. 10, 211,
- (18) Luhman K.L.,2014, ApJ 781, 4
- (19) Mallama A., Krobusek B., Pavlov H., 2017, Icarus 282, 19
- (20) Matthews R., 1991 Science 254, 1454
- (21) Medvedev Y.D., Vavilov D.E., Bondarenko Y.S., Bulekbaev D.A., Kunturova N.B., 2017, Astr.L. 43, 120
- (22) Meisner A.M., Bromley B.C., Nugent P.E., et al, 2017 AJ 153, 65
- (23) Meisner A.M., Bromley B.C., Kenyon S.J., Andersin T.E., 2018, AJ 155, 166
- (24) Millholland S., Laughton G., 2017, AJ 153, 91
- (25) Mordasini C. Alibert Y., Georgy C., Dittkrist K.-M., Klahr H., Henning T., 2012, AA 547, 112
- (26) Morrison L.V., 1992, Observatory 112, 36
- (27) Moshir M. et al, 1992,Explanatory Supplement to IRAS Faint Source Survey, Version 2. JPL D-100015 8/92 (Pasadena JPL)
- (28) Murray J.B., 1999, MNRAS 309, 31
- (29) Neuhauser R., Feitzinger J.V., 1991, Earth, Moon and Planets, 54, 193
- (30) Reynolds R.T. et al, 1980, Icarus 44, 772
- (31) Rowan-Robinson M., Saunders W., Lawrence, Leach K., 1991, MNRAS 253, 485
- (32) Rowan-Robinson M., 2013, Night Vision, CUP
- (33) Saunders W. et al,2000, MNRAS 317, 55
- (34) Schlegel D.J., Finkbeiner D.P., Davis M., 1998, ApJ 500, 525
- (35) Seidelmann P.K. , Harrington R.S., 1988, Celestial Mechanics 43, 55
- (36) Standish M., 1992, AJ 105, 200
- (37) Staveley-Smith L. et al, 2016, AJ 151, 52
- (38) Trujillo C.A., Sheppard S.S., 2014, Nature 507, 471
- (39) Wainscott R., Chambers K., Lilly E., Weryk R., Chastel S., Denneau L., Micheli M., 2015,in IAU Symposium 318, Asteroids: New observations, New Models, eds S.R.Chesley, A.Morbidelli, R.Jedicki, D.Farnocchia. p.293
- (40) Walker R.G., Rowan-Robinson M., 1984, BAAS 16, 443
- (41) Wang L., Rowan-Robinson M., 2010, MNRAS 398, 109
- (42) Wang L., Rowan-Robinson M., Norberg P., Heinis S., Han J., 2014, MNRAS 442, 2739