Fermi-LAT detection of extended gamma-ray emission in the vicinity of SNR G045.700.4: evidence for escaping cosmic rays interacting with the surrounding molecular clouds
Abstract
We present the analysis of Fermi Large Area Telecope (LAT) data of the gamma-ray emission in the vicinity of a radio supernova remnant (SNR), G045.700.4. To study the origin of the gamma-ray emission, we also make use of the CO survey data of Milky Way Imaging Scroll Painting to study the massive molecular gas complex that surrounds the SNR. The whole size of the GeV emission is significantly larger than that of the radio morphology. Above 3 GeV, the GeV emission is resolved into two sources: one is spatially consistent with the position of the SNR with a size comparable to that of the radio emission, and the other is located outside of the western boundary of the SNR and spatially coincident with the densest region of the surrounding molecular cloud. We suggest that the GeV emission of the western source may arise from cosmic rays (CRs) which have escaped the SNR and illuminated the surrounding molecular cloud. We find that the gamma-ray spectra of the western source can be consistently explained by this scenario with a total energy of in escaping CRs assuming the escape is isotropic.
1 Introduction
Diffusive shock acceleration (DSA) operating at expanding shock waves of supernova remnants is widely believed to be the mechanism converting the kinetic energy released by supernova explosions into the energy of cosmic rays (e.g., Malkov & Drury 2001). In the DSA theory, cosmic rays (CRs) being accelerated at shocks must be scattered by self-generated magnetic turbulence. Since the highest-energy CRs in the shock precursor are prone to lack self-generated turbulence, they are expected to escape the shock. The DSA theory generally predicts that a substantial fraction of the shock energy is carried away by escaping CRs. In the presence of molecular clouds surrounding the supernova remnant (SNR), escaping CRs can illuminate the clouds through interactions, producing gamma-ray emission with a flux depending on the amount of nuclear CRs released by a supernova remnant and the diffusion coefficient in the interstellar medium (Aharonian & Atoyan, 1996; Rodriguez Marrero et al., 2008; Aharonian et al., 2004; Gabici et al., 2009). H.E.S.S. observations reveal a complex of sources (HESS J1800-240A, B and C) south of the SNR W28, coincident with molecular clouds in the field, and the Large Area Telescope (LAT) on board the Fermi satellite reveals a similar structure in GeV energies (Abdo et al., 2010a; Hanabata et al., 2014). The GeV-TeV gamma-ray emission around W28 can be regarded as a realization of this scenario (Aharonian et al., 2008). Another example is the detection of two extended gamma-ray structures located at two opposite edges of the SNR W44 by the Fermi-LAT (Uchiyama et al., 2012; Peron et al., 2020). The gamma-ray emission coincides with the molecular cloud complex that surrounds SNR W44. The gamma-ray emission that appears to come from the surrounding molecular cloud complex can be ascribed to the cosmic rays that have escaped from W44. The total kinetic energy channeled into the escaping CRs are estimated to be larger than a few in both W28 and W44, although the exact number depends on the value of the diffusion coefficient of escaping CRs.
SNR G045.700.4 is one of the 30 sources classified as likely GeV SNRs in the first Fermi-LAT supernova remnant catalog (with 36 months data in 1-100 GeV), based on the spatial overlap of sources detected at GeV energies with SNRs known from radio surveys (Acero et al., 2016). No significant extension is found with 36 months Fermi-LAT data (Acero et al., 2016). In this paper, we report the analysis result of the GeV gamma-ray emission from the direction of SNR G045.700.4 using over 12 years Fermi-LAT data in 3-500 GeV energy band, and present the CO observational results of molecular clouds in this region. G045.700.4 is a shell-type SNR with a radius of about in the radio band (Fuerst et al., 1987; Green, 2019). Figure 1 shows the radio continuum emission map at 200 MHz (Hurley-Walker et al., 2019). The spectrum from 1 to 10 GHz shows a power-law form of . We will show that the GeV emission is much more extended than the radio SNR. Interestingly, CO observations reveal a giant molecular cloud complex surrounding SNR G045.700.4. This makes this source a likely analogy of W28 and W44, with gamma-ray emission produced by escaping CRs illuminating the molecular cloud.
The paper is organized as follows. We first report the Fermi-LAT observations of the region around SNR G045.700.4 in §2. The observation results of CO distribution of this region are reported in §3. Then we discuss the interpretation of the GeV sources in §4. Finally, we give discussions and conclusions.
2 Fermi/LAT Data Analysis
The Fermi-LAT is sensitive to -rays with energies from 20 MeV to over 300 GeV, and it has continuously monitored the sky since 2008 (Atwood et al., 2009). The Pass 8 data taken from 2008 August 4 to 2020 November 17 are used to study the GeV emission around SNR G045.700.4 region. The event class P8R3SOURCE (“evclass=128”) and event type FRONT + BACK (“evtpye=3” ) are used. The event class is the recommended class by the LAT team and provides good sensitivity for analysis of point sources and moderately extended sources111https://fermi.gsfc.nasa.gov/ssc/data/analysis/documentation/Cicerone/Cicerone_Data/LAT_DP.html#PhotonClassification. We only consider the -ray events in the energy range, with the standard data quality selection criteria “”. To minimize the contamination from the Earth limb, the maximum zenith angle is set to be 90. In this work, the publicly available software Fermitools (ver. 1.2.23) is used to preform the data analysis.
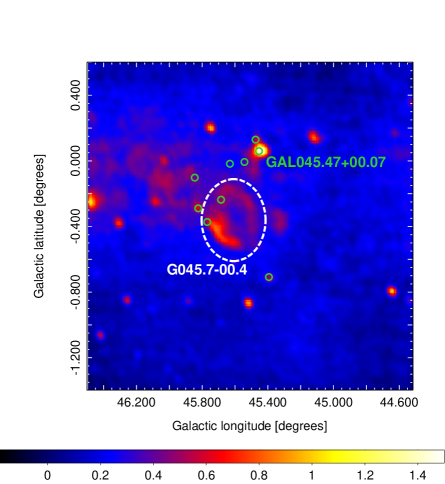
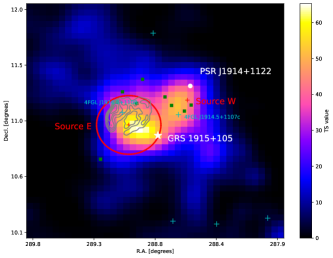
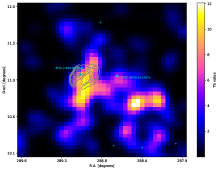
Only the data within a region of interest (ROI) centered on the position of G045.700.4 are considered for the binned maximum likelihood analysis. The instrument response functions (IRFs) () is used. We include the diffuse Galactic interstellar emission (IEM, ), isotropic emission (“” ) and all sources listed in the fourth Fermi-LAT catalog(Abdollahi et al., 2020a) in the background model. All sources within of the center are set free. The parameters of IEM and isotropic emission are also left free. The maximum likelihood test statistic (TS) is used to estimate the significance of -ray sources, which is defined by TS, where and are maximum likelihood values for the background with target source and without the target source (null hypothesis). Figure 2 shows the 3-500 GeV TS map in the the vicinity of G045.700.4 with the binned likelihood method provided by Fermitools. The TS map is generated by only considering background fitting but not including 4FGL J1916.3+1108 and 4FGL J1914.5+1107c. An obvious excess of GeV emission is seen in the vicinity of G045.700.4. The excess appears to consist of two parts, which are roughly consistent with two 4FGL sources in position (4FGL J1916.3+1108 and 4FGL J1914.5+1107c). 4FGL J1916.3+1108 is spatially coincident with SNR G045.700.4, while 4FGL J1914.5+1107c does not have any clear counterparts at other wavelengths. Hereafter, we refer to the eastern part of the GeV excess as Source E and the western part as Source W.
2.1 Morphological analysis
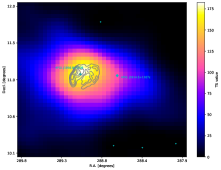
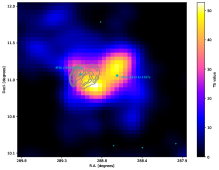
We first study the energy-dependence of the morphology of the gamma-ray emission in the the vicinity of G045.700.4. The TS map of the gamma-ray emission in 1-3 GeV, 3-10 GeV and 10-30 GeV are shown in the left, middle and right panel of Figure 3. Similar to the TS map in 3-500 GeV, the TS map of the gamma-ray emission in 3-10 GeV shows two regions of gamma-ray excess: one is spatially consistent with the position of the radio SNR, and the other is on the west of the radio remnant. In 10-30 GeV, only a marginal detection of gamma-ray emission at the position of the radio SNR is seen. Taking into account of a better point-spread function (PSF) in the higher energy band as well as sufficient statistics for the analysis, we considered events only above 3 GeV in the following morphological analysis.
We use the Fermipy tool to quantitatively evaluate the extension and location of these two sources. The uniform disk model is used to evaluate the extension of them. For the Source W, we do not find significant extension. Under the assumption of a disk shape, the upper limit extension amounts to 21 arcmin at the 95% confidence level. We thus treat Source W as a point-like source hereafter. The best-fit position of Source W is estimated to be ()=(,) in the energy band above 3 GeV. This position is 8 arcmin away from the position of 4FGL J1914.5+1107c.
For the Source E, its extension in the uniform disk model is with a . The extension represents the radius containing 68% of the intensity, and we define it as the source size. The is defined as , where is the maximum likelihood value for the extend model and is the maximum likelihood value for the point-like model. Compared to the point-like model, the uniform disk model has one additional degree of freedom, and the extension significance is approximate to (Abdollahi et al., 2020a, b). The values of for the uniform disk model is 25.8, which rejects a point-like source hypothesis at . Also, we test a two-dimensional Gaussian model and find the results are quite similar, with and . The best-fit position for Source E is ()=(,), which is 7 arcmin away from the position of 4FGL J1916.3+1108. The results of the morphology analysis are summarized in Table 1.
2.2 Energy Spectrum
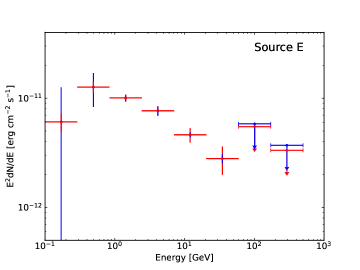
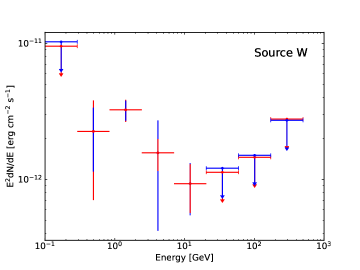
After the morphology was fixed, we derive the gamma-ray spectral energy distribution (SED) of Source E and Source W. The results are shown in Figure 4. When the TS value of spectra data point is less than 4, the upper limit is calculated at 95% confidence level using a Bayesian method (Helene, 1983). In this work, we consider two sources of systematic errors: (1) uncertainties due to imperfect modeling of the Galactic diffuse emission, ; (2) uncertainties due to the source spatial model, . are evaluated by going over the whole process using an alternative Galactic diffuse emission model (). For the morphology analysis, as shown in Table 1, both the uniform disk plus a point-like source model (Disk + PS) and the two-dimensional Gaussian plus a point-like source model (Gaussian + PS) can describe well the GeV morphology. Therefore, is estimated by comparing the spatial model of Disk + PS with that of Gaussian + PS. The total systematic errors (), shown as blue error bars in Figure 4, are evaluated by adding in quadrature the uncertainties due to the Galactic diffuse model and the source spatial model as (Abdollahi et al., 2020b). In the energy band greater than 3 GeV, the spectra of both sources are well described by a power-law function with ( corresponding to (Abdollahi et al., 2020a)), where is defined as . In this work, the curved spectrum represents a log parabola spectral shape. But in the 0.1 GeV energy band, the spectrum of the Source E is well described by a log parabola function with (), while the spectrum of the Source W is still described by a power-law function with . Using the alternative Galactic diffuse emission model, we find that the values for Source E and Source W are 28.06 () and 6.39 (), respectively. Therefore, the spectral models are assumed to be a log parabola function for Source E and a power-law function for Source W above 0.1 GeV in this work. The spectral indices of the Source E and Source W are and , respectively. The energy flux of Source E and Source W are and in the 0.1-500 GeV energy band, respectively.
3 CO observations
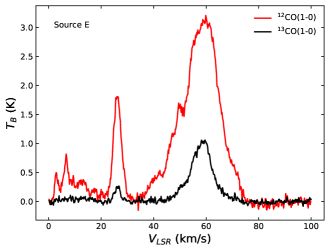
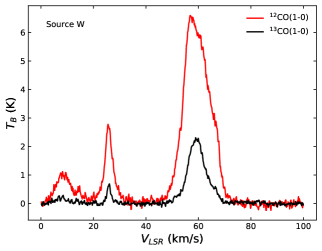
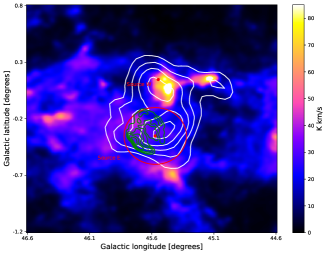
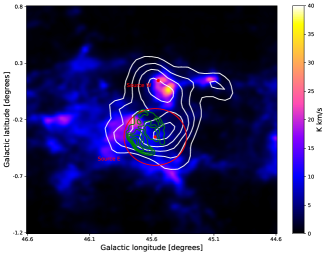
We make use of the data from the Milky Way Imaging Scroll Painting (MWISP222http://english.dlh.pmo.cas.cn/ic/) project, which is a multi-line survey in 12CO/13CO/C18O along the northern galactic plane with PMO-13.7m telescope. The detailed observing strategy, the instrument, and the quality of the CO observations can be found in Su et al. (2019). In this section, we present the results of the MWISP CO survey for regions centre of . Broad profiles of 12CO emission usually come from the turbulent molecular gas that is readily and significantly influenced by local shocks. However, the 13CO emission, usually optically thin, arises in the quiescent dense gas along the whole line of sight (LOS). We have inspected the 12CO and 13CO line profiles of the MCs toward the Source E and Source W region, to search for kinematic evidence for gas distribution due to external interaction(Frail & Mitchell, 1998; Reach et al., 2005; Jiang et al., 2010; Zhou & Chen, 2011; Kilpatrick et al., 2016; Liu et al., 2020). We do not find any significant evidence of broadenings or asymmetries in 12CO line with respect to the narrow 13CO line. The spectra of 12CO and 13CO emission toward Source E and Source W are shown in Figure 5. We find that the spectra of 12CO emission shows multi-peaks, but only two peaks shown in the spectra of 13CO emission. Considering that the 12CO emission at a systemic velocity of 0–40 km/s is widely distributed toward the inner Galaxy (Su et al., 2019), and the peak of 13CO emission at a velocity of is too weak with respect to the peak at a velocity of , we think that the peak of can be ignored. The molecular gas complex at a systemic velocity of in the direction of the GeV source corresponds to a near distance kpc and far distance kpc (Brand & Blitz, 1993; Reid et al., 2019). In the following, we parameterize the distance of the molecular gas complex as . Figure 6 shows integrated CO emission map concentrated toward SNR G45.7-00.4 in the velocity interval of . Apparently, there is good correlation between the gas distribution and the intensity of -ray emission. Particularly, the point-like GeV Source W coincides well with the densest region of the gas distribution. Adopting the mean CO-to- mass conversion factor (Bolatto et al., 2013), we estimate that the total mass of gas within of the Source E is about . Assuming a spherical geometry of the gas distribution, the average cubic density in this region is about . The densest CO molecular gas that coincides with Source W corresponds to a molecular cloud identified by Miville-Deschênes et al. (2017), which is named “[MML2017] 683” in SIMBAD 333http://simbad.u-strasbg.fr/simbad/sim-ref?querymethod=bib&simbo=on&submit=submit+bibcode&bibcode=2017ApJ...834...57M. Miville-Deschênes et al. (2017) obtained a velocity of , consistent with our measurement.Since Source W is a point-like source, we estimate the mass and density of the gas by considering the CO emission within of the Source W. We find that the mass of gas within of the Source W is about and the average cubic density is about .
4 Interpretation of the GeV emission
4.1 Source E
The morphological analysis shows that the extended gamma-ray source (Source E) is coincident with the radio SNR, suggesting that it represents the GeV emission of the shell of SNR G045.7-00.4.
Assuming a real association between the molecular cloud and SNR G045.7-00.4, the distance of SNR G045.7-00.4 is about . We can also estimate the distance of the SNR using the empirical radio surface-brightness-to-diameter () relations for SNRs. The radio surface-brightness of SNR G045.7-00.4 is , suggesting a diameter of about (Pavlović et al., 2013). Note that the diameter of the SNR inferred from the relation has a large uncertainty. Give the angular radius of for the radio SNR, the distance is inferred to be about . In the following, we adopt the distance of as a reference value for SNR G045.7-00.4. The luminosities of the gamma-ray emission in 0.1-500 GeV of Source E is .
The radius of the radio SNR is about pc. For an SNR in the Sedov-Taylor expansion phase, the size of the SNR grows with time as , where is the number density of the ambient medium and is the kinetic energy of the supernova explosion. Then, we can estimate the age of SNR G045.7-00.4 from its radius, i.e., . It is not clear when the SNR encountered the molecular cloud. The SNR could experience most of the evolution time so far in ISM and encountered molecular cloud just recently, or, alternatively, the SNR could have already expanded in the molecular gas since very beginning. For a density of , the age of the SNR could span in a large range of about .
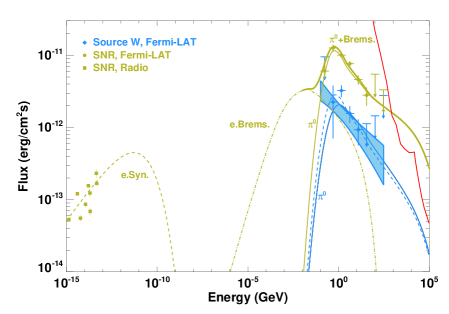
As source E coincide spatially with dense molecular clouds, a natural mechanism for the emission is hadronic emission produced by cosmic rays interacting with the gas in the molecular clouds. Therefore, we model the GeV spectra of both sources with the hadronic model, which are shown in Figure 7. The GeV emission is dominated by -decay process. Below 1 GeV, the bump is slightly steeper than the data, and we speculate that the bremsstrahlung emission of electrons may have a sub-dominant contribution to the flux. In the meanwhile, the radio emission is produced by the same electrons via the synchrotron radiation. Combined with the GeV data and the radio data, we find that a magnetic field of gives a reasonable fitting. Note that, we here take the matter density of and the magnetic field depends on the matter density. The electron spectrum is assumed to follow the form with and we use an arbitrary value of GeV for the maximum electron energy. The total electron energy above 5 MeV is taken to be erg. We note that the electron spectrum may probably be a broken power-law due to the cooling effect. However, lacking of optical and X-ray data, the parameters of the broken power-law function cannot be constrained. Thus, we simply assume a single power-law function with an exponential cutoff at , which is also arbitrarily set. The proton spectrum is also assumed to be a power-law function with a high-energy cutoff. The proton spectrum slope is assumed to be and the total energy of cosmic rays is about above 1 GeV.
4.2 Source W
Besides SNR G045.7-00.4, there are a few HII regions and pulsars in the GeV emission region (see Figure 2). The brightest HII region is GAL045.47+00.07, which is a compact HII region and locates at a distance of (Kolpak et al., 2003). At such a distance, the luminosity of Source W would be if it is associated with GAL 045.47+00.07. An infrared source IRAS 19124+1106 appears projected in close association with GAL 045.47+00.07. The derived IRAS luminosity is , correspond to an O9.5 ZAMS star (Rodriguez & Mirabel, 1998). The kinetic energy luminosity in the stellar wind of such a star is about . Unless the efficiency of converting the wind power to CRs is close to , which seems unlikely, the wind power is insufficient to explain the gamma-ray luminosity.
Pulsars or associated PWNe could also be potential GeV gamma-ray sources. We search for pulsars in the GeV region according to the ATNF (Australia Telescope National Facility444https://www.atnf.csiro.au/research/pulsar/psrcat/) Pulsar Catalogue (Manchester et al., 2005). We find that only one pulsar (PSR J1914+1122, 0.121 distant from centre of Source W) locating within error circle of the Source W. But it is too weak to power the -ray emission, since its spin-down luminosity is only .
Active galactic nucleus (AGNs) are a known -ray-emitting source class. Therefore, we search the possible AGNs counterparts within of the centre of Source W in the SIMBAD. But we do not find any known AGNs counterparts.
Source W is spatially coincident with the densest region of the molecular cloud. This is reminiscent of SNR W28, where a nearby GeV source is located at the boundary of W28. Like W28, Source W can be interpreted as arising from escaping cosmic rays that interact with surrounding molecular cloud. The luminosity of the gamma-ray emission in 0.1-500 GeV of Source W is .
For Source W, we assume that the GeV emission is also dominated by -decay process. Note that, given kpc, the radius of the dense molecular cloud around Source W is about or pc, and Source W lies at a distance of from the center of G045.7-00.4 or pc. Let us assume that cosmic rays escape isotropically from the sphere of the shock. Following previous studies (Gabici et al., 2009; Ohira et al., 2011), we assume the escape of cosmic rays of energy starts at with being a model parameter. is the staring time of the Sedov-Taylor phase, which can be approximately given by yr (Truelove & McKee, 1999). Here is the mass of the ejecta. This corresponds to an escape radius with pc. The differential density of escaping CRs at the position of Source W reads (Ohira et al., 2011; Celli et al., 2019)
| (1) |
where is the spectrum of escaping proton, which is assumed to be . is defined as the fraction of the kinetic energy converted into runaway CR energy. where is the diffusion coefficient around the SNR. We assume a homogeneous diffusion coefficient and paramterize it as with being the ratio between the diffusion coefficient to the average one of the Galactic plane. Then, we can calculate the expected gamma-ray flux of Source W by
| (2) |
where is the differential inelastic cross section for gamma-ray production (Kafexhiu et al., 2014) and accounts for the approximate volume of the molecular cloud at the location of Source W.
Now let us consider two limiting scenarios. In one scenario, the SNR expanded in typical ISM of density during most of the evolution time leading to an age of 7000 yr for the SNR, while, in the other, the SNR has expanded in the molecular cloud of density since long time ago, leading to an age of yr. In Fig. 7, we also show the resulting pionic gamma-ray flux produced by runaway CRs for Source W in the two limiting scenarios. The solid blue curve represents the scenario of yr with , and , while the dashed blue curve represents the scenario of yr with , and . Both scenarios can give acceptable fitting to the Fermi-LAT data, but we note that the value of required in the former scenario is quite large. This is because given an age of only 7000 yr for the SNR, we need the escape CR energy quickly drop to 10 GeV in order to account for the measured 1 GeV flux, otherwise the 10 GeV protons would not have sufficient time to arrive at the position of Source W. Assuming a larger diffusion coefficient could alleviate this problem, but in the mean while requires an unreasonably large energy budget for the runaway CRs. In the latter scenario, we simply employ , following Ohira et al. (2011). With , the total energy of CRs escaping from the SNR is , assuming the escaping is isotropic. We also show the Large High Altitude Air Shower Observatory (LHAASO) point-source sensitivity of one-year exposure in the plot (Bai et al., 2019), which indicates that G045.7-00.4 could be detectable by LHAASO as long as the power-law spectrum of CR protons extends to a sufficiently high energy (e.g. PeV as assumed in the calculation). Note that the angular resolution of LHAASO is about at energies above 10 TeV (Bai et al., 2019). Due to the poor angular resolution of LHAASO, it may be difficult to distinguish between the emission from Source E and Source W.
5 Summary
We analyzed the GeV -ray emission in the vicinity of SNR G045.7-00.4 using 12 years of Fermi-LAT data. We detected one extended gamma-ray source coincident with the radio SNR and a point-like source located west of the radio boundary of the SNR. Both gamma-ray sources overlap with the molecular clouds in the velocity range of 52 to 62 . The gamma-ray emission from both sources can be interpreted as arsing from the decay of s produced by the interaction of CRs with the dense molecular gas. In particular, the western source may result from the escaping CRs from G045.7-00.4 during an earlier epoch. The GeV data of Source W can be consistently explained by this scenario assuming that the total energy in escaping CRs is about . Depending on the age of the SNR, the diffusion coefficient of CRs at energy is estimated to be .
Interestingly, X-ray observations by ROSAT PSPC555https://skyview.gsfc.nasa.gov/current/cgi/runquery.pl (0.1 to 2.4 keV) shows an extremely bright source, GRS 1915+105, located only and away from the centre of Source E and Source W, respectively. GRS 1915+105 is a superluminal microquasar at a distance of kpc (Reid et al., 2014), with a black hole accreting matter from a low-mass star. The X-ray luminosity of the microquasar is as high as a few . The energy transport rate of the jets has so far only been estimated during times when milliarcseconds jet components are detectable in the radio. It is estimated that the energy transport rate during such periods is between several and almost , depending on the composition of the jet material and its velocity (Fender et al., 1999; Gliozzi et al., 1999; Fender & Pooley, 2000). However, for the extended GeV emission that we consider here, only the energy transport rate of the jets averaged over timescales comparable to the formation timescale of the large-scale structure is important. It was suggested that two IRAS regions, IRAS 19124+1106 and IRAS 19132+1035, are the impact regions of large-scale jets from GRS 1915+105 (Rodriguez & Mirabel, 1998; Kaiser et al., 2004), as the two impact regions are almost perfectly symmetric about the position of GRS 1915+105 and lie in the directions that the small-scale jets of this source point to. Modeling of the the dynamics and radiation of the possible large-scale jets gives a time-averaged energy transportation rate (Kaiser et al., 2004) . So the jets from GRS 1915+105 could, in principle, contribute at least partly to the GeV emission.
References
- Abdo et al. (2010a) Abdo, A. A., Ackermann, M., Ajello, M., et al. 2010, ApJ, 718, 348. doi:10.1088/0004-637X/718/1/348
- Abdollahi et al. (2020a) Abdollahi, S., Acero, F., Ackermann, M., et al. 2020, ApJS, 247, 33. doi:10.3847/1538-4365/ab6bcb
- Abdollahi et al. (2020b) Abdollahi, S., Ballet, J., Fukazawa, Y., et al. 2020, ApJ, 896, 76. doi:10.3847/1538-4357/ab91b3
- Acero et al. (2016) Acero, F., Ackermann, M., Ajello, M., et al. 2016, ApJS, 224, 8. doi:10.3847/0067-0049/224/1/8
- Aharonian & Atoyan (1996) Aharonian, F. A. & Atoyan, A. M. 1996, A&A, 309, 917
- Aharonian et al. (2004) Aharonian, F. A., Akhperjanian, A. G., Aye, K.-M., et al. 2004, Nature, 432, 75. doi:10.1038/nature02960
- Aharonian et al. (2008) Aharonian, F., Akhperjanian, A. G., Bazer-Bachi, A. R., et al. 2008, A&A, 481, 401. doi:10.1051/0004-6361:20077765
- Atwood et al. (2009) Atwood, W. B., Abdo, A. A., Ackermann, M., et al. 2009, ApJ, 697, 1071. doi:10.1088/0004-637X/697/2/1071
- Bai et al. (2019) Bai, X., Bi, B. Y., Bi, X. J., et al. 2019, arXiv:1905.02773
- Bayandina et al. (2015) Bayandina, O. S., Val’tts, I. E., & Kurtz, S. E. 2015, Astronomy Reports, 59, 998. doi:10.1134/S1063772915110025
- Brand & Blitz (1993) Brand, J. & Blitz, L. 1993, A&A, 275, 67
- Bolatto et al. (2013) Bolatto, A. D., Wolfire, M., & Leroy, A. K. 2013, ARA&A, 51, 207. doi:10.1146/annurev-astro-082812-140944
- Celli et al. (2019) Celli, S., Morlino, G., Gabici, S., et al. 2019, MNRAS, 490, 4317. doi:10.1093/mnras/stz2897
- Frail & Mitchell (1998) Frail, D. A. & Mitchell, G. F. 1998, ApJ, 508, 690. doi:10.1086/306452
- Fender et al. (1999) Fender, R. P., Garrington, S. T., McKay, D. J., et al. 1999, MNRAS, 304, 865. doi:10.1046/j.1365-8711.1999.02364.x
- Fender & Pooley (2000) Fender, R. P. & Pooley, G. G. 2000, MNRAS, 318, L1. doi:10.1046/j.1365-8711.2000.03847.x
- Fuerst et al. (1987) Fuerst, E., Reich, W., Reich, P., et al. 1987, A&AS, 69, 403
- Gabici et al. (2009) Gabici, S., Aharonian, F. A., & Casanova, S. 2009, MNRAS, 396, 1629. doi:10.1111/j.1365-2966.2009.14832.x
- Gliozzi et al. (1999) Gliozzi, M., Bodo, G., & Ghisellini, G. 1999, MNRAS, 303, L37. doi:10.1046/j.1365-8711.1999.02436.x
- Green (2019) Green, D. A. 2019, Journal of Astrophysics and Astronomy, 40, 36. doi:10.1007/s12036-019-9601-6
- Hanabata et al. (2014) Hanabata, Y., Katagiri, H., Hewitt, J. W., et al. 2014, ApJ, 786, 145. doi:10.1088/0004-637X/786/2/145
- Helene (1983) Helene, O. 1983, Nuclear Instruments and Methods in Physics Research, 212, 319. doi:10.1016/0167-5087(83)90709-3
- Hurley-Walker et al. (2019) Hurley-Walker, N., Hancock, P. J., Franzen, T. M. O., et al. 2019, PASA, 36, e047. doi:10.1017/pasa.2019.37
- Jiang et al. (2010) Jiang, B., Chen, Y., Wang, J., et al. 2010, ApJ, 712, 1147. doi:10.1088/0004-637X/712/2/1147
- Kafexhiu et al. (2014) Kafexhiu, E., Aharonian, F., Taylor, A. M., et al. 2014, Phys. Rev. D, 90, 123014. doi:10.1103/PhysRevD.90.123014
- Kaiser et al. (2004) Kaiser, C. R., Gunn, K. F., Brocksopp, C., et al. 2004, ApJ, 612, 332. doi:10.1086/422466
- Kilpatrick et al. (2016) Kilpatrick, C. D., Bieging, J. H., & Rieke, G. H. 2016, ApJ, 816, 1. doi:10.3847/0004-637X/816/1/1
- Kolpak et al. (2003) Kolpak, M. A., Jackson, J. M., Bania, T. M., et al. 2003, ApJ, 582, 756. doi:10.1086/344752
- Liu et al. (2020) Liu, Q.-C., Chen, Y., Zhou, P., et al. 2020, ApJ, 892, 143. doi:10.3847/1538-4357/ab7a22
- Malkov & Drury (2001) Malkov, M. A. & Drury, L. O. 2001, Reports on Progress in Physics, 64, 429. doi:10.1088/0034-4885/64/4/201
- Manchester et al. (2005) Manchester, R. N., Hobbs, G. B., Teoh, A., et al. 2005, AJ, 129, 1993. doi:10.1086/428488
- Miville-Deschênes et al. (2017) Miville-Deschênes, M.-A., Murray, N., & Lee, E. J. 2017, ApJ, 834, 57. doi:10.3847/1538-4357/834/1/57
- Ohira et al. (2011) Ohira, Y., Murase, K., & Yamazaki, R. 2011, MNRAS, 410, 1577. doi:10.1111/j.1365-2966.2010.17539.x
- Pavlović et al. (2013) Pavlović, M. Z., Urošević, D., Vukotić, B., et al. 2013, ApJS, 204, 4. doi:10.1088/0067-0049/204/1/4
- Peron et al. (2020) Peron, G., Aharonian, F., Casanova, S., et al. 2020, ApJ, 896, L23. doi:10.3847/2041-8213/ab93d1
- Reach et al. (2005) Reach, W. T., Rho, J., & Jarrett, T. H. 2005, ApJ, 618, 297. doi:10.1086/425855
- Reid et al. (2014) Reid, M. J., McClintock, J. E., Steiner, J. F., et al. 2014, ApJ, 796, 2. doi:10.1088/0004-637X/796/1/2
- Reid et al. (2019) Reid, M. J., Menten, K. M., Brunthaler, A., et al. 2019, ApJ, 885, 131. doi:10.3847/1538-4357/ab4a11
- Rodriguez Marrero et al. (2008) Rodriguez Marrero, A. Y., Torres, D. F., de Cea del Pozo, E., et al. 2008, ApJ, 689, 213. doi:10.1086/592562
- Rodriguez & Mirabel (1998) Rodriguez, L. F. & Mirabel, I. F. 1998, A&A, 340, L47
- Su et al. (2019) Su, Y., Yang, J., Zhang, S., et al. 2019, ApJS, 240, 9. doi:10.3847/1538-4365/aaf1c8
- Truelove & McKee (1999) Truelove, J. K. & McKee, C. F. 1999, ApJS, 120, 299. doi:10.1086/313176
- Uchiyama et al. (2012) Uchiyama, Y., Funk, S., Katagiri, H., et al. 2012, ApJ, 749, L35. doi:10.1088/2041-8205/749/2/L35
- Verkhodanov et al. (2005) Verkhodanov, O. V., Trushkin, S. A., Andernach, H., et al. 2005, Bulletin of the Special Astrophysics Observatory, 58, 118
- Zhou & Chen (2011) Zhou, P. & Chen, Y. 2011, ApJ, 743, 4. doi:10.1088/0004-637X/743/1/4
| Morphology ( 3 GeV) | Extension | TS | ||
|---|---|---|---|---|
| PS+PS | – | 110.18 | – | 8 |
| Disk+PS | 135.98 | 25.81 | 9 | |
| Gaussian+PS | 139.30 | 29.13 | 9 |