Discerning Legitimate Failures From False Alerts: A Study of Chromium’s Continuous Integration
Abstract.
Flakiness is a major concern in Software testing. Flaky tests pass and fail for the same version of a program and mislead developers who spend time and resources investigating test failures only to discover that they are false alerts. In practice, the defacto approach to address this concern is to rerun failing tests hoping that they would pass and manifest as false alerts. Nonetheless, completely filtering out false alerts may require a disproportionate number of reruns, and thus incurs important costs both computation and time-wise. As an alternative to reruns, we propose Fair, a novel lightweight approach that classifies test failures into false alerts and legitimate failures. Fair relies on a classifier and a set of features from the failures and test artefacts. To build and evaluate our machine learning classifier, we use the continuous integration of the Chromium project. In particular, we collect the properties and artefacts of more than 1 million test failures from 2,000 builds. Our results show that Fair can accurately distinguish legitimate failures from false alerts, with an MCC up to 95%. Moreover, by studying different test categories: GUI, integration and unit tests, we show that Fair classifies failures accurately even when the number of failures is limited. Finally, we compare the costs of our approach to reruns and show that Fair could save up to 20 minutes of computation time per build.
1. Introduction
Continuous Integration (CI) is a software engineering process that allows developers to frequently merge their changes in a shared repository (Rehkopf, [n.d.]). To ensure a fast and efficient collaboration, the CI automates parts —if not all— of the development lifecycle. Regression testing is an important step of this cycle as it ensures that new changes do not break existing features. Test suites are run for every commit and test results report if changes should be integrated to the codebase or not. Deterministic tests, which have consistent results, are then primordial to keep a smooth automation and a trouble-free CI. Unfortunately, some tests, commonly named flaky tests, exhibit a non-deterministic behavior as they both pass and fail for the same version of the codebase. When flaky tests fail, they send false alerts to developers who are evaluating their code changes. Indeed, developers spend time and effort investigating these flaky failures, only to discover that they are not due to legitimate faults (Eck et al., 2019). When these false alerts occur frequently, developers may lose trust in their test suites and stop considering failures even if some of them are caused by real faults. In this way, false alerts defy the purpose of software testing and hinder the flow of the CI.
Flakiness affects both open source and industrial projects (Bell et al., 2018; Kowalczyk et al., 2020; Lam et al., 2019b). Reports from Google show that almost 16% of their 4.2 million tests have some level of flakiness. This leads them to spend between 2 to 16% of their computation resources in rerunning flaky tests (Micco, 2017). Many other companies reported having trouble dealing with flakiness, including Microsoft (Lam et al., 2020), Spotify (Palmer, 2019) and Firefox (Rahman and Rigby, 2018).
In an attempt to better understand flaky tests, researchers studied the nature and root causes of flakiness (Lam et al., 2019a; Luo et al., 2014; Dutta et al., 2020; Thorve et al., 2018). These studies showed that the causes differ depending on projects, frameworks, and programming languages. However, they concurringly report that asynchronous waits, concurrency, and order-dependency are often the most prevalent root causes (Gruber et al., 2021; Romano et al., 2021). As for flakiness mitigation, rerunning failing tests is still the main strategy used by practitioners to identify flaky tests (Eck et al., 2019). If we can observe different outcomes of a test (passing or failing) when rerun on the same version of a program, we know it is a flaky test. But the rerun approach can require a lot of time and compute resources. Studies often re-execute test suites a large number of times, 100 times (Pinto et al., 2020), 400 times (Gruber et al., 2021) or even 10,000 times (Alshammari et al., 2021) and are still able to uncover unseen flaky tests. Hence, other tools such as DeFlaker (Bell et al., 2018) and iDFlakies (Lam et al., 2019b) were designed to detect flaky tests with a minimal number of reruns. Recently, several approaches relied on machine-learning to predict flaky tests based on code vocabulary, code coverage, and dynamic features (Alshammari et al., 2021; Pinto et al., 2020; Haben et al., 2021), allowing flakiness detection without reruns. Nevertheless, all these studies focus on distinguishing flaky tests from reliable tests and do not address the distinction between false alerts (i.e., flaky failures) and legitimate test failures (i.e., real regressions in the code).
In this paper, we address the problem of flakiness by focusing on test executions. In particular, we propose Fair (for FAIlure Recognizer), a novel lightweight approach for discerning legitimate failures from false alerts that are caused by flaky tests. Our approach relies on dynamic features (e.g., stack-trace and run duration) and static features (e.g., test command and code) to discard false alerts while avoiding reruns and coverage computation. We then conduct an empirical study on the Chromium project (contributors, 2021) to evaluate the effectiveness and efficiency of our approach. Our study covers more than 1 million test executions, 2,000 builds, and 41 test suites that include unit, integration, and Graphical User Interface (GUI) tests. With this study, we aim to answer the following research questions:
-
•
RQ1: How effective is Fair at identifying legitimate failures?
-
•
RQ2: How effective is Fair on different test categories?
-
•
RQ3: What features are the most significant for Fair?
-
•
RQ4: How efficient is Fair compared to reruns?
Our results show that:
-
•
Fair can accurately predict if a failure is legit or a false alert with an MCC up to 95%.
-
•
Fair shows great performances in detecting legitimate failures from GUI tests, with an MCC reaching 98%. For other test categories (integration and unit), despite a low number of samples to train and test on, Fair is able to decently predict failure classes.
-
•
When investigating the most important features used in the model’s decisions, the run duration comes first, followed by properties and keywords extracted from the artefacts (stack trace, test source, test command, etc).
-
•
Compared to the computation time required by reruns, Fair is faster by an order of 105.
The remaining of this paper is organised as follows. Section 2 introduces the chromium CI and our data collection process. Section 3 presents a preliminary analysis of the collected test failures. Section 4 explains our failure classification approach Fair and Section 5 describes our evaluation protocol. Section 6 presents the evaluation results and Section 7 discusses the threats to validity. Finally, Section 8 discusses related works and Section 9 concludes with the main findings. For replication purposes, we provide a comprehensive package that includes all the used datasets and scripts 111https://github.com/GuillaumeHaben/FAIR-ReplicationPackage.
2. The Chromium project
2.1. Continuous integration environment
Started in 2008, with more than 2,000 contributors and 25 million lines of code, the Chromium web browser is one of the biggest open-source projects currently existing. Google is one of the main maintainers, but other companies and contributors also take part in its development. Chromium relies on LuCI as a CI platform (team, 2021). It uses more than 900 parallelized builders, each one of them used to build with different settings (e.g., different compilers, instrumented versions for memory error detection, fuzzing, etc) and to target different operating systems (e.g., Android, MacOS, Linux, and Windows). Each builder is responsible for a list of builds triggered by each commit made to the project. In a build, we find details about build properties, start and end times, status (i.e., success or failure), a listing of the steps and links to the logs.
In the beginning, building and testing were sequential. Builders used to compile the project and zip the results to builders responsible for tests. Testing was taking a lot of time, slowing developers productivity and testing Chromium for several platforms was not conceivable, even by adding more computation power. A swarming infrastructure was then introduced in order to scale according to the Chromium development team productivity, to keep getting the test results as fast as possible and independently from the number of tests to run or the number of platforms to test. A fleet of 14,000 build bots is currently available to run tasks in parallel. This setup helps running tests with low latency and sustains hundreds of commits per day (contributors, 2021).
In this study, we focus on testers, i.e., builders only responsible for running tests. At the time of writing, we found 47 testers running Chromium test suites on different versions of operating systems. About 300,000 tests are divided into 41 test suites, the biggest ones being blink_web_tests (testing the rendering engine) and base_unittests with more than 60,000 tests each. For each build, we can obtain information about test results. The test is labelled as pass when it successfully passed after one execution. In case of a failure, LuCI automatically reruns the test from 2 to 5 times depending on configurations. If all reruns fail, the test is labelled as unexpected and will trigger a build failure. If a test passes after having one or more failed executions during the same build, it is labelled as flaky and won’t prevent the build from passing. In the remaining, we refer to unexpected failures as legitimate failures since their failing behaviour persisted through several reruns. On the other hand, we refer to flaky failures as false alerts.
2.2. Data Collection
We focus our data collection on the two testers Linux Tests and Win10 Tests x64, which are responsible for executing tests of the two main operating systems supported by Chromium. We collected the records of 1,000 builds for each tester. This represents 45 days of development taken between February and March 2021. By querying LuCI’s API, we retrieved the details of each test failure that occurred within these builds. Table 1 reports the number of false alerts and legitimate failures found in this dataset. We list the total number of runs that fall into each category and the number of unique failing tests. Interestingly, we observe that the number of failures that turn out to be false alerts is much larger than the legitimate ones, 969,417 and 225,762 respectively. That is, false alerts represent 81% of the failures in the Chromium CI, whereas legitimate failures only represent 19%. We also observe that the number of tests responsible for failures is very low compared to the number of failures. This indicates that the same tests keep failing across different builds.
| Tester | #Builds | False alerts | Legitimate failures | ||
|---|---|---|---|---|---|
| #Tests | #Failures | #Tests | #Failures | ||
| Linux Tests | 1,000 | 7,063 | 191,886 | 2,855 | 175,904 |
| Win10 Tests x64 | 1,000 | 40,668 | 777,531 | 1,482 | 49,858 |
| Total | 2,000 | 47,731 | 969,417 | 4,337 | 225,762 |
3. Preliminary Analysis
This section presents our preliminary analysis of test failures in the Chromium CI. The objective is to study the characteristics of test failures, both false alerts and legitimate failures, and pave the way for our approach design. In accordance with the study objective, we formulate the following preliminary question:
-
•
PQ: How do legitimate failures compare to false alerts?
To answer this question, we compare false alerts and legitimate failures in terms of:
-
•
History: This represents the historical behaviour (pass, failure, flake) of tests responsible for failures.
-
•
Duration: This represents the duration of test executions leading to legitimate failures and false alerts.
3.1. Test history
We analyse the history of tests responsible for legitimate failures and false alerts by relying on the metrics flakeRate and failRate.
For a failure of a test occurring at a commit , we analyse all the commits from a time window (i.e., from to to calculate the rates as follows:
| (1) |
| (2) |
where if the test flakes in the commit and null otherwise, while if the test fails persistently (for five reruns) in the commit and null otherwise. These two metrics allow us to understand if the history of a test can help in distinguishing false alerts from legitimate failures. The test execution history (a.k.a. heartbeat) has been used in multiple studies (especially industrial ones (Kowalczyk et al., 2020; Leong et al., 2019)) to detect flaky tests. These studies assume that many flaky tests have distinguishable failure patterns over commits and hence can be detected by observing their history. In this question, we check whether this assumption holds in the case of Chromium.
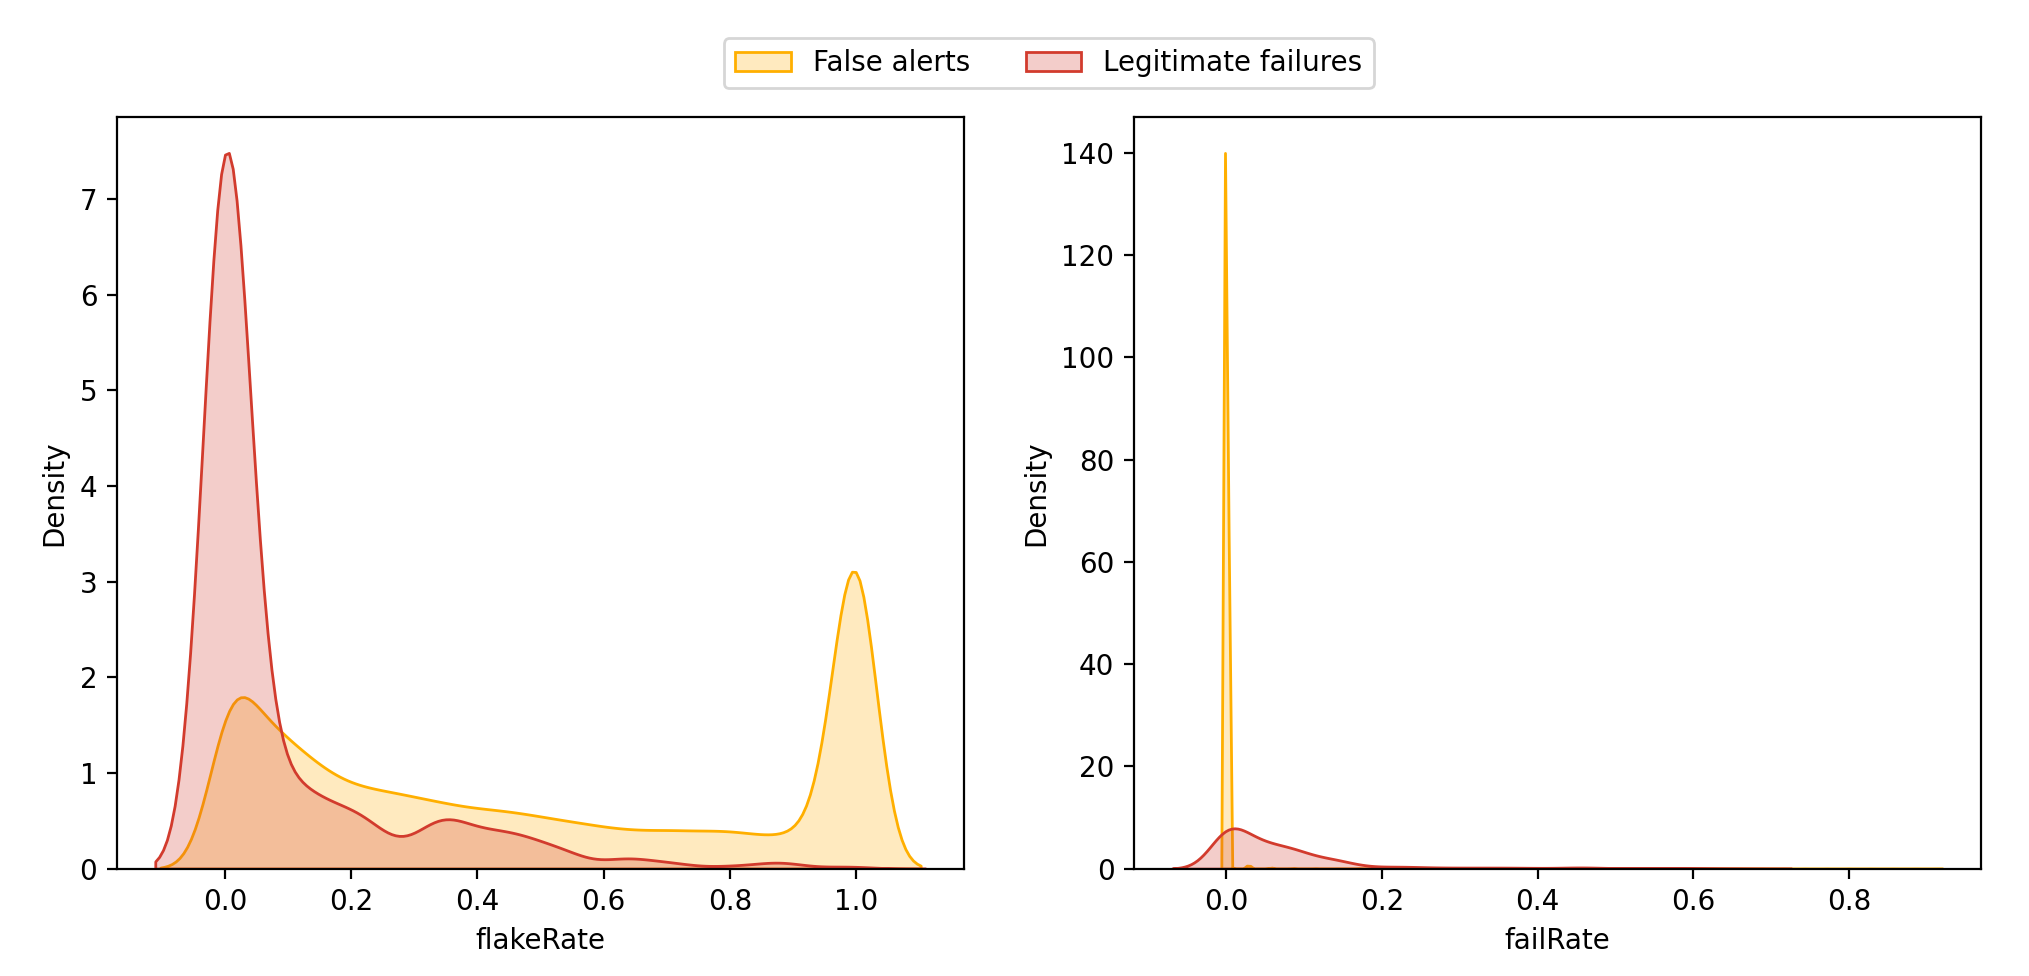
To illustrate differences in rates between false and legitimate failures, we plot the flakeRate() and failRate() for each failure category in Figure 1. The flakiness and failure rates are computed using a window of 35 commits. For false alerts, analyzing their history of failures shows that in most cases, the tests did not have a history of failures. The percentage of false alerts having a is in fact . In contrast, failures marked as false alerts were often witnessed in tests that had false alerts in previous commits. Indeed, only 16% had a in the past commits. In the case of legitimate failures, we observe that they generally occur in tests that did not fail or flake before. 60% of legitimate failures never flaked in previous commits. From these observations, we may suggest that the flakeRate() can be used to further distinguish between false alerts and legitimate failures. Nevertheless, there is still an important overlap between the history of false alerts and legitimate failures. In particular, in the history of Linux and Windows testers, we observe that:
-
•
16% of false alerts have ;
-
•
And 19% of legitimate failures have .
These two groups constitute a set of failures that have a clean history and thus are impossible to classify into false alerts or legitimate failures based on flakiness and failure metrics. Hence, we conclude that the historical differences between false alerts and legitimate failures are not sufficient for distinguishing them.
Another interesting observation from figure 1 is that there is a set of legitimate failures that occur in tests that manifested false alerts () in recent commits. We suspect that these outliers are false alerts that were not properly classified by reruns (we call them unreliable failures). Indeed, while reruns can affirm that a failure is due to flakiness by manifesting a test pass and fail for the same version, they do not allow us to affirm that a failure is legitimate. A previous study showed that up to 10,000 reruns can be required to discover flaky tests that have a low flake rate (Alshammari et al., 2021). Hence, a legitimate failure in the case of Chromium can still be a false alert (flaky failure) that was not rerun enough to manifest. This explains the behaviour of these tests which fail and flake intermittently in close time windows.
3.2. Run duration
The duration of test failures is one of the features easily retrievable in the Chromium CI. Thus, as part of our preliminary analysis, we compare false alerts and legitimate failures in terms of run duration. For this, we analyse the run duration of all failures from the Linux Tests tester. Table 2 shows the distribution of run duration for legitimate and false failures. We observe that legitimate failures tend to take longer than false alerts. In particular, the median duration of test executions is 1.09 seconds for legitimate failures, but only 0.41 seconds for false alerts. In the same vein, 25% of legitimate failures lasted more than 2.11 seconds, whereas the same portion of false alerts only lasted more than 1.31 seconds. This suggests that some failure properties such as run duration can help us distinguish legitimate failures from false alerts.
| Q1 | Median | Q3 | |
|---|---|---|---|
| False alerts | 0.18 | 0.41 | 1.31 |
| Legitimate failures | 0.77 | 1.09 | 2.11 |
4. Fair
Our main objective is to distinguish legitimate failures from false alerts efficiently and effectively. To achieve this, we propose a learning model that relies on dynamic and static properties to classify failures without performing any reruns. In the following, we present our feature extraction process and model design.
4.1. Features
Data cleaning
Starting from the dataset retrieved from the Chromium CI, we applied two filters to ensure the quality of our dataset. First, we excluded some failures that occur in a period where a big chunk of the test suite was failing oddly. A commit undoing changes that introduce these test suite failures was performed after investigation. Specifically, in Linux Tests, for 15 consecutive builds (98177 to 98192), 2,700 tests were failing repeatedly and this results in a total of more than 170,000 failures. During the same period, in Win10 Tests x64, 1,300 tests were failing per build, resulting in more than 45,000 failures spread across 9 builds (53760 to 53768). This irregular amount of failures only impacted JavaScript tests and the root cause remains unexplained. Therefore, we decided not to consider these builds in our experiments, to avoid a bias towards JavaScript tests. As a second cleaning step, we removed all the failures that were deemed unreliable based on their history (cf. Section 3). This filter excluded of the failures in our dataset.
Feature extraction
To construct our features, we analyse the failure properties, e.g., run duration, and all the available artefacts. Depending on the test, different artefacts are potentially available for each failure. Crash logs, stack traces, and the standard error provide various information about the raised exceptions and the execution of the program under test. For some tests, we can also retrieve the command used to launch the test. To widen the feature space, we also retrieve the source code of the test in its current commit using Google Git222https://chromium.googlesource.com/. In the case of the test source code, we only retrieved it when the test file was only containing one test. Chromium’s codebase — and tests — are written in different languages, but the vast majority are HTML and JavaScript tests. As other tests are not easily parsable, we decided to only add the test source to the runs of HTML and JavaScript tests. As all these artefacts are of textual nature (crashLog, stackTrace, stderr, and testSource), we build a bag of words (Goldberg, 2017) representation for each of them and we consider them as separate features. When counting words, we use Term Frequency-Inverse Document Frequency (TF-IDF), which aims at lowering the weight on common words present in all documents. In order to denote the presence of artefacts (or not) and their size, we add the length of all artefacts to the features. Additionally, we extract the run duration, run status, and run tag status to complete our list of features. Run duration is the execution time needed to run the test. Run status gives information about the run result (e.g., passing, failing, and skipped) and run tag status returns more precise information about the result of a run depending on the type of test or test suite (e.g., timeout and failure on exit). Table 3 provides a summary of all the extracted features.
| Feature name | Feature description |
|---|---|
| command | The vocabulary of the command used to run the test |
| commandLength | The number of characters present in the command artieact |
| crashlog | The vocabulary of the crash log resulting from an error |
| crashlogLength | The number of characters present in the crashlog artefact |
| runDuration | The time spent for this run execution |
| runStatus | 0: ABORT, 1: FAIL, 2: PASS, 3: CRASH, 4: SKIP |
| runTagStatus | 0: CRASH, 1: PASS, 2: FAIL, 3: TIMEOUT, 4: SUCCESS, |
| 5: FAILURE, 6: FAILURE_ON_EXIT, 7: NOTRUN, 8: SKIP, 9: UNKNOWN | |
| stackTrace | The vocabulary of the stack trace resulting from an error |
| stackTraceLength | The number of characters present in the stackTrace artefact |
| stderr | The vocabulary of the standard error captured after the test execution |
| stderrLength | The number of characters present in the stderr artefact |
| testSource | The vocabulary of the source code for the test |
| testSourceLength | The number of characters present in the testSource artefact |
4.2. Failure classifier
Following previous studies on flakiness prediction (Haben et al., 2021; Pinto et al., 2020) finding that Random Forest yields the best performances in flakiness classification tasks, we rely on this model for our classification as well. Selecting the model that yields the best performance is not in the scope of our study. We rather focus on understanding if the approach is feasible. With the two sets of data collected from Linux and Windows testers, we proceed as follows. Each failure in our dataset is denoted as an n-dimensional feature vector where represents one feature. indicates if the failure is from the false alert class (0) or from the legitimate failure class (1). Once all vectors are created, we randomly split our dataset by including 80% of it in the training set and 20% in the test set, conserving the class ratio in each subset (stratified). Using the training set, we search for the optimal set of hyperparameters for our Random Forest Classifier. To do so, we apply a 5-fold cross-validation technique using randomized search (Bergstra and Bengio, 2012). Considering our dataset, this step takes between 5 to 30 minutes depending on the test categories considered (See RQ2) on a machine with Intel Core 2.3GHz 8‑core 9th‑generation and 32-GB RAM. Once the optimal hyperparameters are tuned, we then search for the best threshold for precision and recall. We avoid using ROC curves which tend to be overly optimistic in their view of algorithms’ performance in presence of a high level of imbalanced data. Instead, we use the precision-recall curve recommended as an alternative in this case (Davis and Goadrich, 2006). Tuning the behaviour of a model by calibrating its classification threshold enables us to find the best trade-off between precision and recall. Finally, we refit the model on the whole training set and we evaluate its performance on the test set. The classified failures are categorized as:
-
•
True Positives (TP): failures that are correctly classified as legitimate failures;
-
•
False Positives (FP): false alerts that are wrongfully classified as legitimate;
-
•
False Negatives (FN): legitimate failures that are wrongfully classified as false alerts;
-
•
True Negatives (TN): failures correctly classified as false alerts.
5. Evaluation
This section presents our experimental protocol for evaluating Fair and answering our research questions.
5.1. RQ1: How effective is Fair at identifying legitimate failures?
In this question, we evaluate the performances of Fair at detecting legitimate failures. The objective is to investigate the possibility of using a machine learning model and failure properties to perform this detection. To evaluate our model, we rely on the following metrics:
-
•
Precision: Given by: .
-
•
Recall: Given by: .
-
•
F1-score: Given by:
-
•
MCC: The accuracy of a model is sensitive to the class imbalance. In particular, the precision and recall metrics can easily be impacted when one class is underrepresented, which is the case for our dataset. To alleviate this issue, we report the Matthews Correlation Coefficient (MCC) which is a more reliable statistical rate to avoid over-optimistic results in the case of an imbalanced dataset (Chicco and Jurman, 2020). This metric takes into consideration all four entries of the confusion matrix. MCC is given by:
5.2. RQ2: How effective is Fair on different test categories?
In this question, we evaluate the performances of Fair on different test categories. In heavily tested projects, different types of tests are used to assess the system quality. In the case of Chromium, test suites can be classified into three test categories: Graphical User Interface (GUI), integration, and unit tests. Based on their purpose, these tests differ in terms of scope and cost. In particular, unit tests target lower granularity components (e.g., classes or functions) and their execution is generally cheap both computation and time-wise. On the other hand, GUI tests evaluate the system as a whole (end-to-end) and consume more time and resources. Based on these differences, we expect these categories of tests to manifest different execution characteristics, which may influence our false alert detection approach. Hence, we take into account the test categories and evaluate the performances of Fair with two strategies:
-
•
Cross-category evaluation: In this strategy, we train the model using data from the different categories of tests, following their distribution in the original dataset. Then, we evaluate the model performances on three separate validation sets: GUI tests, integration tests and unit tests. This strategy allows a fine-grained evaluation of our approach and shows its performances on the three test categories.
-
•
Intra-category evaluation: We separately build and evaluate one model per test category. This allows us to assess the performances of our strategy when only one test category is available.
Table 4 provides details about Chromium’s test suites. For each test suite, we report the number of collected false alerts, legitimate failures, and the tests that are concerned by these failures. For the sake of readability, we only present test suites for which at least 100 failures are collected. The two largest test suites are blink_web_tests and webkit_unit_tests. Consequently, most failures come from these test suites.
| Test suite | Test type | Win10 Tests x64 | Linux Tests | ||||
|---|---|---|---|---|---|---|---|
| #Tests | #False alerts | #Legitimate failures | #Tests | #False alerts | #Legitimate failures | ||
| accessibility_unittests | unit | 0 | 0 | 0 | 1 | 961 | 0 |
| aura_unittests | unit | 0 | 0 | 0 | 74 | 318 | 0 |
| blink_platform_unittests | unit | 3 | 81 | 0 | 3 | 204 | 0 |
| blink_web_tests | GUI | 26,137 | 190,489 | 504 | 1,389 | 74,566 | 584 |
| browser_tests | integration | 1,368 | 11,228 | 208 | 2,529 | 20,297 | 222 |
| components_unittests | unit | 27 | 990 | 12 | 100 | 601 | 8 |
| content_browsertests | integration | 241 | 6,380 | 40 | 268 | 583 | 28 |
| content_unittests | unit | 80 | 209 | 0 | 3 | 6 | 0 |
| cronet_tests | integration | 2 | 206 | 0 | 0 | 0 | 0 |
| elevation_service_unittests | unit | 1 | 968 | 0 | 0 | 0 | 0 |
| events_unittests | unit | 2 | 164 | 0 | 0 | 0 | 0 |
| extensions_unittests | unit | 15 | 5,018 | 0 | 0 | 0 | 0 |
| gcp_unittests | unit | 46 | 3,889 | 0 | 0 | 0 | 0 |
| interactive_ui_tests | GUI | 65 | 182 | 18 | 144 | 486 | 74 |
| jingle_unittests | unit | 1 | 327 | 0 | 0 | 0 | 0 |
| media_blink_unittests | unit | 3 | 11 | 0 | 3 | 428 | 2 |
| mojo_unittests | unit | 11 | 131 | 0 | 0 | 0 | 0 |
| net_unittests | unit | 27 | 452 | 2 | 11 | 881 | 0 |
| non_skia_renderer_swiftshader_blink_web_tests | GUI | 0 | 0 | 0 | 12 | 210 | 0 |
| not_site_per_process_blink_web_tests | GUI | 0 | 0 | 0 | 1,486 | 60,684 | 680 |
| perfetto_unittests | unit | 0 | 0 | 0 | 19 | 410 | 0 |
| pixel_browser_tests | GUI | 100 | 633 | 72 | 0 | 0 | 0 |
| remoting_unittests | unit | 12 | 259 | 0 | 0 | 0 | 0 |
| services_unittests | unit | 21 | 698 | 0 | 10 | 386 | 0 |
| setup_unittests | unit | 1 | 135 | 0 | 0 | 0 | 0 |
| shell_dialogs_unittests | unit | 4 | 1,922 | 0 | 0 | 0 | 0 |
| sync_integration_tests | integration | 93 | 133 | 0 | 91 | 103 | 2 |
| telemetry_unittests | unit | 0 | 0 | 0 | 2 | 7,283 | 0 |
| unit_tests | unit | 161 | 2,703 | 14 | 154 | 2,285 | 26 |
| views_unittests | unit | 0 | 0 | 0 | 307 | 673 | 0 |
| vulkan_swiftshader_blink_web_tests | GUI | 0 | 0 | 0 | 14 | 2,898 | 0 |
| webkit_unit_tests | unit | 11,959 | 528,703 | 4 | 75 | 10,350 | 4 |
| wm_unittests | unit | 0 | 0 | 0 | 59 | 298 | 0 |
5.3. RQ3: What features are the most significant for Fair?
In this question, we shed light on the main features used by our model to detect legitimate failures and false alerts. To identify these features, we compute the information gain provided by each feature and we sort them accordingly. The information gain is based on the Gini coefficient of the features. Afterwards, we report and analyse the ten features that provide the most informational gain.
5.4. RQ4: How efficient is Fair compared to reruns?
In the Chromium project, the current approach to deal with false alerts is to rerun tests to observe flakiness. In this question, we compare our approach Fair with reruns as a baseline, in terms of execution time required to classify a failure. To perform this comparison, we extract from LuCI:
-
•
The average time required by reruns to identify a failure as a false alert;
-
•
The average time required by reruns to identify a legitimate failure;
Based on these values, we compute the total time required to classify all failures in our dataset and estimate the rerun cost per build. For the costs of Fair, we report the cost of model training and the average time consumed to classify a failure. Thence, we deduce the overall cost for classifying all the failures of our dataset and the average cost of Fair per build.
6. Results
6.1. RQ1: How effective is Fair at identifying legitimate failures?
Table 5 presents the precision, recall, F1-score, and MCC score of Fair when evaluated with different strategies. In this question, we focus on the results for All All, which show the model performances when trained and tested on the whole dataset, regardless of test categories. For the Linux tester, we observe that the model has great performances with an MCC of 95%. Fair detects legitimate failures with a precision of 98% and a recall of 93%. Similar results are observed in the Windows tester, with a precision of 95% and a recall of 92%. Furthermore, the MCC and F1-score are also stable at 94%. Hence, we can conclude that Fair distinguishes accurately legitimate failures from false alerts.
6.2. RQ2: How effective is Fair on different test categories?
The remaining of Table 5 reports the performance of Fair on specific test categories. First, we analyse the results of the cross-category evaluation. This represents the cases where the model is trained using data from different categories but tested on a specific test category, i.e., All GUI, All Integration, and All Unit. The results show that training on a diverse dataset still allows the model to accurately detect legitimate failures from different test categories. GUI and integration tests have the best performances with an MCC score ranging between 87% and 98% in the Linux dataset, and between 91% and 94% in the Windows dataset. Unit tests show slightly lower results with an MCC of 75% for both Linux and Windows datasets. These positive results show that the observations of RQ1 were not solely based on the performances on GUI tests (the predominant category in our datasets), and the model can distinguish legitimate failures for the three test categories.
Secondly, we analyse the results of intra-category evaluation, i.e., GUI GUI, Integration Integration, and Unit Unit. For GUI tests, we observe great performances in the two datasets. The minimum precision and recall are 96% and 93% respectively, and the MCC and F1-score reach 98% in the Linux dataset. These performances decrease slightly for the other two test categories, integration and unit, especially in the Linux dataset. Specifically, for integration tests, Fair has an MCC and F1-score between 78% and 94%, and precision and recall between 76% and 96%. For unit tests, the performances have more variations as MCC and F1-score range between 70% and 84%. The decrease and variation for integration and unit tests are due to the limited number of legitimate failures from this category. In particular, the number of legitimate unit test failures is 18 and 35 in the Linux and Windows datasets respectively. This means that the training sets contain only 14 and 28 legitimate failures (80% of the total number). These limited samples do not allow the model to observe enough examples of the target class (legitimate failures) and hinder its capabilities. However, the overall decent results for all categories and the great results for GUI tests suggest that our approach is capable of detecting legitimate failures from different test categories.
| Dataset | Training strategies | Metrics | Classes | |||||
| Precision | Recall | F1 | MCC | False alerts | Legit failures | Total | ||
| Linux Tests | All All | 98,0% | 93,7% | 95,8% | 95,8% | 182,989 | 1,274 | 184,263 |
| All GUI | 99,6% | 97,4% | 98,4% | 98,4% | 182,989 | 1,274 | 184,263 | |
| All Integration | 78,6% | 97,1% | 86,8% | 87,2% | 182,989 | 1,274 | 184,263 | |
| All Unit | 75,0% | 75,0% | 75,0% | 75,0% | 182,989 | 1,274 | 184,263 | |
| GUI GUI | 99,5% | 97,8% | 98,7% | 98,6% | 137,749 | 1,124 | 138,873 | |
| Integration Integration | 80,0% | 76,9% | 78,4% | 78,3% | 20,746 | 132 | 20,878 | |
| Unit Unit | 100% | 50,0% | 66,7% | 70,7% | 24,490 | 18 | 24,508 | |
| Win10 x64 | All All | 95,8% | 92,9% | 94,4% | 94,4% | 744,545 | 495 | 745,040 |
| All GUI | 93,7% | 95,2% | 94,4% | 94,4% | 744,545 | 495 | 745,040 | |
| All Integration | 93,1% | 90,0% | 91,5% | 91,5% | 744,545 | 495 | 745,040 | |
| All Unit | 100% | 57,1% | 72,7% | 75,6% | 744,545 | 495 | 745,040 | |
| GUI GUI | 96,7% | 93,5% | 95,1% | 95,1% | 189,347 | 310 | 189,657 | |
| Integration Integration | 96,6% | 93,3% | 94,9% | 94,9% | 17,722 | 150 | 17,872 | |
| Unit Unit | 100% | 71,4% | 83,3% | 84,5% | 537,476 | 35 | 537,511 | |
6.3. RQ3: What features are the most significant for Fair?
Table 6 reports the most significant features for our model. Column Gain presents the informational gain provided by each feature and column origin presents their sources. Overall, we observe that the model relies on features from both run properties and artefacts. The run duration is the most important feature with an information gain of 0.06. This confirms the results of our preliminary analysis where legitimate failures showed a tendency of longer run durations than false alerts. Another run property that influences the model is the runTagStatus, with an informational gain of . This property hints at the failure cause like crash, timeout, and failure on exit. From our analysis, we observed that false alerts tend to be more related to timeouts than legitimate failures. Indeed, 15% of false alerts are caused by timeouts, whereas only 4% of legitimate failures are related to timeouts. For features extracted from artefacts, the length of the stack trace, the test source, and the execution command show an important influence on the model. This aligns with previous industrial observations, which indicate that the test length is positively correlated to flakiness (Alshammari et al., 2021). Besides the length, the vocabulary of artefacts plays an important role in the classification, with five features in the list.
| Feature | Gain | Origin |
|---|---|---|
| runDuration | 0.061 | Run properties |
| stackTraceLength | 0.027 | Artefacts |
| elements | 0.019 | Artefacts vocabulary |
| testSourceLength | 0.014 | Artefacts |
| update | 0.012 | Artefacts vocabulary |
| next | 0.011 | Artefacts vocabulary |
| commandLength | 0.010 | Artefacts |
| load | 0.010 | Artefacts vocabulary |
| runTagStatus | 0.010 | Run properties |
| portal | 0.008 | Artefacts vocabulary |
6.4. RQ4: How efficient is Fair compared to reruns?
Table 7 reports the time required by reruns to classify failures. On average, reruns take 2.3 seconds to observe flakiness and confirm that a failure is a false alert, while it takes less than one second to identify a legitimate failure. Reruns require 686 hours to classify all the failures in our dataset of 1,195,179 failures. Considering that these failures come from 2,000 builds, this represents a cost of around 20 minutes per build.
Table 8 reports the time required by Fair to classify failures. Regardless of its type, Fair requires 0.001 milliseconds to classify a failure. Hence, it takes 2.2 seconds to classify all the 1,195,179 failures and consumes on average 1.1 milliseconds per build. In comparison, Fair has a clear edge in terms of efficiency. Using Fair, the individual cost of failure classification goes down from one second to 0.001 milliseconds (900,000 times faster), and the cost per build goes from 20 minutes to 1.1ms.
| False Alerts | Legit Failures | Rerun cost | |||
| Average | #Instances | Average | #Instances | Per build | Total |
| 0.41 seconds | 969,417 | 1.09 seconds | 225,762 | 20 minutes | 686 hours |
| Training | Prediction | Overall cost | ||
| Cost | Average | #Instances | Per build | Total |
| ¡30 minutes | 0.001 milliseconds | 1,195,179 | 1.1 milliseconds | 2.2 seconds |
7. Threats to validity
7.1. External validity
One possible threat to our external validity is the generalizability to other software development infrastructures. We rely solely on data from the Chromium project, which has a specific organization with a continuous integration setup that may not generalize to other software projects. Thus, some of the features used in this study (e.g., run tag status) may be difficult to obtain, impacting the model performances. We encourage future studies to investigate other dynamic features and testing artefacts to further investigate their usability in discerning false alerts. Another threat to the generalizability is the variety of test categories. To the best of our knowledge, this is the first study on false alert detection that considers multiple test categories. Nonetheless, as our categories are limited to GUI, integration, and unit tests, investigations are yet to be done to check if results hold for other categories of tests. Finally, the choice of programming languages and testing environments may also affect the validity of our results. We perform our experiments on two builders responsible for running test suites on two different operating systems and the analyzed tests are written in different programming languages. Yet, to get better insights on the approach’s efficiency and effectiveness, we encourage investigations on different configurations.
7.2. Construct validity
A potential threat to our study’s validity is the definitions of legitimate failures. We build our dataset from the Chromium CI, which relies on reruns to classify failures. Consequently, the validity of our results may be hindered by misclassifications present in the CI. To alleviate this threat, we performed a thorough cleaning step before using the data collected from LuCI. In particular, we excluded failures that occur in a period where most of the test suite was failing for 15 consecutive builds in Linux and 9 builds in Windows. Additionally, we excluded failures that were deemed unreliable based on their history. This allowed us to filter out 0.13% of our initial dataset.
8. Related Work
Flakiness is a well-known issue in Software Testing but research studies on this topic have only gained momentum in the past few years. Luo et al. (Luo et al., 2014) conducted the first empirical study on the root causes of flakiness. They analyzed commit fixes from 51 open-source projects and created the first taxonomy of flaky tests. Later on, several similar studies followed with different settings. Lam et al. (Lam et al., 2019a) conducted a study on flaky tests at Microsoft to identify and understand root causes of flaky tests. They presented RootFinder, a framework that helps to debug flaky tests using logs and time differences in their passing and failing runs. Romano et al. (Romano et al., 2021) focused their analysis on User Interface (UI) based tests. They showcased flakiness root causes for UI tests and highlighted the conditions needed to fix them. In the same vein, Gruber et al. (Gruber et al., 2021) presented a large empirical analysis of more than 20,000 Python projects. They found test order-dependency and infrastructure to be among the top reasons for flakiness in those projects.
In addition to empirical analyses, tools have been introduced by researchers to help debugging, reproducing, and understanding flaky tests. Notably, DeFlaker (Bell et al., 2018) detects flaky tests across commits, without performing any reruns, by checking for inconsistencies in test outcomes. More focused on test order-dependency, iDFlakies (Lam et al., 2019b) detects flaky tests by rerunning test suites in various orders. To increase the chances of observing flakiness, Vysali et al. (Vaidhyam Subramanian et al., 2020) introduced Shaker, a technique that relies on stress testing while rerunning potential flaky tests. As for fixing tools, Shi et al. (Shi et al., 2019) proposed iFixFlakies, a framework that recommends patches based on helpers present in other tests to automatically fix order-dependent flaky tests.
While they remain scarce, the recent publication of datasets of flaky tests (Bell et al., 2018; Lam et al., 2019b; Gruber et al., 2021) enabled new lines of work. Prediction models were suggested to differentiate flaky tests from non-flaky tests. King et al. (King et al., 2018) presented an approach that leverages Bayesian networks to classify and predict flaky tests based on code metrics. Pinto et al. (Pinto et al., 2020) used a bag of words representation of each test to train a model able to recognize flaky tests based on the vocabulary from the test code. This line of work has gained a lot of momentum lately as models achieved higher performances. Several works were carried out to replicate those studies and ensure their validity in different contexts (Haben et al., 2021; Camara et al., 2021). More recently, FlakeFlagger (Alshammari et al., 2021) has been introduced as another model using an extended set of features retrieved from the code under test and test smells. Compared to FlakeFlagger, our approach uses a more lightweight set of features that are easily accessible after test executions, without the requirements of computation overhead — e.g., the requirement of code coverage. Moreover, compared to the existing works which distinguish flaky tests from non-flaky tests, Fair focuses on test executions and discerns legitimate failures from flaky ones.
Closer to our work, Herzig et al. (Herzig and Nagappan, 2015) used association rules to identify false alert patterns in the specific case of system and integration tests that contain steps. They evaluated their approach during the development of Windows 8.1 and Microsoft Dynamics AX. They achieved a precision between 85% and 90% at detecting false testing alerts but had a low recall between 34% and 48%. In our work, we cover a more varied set of tests, i.e., GUI, integration, and unit tests. Besides, we investigate a new set of dynamic properties (run properties and artefacts) that allow us to reach better performances (precision between 96% and 88% and a recall around 93%).
In an industrial context, Kowalczyk et al. (Kowalczyk et al., 2020) implemented a flakiness scoring service at Apple. Their model quantifies the level of flakiness based on their historical flip rate and entropy (i.e., changes in test outcomes across different revisions). Their goal was to identify and rank flaky tests to monitor and detect trends in flakiness. They were able to reduce flakiness by 44% with less than 1% loss in fault detection. In their assessment of test transitions, Leong et al. (Leong et al., 2019) showed that flakiness can impact regression testing techniques. In particular, they showed that the strategy of transition-based prioritization, which reruns failing tests first, performs poorly because it automatically prioritizes flaky tests. These findings highlighted the need for testing solutions that take flakiness into consideration.
9. Conclusion
This paper addresses the rising issue of false testing alerts that mislead software developers and hinder the flow of continuous integration. Our objective is to propose an approach for discerning legitimate failures from the lots of false alerts with high effectiveness and efficiency. Therefore, we proposed Fair, a novel approach for failure classification using a lightweight set of features easily retrievable at runtime containing both dynamic properties (e.g., run duration, run status, and logs) and static properties (e.g., test source and command). To build and evaluate our approach, we relied on the continuous integration of the Chromium CI project. We collected test failures over a period of 1½ month and analyzed over 1 million test failures. Our analysis shows that Fair can accurately detect legitimate failures even when considering different categories of tests: GUI, integration, and unit tests. The distinction between false alerts and legitimate failures capitalizes on failure properties like run duration and status but also uses the accompanying artefacts and spots keywords that are linked to flaky behaviour. Finally, we assessed the cost of Fair as an alternative to reruns for identifying legitimate failures. Once having a trained model — which took about four minutes in our case — Fair only requires 1 millisecond per build while reruns require 20 minutes. To facilitate the reuse of our dataset and the replication of our study, we provide a comprehensive package including the used data and scripts333https://github.com/GuillaumeHaben/FAIR-ReplicationPackage.
Acknowledgements.
This work is supported by the Facebook 2019 Testing and Verification research awards and PayPal.References
- (1)
- Alshammari et al. (2021) Abdulrahman Alshammari, Christopher Morris, Michael Hilton, and Jonathan Bell. 2021. Flakeflagger: Predicting flakiness without rerunning tests. In 2021 IEEE/ACM 43rd International Conference on Software Engineering (ICSE). IEEE, 1572–1584.
- Bell et al. (2018) Jonathan Bell, Owolabi Legunsen, Michael Hilton, Lamyaa Eloussi, Tifany Yung, and Darko Marinov. 2018. DeFlaker: Automatically Detecting Flaky Tests. In Proceedings of the 40th International Conference on Software Engineering - ICSE ’18. ACM Press, New York, New York, USA, 433–444. https://doi.org/10.1145/3180155.3180164
- Bergstra and Bengio (2012) James Bergstra and Yoshua Bengio. 2012. Random search for hyper-parameter optimization. Journal of machine learning research 13, 2 (2012).
- Camara et al. (2021) B. Camara, M. Silva, A. T. Endo, and S. Vergilio. 2021. What is the Vocabulary of Flaky Tests? An Extended Replication. In 2021 2021 IEEE/ACM 29th International Conference on Program Comprehension (ICPC) (ICPC). IEEE Computer Society, Los Alamitos, CA, USA, 444–454. https://doi.org/10.1109/ICPC52881.2021.00052
- Chicco and Jurman (2020) Davide Chicco and Giuseppe Jurman. 2020. The advantages of the Matthews correlation coefficient (MCC) over F1 score and accuracy in binary classification evaluation. BMC genomics 21, 1 (2020), 1–13.
- contributors (2021) Chromium contributors. 2021. The Chromium Projects. https://www.chromium.org/. (Accessed on 08/17/2021).
- Davis and Goadrich (2006) Jesse Davis and Mark Goadrich. 2006. The Relationship between Precision-Recall and ROC Curves. In Proceedings of the 23rd International Conference on Machine Learning (Pittsburgh, Pennsylvania, USA) (ICML ’06). Association for Computing Machinery, New York, NY, USA, 233–240. https://doi.org/10.1145/1143844.1143874
- Dutta et al. (2020) Saikat Dutta, August Shi, Rutvik Choudhary, Zhekun Zhang, Aryaman Jain, and Sasa Misailovic. 2020. Detecting flaky tests in probabilistic and machine learning applications. ISSTA 2020 - Proceedings of the 29th ACM SIGSOFT International Symposium on Software Testing and Analysis (2020), 211–224. https://doi.org/10.1145/3395363.3397366
- Eck et al. (2019) Moritz Eck, Marco Castelluccio, Fabio Palomba, and Alberto Bacchelli. 2019. Understanding Flaky Tests: The Developer’s Perspective. arXiv (2019), 830–840.
- Goldberg (2017) Yoav Goldberg. 2017. Neural network methods for natural language processing. Synthesis lectures on human language technologies 10, 1 (2017), 1–309.
- Gruber et al. (2021) Martin Gruber, Stephan Lukasczyk, Florian Krois, and Gordon Fraser. 2021. An Empirical Study of Flaky Tests in Python. Proceedings - 2021 IEEE 14th International Conference on Software Testing, Verification and Validation, ICST 2021 (2021), 148–158. https://doi.org/10.1109/ICST49551.2021.00026
- Haben et al. (2021) Guillaume Haben, Sarra Habchi, Mike Papadakis, Maxime Cordy, and Yves Le Traon. 2021. A Replication Study on the Usability of Code Vocabulary in Predicting Flaky Tests. Proceedings of the International Conference on Mining Software Repositories (MSR) (2021).
- Herzig and Nagappan (2015) Kim Herzig and Nachiappan Nagappan. 2015. Empirically Detecting False Test Alarms Using Association Rules. Proceedings - International Conference on Software Engineering 2 (2015), 39–48. https://doi.org/10.1109/ICSE.2015.133
- King et al. (2018) Tariq M King, Dionny Santiago, Justin Phillips, and Peter J Clarke. 2018. Towards a Bayesian Network Model for Predicting Flaky Automated Tests. 2018 IEEE International Conference on Software Quality, Reliability and Security Companion (QRS-C) (2018), 100–107. https://doi.org/10.1109/QRS-C.2018.00031
- Kowalczyk et al. (2020) Emily Kowalczyk, Karan Nair, Zebao Gao, Leo Silberstein, Teng Long, and Atif Memon. 2020. Modeling and Ranking Flaky Tests at Apple. In Proceedings of the ACM/IEEE 42nd International Conference on Software Engineering: Software Engineering in Practice (Seoul, South Korea) (ICSE-SEIP ’20). Association for Computing Machinery, New York, NY, USA, 110–119. https://doi.org/10.1145/3377813.3381370
- Lam et al. (2019a) Wing Lam, Patrice Godefroid, Suman Nath, Anirudh Santhiar, and Suresh Thummalapenta. 2019a. Root Causing Flaky Tests in a Large-Scale Industrial Setting. In Proceedings ofthe 28th ACM SIGSOFT International Symposium on Software Testing and Analysis (ISSTA ’19). ACM Press, Beijing, China, 101–111. https://doi.org/10.1145/3293882.3330570
- Lam et al. (2019b) Wing Lam, Reed Oei, August Shi, Darko Marinov, and Tao Xie. 2019b. IDFlakies: A framework for detecting and partially classifying flaky tests. Proceedings - 2019 IEEE 12th International Conference on Software Testing, Verification and Validation, ICST 2019 (2019), 312–322. https://doi.org/10.1109/ICST.2019.00038
- Lam et al. (2020) Wing Lam, Stefan Winter, Anjiang Wei, Tao Xie, Darko Marinov, and Jonathan Bell. 2020. A large-scale longitudinal study of flaky tests. Proceedings of the ACM on Programming Languages 4, OOPSLA (2020), 1–29. https://doi.org/10.1145/3428270
- Leong et al. (2019) Claire Leong, Abhayendra Singh, Mike Papadakis, Yves Le Traon, and John Micco. 2019. Assessing transition-based test selection algorithms at Google. In Proceedings of the 41st International Conference on Software Engineering: Software Engineering in Practice, ICSE (SEIP) 2019, Montreal, QC, Canada, May 25-31, 2019, Helen Sharp and Mike Whalen (Eds.). IEEE / ACM, 101–110. https://doi.org/10.1109/ICSE-SEIP.2019.00019
- Luo et al. (2014) Qingzhou Luo, Farah Hariri, Lamyaa Eloussi, and Darko Marinov. 2014. An empirical analysis of flaky tests. In Proceedings of the ACM SIGSOFT Symposium on the Foundations of Software Engineering, Vol. 16-21-November-2014. Association for Computing Machinery, 643–653. https://doi.org/10.1145/2635868.2635920
- Micco (2017) John Micco. 2017. The State of Continuous Integration Testing Google.
- Palmer (2019) Jason Palmer. 2019. Test Flakiness – Methods for identifying and dealing with flaky tests : Spotify Engineering. https://engineering.atspotify.com/2019/11/18/test-flakiness-methods-for-identifying-and-dealing-with-flaky-tests/. (Accessed on 01/12/2021).
- Pinto et al. (2020) Gustavo Pinto, Breno Miranda, Supun Dissanayake, Marcelo D’Amorim, Christoph Treude, and Antonia Bertolino. 2020. What is the Vocabulary of Flaky Tests? Proceedings - 2020 IEEE/ACM 17th International Conference on Mining Software Repositories, MSR 2020 (2020), 492–502. https://doi.org/10.1145/3379597.3387482
- Rahman and Rigby (2018) M. Tajmilur Rahman and Peter C. Rigby. 2018. The impact of failing, flaky, and high failure tests on the number of crash reports associated with firefox builds. ESEC/FSE 2018 - Proceedings of the 2018 26th ACM Joint Meeting on European Software Engineering Conference and Symposium on the Foundations of Software Engineering (2018), 857–862. https://doi.org/10.1145/3236024.3275529
- Rehkopf ([n.d.]) Max Rehkopf. [n.d.]. What is Continuous Integration — Atlassian. https://www.atlassian.com/continuous-delivery/continuous-integration. (Accessed on 01/12/2021).
- Romano et al. (2021) Alan Romano, Zihe Song, Sampath Grandhi, Wei Yang, and Weihang Wang. 2021. An Empirical Analysis of UI-based Flaky Tests. In 2021 IEEE/ACM 43rd International Conference on Software Engineering (ICSE). IEEE, 1585–1597.
- Shi et al. (2019) August Shi, Wing Lam, Reed Oei, Tao Xie, and Darko Marinov. 2019. iFixFlakies : A Framework for Automatically Fixing Order-Dependent Flaky Tests. In 27th ACM Joint European Software Engineering Conference and Symposium on the Foundations ofSoftware Engineering (ESEC/FSE ’19). https://doi.org/10.1145/3338906.3338925
- team (2021) The Chromium Development team. 2021. chromium/chromium: The official GitHub mirror of the Chromium source. https://github.com/chromium/chromium. (Accessed on 07/06/2021).
- Thorve et al. (2018) Swapna Thorve, Chandani Sreshtha, and Na Meng. 2018. An empirical study of flaky tests in android apps. Proceedings - 2018 IEEE International Conference on Software Maintenance and Evolution, ICSME 2018 (2018), 534–538. https://doi.org/10.1109/ICSME.2018.00062
- Vaidhyam Subramanian et al. (2020) Shivashree Vysali Vaidhyam Subramanian, Shane McIntosh, and Bram Adams. 2020. Quantifying, Characterizing, and Mitigating Flakily Covered Program Elements. IEEE Transactions on Software Engineering (2020), 1–1. https://doi.org/10.1109/TSE.2020.3010045