Coincidence Complex Networks
Abstract
Complex networks, which are the main subject of network science, have been wide and extensively adopted for representing, characterizing, and modeling an ample range of structures and phenomena from both theoretical and applied perspectives. The present work describes the application of the recently introduced real-valued Jaccard and coincidence similarity indices for building complex networks from datasets. More specifically, two nodes are linked whenever their similarity is greater than a given threshold. Weighted networks can also be obtained by taking the similarity indices as weights. It is shown that the proposed approach allows substantially enhanced performance when compared to cosine distance-based approaches, yielding a detailed description of the specific patterns of connectivity between the nodes. The impressive ability of the proposed methodology to emphasize the modular structure of networks is also illustrated with respect to the iris dataset and C. elegans neuronal network connectivity data with remarkable results. The reported methodology and results pave the way to a significant number of possible theoretical and applied developments.
‘Invisibly linked, the universe realizes its complexity.’
LdaFC
1 Introduction
Though relatively recent, the area of network science (e.g. [1, 2, 3, 4]) has established itself not only from the perspective of theoretical contributions, but also as a consequence of its ample range of applications to the most diverse areas and problems [4]. Basically, a complex network is a graph presenting structure significantly distinct from simpler, more regular, counterparts as far as a relatively comprehensive set of respective topological characteristics are concerned [5].
The ability of complex networks, which constitutes network science’s main object of study, to represent virtually every discrete systems has contributed significantly to the success of this area. This has allowed, among many other results, complex networks to be employed to represent several complex structures including but by no means being limited to the Internet and WWW, transportation systems including highways and airports, the structure of cities, protein interaction, social and scientific networks, as well as signals and images.
The representation of a structure or system as a complex network demands the adoption of some approach for defining the network nodes, and then the application of some objective criterion for linking these nodes. Actually, there seems to be intrinsic complementary relationships between connectivity, similarities and features [6].
Given that the linking of two nodes is typically expected to reflect their shared properties, similarity-based criteria for deriving respective networks represent a suitable choice. Often employed approaches include the consideration of some similarity measurement such as the cosine similarity, and to a lesser extent the adoption of set-based alternatives, such as the Jaccard index, which has been employed almost exclusively in cases involving binary or categorical data.
Indeed, the choice of the similarity measurement to be employed depends intrinsically on the nature of the data respective to the system to be represented. In case of categorical data, approaches such as the Jaccard index provide an interesting choice. On the other hand, in case the data involves integer or real-valued quantities, numeric indices such as the cosine similarity have been frequently employed.
More recently, the Jaccard index has been generalized to real-valued data [7, 8, 9] through a multiset-based approach (e.g. [10, 11, 12, 13, 14, 15]). Though a version of the Jaccard similarity index adapted for multisets has been considered for some time, it was not able to take into account the more general data taking real, possibly negative data values. This further generalized version of the Jaccard index has been called the real-valued Jaccard similarity index. Observe that the ability to operate on negative values is often required in cases where the data has been normalized, e.g. through standardization.
In addition, the classic Jaccard index has been shown not to be able to take into account the relative interiority of the two compared sets, which motivated the proposal [7, 16] of the coincidence index, which has been understood as the product of the interiority (or homogeneity) and real-valued Jaccard indices.
Recent results [7, 16, 17] have indicated that product-based similarity indices, which include both the cosine similarity and Pearson correlation coefficient, tend to be relatively more tolerant regarding similarity quantification than non-bilinear indices based on combination of the minimum and maximum operations, such as the Jaccard index. In other words, bilinear product based similarity approaches tend to yield relatively high values for visibly little correlated data [7]. Actually, it has been shown [16] that all these similarity approaches are ultimately related to the Kronecker’s delta function, which can be understood as the prototypical approach to quantifying the similarity between two values, though in a quite strict manner.
Therefore, the real-valued Jaccard and coincidence indices, both of which relying on maximum and minimum operations, constitute interesting alternatives to be considered in situations where the cosine, Pearson correlation, and classic Jaccard have been traditionally adopted. In fact, it has been shown [17, 18] that the real-valued Jaccard, and in particular the coincidence indices tend to allow substantially more detailed and selective similarity quantification, being capable of removing secondary, smaller spatial scale noise and structure while emphasizing the coincidence matches in the form of sharp, narrow matching peaks.
Another problem in network science that has been as important, or perhaps more important, than the critical task of transforming datasets into respective networks concerns the issue of, given a network, how to identify its respective modular structure, or communities (e.g. [2]). The particular importance of this problem stems from the fact that several real-world networks of special interest — including the Internet, WWW, and social networks — present a modular organization that is critically important not only for better understanding the structures of these systems, but also because it is known that the network modularity is is capable of strongly influencing several types of dynamics taking place on the respective networks. Though several methods have been proposed for community finding, this problem remains to a great extent open because of the intrinsic difficulties involved. In fact, as with clustering in pattern recognition, the identification of communities that are not originally well-separated represents a particular challenge for the modularity methods. Remarkably, the real-valued Jaccard and coincidence indices-based approach reported in the present work is shown to allow an impressive effect in enhancing the modular structure of existing networks.
The present work aims at studying the potential of the real-valued Jaccard and coincidence similarity indices as the basis for mapping datasets, involving one or more features corresponding to real values, into respective complex networks. The possibility to start with a weighted or unweighted network and then obtain features for each node corresponding to the respective topological properties is also investigated. This network can then be transformed by taking into account the the similarity indices between the respectively obtained topological measurements.
It is shown not only that the proposed method allows an impressive level of detail about the specific interconnecting structure of datasets when represented as suggested here, but also a remarkable ability to emphasizing the network modularity. When applied as a means to transform an existing network into a new representation based on some of the topological property of the nodes, the proposed method was able to emphasize significantly the respective modular structure to the point that even the simplest community finding approaches will succeed in identifying the respective communities.
In order to illustrate the potential of the proposed approach for obtaining detailed information about the data element interrelationships, as well as on the overall data modularity, we apply the representation method to the iris dataset [19], calculating the real-valued Jaccard and coincidence indices between a standardized version of the four original features, with remarkable results. Several other examples of application of the coincidence methodology for transforming generic datasets into respective networks can be found at [20].
In addition, we illustrate that the proposed methodology also provides an effective means for enhancing the modular structure of already existing networks. This possibility is illustrated with respect to the C. elegans data, with impressive results. Actually, these results indicate that the proposed methods not only provide an effective and detailed representation of the data interrelationships, but can also be applied as a valuable resource for community finding respectively to any network.
Though undirected complex networks are henceforth assumed in this work, the reported concepts and methods can be readily extended to directed complex network research.
2 Basic Concepts
A complex network is basically a graph, being therefore composed of nodes or vertices and connections, edges, or links. Complex networks are often represented in terms of the respective adjacency matrices or lists of edges. The former of these possible representations involves using a matrix where a connection from a node to a node implies , with being otherwise enforced.
Given a network represented in terms of its respective adjacency matrix (or other representations as an adjacency list), several respective topological measurements (e.g. [3]) can be obtained, some of which are adopted in the present work and briefly reviewed as follows (e.g. [3]).
The degree of a node corresponds to the respective number of connections established with that node. It can be readily calculated as:
| (1) |
The clustering coefficient or transitivity of a node provides a quantification of how well the neighbors of a node are interconnected, corresponding to real values varying between 0 and 1.
The eccentricity of a network node corresponds to its shortest distance between that node and the farthest other node in the same network.
The page rank (e.g. [21]), used in WWW browsers (Google), this index applies to each network node, but needs to be obtained while taking all the nodes into account. This measurement is related to the principal eigenvalue of the network matrix.
Possibly the most frequently adopted means for quantifying the similarity between network nodes consists of the cosine similarity, which relies on the inner product between two sets and , being expressed as:
| (2) |
In order to avoid biases typically implied by varying magnitudes between the several features, the statistic linear transformation of standardization is frequently adopted prior to similarity quantification. This transformation can be performed as follows:
| (3) |
It can be shown that each of the resulting features will have zero means and unit standard deviation. In addition, most of the feature values become comprised within the interval , though this depends o their respective statistical distributions. Conveniently, the newly obtained variables also become non-dimensional.
Observe that the application of the standardization procedure intrinsically implies that any index or measurement applied to quantify the similarity between data elements will need to be able to cope with negative values, which is not the case of the classic Jaccard index, or even its standard multiset generalization to non-negative values.
3 Real-Valued Jaccard and Coincidence Similarity Indices
The classic Jaccard index [22, 23, 7]) for quantifying the similarity between two sets and can be defined as follows:
| (4) |
where is the cardinality (an non-negative integer number) of set .
A recent generalization [7, 16, 9], henceforth referred to as real-valued Jaccard similarity index, allows to take into account real, possibly negative data values [7, 8, 16]. The real-valued Jaccard similarity index can be expressed as:
| (5) |
where and correspond to the multiplicities of the sets and , , is the combined support of multisets an , , , and is the combined support of the multisets, which generally corresponds to the union of the elements in and .
Observe that, as in [24], the numerator in Equation 5 is capable of taking into account the signs of the two values and . That numerator has also been shown to correspond to the intersection between two real-valued multisets [9]:
| (6) |
required so that , where is the empty multiset.
Another possibility for taking into account the signs is as described in [25]:
| (7) |
which allows only the cases where the signs are aligned (i.e. ) to contribute to the sum in Equation 5. However, the opposite situation in which can be expressed by using the following quantity [16]:
| (8) |
So that we have separated the contributions of the positive and negative sign alignments. These two indices can then be combined as:
| (9) |
where is a parameter controlling the relative weights of the aligned and anti-aligned indices and . It can be verified that, if , we have
| (10) |
Another interesting possibility is to use the index:
| (11) |
which has also been verified to be identical to Equation eq:rvjac.
The classic Jaccard index, as well as its generalization to multisets and real-values, have been shown not be able to take into account the relative interiority of the two sets [7].
When adapted to real values [7, 16] The relative interiority (or overlap e.g. [26]) index between any two multisets can be expressed as:
| (12) |
This measurement, however, does not take into account the intersected region between the two multisets, a property that is effectively reflected in the Jaccard index.
In oder to combine the best features of each of the above two measurements, both of which relating directly to the concept of similarity between two sets, the coincidence index between any two multisets and has been proposed [7, 8] as corresponding to the product of the respective interiority and Jaccard indices. Therefore, we have that the coincidence index between any two sets and can be calculated as:
| (13) |
with .
The coincidence index tends to provide one of the most strict and detailed quantification of the similarity between two mathematical structures, having allowed impressive performance respectively to pattern recognition [17, 18] and hierarchical clustering [27]. In the former case, the coincidence index was shown to be able to yield sharp, narrow peaks indicating the matches between a template and an object signal, while substantially attenuating secondary, small scale noise and otherwise unwanted background structure.
As such, the coincidence index can be understood as a binary operator (in the mathematical sense of taking two arguments) that combines low and high-pass filtering in order to best suit the pattern recognition objectives. This critically important feature is a direct consequence of the non-bilinearity of the operations maximum and minimum which are part of the definition of the coincidence index.
4 Building Coincidence Networks
In this work, we will approach the situation in which a set of data observations, samples, element or individuals, have been priorly characterized in terms of respective measurements or features. This can be organized as a table or matrix where each of the rows corresponds to a data observation, while the columns contain the respective measurements or features , . Experimental data are normally represented and stored in this format.
Given such a table, we aim at obtaining a respective representation as a complex network. The commonly adopted procedure consists of understanding each data element as a node, which links are established based on the similarity (or difference) between the respective features.
Frequently applied methodologies rely direct or indirectly on the cosine distance between the involved features. Here, we adopt the recently introduced real-valued Jaccard and coincidence indices.
The basic methodology proposed in this work therefore consists of: (i) standardizing the original dataset; and (ii) obtaining the pairwise similarities by using the cosine, real-valued Jaccard, or coincidence indices. The adjacency matrix of the resulting network can be taken by thresholding the respective similarity matrix (understood as a weight matrix) by a value . It is also possible to preserve the weights of the thresholded links, resulting in the representation of the original dataset in terms of a respective weight network. The latter approach, which preserves more information about the interrelationship between the original data elements, is henceforth adopted in this work.
5 The Iris Dataset
For simplicity’s sake, we consider the iris dataset (e.g. [19]), which has been extensively considered in pattern recognition and machine learning. This dataset contains 50 samples of each of 3 iris flower species, namely Iris setosa, Iris virginica and Iris versicolor. Each of the data elements is characterized in terms of four respective real-valued features. All the network visualizations presented in this work were obtained by using the Fruchterman-Reingold agorithm (e.g. [28]).
Figure 1 depicts the iris data set considering, for visualization purposes, only the second and third original features. All four real-valued original features are otherwise taken into account henceforth. In addition, in order to avoid effects of the varying magnitudes of the four original measurements, which could therefore bias the network representations, we consider the respectively standardized dataset. In all described cases, the obtained complex network is thresholded for the sake of less cluttered visualization, but the weight values of the remaining nodes are retained.
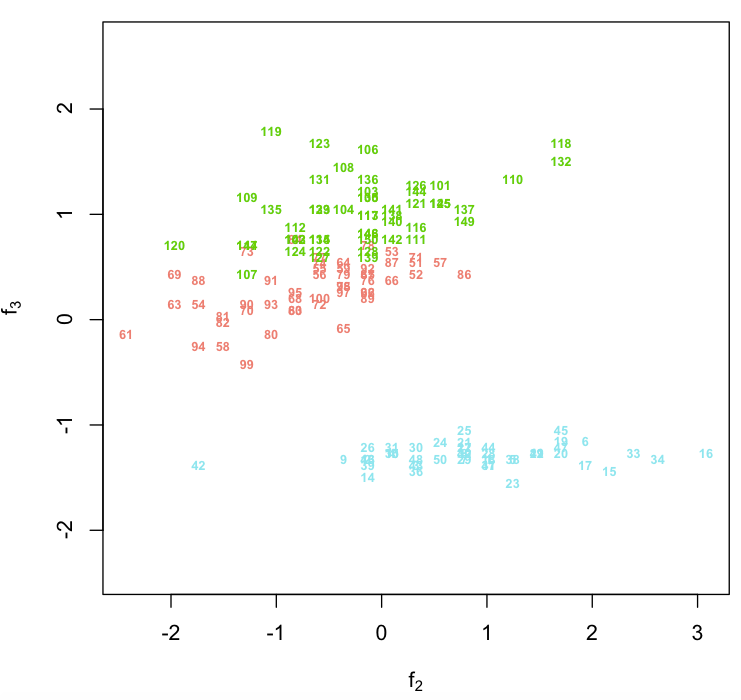
The overall structure of the iris dataset is, however, difficult to be observed as a whole because it involves a four-dimensional space. Nevertheless, we can see from Figure 1 that this dataset contains a well separated cluster (in blue), while the other two groups are adjacent and present overlap. It has been particularly difficult to separate these two clusters in the literature.
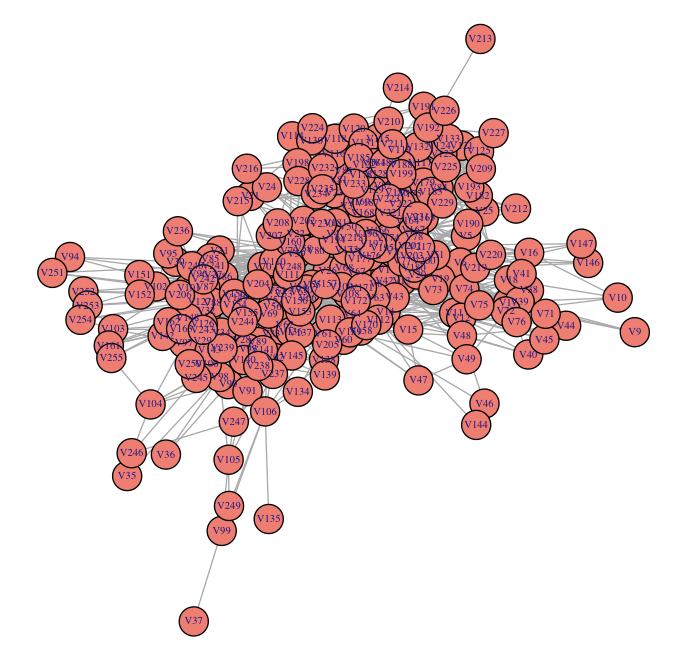
The application of the cosine similarity to obtain a respective complex network resulted in the structure shown in Figure 2 .
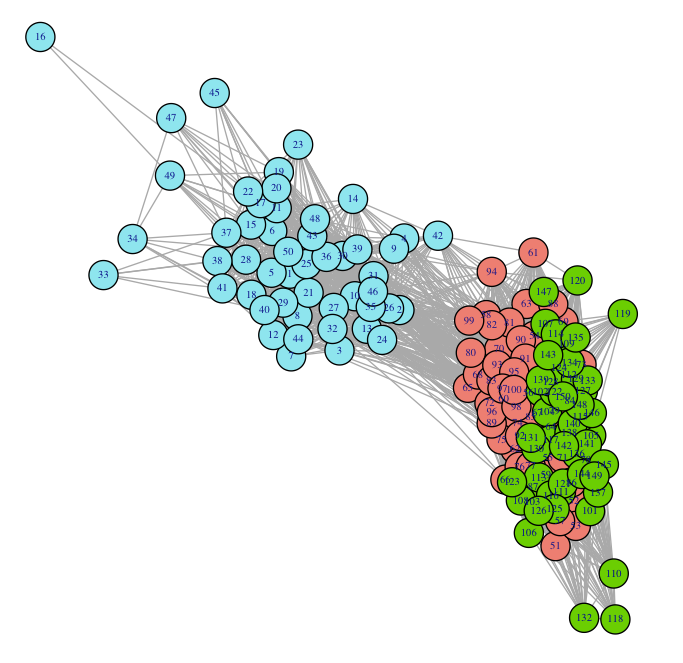
The obtained complex network resembles the relative position and separation of the original dataset as projected onto the second and third original measurements shown in Figure 1, without providing additional information about the specific patterns of interconnectivity. However, a rather generic pattern of interconnectivity is obtained that does not add much to the understanding about the more specific and detailed interrelationship between the original data elements.
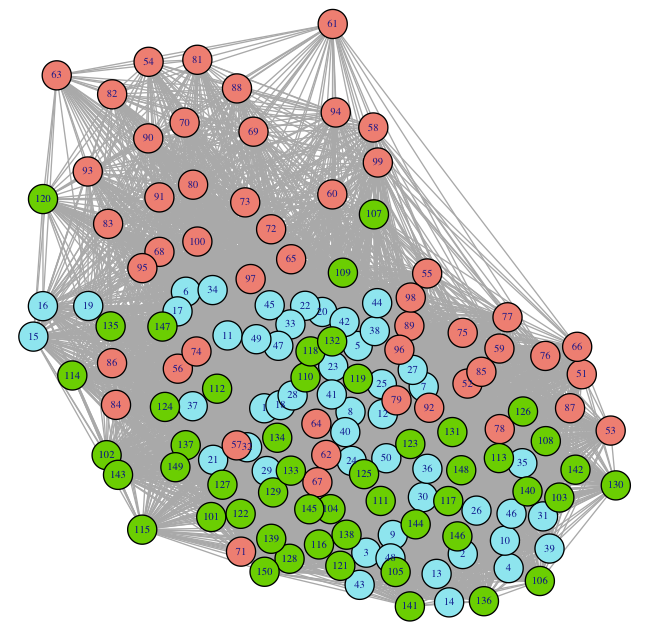
Now, we proceed to applying the recently introduced real-valued Jaccard index to the iris dataset, yielding the result depicted in Figure 3.
This resulting network reveals a surprising separation between the groups. Not only the blue group has coalesced into a very compact community, but a substantial portion of the salmon group has also resulted separated from the other two groups. In addition, this result allows a substantially more detailed and specific representation of the specific patterns of interrelationship between the involved data elements, as well as the underlying modular structure. Observe also that the outliers points in Figure 1 have been duly incorporated at the border of the obtained network.
In a sense, the adoption of the real-valued Jaccard similarity acted almost as a community detection algorithm, strongly emphasizing the respective modular structure and centrality of the nodes.
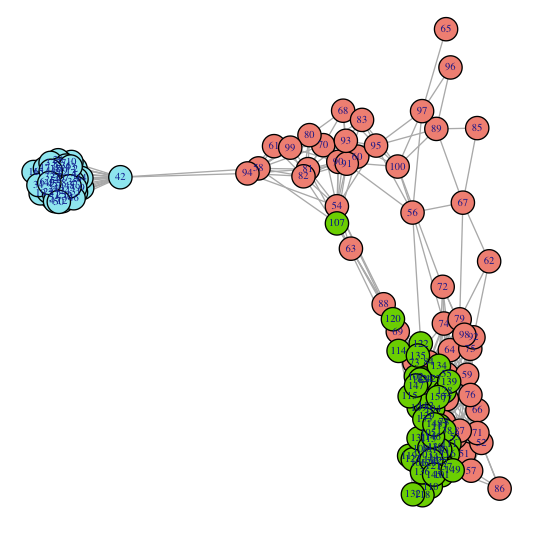
In order to illustrate the interiority similarity, we obtained the respective complex network shown in Figure 4.
This result well illustrates that, despite the effectivity of the interiority index in quantifying the relative interiority of a pair of sets, this index by itself cannot actually provide a more complete picture of the similarity between the several involved data elements.
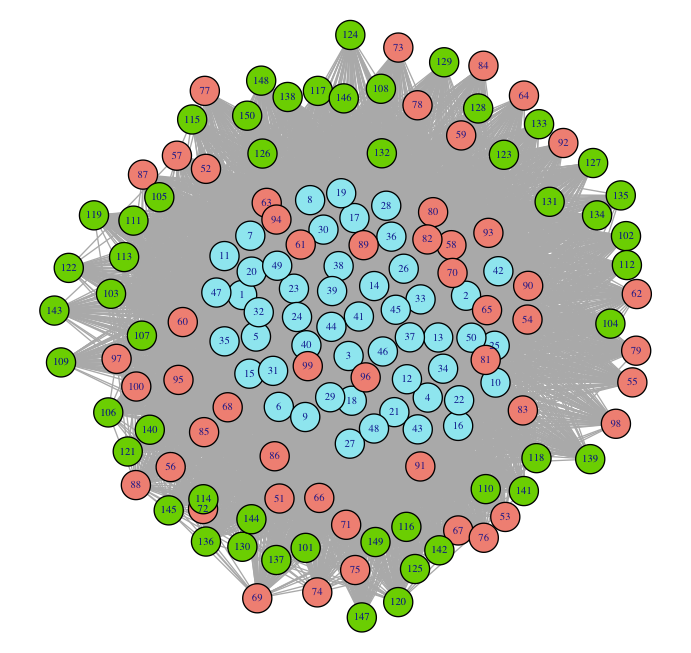
Figure 5 shows the network obtained by adopting the coincidence index with and threshold .
The already identified enhanced discriminative potential of the coincidence index [8, 17] has allowed a network representation of the iris dataset that is even more detailed and structured regarding the interrelationship between the data elements, as well as the overall data modular structure. A particularly detailed network has obtained respectively to , in which not only the blue cluster resulted significantly separated from the others, but some separation can be observed also regarding the green and salmon groups.
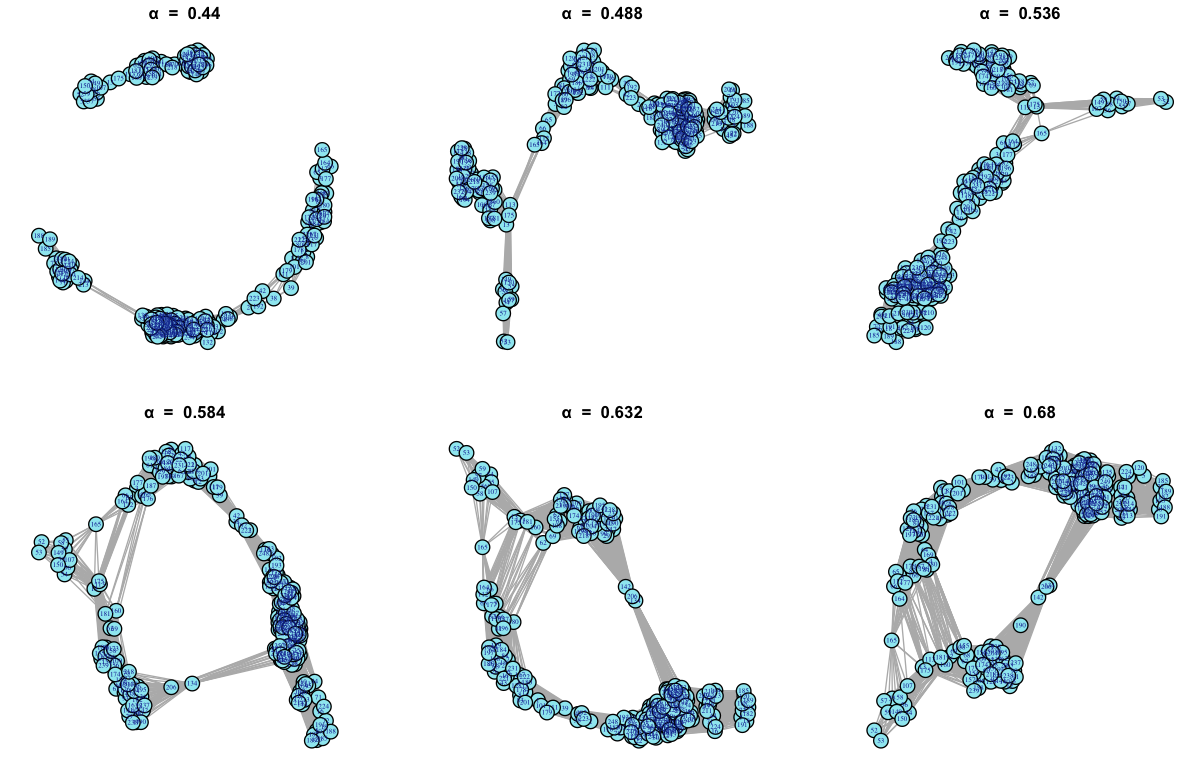
GIven that both the real-valued Jaccard and coincidence indices convey information about the sign of the joint variation of the two multisets, it becomes possible to derive respective complex networks considering only the negative coincidence similarities. In the case of the iris dataset, the obtained network considering only negative coincidence values (i.e. ) is shown in Figure 6.
Interestingly, two hierarchical levels, or modules, have been obtained. The most central one corresponds to the blue group. The other two groups, which are more intertwined and dispersed, resulted in the outer community. The outliers in the original dataset resulted at the border of the obtained network, while the most centra data elements are to be found at the core of the obtained network. This indicates that the negative coincidence network provides an effective method for taking into account the centrality, and outliers, of the data elements.
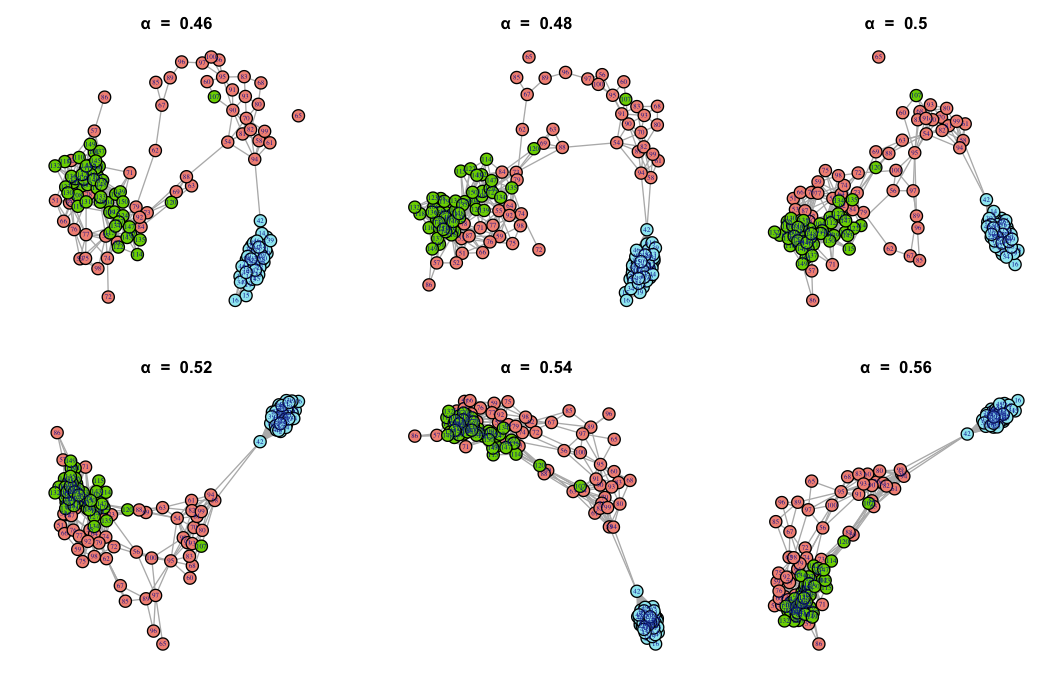
6 Community Finding in the C. elegans Network
Figure 7 illustrates the C. elegans network [29] as visualized from its respective unweighted adjacency matrix.
Instead of representing the network from the data elements features, as was done in the case of the iris dataset, now we apply the proposed representation methodology on four estimated topological measurements of the original network (e.g. [3]) — namely degree, transitivity, page rank, and eccentricity — and considered these measurements as respective features of each node (e.g. [30]).
The resulting representation obtained by using the coincidence index is depicted in Figure 8 for and . Remarkably, well-defined modular structures have been obtained throughout, without need of any community finding methodology. It is of particular interest to observe the effect of the parameter in controlling the overall modularity degree. This examples well-illustrates the potential of the proposed methodology as a simple and effective means for emphasizing and visualliy identifying communities while taking into account only a handful of topological properties of each of the involved nodes.
7 Concluding Remarks
Network science has consolidated itself as an important area, with many theoretical and applied contributions. Much of this success stems from the ability of complex networks to represent virtually every possible discrete structure or system, while continuous counterparts can always be discretized to a given resolution.
One of the enduring challenges in network science concerns how to transform datasets into networks, which often constitutes the very first step while analyzing several types of data. Though product-based measurements such as the cosine similarity have been ubiquitously applied, other measurements based such as the Jaccard index have been mostly constrained to categorical or binary data.
The present work set out at addressing the possibility of using the recently introduced real-valued Jaccard and coincidence indices as the basis for deriving complex network representations of real-valued data, while also encompassing other types of data such as integer and categorical. Actually, an immediate benefit of such an approach constitutes in its being inherently capable of taking into account hybrid datasets involving several types of features, which is allowed by the fact that both the real-valued Jaccard and coincidence index can immediately adapt to these other types of hybrid data.
The results obtained with respect to the well-known iris dataset revealed some remarkable findings. First, we have that the enhanced precision and discrimination potential of the real-valued and Jaccard indices, already observed experimental [17] and theoretically [16], allowed complex networks to be obtained which reveal to a great level of detail the intrinsic relationships between the data elements as well as the overall data modular structure. In other words, the maximum and minimum based similarities (two non-bilinear operations directly related to multisets), provide a markedly more specific and detailed description of the data. Several additional examples of datasets visualized as networks by using the proposed methodology can be found at [20].
In order to illustrate the impressive performance of the proposed methodology for enhancing the modular structure of networks, we applied it to the C. elegans unweighted network. In this case, instead of calculating the similarity indices from the features associated to each data element, we obtained a set of only four topological measurements of the network in order to characterize the connectivity of each node. All resulting networks, obtained for several values of the parameter were markedly modular, adhering surprisingly well with the overall known structure of this model animal.
Comparatively, the cosine similarity-based obtained representation can be understood as a direct translation of the original pairwise distances between the original datasets, without revealing any additional structure or properties of the data elements interrelationship. In a sense, the real-valued Jaccard and coincidence indices action resulted effectively in a particularly useful resource for the particularly challenging problem of community detection. Observe that the choice of the similarity measurement, as well as the frequently adopted standardization will have respective effects on the obtained results. The adoption of these approaches therefore needs to take into account demands and requirements specific to each application. It is also important to recall that data analysis results should be always understood only as hypotheses to be further verified and validated.
All in all, the interesting features provided by the reported methodology include: (i) substantial effectiveness for revealing the pattern of interconnections between the original data elements; (ii) impressive potential for enhancing the modular structure of the original data; (iii) can be applied on datasets involving real-valued, integer, categorical and binary types: (iv) can be applied on topological features derived from the adjacency matrix of data already in network format: (v) is based on non-bilinear operations (including the maximum and minimum) that can substantially attenuated noise and secondary structures (low-pass filtering) simultaneously as the more meaningful structures are enhanced (high-pass filter), an effect that cannot be achieved through the most commonly used bilinear operations such as correlation and cosine similarity: (vi) remarkable conceptual and computational simplicity, relying on the maximum, minimum, sign and division operations; (vii) employs an improved version of the well-known and extensively used (for categorical data) Jaccard index; (viii) incorporates additional verification of the relative interiority between the data; (ix) is founded on a formal framework corresponding to the generalization of multisets to real, possibly negative values; (x) incorporates a parameter allowing the separated control of the contributions of the positive and negative combinations of sign alignments in the original data; (xi) does not involve any matrix operation such as inverse, pseudo-inverse, or even products; (xii) the original features (measurements) remain in their original domain, except for the eventual standardization, not being mapped into other less intuitive spaces; (xiii) can be readily adapted to take into account similarity between three or more data elements [7]; and (xiv) the implemented similarity comparisons can have a probabilistic interpretation given the Jaccard construction and normalization.
The proposed methodology bears significant potential for ample application in complex network research, allowing a unified and effective manner of obtaining representations of the most diverse type of data and features, including cases of mixed types of measurements. Another interesting possibility consists in adopting the other similarity indices proposed in [7], especially the addition-based multiset Jaccard for real-valued data.
Acknowledgments.
Luciano da F. Costa thanks CNPq (grant no. 307085/2018-0) and FAPESP (grant 15/22308-2).
References
- [1] A.L. Barabási and Pósfai M. Network Science. Cambridge University Press, 2016.
- [2] M. Newman. Networks: An introduction. Oxford University Press, 2010.
- [3] L. da F. Costa, F. A. Rodrigues, G. Travieso, and P. R. Villas Boas. Characterization of complex networks: A survey of measurements. Advances in Physics, 56(1):167–242, 2007.
- [4] L. da F. Costa, O.N. Oliveira Jr., G. Travieso, F.A. Rodrigues, P.R. Villas Boas, L. Antiqueira, M.P. Viana, and L.E.C. Rocha. Analyzing and modeling real-world phenomena with complex networks: a survey of applications. Advances in Physics, 60(3):329–412, 2011.
- [5] L. da F. Costa. What is a complex network? https://www.researchgate.net/publication/324312765_What_is_a_Complex_Network_CDT-2, 2018. [Online; accessed 05-May-2019].
- [6] C. H.Comin, T. Peron, F. N. Silva, D. R. Amancio, F. A. Rodrigues, and L. da F. Costa. Complex systems: Features, similarity and connectivity. Physics Reports, 861:1–41, 2020.
- [7] L. da F. Costa. Further generalizations of the Jaccard index. https://www.researchgate.net/publication/355381945_Further_Generalizations_of_the_Jaccard_Index, 2021. [Online; accessed 21-Aug-2021].
- [8] L. da F. Costa. Multisets. https://www.researchgate.net/publication/355437006_Multisets, 2021. [Online; accessed 21-Aug-2021].
- [9] L. da F. Costa. Generalized multiset operations. https://www.researchgate.net/profile/Luciano-Da-F-Costa, 2021. [Online; accessed 10-Nov-2021].
- [10] J. Hein. Discrete Mathematics. Jones & Bartlett Pub., 2003.
- [11] D. E. Knuth. The Art of Computing. Addison Wesley, 1998.
- [12] W. D. Blizard. Multiset theory. Notre Dame Journal of Formal Logic, 30:36—66, 1989.
- [13] W. D. Blizard. The development of multiset theory. Modern Logic, 4:319–352, 1991.
- [14] P. M. Mahalakshmi and P. Thangavelu. Properties of multisets. International Journal of Innovative Technology and Exploring Engineering, 8:1–4, 2019.
- [15] D. Singh, M. Ibrahim, T. Yohana, and J. N. Singh. Complementation in multiset theory. International Mathematical Forum, 38:1877–1884, 2011.
- [16] L. da F. Costa. On similarity. https://www.researchgate.net/publication/355792673_On_Similarity, 2021. [Online; accessed 21-Aug-2021].
- [17] L. da F. Costa. Comparing cross correlation-based similarities. https://www.researchgate.net/publication/355546016_Comparing_Cross_Correlation-Based_Similarities, 2021. [Online; accessed 21-Oct-2021].
- [18] L. da F. Costa. Multiset neurons. https://www.researchgate.net/publication/356042155_Common_Product_Neurons, 2021. [Online; accessed1-Nov-2021].
- [19] Wikipedia. Iris flower data set. https://en.wikipedia.org/wiki/Iris_flower_data_set, 2021. [Online; accessed 30-Oct-2021].
- [20] L. da F. Costa. A caleidoscope of datasets represented as networks by using the coincidence methodology. Researchgate, 2021. https://www.researchgate.net/publication/356392287_A_Caleidoscope_of_Datasets_Represented_as_Networks_by_Using_the_Coincidence_Methodology. [Online; accessed 14-Nov-2021.].
- [21] Wikipedia. Pagerank. https://en.wikipedia.org/wiki/PageRank, 2021. [Online; accessed 30-Oct-2021].
- [22] P. Jaccard. Distribution de la flore alpine dans le bassin des dranses et dans quelques régions voisines. Bulletin de la Société vaudoise des sciences naturelles, 37:241–272, 1901.
- [23] Wikipedia. Jaccard index. https://en.wikipedia.org/wiki/Jaccard_index. [Online; accessed 10-Oct-2021].
- [24] C. E. Akbas, A. Bozkurt, M. T. Arslan, H. Aslanoglu, and A. E. Cetin. L1 norm based multiplication-free cosine similiarity measures for big data analysis. In IEEE Computational Intelligence for Multimedia Understanding (IWCIM), France, Nov. 2014.
- [25] B. Mirkin. Mathematical Classification and Clustering. Kluwer Academic Publisher, Dordrecth, 1996.
- [26] M. K. Vijaymeena and K. Kavitha. A survey on similarity measures in text mining. Machine Learning and Applications, 3(1):19–28, 2016.
- [27] L. da F. Costa. Real-valued jaccard and coincidence based hierarchical clustering. https://www.researchgate.net/publication/355820021_Real-Valued_Jaccard_and_Coincidence_Based_Hierarchical_Clustering, 2021. [Online; accessed 21-Aug-2021].
- [28] T. M. Fruchterman, M. J. Thomas, and E. M. Reingold. Graph drawing by force-directed placement. Software Practice and Experience, 21:1129–1164, 1991.
- [29] S. J. Cook et al. Whole-animal connectomes of both caenorhabditis elegans sexes. Nature, 571:63–71, 2019.
- [30] Z. Huang, X. Zhong, Q. Wang, M. Gong, and X. Ma. Detecting community in attributed networks by dynamically exploring node attributes and topological structure. Knowledge-Based Systems, 196:105760, 2020.